Embed Size (px)
Citation preview
!
PW’UCB Consukmts Limited !
In association with
Wright Engineers Ltd & Golder Associates
DRAFT Report No. 3
Preliminary Report on Hat Creek Openpit NO. 2
Voluhe I
to
British Columbia Hydra and Power Authority

P L
!- I i
CONTENTS
I
- .
.
_-
CHAPTER I INTRODUCTION
Terms of Reference . . . Format _.. . . . . . . Progress to Date . . . Progress Reports . . . Basic Data . . . . . . Acknowledgements . . .
...... ... ... ... ... ... ... ... ... ... ...
CHAPTER II - GEOLOGICAL AND GEOTECHNICAL, ASSESSMENT
Introduction ......... Structure .........
Faulting ......... Folding .........
Materials ......... Superficials ...... Waste ......... Coal .........
Adjacent Areas ...... Geotechnical Implications of
the Geology ......... Further Investigations ...
. .
. .
. .
. .
. .
. .
CHAPTER III - MINE PLANNING
General . . . Structure"' 1:: 1:: . . . Coal Quality . . . Coal Production" ::I . . .
. . .
. . . . . . . . . . . . . . .
. . . . . . . . . . . . . . . . . . . . . . . . . . .
. . .
. . .
. . .
. . .
. . .
. . . Physic&and Chemical Properties Groundwater _.. _.. _._ ,..
Type of Mine ._. _.. . . . . . . . . . Underground Mining . . . .,. . . . Factors Controlling the Design
of a Surface Mine . . . Main Incline ......... Depth Limitation - Reserves Pit Design ......... Development Programme ...
Environmental Aspects ......
CHAPTER IV - MINING OPERATIONS
Introduction ............ Development ............ Diversion of Hat Creek ...... Superficials ............ Volcanics ............ Drilling and Blasting ...... Transport ............ Waste Disposal .........
. . . . . . . . . . . . . . . . . .
. . .
. * .
. . .
. . .
. . .
. . .
. . .
. . .
. . .
. . .
. . .
. . .
. . .
. . .
. . . . . . . . . . . . . . . . . . . . .
. . . .
. . .
. . .
. . . *.. . . . . . . . . . . . .
. . .
. . .
. . .
. . .
. . .
. . .
. . .
. . .
. . .
. . .
. . .
. . .
. . .
. . .
Page
11 13
15 15 15 16 16 16 16 16
16 17 18 18 21 21
22 22 23 23 23 23 24 24

- ii _
CHAPTER IV (continued)
CHAPTER V
j
Mud Flows . . . . . . Drainage and Pumping Equipment . . . . . . Equ'ipment Costs . . . Bucket-Wheel Excavator
Mining Method ._. Transport of Waste Restraints Extraction Rates
Economics . . . . . . .
. .
. . . .
. . .
. . . . . . . . . . . . . . . . . . . . . . . . . . .
Acivantages and Disadvantages of Bucket-Wheel Excavators . . .
SUHFACE PLANT AND COAL PREPARATION
Introduction . . . . . . . . . . . . Mine Power Supply . . . . . . _.. Stockpiling and Recovery Coal Preparation . . . . . . 1::
. . .
. . . . . . . . . . . . . . . . . . f . . . . . .
. . .
. . .
. . .
. . .
. . . Coal Wastiabi~lity Characteristics Birtley Assessment . . . Coal Requirements for Different'
Degrees of Washing . . . . . . Waste Production . . . . . . . . . Moisture Content ._. . . . . . . Miscellaneous Characteristics Trace Elements
Schedule of Equipment 1:: 1::
CHAPTER VI - WASTE AND ASH DISPOSAL
Materials and Quantity . . . .,. Dumps . . . . . . . . . . . . . . . Disposal Areas . . . . . . . . . Waste Transport ..~ . . . . . .
CHAPTER VII - INFRASTRUCTURE AND CIVIL WORKS
Hat Creek Diversion .,. . . .
Road
Object . . . . . . . . . Diversion Alternatives Data . . . . . . . . . Hydrology ,.. . . . Peak Flows . . . . . . Pondage Requirements Selected System . . . Diversion . . . . . . Surface Mine Buildings Road Construction and
Improvement . . . . . . Services _.. . . . . . . Housing . . . . . . . . .
. . .
. . .
. . .
. . . . . . . . . . . . . . . . . .
. . . . . . . . .
Schedule of Equipment . . . ._.
. . .
. . .
. . .
. . . . . . , . .
. . .
. . . . . . . . . . . . . . . . . . . . . . . . . . .
. . . . . . . . . . . .
. . .
. . .
. . .
. . . . . . . . . . . . . . . . . . . . .
. . .
. . . . . . . . . . . . . . . . . .
. . * . . . . . . . . . . . . . :.
. . .
. . . *.. . . .
. , .
. . .
. . .
. . .
. . . . . . . . . . . . . . . . . .
. . .
. . .
. . . . . .
Page /
-1 24 24
2 25 25 25 26 26 26
1 1 1 ]
1 I 1 -I J I' 1 1 1 1 1 1 I 1
27
28 28 29 29 29 32
32 33 33 33 34 34
'35 35 35 37
38 38 38 39 39 39 40 40 41 41
41 41 41 41

_
.
c
.~
<-
.
.
r-
.~.
. .
L_
- iii _
CHAPTER VIII - ECONOZlICS
Basis . . . . . . . . . . . . Capital Costs . . . . . . . . . Direct Operating Costs . . .
Electrical Energy _.. Labour . . . . . . . . .
... ...
... ...
... ...
... ...
... ... Managerial, Technical and
Administrative Staff . . . . . . Total Investment and Capital Charges Production Cost (1975 Prices) -
600-ft Pit . . . . . . . . . . . . . . . Production Cost (1975 Prices) -
1,500-ft Pit . . . . . . . . . . . . Discounted Cash Flow (1975 Prices) Confidence Limits of Estimated
Selling Price Life of Openpit No 2" 1:: 1:: 1::
Production Cost (Inflated) Discounted Cash Flow (Inflatedi'
Opportunity Value of Hat Creek Coal Break-Even Stripping Ratio . . .
CHAPTER IX - SUMMARY AND CONCLUSIONS
General . . . . . . . . . . . . . . . . . . Geological and Geotechnical
Considerations . . . . . . . . . . . . Mine Design . . . . . . . . . .., . . .
Depth . . . . . . . . . . . . . . . Bucket-Wheel Excavator Systems
Environmental Considerations . . . . . . Comparison of Openpit No 1 and 2 . . . Conclusion . . . ,.~ .., . . . . . .
. . .
. . .
. . .
. . .
. . .
. . .
. .
. . .
. . . . . .
. . . . . . . . . . . . . . . . . .
. . .
. . :
. . .
. . .
. . .
. . .
. . .
. . .
Page
42 42 42 43 43
43 43
43
44 44
44 45
4"; 46 46
47
48 48 48 49 49 49 50
Appendix "F"
Appendix "G"
Appendix "H"
Appendix "1"
- iv -
LIST OF APPENDICES
- List of Documents and Drawings received by PD-NCB from 24th February, 1976 to 7th June, 1976
- Analyses of Sample from Borehole No 75-74, Loring Laboratories Ltd
- Examination of Hat Creek Coal, Corex Laboratories Ltd (NCB)
- Labour Requirements
1 I 1 1 I ]
1 c; 3 1 7 L 1 i 1 I 3 I 1 1 1

Table IR
Table XXIX -
Table XXX -
Table XXX1 -
Table XXX11 -
Table XXX111 -
Table XXXIV -
Table XXXV -
Table XXXVI -
Table XXXVII -
Table XXXVIII -
Table XxX1X
Table XL
Table XL1
Table XL11
Table XLIII
Table XLIV
Table XLV
Table XLVI
Table XLVII
Table XLVIII
Table IL
Table L
Table LI
-
-“-
LIST OF TABLES
Basic Planning Data
Openpit No 2 - Volumes, Tonnages and Ratios
Openpit No 2 - Production Schedule
Mobile Mining Equipment Requirements
Schedule of Mobile Mining Equipment - Initial and Replacement Costs
Mobile Equipment - Machine/Activity Costs Expressed as Percentages
Schedule of Typical Equipment
Time Schedule for Superficials Removed by Bucket-Wheel Excavator
Cost of Superficials Removal and Dumping
Cash Flow - Scraper v Bucket-Wheel Excavators
Coal Requirements for Different Degrees of washing
Comparison of Waste Production due to Washing
Schedule of Equipment - Fixed Installations
Mine Waste and Power Station Ash Disposal
Total Dumping Space Available
Dumping Space Available in Dumps 4 and 5
Dumping Space Avai~lable in Dumps I, 5 and 6
Hat Creek Diversion - Estimated Cost
Schedule of Equipment - Infrastructure
Summary of Electrical Energy Costs
Labour Schedule and Payroll Costs
Materials and Fuel Cost Summary
Direct Operating Cost Summary
Depreciation Summary
- vi -
Table LII - Capital Investment, Interest during Construction, Interest and Insurance
Table LIII - Coal Production Cost (Rom) (1975 Prices)
Table LIV - Cash Flow Expenses and Uniform Selling Price (1975 Prices)
Table LV - Coal Production Cost (Ron) (Inflated)
Table LVI - Cash Flow Expenses and Uniform Selling Price (Inflated)
Table LVII - Comparison of Openpit No 1 and 2
1 I; Ii 1; 1 1 -l 4 7 J 1 1 1 I 1 1 3 1 1 1 1 -I
- vii -
LIST OF PLATES
. .
L_
L_
L..
Plates 1 to 14
Plate 15R
Plates 16 to 46
Plate 47
Plate 48
Plate 49
Plate 50
Plate 51
Plate 52
Plate 53
Plate 54
Plate 55
Plate 56
Plate 57
Plate 58
Plate 59
Plate 60
Plate 61
Plate 62
Plate 63
Plate 64
Plate 65
Plate 66
Plate 67
- See Report No 2
- Legend of Symbols used on Geological Plans and Sections
- See Report No 2
- Section 20,000 E
- Section 22,000 E
- Section 24,000 E
- Section 45,000 N
- Section 48,000 N
- Section 51,000 N
- Section 53,500 N
- Section 55,000 N
- Section 57,500 N
- Section 60,000 N
- Section 61,500 N
- Section 63,000 No
- Isopachytes of Superficial Deposits
- Isopachytes of Total Overburden
- Contours at Base of Superficials
- Contours at Base of Volcanics
- Contours at Top of Coal
- Location of Mud Slide Areas and Road Re-Routing
- Diagram of Xining Concepts
- Surface Intercepts of the Stages of Pit Development to 2,000-ft Elevation
- Cumulative Waste Volumes v Cumulative Tonnage of In-Situ Coal (Openpit No 1 and 2)
Plate 68
Plate 69
Plate 70
Plate 71
Plate 72
Plate 73
Plate 74
Plate 75
Plate 76
Plate 77
Plate 78
Plate 79
Plate 80
- viii - / I - Coal Requirements for a 3 x 750-MW 1:
Power Station, Yearly Waste Removal, Yearly Stripping Ratio (Openpit No 1 and 2) 1
Cumulative Coal Requirements for a 3 x 750-hlw Power Station and Cumulative Waste Removal (Openpit No 1 and 2)
Mean Haulage Distances
Sequence of Superficial Removal by Bucket-Wheel Excavator
Cross-Section of Pit Superficials
Diagrammatic Layout of Scheme for Superficial Removal by Bucket-Wheel Excavator
Power Distribution System for Ultimate Pit
Washability Characteristics of Typical Hat Creek Coal
Loring Sample from Borehole No 75-74 Replotted to show Effect of Moisture
Plan of Areas Available for Superficials, Pit Waste and Ash Disposal
Plan of Superficials, Pit Waste and Ash Disposal - Pit to year 2020
Plan of Superficials, Pit Waste and Ash Disposal - 600-ft Pit
Production Cost and Uniform Selling Price
(Contained in Volume II)
J
I, 1 1 1 ]
3 I I 7 -7
-j 1 -I 1 1 I 1

CHAPTER I
INTRODUCTION
1. This report deals with a conceptual mine, "Openpit
No 2", situated in Area 2 of the Hat Creek coal deposits. As
for Openpit No 1, two phases are considered, ie down to the
2,900-ft level (600-ft pit) and subsequently down to the
2,000-ft level (1,500-ft pit). As a result of the higher
elevation of this part of the valley, the floors of these con-
ceptual pits are 500 ft higher in elevation than in Openpit No 1. It must be emphasised that these levels have not been selected
on any firm basis. However, it is considered that the 600-ft
pit is technically feasible whereas the 1,500-ft pit will require
far more knowledge than is available at present to prove the
concept. Unlike Openpit No 1, considerable resources of coal
lie deeper than the bottom of the 1,500-ft pit.
TERMS OF REFERENCE
2. Report No 1 (which is included as Appendix "A" in
Report No 2), gives the full terms of reference. Openpit No 1
is dealt with in Report No 2. This study is intended for com-
parison with Openpit No 1. However, it must be assumed that
both pits will eventually be worked and therefore the conceptual
design of Openpit No 2 takes into account that of Openpit No 1.
In particular, this principle is applied to spoil disposal,
ie spoil will not be dumped within the surface intercepts of
either of the 1,500-ft. conceptual pits.
FORMAT
3. This report follows as closely as possible the format
of Report No 2 so as to facilitate direct comparison as far
as possible. There are clearly many elements common to both
openpits and these are not repeated, attention being directed
to differences. In order to avoid possible confusion, appendices,

-2-
tables and plates have been numbered consecutively with those
in Report No 2, except where revised, when a suffix R has
been added to the original letter or number.
1
1:
1 J PROGRESS TO DATE
4. The draft of Report No 2 (Openpit No 1) was presented 1 in Vancouver in March 1976 both to BC Hydro and the Provincial
Department of Mines and Petroleum. As a result, a number of
corrections and additions have been made and the final version 1 was completed in June 1976.
]
5. On 18th March, 1976, Messrs Brealey and Alexander
visited the Hat Creek valley to examine the mine and spoil 3 disposal sites and particularly to observe thaw conditions.
The drilling programme in Area 2 had been completed. Discussions I took place on the recommendations for further investigation
and test work and it is understood that a further drilling 3
programme and geotechnical investigation may soon be approved.
6. The documentary information received since
23 February, 1976 is listed in Appendix "F". This includes
corrections to the inclined boreholes and also the borehole
water levels recorded by DCA.
PROGRESS REPORTS
? J
-l i
7 -i
7. Monthly Progress Reports No 6, 7 and 8 were submitted 1
on 29th March, 28th April and 3rd June, 1976. 1
BASIC DATA
8. Table I has been revised as Table IR to include
additional assumptions regarding marble and volcanics.
1 J
1
ACKNOWLEDGEMENTS
The continued interest and encouragement of BC Hydro 5
9. 1 is acknowledged with thanks as is also the reception accorded
1 1
r -3-
L
by the British Columbia Department of Mines and Petroleum
Committee under the chairmanship of the Deputy Minister. The
continued co-operation of Dolmage Campbell Associates is also
acknowledged with thanks.
--
r-
.._
.~
. .
r
._
r-
i
r-
L
j -4-
1;
CHAPTER II 1 GEOLOGICAL.AND GEOTECHNICAL ASSESSMENT 1
INTRODUCTION
1. The borehole logs for Area 2 have been re-examined to I
enable the preparation of new plans and sections for conceptual-
mine-.design purposes. All available drilling information has 1 been included and sections have been drawn up in the light of
recent discussions with DCA and BCH. Use has also been made 1 of earlier surface outcrop mapping of marble and the volcanic
rocks. 1 J
2. The drill hole data all dates from 1975 or 1976 but
because of the low drilling density compared with Area 1, the 1
structural interpretation still includes large elements of
conjecture. Plates 47 to 63 are the pertinent geological plans 1 and sections: the amended legend of symbols and abbreviations -J as used in Report No 2 is shown on Plate 15R.
3. In contrast to Area 1, this deposit is long and narrow I with boundary faults appearing to be an even greater constraint
to the limits of the deposit than in the north. 1 STRUCTURE 1 4. The structure is essentially that of a horst-faulted
anticline as shown on the plan on top of coal contours (Plate.63). 1
Faulting
5. As mentioned above, there are appreciable gaps in
prospecting, drilling having been concentrated on E\V lines at
about 2,000-ft intervals. In the absence of frequent marker
horizons, faults have been inferred on the basis of:
- non-systematic changes in coal roof elevation,
- disappearance of coal-bearing strata,
- sheared, broken or gouge-type materials in core.
7 J
7 J
I
I
I
-5-
On these grounds, little evidence is available to calculate the
orientation of certain fault planes and a zero hade*(vertical - fault plane) has sometimes been assumed. The principal faults
appear to be:-
(i) Fault A - A vertical fault plane assumed with a
down-throw to the west, trending NNW-SSE
and comprising the western boundary of
the coal deposit.
(ii) Fault Y - A vertical fault plane assumed with a
possible down-throw to the east, trending
NNW-SSE and converging towards Fault A
in the north. This fault is inferred~
to constitute the eastern boundary of
the coal deposit mainly at the deeper
levels of the 1,500-ft (2,000-ft level)
pit.
(iii) Fault X - A normal fault, down-throwing to the
east and trending NNW-SSE. The hade is
shown as approximately 30° and the fault
plane effectively acts as the boundary
of the coal deposit along much of the
eastern side of the shallower 600-ft
(2,900-ft level) pit. To the south,
this fault lies east of the anticlinal
axis but it runs along or crosses the
fold axis to the north.
(iv) Fault J - An inferred normal fault down-throwing
to the west and trending NW-SE between
faults X and Y.
An additional normal fault down-throwing east may be present
along the western boundary of Area 2, lying just east of
fault A.
/
-6- 1 6. The effect of this faulting is to form a horst between
fault A on the west and faults X and Y on the east, a feature I somewhat emphasised by the apparent anticlinal form of the deposit.
In this respect, the area has some similarities with the horst 1 lying between the Mag fault and fault H in Area 1. It can be
seen from Plate 66 that the main faults in Area 2 when extended I
north lie to the west and south west of Area 1.
7. It is quite possible to interpret the existing data 1 so that additional faults of various sizes are incorporated
and that the hades and directions of fault displacements are 1 changed. It is also possible to infer cross or oblique faults
in Area 2 which run sub-parallel to Dry Lake, Trig and Finney 1 faults. Whilst these possibilities must be recognised, there
is little point in attempting complex structural solutions with 1 the present density of drilling data.
Folding 1
8. As in the northern deposit, extensive areas of 7
/
horizontal or gently inclined strata are not anticipated.
Principal features are:- 1
(i) The basic structure appears to be an anticlinal horst,
so strata dips to the west on the western side of the 1 deposit and somewhat less markedly to the east on the
eastern side. This structure is based on levels at 1 the top of coal.
7
(ii) Dips on the western flank are steep, locally in
excess of 60°. The dips appear to flatten to angles -7 1
of 100 to 300 towards the axis of the anticline
which locally coincides with sub-superficial outcrops. -l
Further east towards and beyond fault X, dips are
towards the east at angles of 15O to 30'. 7 f
(iii) At the southern and northern limits of Area 2, the 7
crest of the anticlinal axis is thought to plunge J beneath deeper cover. A small depression in the crest
of the anticlinal axis also occurs between the two I incrop areas.
-7-
9. Appreciable variations in the inclination of bedding
traces have been recorded within individual boreholes. It is,
therefore, possible that soft sediment structures such as
slumping or compaction faulting are present in addition to
possible diastrophic faulting referred to in para 5 and 6 above.
10. The west-east sections illustrate the above structures
showing conjectural and inferred fault positions, and the
inclination of the top of coal. IVhilst it is possible to explain
the disposition of coal in boreholes by faulting and folding,
the possibility of rapid variations in strata, such as thinning
or changes in sediment character, must not be overlooked.
MATERIALS
11. The overburden is divided as in Report No 2 into
superficials and waste.
Superficials
12. This includes the drift deposits which, as in Area 1,
comprise~glacial tills and moraines and subsequent outwash
materials, lake deposits and soliflucted debris. The super-
ficials are usually thicker than in Area 1, ranging from less
than 50 ft to over 250 ft. To the south east there are small
rockhead outcrops, mainly of volcanic rocks, but the coal is
nowhere exposed as further north, Logs of boreholes show the
superficials to consist of moderately thick units (20 to 50 ft)
of sands, gravels or clay with boulders. No attempt has been
made to examine the spatial distribution of these different
engineering soils. Patterns are apparent in the distribution
of surface materials so that mudslides and alluvial deposits can
be distinguished; similar patterns of till, moraine and outwash
material are to be expected in the thicker, unexposed superficials.
Qsopachytes of total superficial thicknesses have been prepared
(Plate 59) but by virtue of the paucity of drilling are somewhat
conjectural. The following trends are apparent:-
(i) Thinner superficials are present beneath Hat Creek,
on the steeper slopes associated with the volcanic
rocks and at some higher levels above 4,000 ft.
-8-
(ii) Thick superficials lie just east of Hat Creek and
west of the volcanic rocks.
13. Sub-superficial contours intersect coal near the
anticlinal axis to give two elongated areas of incrop as shown
on Plate 61 in the northern and central sections of Area 2.
The more northerly of these areas is the most shallow and hence
the most appropriate access point on the basis of pre-stripping
requirements.
Waste
14. The in situ contiguous strata overlying the coal
appears to be similar to that in Area 1, ie low or very low
strength siltstones and claystones, although one borehole reports
medium strength sandstone near the roof of the coal. Outside
the coal area, but within the excavated slopes, the sedimentary
strata are similarly siltstones and claystones with a lower
proportion of sandstones and conglomerates than in Area 1.
15. Volcanic rocks are present on the east side of the
deposit and locally give rise to a terrace or bench-like
feature, near or just below the 4,000-ft level. Tuffs and
breccias are present probably with some clay-rich horizons;
some of the samples collected from outcrops are of medium strength.
16. The volcanic rocks overlie both siltstones, claystones
and coal. One borehole shows signs of coal burning which may
be related to the volcanism, although only a very small part of
the actual coal area is covered by the tuffs and breccias,
which predominantly overlie the potential eastern slopes.
Contours of the assumed base of volcanic rocks and their dis-
position with respect to the inferred faults are shown on
Plate 62.
17. In the south eastern corner of the conceptual nine
there is a prominent ridge of marble, considerably older and
more indurated than the coal-bearing strata. The approximate
position of the contact between the marble and the younger rocks
is shown on Plates 61 and 62.
!
I: 1 1 I 1 1
1 ]
I 7 J
1 1 -I i ]
1
7
1 I
-9-
18. Plate 60 shows the isopachytes of total overburden
(superficials, waste and volcanics).
L
c
. . .
._
*-
L.
--
Coal
19. The top of coal contours and subdrift outcrop positions
are shown on Plate 63. A detailed study has not been made of
variations in coal quality (notably the ash contents). Given
the present drilling density only very general trends are
apparent and these may not be substantiated by more detailed
infill drilling. Some deterioration of coal towards the west
is shown by a number of boreholes: the ash content of certain
horizons appears to increase as do the size and number of
inter-bedded claystone and siltstone partings. There also may
be a similar southward deterioration. Individual boreholes
often show a moderately low ash content (10% to 25%) near the
top of the coal, a high ash (40% to 50%) mixed coal/mudstone
central section and some reduction of ash content (15% to 40%)
in the lower parts of the coal.
20. The internal correlation of the coal remains difficult: r-
. some correlation is possible on the basis of impersistent
partings such as resin or tuff bands, but widespread diagnostic
features observable in the field have not yet been recorded. .
Palynological studies may have some useful application on the
large scale in assessing the position of major faults or
significant sedimentary variations. No attempt has been made
to show either variations in coal quality or actual correlation
on plans or sections.
ADJACENT AREAS I
21. Plate 66 shows the limits of 600-ft (2,900-ft level)
and 1,500-ft (Z,OOO-ft level) pits in both Areas 1 and 2. Spoil
dumps must be located outside these areas and at present there
is little information on the geology of the surrounding parts
of the valley. The areas considered for dumps are:-
-_ (i) South of Area 2 _------_-----__
Between 20,OOON and 35,OOON coal is present in three
of the seven boreholes drilled in this vicinity,

(ii)
(iii)
(iv)
- 10 -
suggesting a southward extension of faulted anticlinal
structure, albeit with the top of coal at a lower level than in Area 2. With the exception of one borehole, the coal appears to be in mixed and inter-
bedded shaly units and in all cases is relatively
deep, circa 400 to 800 ft. Moreover, the valley
narrows to the south and the coal lies beneath higher
terrain, particularly on the east side of the valley,
further increasing the potential stripping require-
ments and making it less attractive for openpit
mining, and therefore more suitable for waste disposal.
West of Area 2 --------------
Coal has not been intersected in the few boreholes
in this area; indications from geophysical investiga-
tions are that thick coal is either not present or
at considerable depth in a down-faulted trough.
Mudslides are apparently absent hereabouts and this
location could be considered for waste dumps.
North-west of Area 2 __-----_------------
Nothing significant is known of the sub-drift geology
of this area. Conjectural extensions of the structure
from further south suggests that coal, if present,
is likely to be deep. Waste could be dumped here
as was proposed in Report No 2.
North and north-east of Area 2 ------------------------------
A narrow (1,200 to 1,500 ft.) strip of land separates
the two 1,500-ft pits, there being a 7,000 ft gap in
drilling between Areas 1 and 2. It again seems
possible that any coal in this area is deep, but the
controlling structures and sedimentary variations
are not yet understood. An area for dumping along
and east of Ambusten Creek would appear to lie outside
the main potential coal areas and to be away from
the principal mudslides.
I
1 1 1 1 1 1 -? i 7 A
1 I I 1 _d 7 i 7 J 7 ,. 1 I I
- 11 -
r
(v) East of Area 2 --------------
Coal is seemingly absent or beneath a volcanic and
sedimentary cover of several thousand feet. The
increasing elevation and steepening slopes on this
side of the valley render the area unsuitable for
much waste disposal.
GEOTECHNICAL IMPLICATIONS OF THE GEOLOGY
22. The mining implications regarding the above findings
are:-
(i) A 600-ft pit would primarily remove the upper coals,
probably of moderate quality. A 1,500-ft pit might
include a higher proportion of silty mixed coal.
(ii) The segregation of waste during mining will present
similar problems to those likely in Area 1.
(iii) Larger gaps are present in prospecting than in Area 1.
Structures and estimates of volumes cannot, therefore,
be used in conceptual planning with the same degree
of confidence.
(iv) As with Area 1, the diggability and trafficability
of pit materials cannot be fully assessed on available
information.
23. A range of potential slope failures is likely within
the pit. The low strength claystones and siltstones are present
as in Area 1 and a conservative slope of 15O to 16O has again
been used in the conceptual layout for the excavations in both
coal, stratified overburden and superficials.
24. Observations on core by Golder Associates Ltd (GA)
suggest that the claystones and siltstones can be expected to
behave as engineering soils in slopes of significant height, ie
circular-type failures might be anticipated. Simple field

- 12 -
tests indicate compressive strengths of the order of 2,000 to
3,000 psi for the overlying strata.
25. Bench stability with steeper slopes is likely to
be controlled by discontinuities such as faulting or bedding
separation surfaces. In this respect the anticlinal structure
may be considered more favourable than in Area l.since the
dip of the coal and stratified overburden should, in most
places, be cut by the pit slope at an angle of approximately 90°.
26. GA have presented a revised distribution of mudslides
in Area 2. Some of the areas first considered to be mudslides
are now thought to be alluvial fans, and the mudslide/mudflow boundaries have been redefined, slightly enlarged and limited
to the eastern side of Hat Creek (Plate 64). The two principal
slide areas are near Fish Hook Lake and opposite McDonald Creek.
The latter lies entirely within the 600-ft pit, whilst the
former extends into the 1,500-ft curtilage.
2.7 . In the mining proposals for Area 1, all pit slopes
progress gradually outwards except those near the ramp. In
Area 2 the proposals are for progress towards the south with
smaller lateral expansions. Long-term deterioration of the
north-south slopes, therefore, becomes an important consideration
especially as time-dependent movements could prejudice bench
conveyor systems or haulage. If Area 2 is to be worked, this
matter must receive due consideration.
28. No preliminary observations have been made by GA on
the likely strength of the volcanic rocks. Samples collected
in the field are of moderate strength but some core shows signs
of breakdown on exposure, commonly found with such materials.
On the basis that the volcanics may include both very weak and
relatively competent rocks, and .that it does not~appear to have
been incorporated in major faulting, an operating slope angle
of 25O has been used for excavations in volcanics when assessing
volumes etc. Considerably more data are required both to
validate this angle and to assess diggability etc.
1 1 7
j
1 1
1 ] -l J
7
t -rl
1
- 13 -
29. A slope angle of 45' has been assumed for the marble
where encountered in the south east of Area 2. On the basis
of nearby natural slopes, this appears to be a reasonable assump-
tion, but further investigation would be necessary if Area 2
were to be worked south of 50,OOON.
30. In most respects GA consider that the slopes could
not be excavated to steeper angles than those proposed in Area 1.
Similarly, their findings presented in Report No 1 and summarised
in para 16 and 17 of Chapter II, Report No 2 are generally upheld.
31. Observations on water in Area 2 are limited. Packer
tests on borehole 76-118 showed the coal to be impermeable.
Rest water levels in open boreholes in Area 2 indicate water
within 10 or 20 ft of the surface. Several boreholes had
collapsed at, or below, rockhead and these rest water levels,
therefore, probably reflect conditions in the superficials.
More investigations of deep ground water conditions are required.
FURTHER INVESTIGATIONS
32. Even a cursory inspection of Plate 64 showing drilling
progress to February 1976 reveals a low density of drilling in
Area 2. 52 boreholes have been drilled within the limit of
the 600-ft pit; five extra boreholes within the 1,500-ft pit.
This represents one borehole for every 330,000 yd2 (70 acres)
in the 600-ft pit and less than half that density for the deeper
pit. On the basis of potential in-situ tonnage per foot of
borehole in coal, the figures are:-
600-ft pit - approx 90,000 tons/ft of borehole
in coal
1,500-f 't pi .t f borehole - approx 160,000 tons/ft o
in coal
Typical coal
stripping operation - 10,000 tons/ft of borehole in coal
- 14 -
33. Should Area 2 be seriously considered for development,
further drilling is essential to remove doubts regarding the
structure, nature of constituent rocks and superficials and
geotechnical matters, especially groundwater conditions in the
consolidated strata. The spacing of boreholes along existing
section lines is satisfactory in most cases. The section lines
are, however, widely spaced and the existing drilling concentrates
on the coal area with little drilling in the pit slopes. The
following additional drilling would improve the confidence of
geological and geotechnical predictions in a similar fashion
to that suggested in.Rrea l:-
Proposed Drilling
(i) Additional 300-ft boreholes at l,OOO-ft
centres along current WE sections mainly
within the pit slopes
(ii) Additional 600-ft boreholes along WE
section lines at 600-ft intervals NS and
WE
(iii) Additional 300-ft. boreholes within the
pit slopes on the section lines of (ii)
above, with some further allowance for
the siting of spoil dumps
Footage
10,000 ft
70,000 ft
20,000 ft
34. This extra drilling replaces that proposed in Chapter II
of Report No 1 and reduces to 15,000 tons the potential proved
per foot of borehole in coal. As mentioned previously, future
infill drilling need not be all core drilling; much use should
be made of the infill programme for geotechnical purposes. Such
a sizeable prospecting programme could be spread over several
years and adjusted to optimum slopes and depths of working as
these become apparent.
I
I! 1 1 1 1 1 I J ] -j
1 1 1 1 2 1 7 -i 1 1 I
- 15 -
CHAPTER III
MINE PLANNING
GENERAL
1. The same considerations regarding valid mine planning
apply as in the case of Openpit No 1. Area 2 is a much larger deposit than Area 1 and the intensity of exploration to date
is even less. However, the rock types are similar. The extent of the volcanics is greater and the pit would widen out into
the marble on the E side of the valley.
Structure
2. The structural features of the Area 2 deposit are
discussed in Chapter II and illustrated on Plates 15R and 47 to
64 although the locations of the faults are somewhat conjectural.
The limits of the deposit to the N and S are not known although
coal is shown in some boreholes. In the north it is deep and
may well be contiguous at depth with the Area 1 deposit. In
the south, Care will have to be exercised that mineable coal is
not covered with spoil dumps. The deposit is narrower, longer
and deeper than Area 1 and the thickness of overburden is
greater.
3. As in the case of Openpit No 1, the stratigraphy of
the coal i-&elf is not determined and the amount and configuration
of intercalated waste is not known. Therefore, the same assump-
tions have been made as for Openpit No 1.
Coal Quality
4. Coal quality aspects are dealt with in Chapter V and,
owing to the lack of data, similar assumptions have been made
as in the case of Openpit No 1. However, a check analysis has
been carried out and some washability results for one sample
only plotted. Taking these results as typical, the effect of
coal preparation on coal and waste production has been calculated.

- 16 - /
1: Coal Production
5. The same assumptions have been made as in the case of 1: Openpit No 1 as regards the quantity and quality of the rom coal
production, ie:- 1 Annual rom coal production - 13,100,OOO short tons 1 Ash content - 32% (includes waste dilution) Moisture content - 20% I Calorific value - 5,500 Btu/lb
Physical and Chemical Properties 1
6. The same situation applies as for Openpit No 1. 7 f
Groundwater 1 7. The results of logging the standby water level in
some of the boreholes have been received and the conclusions
which can be drawn are discussed in Chapter II. I
TYPE OF MINE 1
Underground Mining 1 8. The preliminary appraisal of the possibilities of
underground mining apply as for Openpit No 1 but the coal is i
deeper and hence the costs would be expected to be greater. .d
However, it is evident that there are considerable resources 7
of deep coal (many of the deep boreholes in fact terminated _J
in coal) and therefore there may be a greater incentive to
develop a feasible underground mining method. The remainder 3
of this report, however, deals with a conceptual surface mine.
1 Factors Controlling the Design of a Surface Mine
J 9. In general, the same geotechnical factors apply as
in the case of Openpit No 1. However, the effect of the
presence of substantial deposits of volcanics and marble on I
the east side of the valley is discussed in Chapter II.
Since these rocks are stronger than the claystones, greater 1 angles of slope can be accepted and therefore the following 7 have been adopted:- -I
- 17 -
r-
c-
r-.
.
-.,.
Volcanics 25'
Marble 450
Other rocks - 15O 57'
10. The conclusions which have been drawn from considera-
tion of the control factors are generally similar to those
applying to Openpit No 1. However, the more elongated shape
of the deposit considerably influences the pit design. It may
well be possible to commence backfilling before the pit is
completely worked out. Also, the much larger quantity of
superficials and the long, straight faces which could be formed
make it possible to reconsider the use of a bucket-wheel excavator
and conveyor system for the excavation and disposal of this
material as an alternative to the scheme adopted for Openpit No 1,
ie scraper operation (see Chapter IV).
Main Incline
11. The reasons for the adoption of a main incline equipped
with conveyors in Openpit No 1 remain valid for Openpit No 2.
Again, the north end of the deposit is the most favourable
location since the cover is least at this point and therefore
excavation is minimised. The amount of coal underlying it
is, however ,, greater than in the case of Openpit No 1, but again
much of this coal could ultimately be recovered. This location
is also favourable as regards those power plant sites which are
at the northern end of the valley. If a site at the southern
end of the valley were to be selected, this location would be
reviewed but even then it seems likely that it would be retained
as opening up at the southern end of the deposit would be much
more expensive due to the thicker overburden.
12. The direction of the incline has been selected so
that it is pointed along the axis of the deposit thereby possibly
avoiding the necessity for conveyor transfer points at the
bottom (due to change of direction). However, the direction
could be adjusted to suit the surface layout if necessary, eg
if the Harry Lake power planet site were selected.

- 18 - I Depth Limitation - Reserves
13. The same policy regarding the depth of the pit has
been adopted as in the case of Openpit No 1, ie a 600-ft pit
has been postulated for detailed examination and a 1,500-ft
pit projected without, however, any commitment as regards its technical and economic feasibility. Owing to the higher
topography, the floors of these pits are at higher elevations
than in the case of Openpit No 1, ie 2,900 ft for the 600-ft pit
and 2,000 ft for the 1,500-ft pit.
14. In this case the reserves of coal within the confines
of the fully developed 600-ft pit are more than adequate for
the 35-year life of the power plant, ie 664 million short tons
(Table XXIX). The 1,500-ft pit is estimated to contain
3,397 million short tons (Table XXIX) and coa~l is known to extend
at least 450 ft below that level as well as laterally.
Pit Design
15. A manual method of designing the pit similar to that
used for Openpit No 1 has been adopted.
16. The steps taken in establishing the design shown on
Plate 66 are as follows:-
(i) Direct the access incline approximately along the
central axis of the deposit, ie towards the centre
of gravity.
(ii) Roughly equalise the waste excavation on the east
and west sides of the initial pit.
(iii) Draw a conical-shaped pit ten-tired on the incline to
a floor elevation of 3,000 ft (Stage 1).
(iv) Extend the pit down the incline and sideways to the
full depth of the 600-ft pit, ie to floor elevation
2,900 ft (Stage 2).
1 I 1 ]
1 J
I 1 I
I
1
3 1
- 19 -
(v) At this point alternative approaches are possible
ie:-
Scheme A - Widen the pit to include most
of the coal above the 2,900-ft
elevation and then extend it to
the south of the deposit.
Scheme B - Maintain a narrow pit, extend it
to the south and then widen out
on the east and west sides to the
limit..
These two schemes are illustrated on Plate 65.
Scheme A is economically less favourable than Scheme B
as it involves the removal of more waste rock at an
earlier date. Also, as it progresses to the south,
static benches would be left behind and these would be
vulnerable to long-term slope failure. This could be
mitigated only by abandoning the northern access
incline (after say 20 years) and developing another
incline further to the south (as shown on Plate 65).
However, this could be turned to advantage as the
abandoned part of the pit could be utilised for spoil
or ash disposal, at the expense, of course, of
abandoning the deeper coal.
Scheme B enables the removal of some of the massive
waste rock on the east and west sides to be deferred
and therefore the cash flow would be more favourable
overall although the economic cut-off would be earlier.
The southern half of the pit could be slowly widened
and the long north-south faces would be kept active
thereby avoiding long-term slope failure. In other
words, the faces would be cleaned up from time to time.
Again it might prove advantageous to abandon the
northern access incline and to open another further
to the south when the bulk of the excavation is in
that area.

- 20 -
(vi) The development of the access incline occurs in
Stage 1 and considerably greater quantities of
overburden have to be removed than in the case of
Openpit No 1. Therefore, the stripping ratio is
greater. The coal excavated during this stage would
again be stockpiled.
(vii) The same method of calculating the instantaneous
stripping ratio has been used as in Report No 2 for
Openpit No 1 (Chapter III, para 23). Table XXIX
gives the volumes of different types of waste rock and
the stripping ratios based on both in-situ and rom
quality coal (compare Table II in Report No 2).
Again the sum total of all the volumes is, of course,
the total volume of the pit up to the stage in question,
that of the coal being the mineable reserves. The "stage stripping ratio" has been used for the economic
calculations which have, therefore, been averaged over
the stage. The instantaneous stripping ratio occurs
at the end of the stage and would be the value to be
used for the calculation of the economic cut-off, ie
the last incremental cut on each bench. (In an
entirely symmetrical operation which expands outwards
uniformly, the stage ratio would clearly be of a
value between the instantaneous ratios at the beginning
and the end of the stage because the instantaneous
ratio would increase uniformly cut by cut. However,
this assymetrical design this is not the case.)
Nine stages are shown for Openpit No 2 (Plate 66),
the first six providing sufficient coal for the power stati
Stages 7 and 8 show the the further development of
the 600-ft pit and Stage 9 shows the 1,500-ft pit.
It will be noted that the total reserves of coal within
this pit are approximately 3,397 million tons rom
compared with 775 million tons for Openpit No 1
(Table II).

- 21 -
r- i
r- c.
,.
r.
Plate 67 shows the cumulative volumes of waste plotted
against the cumulative tonnage of in-situ coal mined
out. The corresponding curves for Openpit No 1 are
shown for comparison.
(viii) Table XXX, Schedule of Production, has been derived
from the schedule of coal production required by the
power station (three 750-MW generators) in the same
way as for Openpit No 1 and Plates 68 and 69 show
the yearly and cumulative coal and waste production
requirements and the yearly stripping ratio (relative
to rom coal). The corresponding curves for Openpit
No 1 are shown for comparison.
Development Programme
17. Assuming the same timetable for the power station,
the same construction schedule for the power station and develop-
ment schedule for the mine apply as for Openpit No 1 (see Plate 23,
Report No 2).
ENVIRONMENTAL ASPECTS
18. As regards environmental aspects, the same considera-
tions apply as for Openpit No 1 but the volumes of waste for
disposal are considerably greater, particularly if an attempt
is to be made to recover most of the coal reserves. Consequently,
the dumps will occupy a greater area. However, unlike Openpit
No 1, there is a possibility of backfilling in the pit before
mining operations cease.altogether. Clearly, if Openpit No 1 ?f
is worked out first, then that volume would be available for
dumping (and vice versa). Openpit No 2 is further up the valley
which is also wider at this point and so the north end of the
valley would be largely unaffected whereas a pit at the north
end of the valley is bound to have a major effect on the valley
as a whole.

- 22 -
CHAPTER IV
MINING OPERATIONS
INTRODUCTION
1. No 2 deposit lies to the south of Openpit No 1 and J
is different in shape having a greater length along the north-
south axis than width over the east-west axis. This has 1
resulted in the different method of opening up and working the
coal in six arbitrarily chosen stages along the length of the I deposit in a southerly direction.
1 2. Because of the thickness of overburden, the develop-
ment rate at the start has had to be greater and because of I
the shape of the deposit and topography of the valley a constant
annual rate of waste removal of 27 million bank yd3 of total
waste is deemed necessary. 1
3. In order to allow direct comparison of the two deposits, j
the machinery used and the type of mining are the same although 7 the quantities and the distances involved in overburden and J
~coal removal are different.
1 4. The difference in shape makes Openpit No 2 more
suitable for a bucket-wheel excavator system to remove super- -? .A
ficials and details of this type of operation are considered
at the end of this chapter. -i _:
5. As the mining operations are similar, this chapter
will only examine areas of difference. I
6. Production schedules are detailed in Table XXX. 1 Equipment required in shown in Table XxX1.
-I DEVELOPMENT
-1
7
7. Stage 1 of the operation is completed before full J production starts in Stage 2. The 2,400-ft elevation,which is
approximately 600 ft below the surface level, is reached at 3
the end of Stage 2.
- 23 -
DIVERSIOK OF HAT CREEK
8. The river is dammed at the southernend of the deposit
and is channelled along the western side of the valley. The
topography permits natural drainage so that pumping from the
reservoir behind the dam is not needed.
SUPERFICIALS
9. These will be removed as described in the report on
Openpit No 1 except that the scrapers will require to climb
grades of up to 15%. This is reflected in the large number of
scrapers needed throughout the removal of superficials.
10. From 1993 onwards, the superficials will be transported
to the south of the ~deposit by disposal conveyors and scrapers
will deliver the superficials to the conveyors. The arrangement
for this conveyor would be similar to that shown on Plate 71
in connection with the bucket-wheel excavator. The loading point
would be outside the area of the proposed 35-year pit.
VOLCANICS
11. From 1992 onwards volcanic rocks occur in the area
of operations to the south east. These will be blasted and
removed by shovel and trucks.
DRILLING ANE BLASTING
12. The coal and pit waste will be drilled and blasted
as in Openpit No 1.
13. The volcanics will be drilled using blast-hole drills
with approximately lo-in diameter holes at an interval of 6 yd.
For calculation purposes, a drilling rate of 30 ft/hour has
been estinmted for this type of dri~l~l in hard volcanic rocks.
This compares with 210 ftjhour for the drilling rate in the
softer waste and coal with 4-in diameter holes and crawler rigs.
A powder factor of 0.6 lb/ton has been used for volcanics.
- 24 -
TRANSPORT
14. Plate 70 shows the mean haulage distance for removal
of the four types of material for 1979/80 until 2019/20. It
shows the reduction in distance for superficials removal by
introducing the south conveyor.
WASTE DISPOSAL
15. This is dealt with in detail in Chapter VI.
16. Plate 64 shows the mud flows in the vicinity of
No 2 deposit. These mud flows are to the east of the deposit
and the total volume assuming a thickness of 48 ft is
81 million bank yd3 of which 37 million bankyd3 are within the area
of the planned pit.
DRAINAGE AND PUMPING
17. The increased size of the pit increases the quantity
of water to be pumped as a result of the annual precipitation
to approximately 2,000 imperial gallons/minute over the year
after Stage 5 has been reached. The installation of adequate
pumping facilities has been included in all estimates of equipment
required.
EQUIPMENT
18. Table XXX1 details the equipment required taking the
actual working period for a machine as 5,000 hours/year. The
capital and replacement costs for all equipment are summarised
for stages and start up years in Table XxX11.
19. The replacement period for machinery is as given in
the report on Openpit No 1 to which should be added:-
(i) Every 20 years - Bucket wheel excavator
(alternative superficial removal
scheme)
1 1 1 1 1
1
1 1 1 1
(ii) Every 10 years - Blast-hole drills 1
- 25 -
. .
Lo.
.
--.
s
- . .
.
c-
_.
P-
L..
L.
L..
EQUIPMENT COSTS
20. In addition to Table XxX11, the allocation of equipment
costs by activity is shown in Table XxX111. Table XXXIV is
a schedule of typical equipment (the manufacturers' names given
do not imply any preference over other makes).
BUCKET-WHEEL EXCAVATOR
21. The use of a bucket-wheel excavator system has been
considered as an alternative to scrapers for the removal of
superficials.
Mining Method
22. The system of excavation involves stripping the
superficials in blocks 2,250 ft wide across the pit starting
from the centre and working outwards. Plate 71 shows the
areas blocked out in sequence and Plate 72 shows the estimated
cross sectional areas of superficials on the sections indicated.
23. Two faces would operate simultaneously working from
the centre outwards on lines parallel to the estimated strike
lines of the base of the superfici.als to produce as far as
.possible a face of even height. Excavation lrould commence at
the estimated volumetric centre so that excavation of the two
sides of the block would be completed in similar times.
Transport of Naste
24. Waste would be removed by a belt-conveyor system
comprising two movable conveyors (one in each bench moving up
with the excavator) delivering on to two cross conveyors sited
on the unworked portion of the pit. These, in turn, would
deliver on to a belt-conveyor system to transport the spoil to
the southern end of the area for disposal by means of a boom
stacker. A diagrammatic ske~tch of the layout is shown on
Plate 73.
25. As each block is excavated, the cross conveyors move
forward and the waste conveyor is shortened by the width of
the block (2,250 ft). The conveyor made available can then be used
- 26 -
to extend the other end of the conveyor as the stacker completes
the spoil benches and moves forward.
Restraints
26. Successful removal of superficials is dependent on
the number and size of boulders that are encountered. Bucket-
wheel excavators cannot handle very hard material or lumps too
large to pass through the buckets and presumably too large to
be carried on the associated conveyor system. Occasional
boulders can be blasted or removed by shovel but large numbers
would interfere with the operation to an extent which would
render it uneconomic.
Extraction Rates
27. It is estimated that an extraction rate for super-
ficials of 20 million bank yd3 a year would enable the mining
programme to be followed. The time schedule is shown on
Table Xyxv.
ECONOMICS
28. The cost of removal is estimated in Table XXXVI.
Two costs are shown, one for removal and dumping as a complete
operation and the other for comparison with scraper operations
in excavating the removal to the pit perimeter only as both
systems rely on the same conveyor system from the perimeter
to the dumping ground.
29. The approximate direct operating cost for scrapers
is Gl$/bank yd3 to the dump or 46#/bank yd3 to the conveyor.
30. Table XXX711 shows a DCF calculation (at 15%) which
compares superficials removal by scrapers and by bucket-wheel
excavators. This shows that bucket-wheel excavators would be
43$/short ton cheaper than scrapers for this work.
7
1 ? -!
1 -i
?
i
- 27 -
ADVANTAGES AND DISADVANTAGES OF BUCKET-WHEEL EXCAVATORS
31. Table XXXVII shows that the initial capital cost of the
DYE system to start-up of production would be approximately
$55 million compared with $34 million for the scraper scheme.
However, operating and maintenance costs for the BWE system
would be less than for the scrapers. In other words the BWE
system loads the costs at the front end.
32. Apart from the reduced operating cost, one of the
main advantages of the BWE system would be the reduction in
labour requirements. In 1980, for example, when the scrapers
are scheduled to remove the same quantity as the BWE, 187 men
would be needed for the scraper operation compared with 52 for
the BWE system.
I
- 28 - I
1, 1~ CHAPTER V
SURFACE PLANT AND COAL PREPARATION
IWTRODUCTION
1. In the absence of a firm decision on the location of
the power station, the surface plant and coal preparation have
been considered to be the same for Openpit No 2 as detailed for
Openpit No 1.
MINE POWER SUPPLY
2. Due to the elongated shape of the mine, power
requirements for transport of materials are higher than for
Openpit No 1. The main incline conveyors are longer than for
Openpit No 1 at the same stage and from 1983, when Stage 2
reaches the pit bottom level, the main incline conveyors require
more power than in Openpit No 1 to cater for the increased
depth and length. As the mine progresses, extra conveyors
are required on the floor of the pit and in addition the waste
disposal system for superficials on the south side requires
extra power because of the conveying distance.
3. There is no requirement for pumping for the Hat Creek
diversion, as the water can flow by gravity round the proposed
Openpit No 2.
4. The mining method calls for electric drills to drill
the volcanics from 1992 onwards as an additional item.
5. The estimated ultimate loading would be about 30 WA.
6. Plate 74 shows in diagrammatic form the proposed
ultimate HV circuit for Openpit No 2. The HV circuit layout and
power requirements would not be affected to any great extent
if the mine access were moved to a position further along the
pit at a later date (see Chapter III), the only major difference
being the possibility of the use of overhead lines for feeding
the conveyors on the surface in lieu of the cables used when
in the pit.
1 1, I I- I 1 1
1 I 1 I 7 i
1 I
- 29 -
STOCKPILING Ai'?D RECOVERY
7. The same layout as proposed for Openpit No 1 has been included. This will require re-assessment when the power station site is finalised.
COAL PREPARATION
8. This has been assumed to be as for Openpit No 1.
However, the results of tests carried out at the NCB Yorkshire Laboratory, UK, have been compared with earlier test results
and the conclusions are given below
Coal Washability Characteristics
9. "Washability" of coal is assessed in the laboratory by float. and sink analysis in liquids of different specific
gravities. It is, strictly speaking, a measure of the
susceptibility of the coal to gravity separation. Heavy medium
processes closely approximate to pure gravity separation whilst
other processes are more influenced by other factors.
10. The washability characteristics of a typical Hat
Creek coal are shown on Plate 75. These are based on two
samples taken from borehole 75-74 which is located in the centre
of the southern part of the No 2 coal deposit (co-ordinates
48,000' N and 24,428' E) (see Plates 51 and 64). The first
sample was taken from footages 1,678 to 1,844 and was analysed
by Loring Laboratories Ltd in October 1975. (Report No 10464,
dated 1st October, 1975 and No 10635, dated 20th October, 1975
(Appendix "G"). ) This was just one of a large number of samples
analysed by them. The second was taken from footages 1,678 to
1,710 and was analysed by the NCB Yorkshire Laboratory, UK in
March 1976 (Appendix "II"). These samples should not be regarded
as statistically "representative" but are "typical" of the
Hat Creek coal. They are, however, considerably better than the rom
quality assumed for this report which can be accounted for by
the absence of any allowance for dilution with waste rock during
mining.
- 30 -
1 11. In view of the number of variables involved, coal
washability characteristics can be plotted in a number of ways.
Plate 75 shows five such plots, all of which have been calculated
on a dry basis, ie:-
(i) Cumulative Floats (Yield) v ~peaIaic-era;r~y-oT-~i~~~~- --------------------------
This plot shows the yield of below-gravity material
(ie coal) which would be obtained when washing in a
bath of liquid maintained at that particular specific
gravity. The "gradual" shape of the curve indicates
that the coal is difficult to wash, ie it contains
substantial amounts of "middlings". An easily-washed coal is characterised by a sharp bend in this curve,
ie at one point on it a small change in specific
gravity results in a large change in yield. (For perfect washability the curve would be L-shaped.)
The plot shows that a somewhat higher yield (cumulative
floats) was obtained in the NCB analysis and this
can be explained by the fact that this sample was
crushed to -4 in whereas the Loring sample was crushed
to -$ in, ie better separation of the heavier and
lighter fractions has been achieved,
(ii) Cumulative Ash in Floats v specIIic-eravi~y-o~-~i~~~~ ------------_-------------
This plot shows the gravity at which the coal would
have to be washed to obtain a given ash content in
the washed product, eg at 1.6 the ash content would
be 15%.
(iii) Cumulative Floats (Yield) v CumuIative-As~-in-Pi~~~~--- ------------__------____
This plot shows the yield which would, theoretically,
be obtained for a given ash content, eg for 15% ash
the yield would be about 70%.
1 1 3
I ]
I 1 1
L.
L.
- 31 -
(iv) Cumulative Floats (Yield) v CumuiaeF~e-~~-ii~-~i~~~~---- ---_--__------_-----___
This plot shows the yield which would be obtained for
a given CV.
(v) Cumulative Ash in Floats v -------- ~umuia~ive-e3-o~-~loats ________-----__-__-----
This plot relates the ash content to the CV of the
product, eg at 15% ash the CV would be 10,500 Btu/lb
(dry basis).
12. The good correspondence of the NCB and Loring curves
(despite the difference in size), serves as a necessary check
on the laboratory methods used.
13. Plate 75 shows the laboratory results of separating
the material at a range of specific gravities and almost perfect
separation can be assumed. Some coal is, however, lost at the
lower gravities because it is intimately associated with ash in
some of the particles. In a commercial plant, however, the
loss of coal would be greater because of the imperfect separation
and the extent of this can only be determined by pilot plant testing of the processes available. Therefore, all the conclusions
drawn from these results are optimistic.
14. Plate 76(a) shows the sample adjusted for a notional
20% moisture and the positions A, B and C of the various coal
qualities assumed. Good correspondence can be seen.
15. The object of washing the coal is, of course, to
increase its calorific value by reducing the ash content and the
washability tests give an indication of the results which could,
theoretically, be achieved and also the amount of material which
would be rejected by the washery. These losses must be compensated
by mining more coal and clearly the disposal of the washery
rejects is a major problem in itself. This is off-set by the
reduction in fly ash. (Incidentally, the enforcement of strict
particulate emission standards may, in the case of high-ash
coals, make some form of beneficiation unavoidable.)

- 32 -
16. Using the washability test results (Loring), the coal
qualities and quantities at different points in the system, ie
in-situ, rom (washery feed) and washed (boiler feed),and the
rejected tonnages have been calculated. It must be emphasised
that these figures err on the optimistic side for the reasons
given above.
Birtley Assessment
17. Birtley Engineering (Canada) Ltd carried out a
preliminary assessment of the washability of some borehole samples
of Hat Creek coal and reported in August 1975 and a comparison
of the results with those given above indicates that the
washability curves are similar but show somewhat higher yields.
It is felt that this report is somewhat optimistic and may under-
estimate the difficulties of coal preparation, the coal losses
resulting and the costs for the following reasons:-
(i) No allowance has been made for dilution of the
rom coal with waste.
(ii) No reference is made to the presence of claystones
which are known to cause considerable difficulty
in a similar setting at Centralia, Washington, USA
(iii) De-sliming would result in loss of fine coal and
considerable difficulty would be encountered in
slimes treatment and disposal.
(iv) As a result of the above, the flow sheet suggested
appears to be too simple.
Coal Requirements for Different Degrees of Washing
18. Chapter III gives the coal qualities and quantities
assumed in this study. Using the same heat input to the power
station, ie 144 x 1O1' Btu per annum, the quantities required
of coals of different calorific values can be approximately
calculated. Table XXXVIII gives the results for boiler feed,
washery feed (ie rom coal) and in-situ coal using the Loring
test results and also the rom coal assumed as the basis of this
1 I I 1 .!
-j
I
I 1 3 ]
1 1 1 1 I 1 J
I- - 33 - L
r-
L.
.
-_
.
r-
.
_-
---
__
report. Plate 76(b) illustrates the effect of various degrees
of washing on the Loring sample. Since these are expressed on
a dry basis, all figures have been adjusted to a notional
20% moisture content. The effect of the moisture and ash on
the boiler thermal efficiency has been ignored.
Waste Production
19. Table XXXIX summarises the resulting waste quantities,
including pit rejects (segregated waste), washery rejects and
boiler ash and it can be seen that washing to 15% ash would
increase the total waste by 33% and to 10% by 128%. This table
is based on the Loring above-average sample and the actual
results could well be 20% worse.
20. These waste totals do not include overburden, the
quantities of which are proportional to the in-situ coal
production. Also there will be a more rapid depletion of reserves
and a further penalty due to earlier advance into higher stripping
ratios.
Moisture Content
21. All this analysis has been based on an assumed moisture
content of 20%. The in-situ moisture content of both coal and
waste is at present unknown. Unless core swnples are hermetically
sealed as soon as they are recovered, they will inevitably
experience loss of moisture prior to .testing. Even immediate
sealing is not without its pitfalls as contact with the drilling
mud affects the moisture content of the core. However, it is
the best that can be done until pitting and bulk sampling is
carried out. It is, therefore, strongly recommended that when
the infill drilling is carried out, selected core samples should
be set aside for this purpose and when bulk samples are being
procured samples should be placed immediately in sealed drums
for moisture determination.
Miscellaneous Characteristics
22. The tests carried 0u.t on the coal illustrate a number
of other factors which have a bearing on its combustion

- 34 - 1 properties. The sulphur content is less than l%, which is
fortunate as it is mainly in the organic form and cannot, there-
fore, be removed by washing. The arsenic content is also low,
a feature which is common when the pyritic sulphur level is low.
As might be expected, the coal has no coking properties. The
ash analysis shows high concentrations of silica and alumina.
This corresponds with the observed high ash fusion temperature
(initial deformation being over 2,500° F. The silica ratio
is high (Loring 77%, NC9 88%). This will result in a very viscous
slag and therefore the fuel is more suitable for firing in the
pulverised form than in a cyclone furnace arranged for liquid
slag tapping. The Hardgrove grindability index (Loring 51,
NCB - not measured) is average and should present no particular
problems, particularly as the high volatility will make
extremely fine pulverisation unnecessary. On this basis a target
of 65% through 200 mesh should give acceptable levels of carbon
in dust and grit.
Trace Elements
23. Coal samples taken from borehole 74-25 (Area 1 deposit)
were analysed for trace elements by Mr. K. Fletcher, who reported
on 2nd April, 1976. He concluded that the only trace elements
which could cause environmental problems were copper and molybdenum,
the former occurring in two samples in concentrations "comparable
to those in many porphyry copper deposits", and the latter in
concentrations "within the range associated with molybdenosis in
cattle". The combustion process will clearly bring about further
concentration in the ash. Therefore, if these values are wide-
spread, consideration will need to be given to the burial of this
toxic material (eg Montana may stipulate 8 ft of cover). Also
the waste rocks should be tested to make sure that dangerous
trace element concentrations do not occur in these.
SCHEDULE OF EQUIPhfENT
24. Table XL summarises the Schedule of Equipment - Fixed
Installations.
1 1 1
1 -I
I 3 1 1 i 1 1 J 7
I

- 35 - r
L
L-
i
L_
-~
.
\
,--
.
r.-
.
L.~.
:-
. _
CHAPTER VI
VASTE AND ASH DISPOSAL
MATERIALS AND QUANTITY
1. From Openpit No 2 there are five types of waste to
be dumped in the surrounding areas. These are:-
(i) superficials
(ii) pit waste
(iii) volcanics
(iv) segregated waste separated visually from the coal
(v) ash from the power station.
The quantities produced at each stage of the working of the
deposit are shown in Table XLI. Specifically 1,660 million yd3
of space are required up to the end of the 35-year pit (between
Stages 5 and 6), 3,155 million yd3 up to the end of the 600-ft
pit (Stage 8) and 15,808 million yd3 are needed up to the end
of the 1,500-ft pit (Stage 9). Again these quantities may
require to be modified after experience of working the deposit.
DD?JPS
2. In the southern portion of the valley, there are
four suitable dump areas designated No 3, 4, 5 and 6 dumps.
These are shown on Plate 77 and the total space available to
selected elevations is shown on Table XLII.
3. The comments in the report on Openpit No 1 apply also
to the dumping for Openpit No -2 with the exception that the
dump elevation in dumps 5 and 6 has been increased to 4,500 ft.
This is possible because of the general increase in altitude
of the valley in a sou~therly direction.
DISPOSAL AREAS
4. Space for dumps is considered under these different
conditions:-

- 36 -
(i) For the 35-year pit
The areas suitable for disposal are shown
Plate 78 with details of volumes given in
The volumes to various elevations are:-
on
Table XLIII.
106 yd3
Dump No 4 (4,000-ft elevation) 1,080
Dump No 5 (4,100-ft elevation) 671
1,751
(Volume required 1,660 million yd3)
More than half of the superficials will be delivered
to dump 5 by the south conveyor.
(ii) For the 600-ft pit
The areas suitable for disposal are shown on
Plate 79 with details of volumes given in Table XLIV.
The volumes available are:-
lo6 yd3
Dump No 4 (4,000-ft elevation) 1,080
Dump No 5 (4,350-ft elevation) 1,935
Dump No 6 (4,350-ft elevation) 402
3,417
(Volume required 3,155 million yd3)
(iii) For the 1,500-ft pit
The volume required in this case is estimated to be
15,808 million yd3. The total space available in the
vicinity of Openpit No 2 is 4,867 million yd3. It
is clear that waste disposal would be a major problem
and it would be necessary to dump to higher elevations
or to use areas in the north of the valley or outside
the valley for this purpose.
I 1 1 1 1 i I I 3 -i I 1 i 7 2 1 A
1 1 1 3 I 1

- 37 -
5. In all three cases the extra space provided if back-
filling were undertaken has not been included.
WASTE TRANSPORT
6. In general, arrangements for disposal of waste would
be the same as for Openpit No 1 except that from 1993 onwards
superficials would be delivered by the south conveyor to dump 5.
- 38 - 1
CHAPTER VII
INFRASTRUCTURE AND CIVIL WORKS
HAT CREEK DIVERSION
Object
1. As in Openpit No 1, Hat Creek and its tributaries
must be diverted. The 600-ft boundary of Openpit No 2 has
been taken as the drainage limit and two systems have been
considered.
Diversion Alternatives
2. Two alternatives, each employing a gravity flow
canal along the west side of Openpit No 2, have been considered.
This western canal would divert flows from the headwaters of
Hat Creek and from the creeks entering the area of Openpit No 2
from the western side (ie Crater, Phil, Parke, Lake, McDonald,
McCormick, Anderson, Chipuin). These drain the largest portion
of the catchment from which run-off would flow to Openpit No 2:
3. The first alternative would be to provide a flood
regulating pond at the upper end of the canal to limit the
flow from Hat Creek headwaters to 100 ft3/sec.
=I. The other alternative would be to construct the canal
of such a size as to pass unregulated peak flows based on
50-year statistics.
5. On the eastern side of Openpit No 2 a drainage ditch
would divert flows from the headwaters of White Rock Creek and
adjacent creeks into Cashmere and Ambusten Creeks and a second
ditch would intercept flows which would otherwise enter Hat Creek
downstream of the new canal entrance and diver~t these into the
canal.
6. Due to the topography, no other major diversion works
would be required on the eastern side.
1 1 1 1 1
I
-i J
I 1 1 1
- 39 -
c-
L_
. .
v-
L.
. ,
/~ r-
.
Data
7. Cost estimates have been based on the unit prices
assumed for Openpit No 1 and pondage volumes have been estimated
from the lo-year records (1961 to 1970) of Station No 08LF061
situated near Upper Hat Creek. The synthetic hydrograph developed
for Openpit No 1 studies was also used.
Hydrology
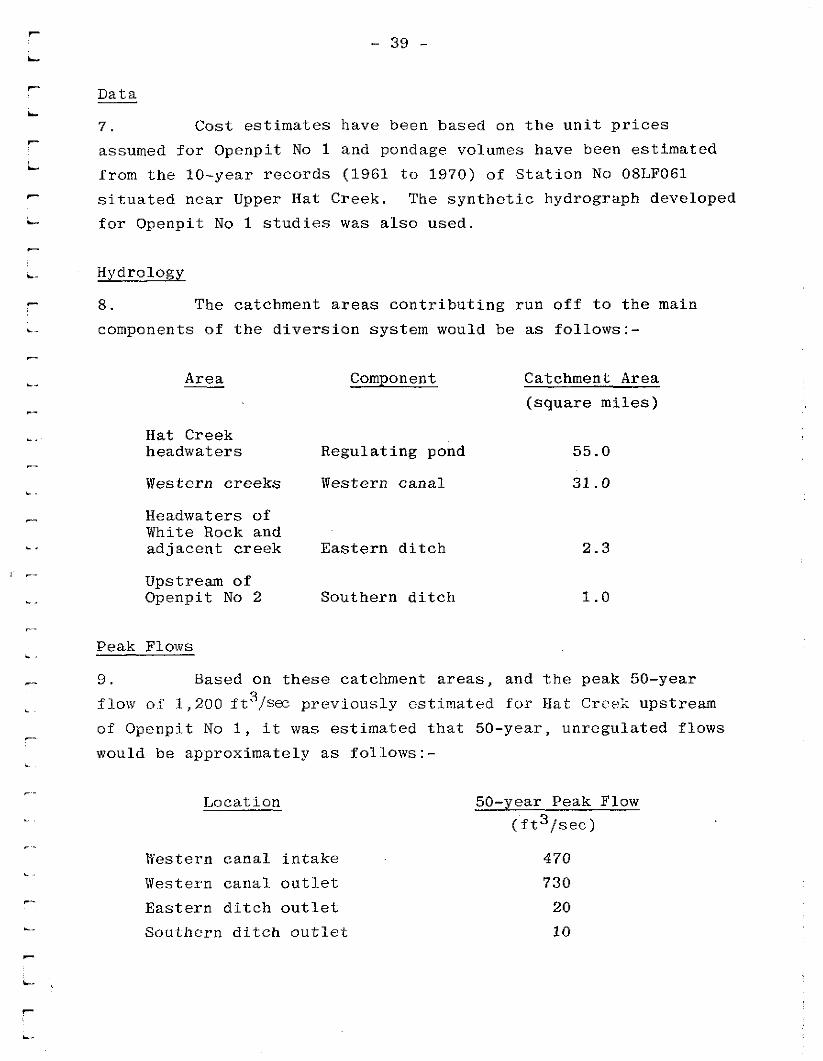
8. The catchment areas contributing run off to the main
components of the diversion system would be as follows:-
Area Component Catchment Area
(square miles)
Hat Creek headwaters Regulating pond 55.0
Western creeks Western canal 31.0
Headwaters of White Rock and adjacent creek Eastern ditch 2.3
Upstream of Openpit No 2 Southern ditch 1.0
Peak Flows
9. Based on these catchment areas, and the peak 50-year
flow of 1,200 ft3 /SeC previously estimated for Hat Creek upstream
of Openpit No 1, it was estimated that 50-year, unregulated flows
would be approximately as follows:-
Location
L
-
&_
L !
c-
Western canal intake 470
Western canal outlet 730
Eastern ditch outlet 20
Southern ditch outlet 10
50-year Peak Flow (ft3/sec)
- 40 -
10. With regulation of the flow from the headwaters of
Hat Creek into the western canal to 100 ft3/sec,the peak flow at
the outlet of the western canal would be reduced to 360 ft3/sec,
Pondage Requirements
11. The pondage volume required to regulate the flow from
the headwaters of Hat Creek to a maximum of 100 ft3/sec has been
estimated from the records of the daily flows that occurred in
Hat Creek during June of 1964 (the highest of the lo-year record).
During that year, a pond capacity of 860 acre-ft would have been
required. A requirement of 1,000 acre-ft has been assumed for
the preliminary designs and cost estimates.
Selected System
12. The selected system indicated to be the more economical
is that incorporating a flow-regulating pond with the eastern
and southern ditches.
13. The ponding dam would be based near elevation 3,650 ft;
its crest elevation would be 3,685 ft approximately and its
crest length about 1,100 ft. An emergency spillway (sill elevation
3,675 ft) would be provided at the dam to pass flows exceeding
the regulating capacity of the pond. Spilled water would be
conveyed into the bottom of Openpit No 2 by a culvert as described
previously for Openpit No 1.
14. A 4-ft diameter outlet culvert would be provided through
the dam to control flows entering the head of the western canal.
Culvert discharges would be controlled by two sluice gates
operating on the upstream face of the dam.
15. The western canal would be approximately 30,000 ft in
length and would be concrete-lined, with bottom widths varying
from 3 ft at the upstream end to 6 ft at the downstream end and
with depths in the range of 4 to 6 ft. The maximum flow velocity
would be 8 ftfsec, gradients would range from 0.2% to 0.3%. The
canal would discharge into a natural depression located just
downstream of Openpit No 2 and of Anderson Creek. An amount
1 1 1 1 1 1 1 .L
7 .I
1 i
1 7 i 1 1 I 1 1
1 1

- 41 -
has been included in the cost estimates for stabilising this
depression to prevent erosion from the canal discharges.
16. The general route of the western canal and the eastern
ditches is shown on Plate 64 and the estimated cost of the creek
and road diversion is shown in Table XLV.
ROAD DIVERSION
17. The most logical and economic relocation for the road
rvould be on the canal bench on the downhill side of the canal,
thereby avoiding culverts and providing one road for both public
use and canal maintenance.
Surface Mine Buildings
18. This item has been assumed to be identical to
Openpit No 1 (see Chapter VII, Report No 2).
Road Construction and Improvement
19. This item has been assumed to be identical to Openpit
No 1 (see Chapter VII, Report No 2).
Services
20. This item has been assumed to be identical to Openpit
No 1 (see Chapter VII, Report No 2).
Housing
21. This item has been assumed to be identical to Openpit
No 1 (see Chapter VII, Report No 2).
SCHEDULE OF EQUIPMENT
22. Table XLVI summarises the Schedule of Equipment -
Infrastructure.
- 42 -
I
1
CHAPTER VIII
ECONOMICS
1 1
BASIS 1 1. Exactly the same basis has been used to derive the
economic results for Openpit No 2 as for Openpit No 1
(Report No 2) and the same sequence of economic tables has been 1 adopted to facilitate comparison. The same basic financial data have been used and the main tables are expressed in 1975 3
Canadian dollars with inflated costs also given. 1
CAPITAL COSTS
2
-l 2. . The following tables deal with capital costs of the
plant equipment and services:-
Table XXX1 - Mobile Mining Equipment Requirements
Table XL -7
- Schedule of Equipment - Fixed Installations ;
Table XLVI - Schedule of Equipment - Infrastructure. 7
I 3. If a bucket-wheel excavator system were used for the
2
removal of superficial waste, then the capital cost to start-up -:
would be increased by about $20 million (see Table XXXVII). L
4. Again it should be noted that many of the fixed 3
installations, eg coal stockpiling and reclaiming and also ash
handling, are strictly not part of the mine but could be con- 1 sidered to be part of the power plant. The capital cost of this
equipment is again about $34 million. 1 DIRECT OPERATING COSTS 1
i 5. The following tables deal with direct operating costs:-
Table XLVII - Summary of Electrical Energy Costs 1
Table XLVIII - Labour Schedule and Payroll Costs
Table XLIX - Materials and Fuel Cost Summary 1 Table L - Direct Operating Cost Summary
1
- 43 -
i
L-
.
- -
.-
c- )
c
Electrical Energy
6. If a bucket-wheel excavator system were used, the
electrical power consumption, and hence the electrical energy
costs, would increase and this is allowed for in Table XXXVI.
Labour
7. Appendix "I" gives the labour requirements for
Openpit No 2 and it will be noted that the total labour force
is estimated at 726 compared with 662 for Openpit No 1 - a
result of the greater volumes of material to be moved.
Managerial, Technical and Administrative Staff
a. It has been assumed that the difference in staffing
between Openpit No 1 and 2 would be negligible and hence
Table XIX (Report No 2) applies also in this case.
TOTAL IWESTMENT AND CAPITAL CHARGES
9. The following tables deal with these items:-'
Table LI - Depreciation Summary
Table LII - Capital Investment, Interest during Construction, Interest and Insurance
PRODUCTION COST (1975 PRICES) - 600-FT PIT
10. Table LIII, Coal Production Cost (rom) shows the
development of the production cost in the same way as Table XXIV
for Openpit No 1. Again the coal handling and ash disposal
element would be about 80$/tori rom. It will be noted that, after
the initial development periods, the cost remains fairly steady
at about $7.50 until the pit begins to widen out in Stage 6
when it increases rapidly. This is a consequence of selecting
Scheme B, ie developing a long, narrow pit before widening out.
11. The use of a bucket-wheel excavator system for the
removal of superficials could result in a saving of about 43$/tori (Table XXXVII).
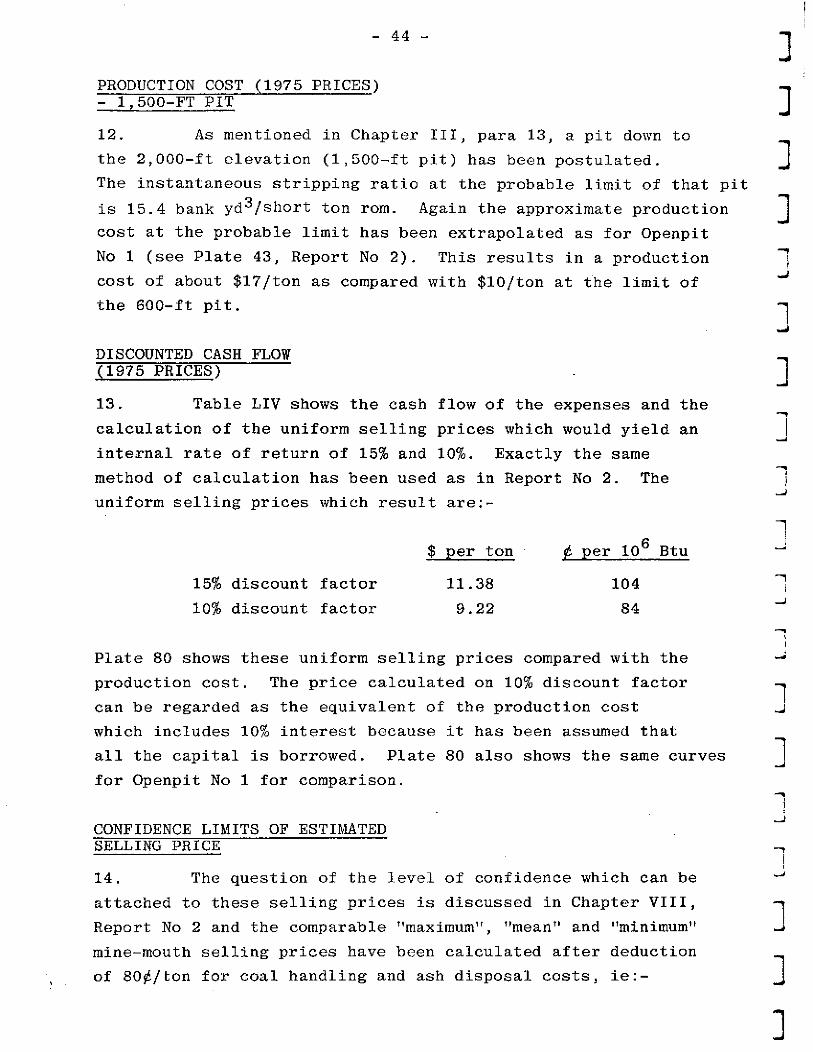
PRODUCTION COST (1975 PRICES) - 1,500-FT PIT
12. As mentioned in Chapter III, para 13, a pit down to
the 2,000-ft elevation (1,500-ft pit) has been postulated. 1 The instantaneous stripping ratio at the probable limit of that pit
is 15.4 bank yd3/short ton rom. Again the approximate production 1 cost at the probable limit has been extrapolated as for Openpit
No 1 (see Plate 43, Report No 2). This results in a production
cost of about $17/tori as compared with $lO/ton at the limit of i
the 600-ft pit. 1
DISCOUNTED CASH FLOW (1975 PRICES)
J
1 13. Table LIV shows the cash flow of the expenses and the
calculation of the uniform selling prices which would yield an
internal rate of return of 15% and 10%. Exactly the same
method of calculation has been used ae in Report No 2. The 7 .A
uniform selling prices which result are:-
1 $P er ton $ per lo6 Btu i
15% discount factor 11.38 104
10% discount factor 9.22 a4
Plate SO shows these uniform selling prices compared with the
production cost. The price calculated on 10% discount factor
can be regarded as the equivalent of the production cost I which includes 10% interest because it has been assumed that
all the capital is borrowed. Plate SO also shows the same curves I for Openpit No 1 for comparison.
CONFIDENCE LIMITS OF ESTIMATED SELLING PRICE
i
1 14. The question of the level of confidence which can be L
attached to these selling prices is discussed in Chapter VIII,
Report No 2 and the comparable "maximum", "mean" and "minimum" 1
mine-mouth selling prices have been calculated after deduction
of ao$/ton for coal handling and ash disposal costs, ie:- 1 1
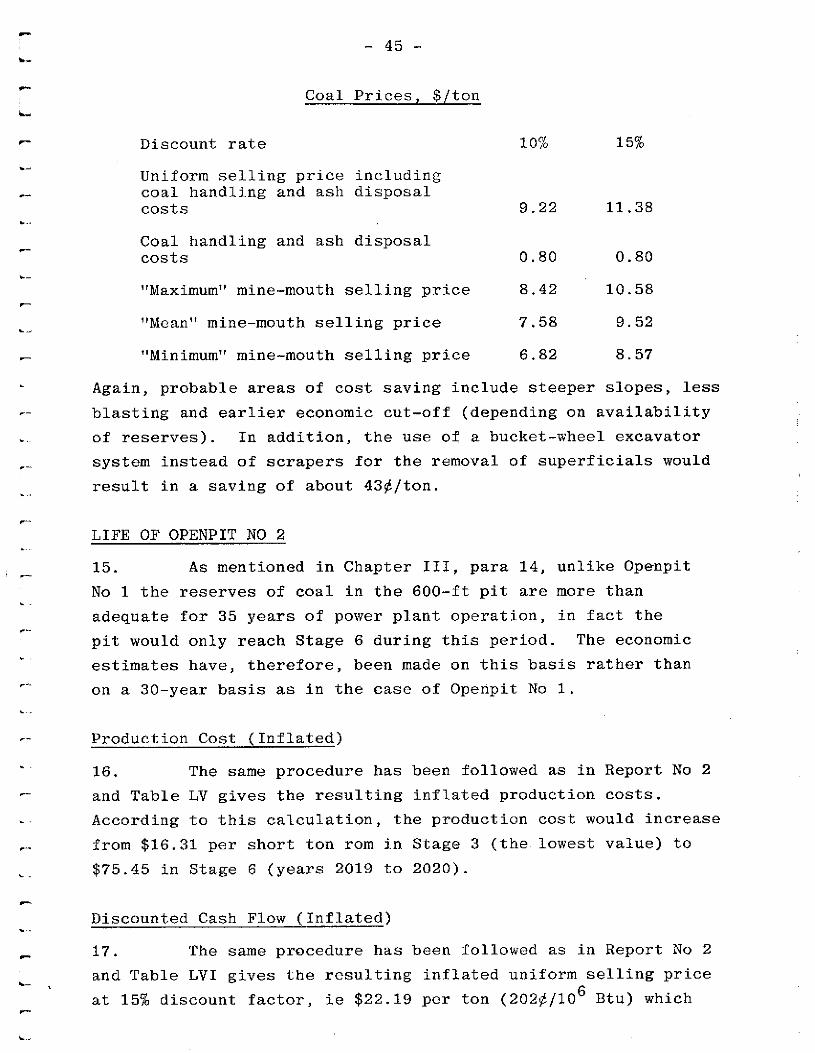
.-
L
.-
c.
.-
L_
?-
_
e-
.
*
c
.
c-
.
r-
.
e-
.
.
.,.
L
c-
- 45 -
Coal Prices, $/ton
Discount rate 10% 15%
Uniform selling price including coal handling and ash disposal costs 9.22 11.38
Coal handling and ash disposal costs 0.80 0.80
"Maximum" mine-mouth selling price 8.42 10.58
"Mean" mine-mouth selling price 7.58 9.52
"Minimum" mine-mouth selling price 6.82 8.57
Again, probable areas of cost saving include steeper slopes, less
blasting and earlier economic cut-off (depending on availability
of reserves). In addition, the use of a bucket-wheel excavator
system instead of scrapers for the removal of superficials would
result in a saving of about 43$/tori.
LIFE OF OPENPIT NO 2
15. As mentioned in Chapter III, para 14, unlike Openpit
No 1 the reserves of coal in the 600-ft pit are more than
adequate for 35 years of power plant operation, in fact the
pit would only reach Stage 6 during this period. The economic
estimates have, therefore, been made on this basis rather than
on a 30-year basis as in the case of Openpit No 1.
Production Cost (Inflated)
16. The same procedure has been followed as in Report No 2
and Table LV gives the resulting inflated production costs.
According to this calculation, the production cost would increase
from $16.31 per short ton rom in Stage 3 (the lowest value) to
$75.45 in Stage 6 (years 2019 to 2020).
Discounted Cash Flow (Inflated)
17. The same procedure has been followed as in Report No 2
and Table LVI gives the resulting inflated uniform selling price
at 15% discount factor, ie $22.19 per ton (202#/106 Btu) which
- 46 -
is about twice the uninflated figure. At 10% discount the
corresponding prices are $21.59 per ton and 196#/106 Btu. The
small difference in the prices at 15% and 10% discount is due
to the higher discount off-setting the inflation to a greater
extent.
OPPORTUNITY VALUE OF HAT CREEK COAL
18. The concept of the opportunity value of Hat Creek coal
was discussed in Report No 2 (Openpit No 1). This was con-
sidered in the context of an international crude oil price of
$ll/bbl and the then ruling internal Canadian price of $X/bbl,
though it was predicted that it would only be a matter of time
before the internal price rose to the international level.
19. Such a rise is now imminent. It has been reported in
"Petroleum Economist" (J une 1976) thatthe federal government is
to raise the controlled price to $9.05/bbl as from 1st July, 1976
and to make a further increase to $9.75/bbl with effect from
January 1977. This will obviously further improve the opportunity
value of Hat Creek coral vis-a-vis oil. The relevant values can
be obtained from Plate 45 (Report No 2).
20. The same announcement gives details of parallel
increases in natural gas prices. The "city gate" price at
Toronto will go up from $1.25/106 Btu to $1.40/106 Btu
and then to $1.50/106 Btu.
Break-even Stripping Ratio
21. The break-even stripping ratio for a given coal value
can again be determined from Plate 46 (Report No 2).
!
1 1~ 1 1 1 I I 1 7 -2 1 1 I
? J 1 i
7
1~ 1 1
m- .
- 47 - c-
CHAPTER IX
SUMMARY AND CONCLUSIONS L..
L.
_-
r-
.
--
GENHRAL
1. Systematic geological investigation of the coal
deposits in the Hat Creek valley since 1957 has resulted in the
identificationof two main deposits (which may be contiguous in
depth), designated Area 1 in the north of the valley (downstream)
and Area 2 in the south of the valley (upstream). The object of
the ,,current studies is to develop conceptual mines (designated
Openpit No 1 and 2 respectively) in these areas and to compare
them so that decisions can be taken as follows:-
. .
.
--
(i) Whether either or both can be exploited economically
for electric power generation (2,000-MW plant) in
the first instance or for other uses.
(ii) Which pit should be developed first.
(iii) Whether both pits would need to be developed and,
if so, the phasing of this development.
2. To this end, separate studies have been made on the
two conceptual pits, the first (Report No 2), dealing with
Openpit No 1, being completed in May 1976 and the second being
the subject of this report. In order to make valid comparisons
--
w-
.
._
and in view of the shortage of data, in certain areas the two
studies are based on-the same assumpti.ons, follow parallel logic
and adopt a similar format. The mine design and economic
calculations have been carried out to the same level of confidence.
In both cases, practical systems have beeri selected without
detailed optimisation. Unless attention has been drawn to
divergencies between the two pits, it may be assumed that the
same considerations apply.
c.
L_
- 48 -
!
'I GEOLOGICAL AND GEOTECHNICAL CONSIDERATIONS
3. The geological and geotechnical environments of the
two pits are very similar, the main difference being the shape
of the deposits. The Area 2 deposit is longer, narrower and deeper and is covered with greater thicknesses of overburden.
For this reason it was believed, prima facie, that Area 1 was
more favourable, and this has been verified. However, Area 2 contains considerably greater reserves of coal, although much
of this is so deep that the prospects for its exploitation,
at least by surface mining, are doubtful. The prospects for
underground mining are worse than in Area 1 because of the
greater depth.
MINE DESIGN
4. Exactly the same principles have been used in developing
the design of the two openpits, but owing to the elongated shape
of the Area 2 deposit, Openpit No 2 will be elongated and less
circular than Openpit No 1. This shape may lead to greater slope
stability problems. The main means of access into the pits
which has been selected is a long incline at the north end where
the cover is least. These would suit power station sites north
of the deposits but if another site were selected consideration
would be given to changing the location of the inclines.
Depth
5. In each case a nominal depth of pit of 600 ft has been
used although a conceptual 1,500-ft pit has also been considered.
It is reasonable to assume (in the absence of adequate geotechnical
data) that a 600-ft pit is feasible but the 1,500-ft pit cannot,
at present, be considered prima facie feasible leaving aside all
questions of economics. The 600-ft pit in Area 1 contains
reserves of coal sufficient only for 30 year of 2,000-MW power
plant operation, although it is confidently expected that further
reserves may be proved to extend the pit for the full 35 years
life specified. In the case of Openpit No 2, the 600-ft pit
contains ample reserves for the 35 years. In both pits, but
particularly in Openpit No 2, considerable coal resources exist
1 I
I 1 I -I
4
-I
1 i
3 I 1 1 I
at greater depth a
by surface mines.
.lthough this may not be economically mineab
Underground mining would be extremely
difficult and also uneconomic at current price levels.
le
- 49 -
Bucket-Wheel Excavator Systems
6. It was considered from then outset that the possibility
existed of using bucket-wheel excavator/conveyor systems because
of the weak nature of many of the rocks present in the valley.
However, the geometry of Openpit No 1 does not fit such systems
very well (although conveyor/spreader systems were adopted for
waste disposal). In the case of Openpit No 2, the geometry of
the deposit is more favourable and the quantities of weak rocks
(eg superficials) are much greater and~therefore a scheme has
been drawn up as an alternative to the large fleet of scrapers.
This appears to offer the possibility of saving 43#/ton of
coal, although the front-end capital expenditure is higher. The
success of such a scheme depends, of course, on the absence of
large quantities of hard rock (eg boulders) in the waste which
cannot be handled by the system - which is unknown at present.
ENVIRONMENTAL CONSIDERATIONS
7. Openpit No 2 is less favourable from an environmental
point of view because of the larger quantities of waste material
involved. However, after some 20 years it may be possible to
backfill the north end of the pit. The size of the pit is greater
and hence the total area of despoilation is greater. The Hat
Creek diversion problem is easier because the pit is further
upstream and it is possible to arrange a gravity-flow canal, at
least around the 600-ft pit. Openpit No 2, being higher up the
valley, will leave the 'northern end of the valley relatively
free from interference as far as the mine is concerned.
COMl'ARISON OF OPENPIT NO 1 AND 2
8. Table LVII lists some of the significant features of
the two pits and in all cases except the coal reserves within
the pits, Openpit No 2 compares unfavourably with Openpit No 1.
The economic comparisons are particularly important. The capital
,
- 50 -
investment to start-up is 118% greater (and would be even more
using bucket-mheel excavators) and the uniform selling price
(15% discount basis) 79% greater.
CONCLUSION
9. It is concluded that the results of these studies
confirm the preliminary conclusion that Openpit No 1 was the most
favourable for first exploitation despite the short-fall in coal
reserves in the 600-ft pit.
1 1~ 1: 3
3 3 1

APPENDIX "F"
LIST OF DOCUMENTS AND DRAy?tNGS RECEIVED BY PD-NCB FROM
24TH FEBRUARY TO 7TR JUNE, 1976
1. "A Preliminary Assessment of the Washability of Coal
from the Hat Creek Property of BC Hydro with an Estimate
of the Capital and Operating Costs of a Preparation
Plant". Birtley Engineering (Canada) Ltd, August 1975.
2. "Analyses of Hat Creek Coals". K. Fletcher, 2nd April, 1976.
3. "Palynological Zonation and Correlation of Hat Creek Core
Samples".
4. Covering letter with the above report from G.E. Rouse
to Lisle Jory.
5. E-W and N-S sections of No 2 coal deposit, lin to 200 ft
6. Graphical logs of boreholes 76-111, 76-112, 76-1128,
76-113, 76-114, 76-115, 76-116, 76-117, 76-118 and 76-119.
7. Drill hole water level records from December, 1974 to
March 1976.

I--
L
r
APPEKDIX “G”
ANALYSES OF SAMPLES FRO&I BOREHOLE NO 75-74 629 6cavr:da.m Rd. N.E.
Calgary 67. Alberta
T2K OJ2
Phone 274-2777 'L.,.
DOL?+GE CA!PIPBELL & ASSOCIATES LIMITED r:':COWER, BRITISH COLUMBIA &UhDA
PIEN?: B.C. Hydra & Power Authority
. ~iOJECT: Hat Creek Coal
r-
Date: October 1, 1975
D.D.H. 75-74 Smple No. 74-409 (g41+5) Footage 1678-1844 Uidth 166'
. . . Analysis Report No.10464
PROXIFATE ANALYSIS r- As Rec'd. 9 Basis Lab Basis
I.. 1'7 7.74 \
sh 28.14 25.96
T.M. 35.72 32.96
T.C. 36.14 33.34 - BTU 8,723 8,048 r-
S .80 .74
’ ‘I Alk. AS. Na20
pSIO11~TEMP. OF ASH
._ Initial Def.
Reducing 2480
r- (H=q +2640 ;- l L _,.=%w) i2640
+luid +2640
T EQUILIBRIUM MOISTURE =
i2640
+2643
+2640
'-zG7DGROVE GRIND. INDEX = 51 ~jIJLP?XLJ?. FORMS
Jyritic $S .16 . julphate $S .Ol c.
Organic %S .63
r-?&al L- %S .80 .
ULTIMATE ANALYSIS 7. Weight
As Rec'd. Dry Basis Lab Ba
H20 7.72
C 51.oo 47.0s'
H 4.81 4.41; N 1.05 .97
Cl Trace Trac"
S .iO -3 Ash 28.14 25.96
0 (diff) 14.20 13.x:
I MINERAL ANALYSIS % Wt. Icniced Saz
P205 .lj
Si02 47.35 i
Fe203 5.72
A1203 31.01 f
Ti02 1.92
Cd 7.49
WY' .65 j
so3 3.74~ j
K20 -10
Na20 .93' I
Undetermined .91 ;
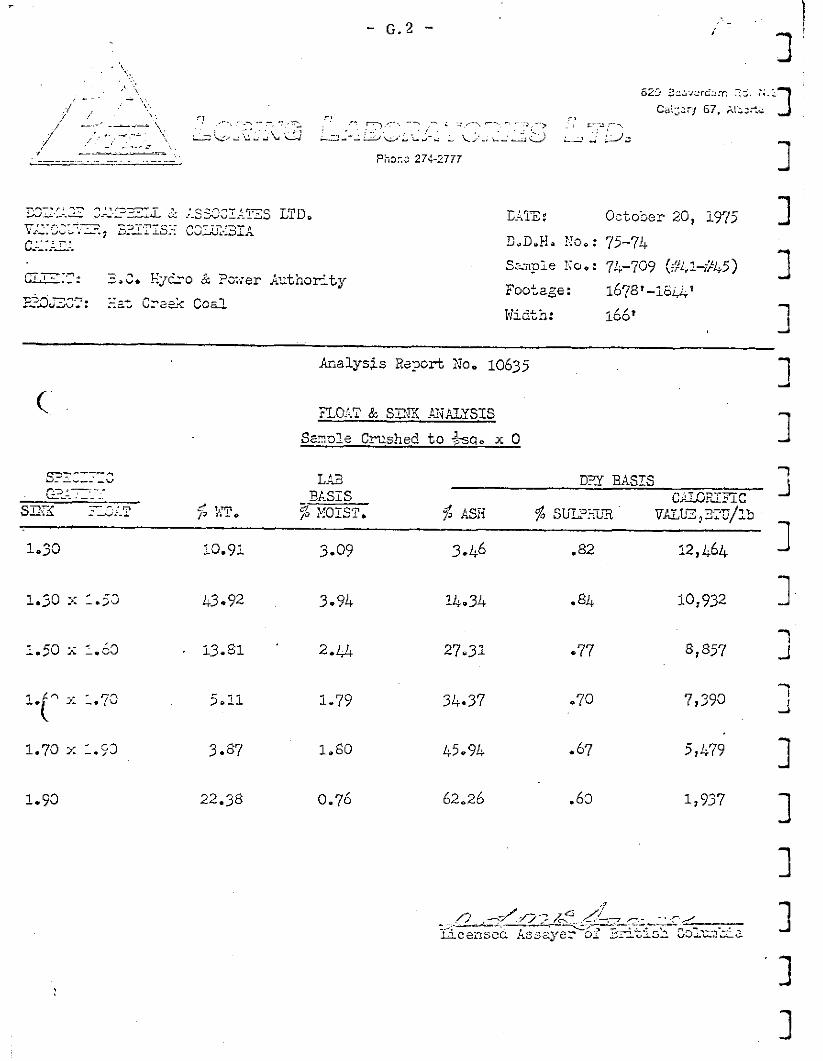
hiaiysis Xa?oti No. 10635
1.33 lG.9l 3.59 3.46 .82 12,464
I.30 % :.js 43.92 3.94 14.34 .84 10,932
yn :.: 1.70 j.li i-79 34.37 -70 7,390
I.70 % 1.43 3.67 i-60 45.94 .67 5,479
1.93 22.38 0.76 62.26 .bG 1,937
I 1~ 1 I 1 1 1 1 1 1

APPENDIX “B”
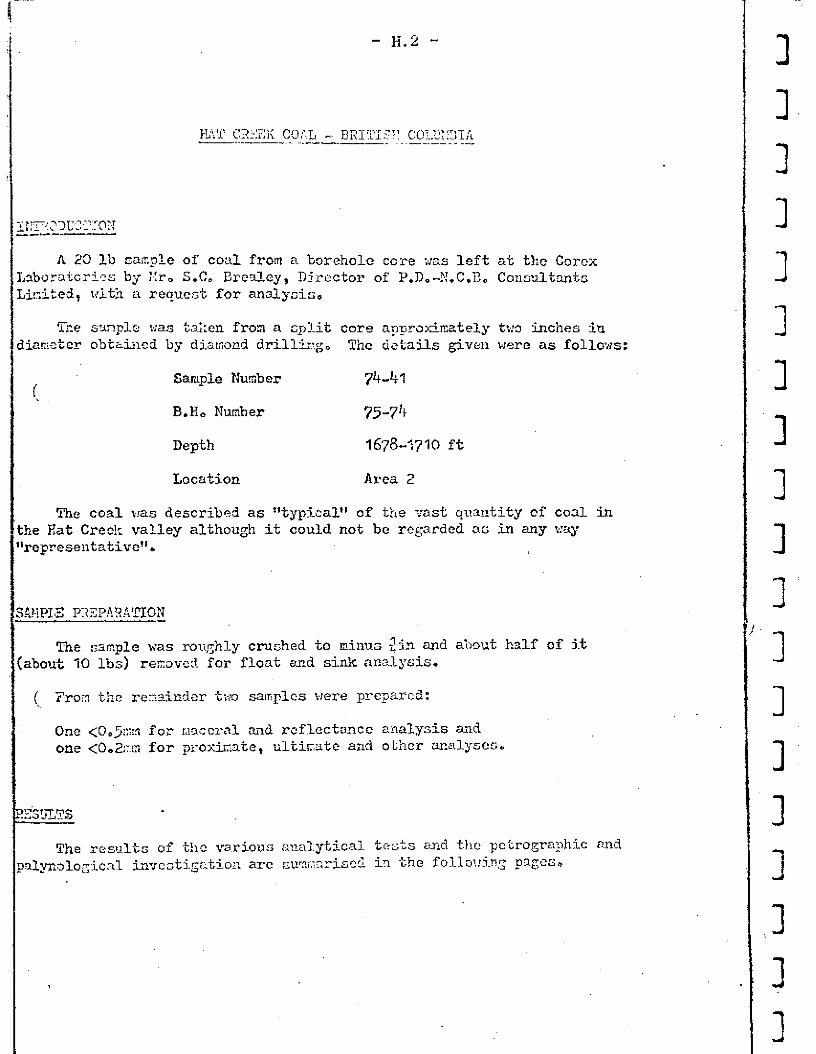
I% 23 lb tnqle of coal from a boreholc core 'n'xs left at the Corcx Lab.bora.icri::s by ::r, S.C, Lhlley, DSmctor of P.D.-?!.C.i?, Conmlt&x Li!nited, wit:2 u request for analycis.
5-x smple was ta;:cn from n cplit core acljrstirr.ately tw inches in dizeieter obttixed by diamond drill?.q, Tlhc details given were as follows:
! Sample Nmber 74-41
ELK, Nlmber 75-74
Depth 1678-';?I0 fe
I
Location Area 2
The coal IW.S described as "typical" of the I-ast qu'iatity of coal in
I
the Rat Creek valley although it could not be regarded nc in any v:q "represeatativc".
1 I 1 i I, I
1 1 I 1
~1 ‘. 1
1 1 1'
‘! 1 1 I’ 1 I :I
.I 3 1
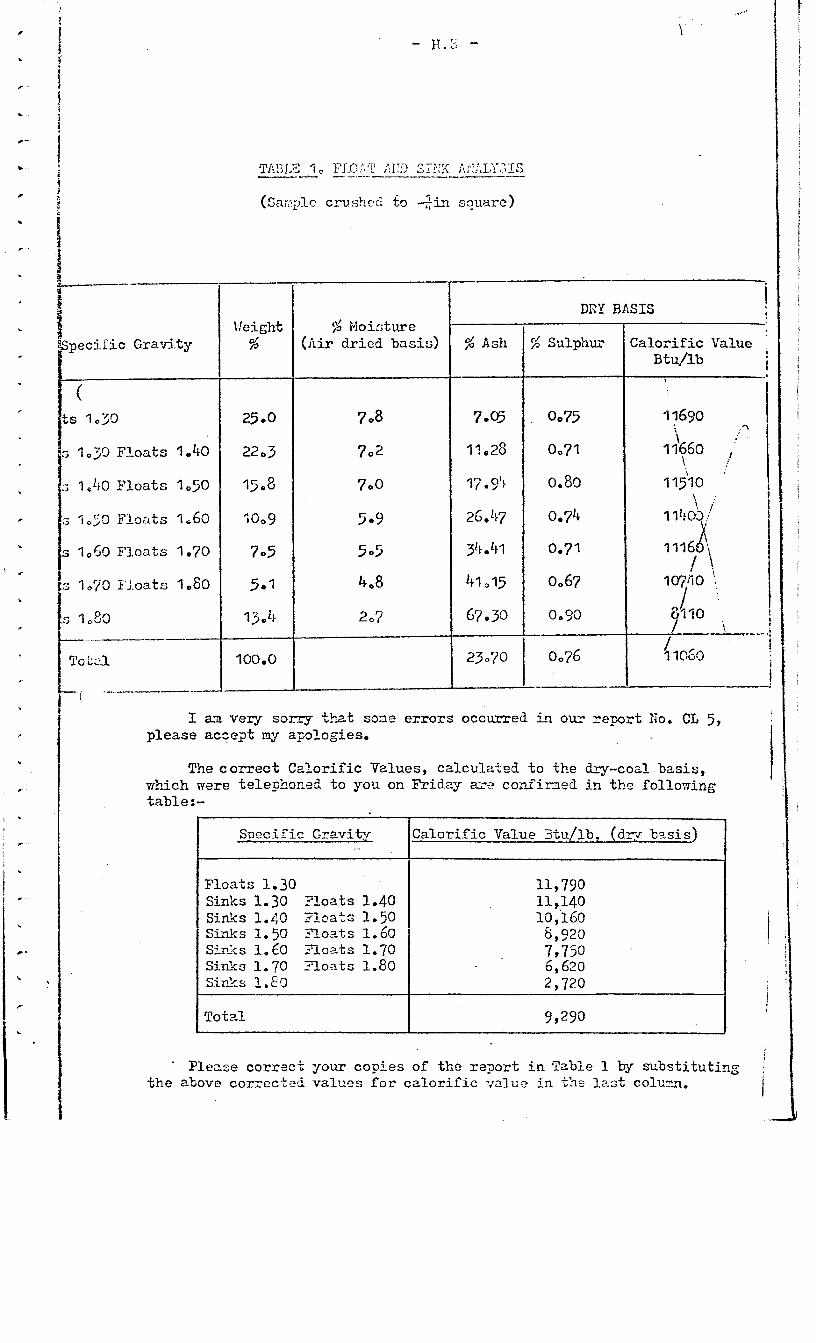
( ts 1030
I,30 Floats 1.40
; I ,40 Floats 1050
s cl,60 Floats 1.70
s I,70 Floats 1 .EO
\leight %
(;i Moisture (Air dried basis)
25.0 708 7.05 0075
2203 702 1~28 0071
1508 700 77.9% 0.80
;0*9 509 26.47 0.74
705 505 34.41 0.71
587 4,8 41315 0067
l3,4 207 67.30 0690
100.0 23070 0076
DRY BASIS
.- -
Zalorific Value Btu/lb
I
I a3 very sorry t32 t sme errors occurred in our report iio. CL 5, please accept ny aplogies.
The correct Calorific Values, calculated to the dry-coal basis, rrkich were telep'r?o*a, ,,,r! to you on Friday aze confiz-zted in the folloxing table:-
Specific Gravity ._
Floats 1.30 Sinks 1.30 Zloats 1.40 Sir&s 1.40 moats 1.50 Sinks 1.50 ?loats 1.60 Sirks 1.60 ;-oats 1.70 Sinks 1.70 Zloats 1.80 Sides 1. Eo
Total 9,290
Calorific Value 3tu/lb, (drf brsis)
11,790 11,140 10,160
Ei,yzo
22: 217.20
* Pleme correct your copies of the report in Table 1 by sxbstitutir.g the above correctzi values for calorific value in th lzst Colum.

- H.4 -
1103
2203
3207
3307
Gross NC-t 8110 7660
0068
a59
0,021
1050
140%
14oa
1400;
7
11.33
k&20
306
0090
0002
0068 . 22*33
130%
2.501
3509
3300
0077
0.08
0002
0.67
0,024
709
53021
4,ll
1 ,Ol
0003
0077
25 p 14
Tiscl73
49,2
‘12270
21c.01

r.
c
c-
L_
c._
,--
,.
c.
5 r-
c.
- H.5 -
5
5h-6
408
O-5
2.1
33.1
1.2
I.2
003
0-27
1.7
0.23
8801
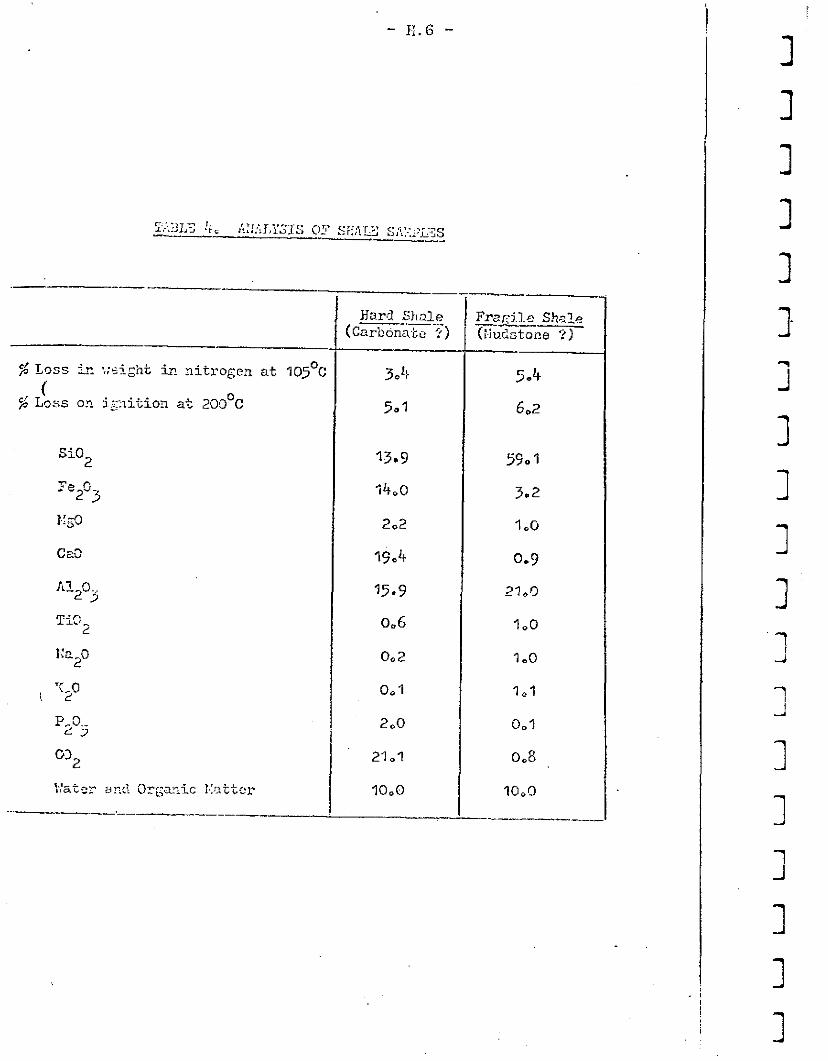
- E.6 -
3.4
5.7
13.9
34.0
202
19.4
75.9
006
002
001
2*0
21.1
IO,0
--
Frar5.l.c 231~~s --.-2.---~ Wdstooe ?)
5.4
6,2
59.1
3.2
100
0.9
21,o
100
1.0
101
0.31
03
IO,0
-
1 I 1 I 1 I 3 1 I 1 1 1 I I 2 1 1 1 1 1 1
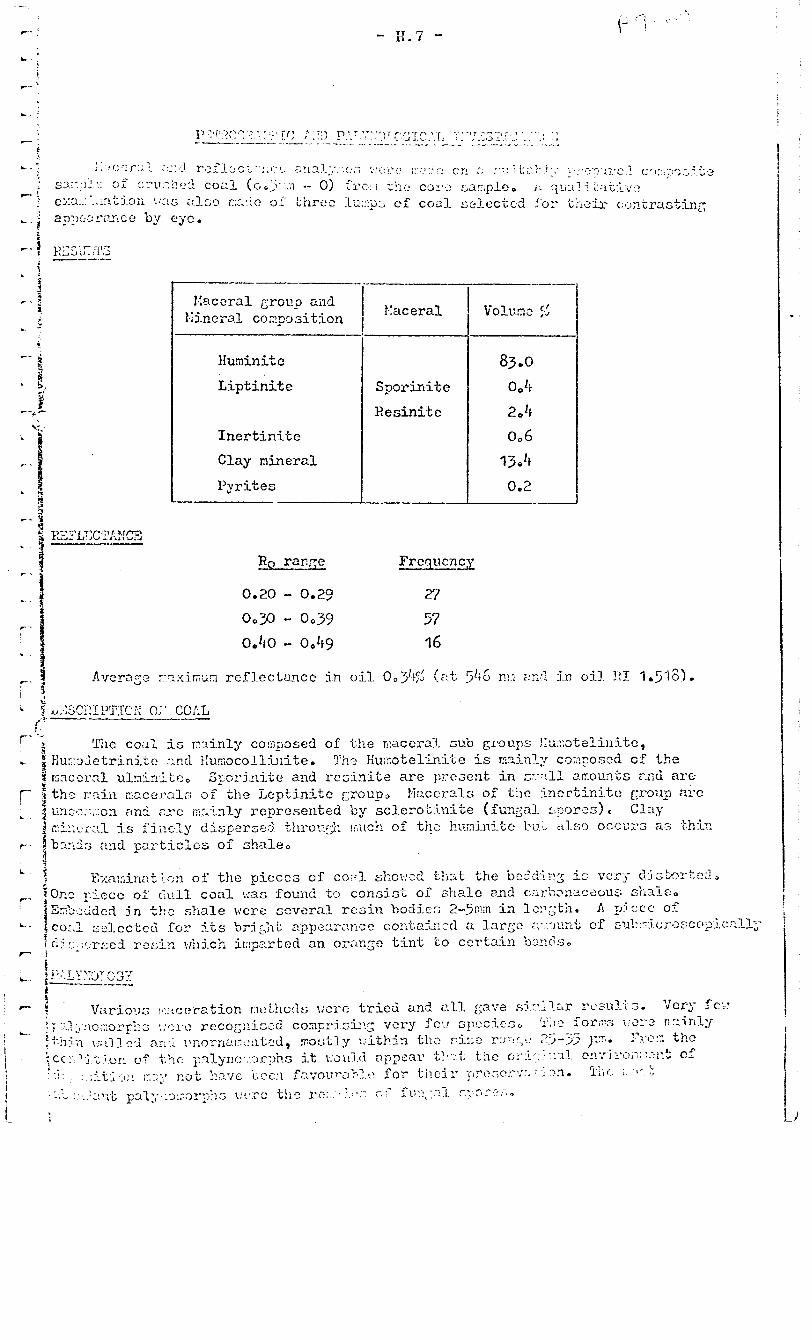
- x.7 -
I Hurninite
Liptinite
Inertinite
Clay mineral
Pyrites
83.0
Sporitiite 004
Resinite 204
006 L l&4
ocl2 _-
R. range Frcqumcy
0.20 - 0.29 ;r7
0030 - 0*39 57
oe40 - 0049 16

- IS.8 -
1
_ . . I- -. ,- ’ ‘,
- &--,A
%~e:i 011 itc; vo:Lntile iilatter content (d,a,f,) md cal.ori.f:.c ~2.12'3 (a-f, ra.k: coal) the coal muld be clar,scd nccol*ding to i;hc Gerr3_1 (Dli!)
cl.::c;i fj.catSx 2:s a I.12 i;tbr;LLII!.:OillC an,? 2ccord-iI;g to t’fie i\i2,2riCa (i:SZ-;.;)
ClxS ificntion as a sub 'oitwinous 23 mnk coal. Eio'h'ever, the rxasured ~.axic~u;n reflectacce in oil is lover tbn the valms generally recogniscd for ccals of -this rank (0.4 - 0.5$:). Cosls havk1;;; a Iz El31 of 0.34 k-ould be ClGLZ d as Li&'ic in the hmricm nysimx. tilnt the coal has
X-v.2 n.lcrosSo~ic eltidencc suggests reached the late lignite (~~lattbraunkoh~e) stage of
coslification since ulrninitc is the predominant czceral of the hurxotelinite s:d'L, pxp Q Tirs formation of this caccral takes place at a.bouJi this rark stage as a result of the process of geochemical gelification.
i L
i 6
I
1 1 1 1 1 1 .
1 1 I 3
I 1 1 I 1 1 1 1 3 1
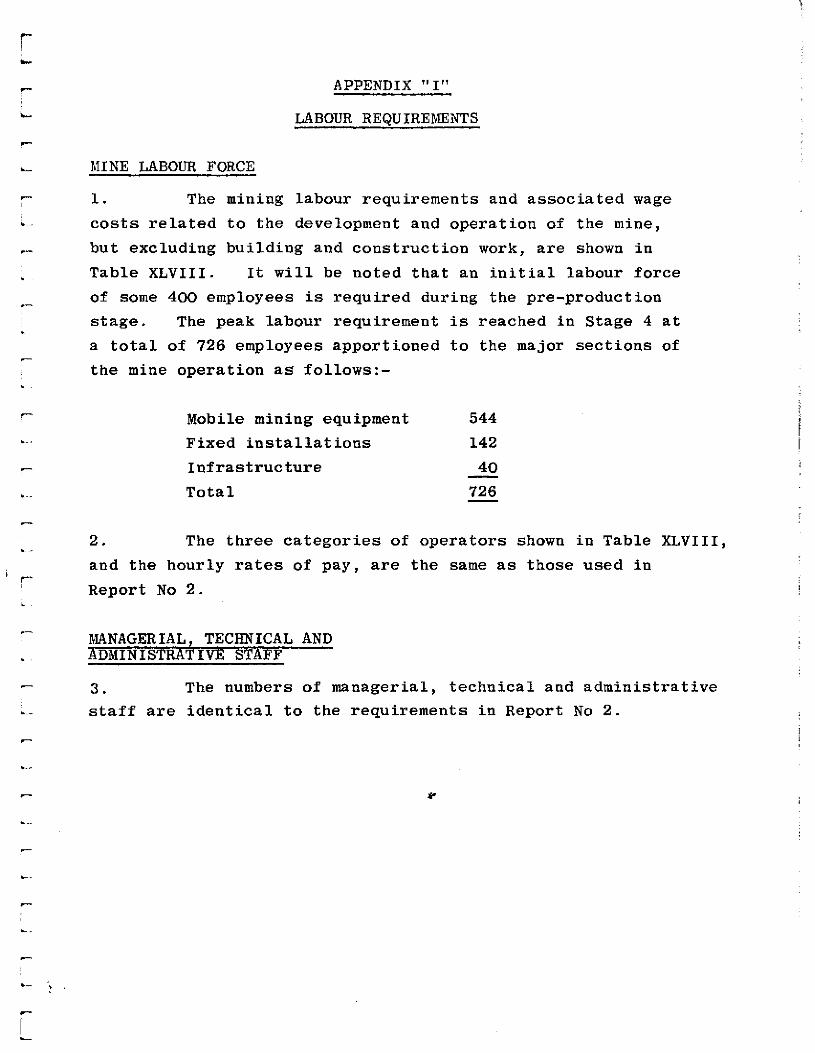
APPENDIX "I"
LABOUR REQUIREMENTS
MINE LABOUR FORCE
1. The mining labour requirements and associated wage
costs related to the development and operation of the mine,
but excluding building and construction work, are shown in
Table XLVIII. It will be noted that an initial labour force
of some 400 employees is required during the pre-production
stage. The peak labour requirement is reached in Stage 4 at
a total of 726 employees apportioned to the major sections of
the mine operation as follows:-
Mobile mining equipment
Fixed installations
Infrastructure
Total
544
142
40 - 726 -
2. The three categories of operators shown in Table XLVIII,
and the hourly rates of pay, are the same as those used in
Report No 2.
MANAGERIAL, TECHNICAL AND ADMINISTRATIVE STAFF
3. The numbers of managerial, technical and administrative
staff are identical to the requirements in Report No 2.
P

r L. ?- . . - .
.
_.
-
c
Explanatory Note
There are a number of minor discrepancies in the following
tables which are, however, without significance in the con-
text of the conceptual design and the level of confidence
of the estimates.
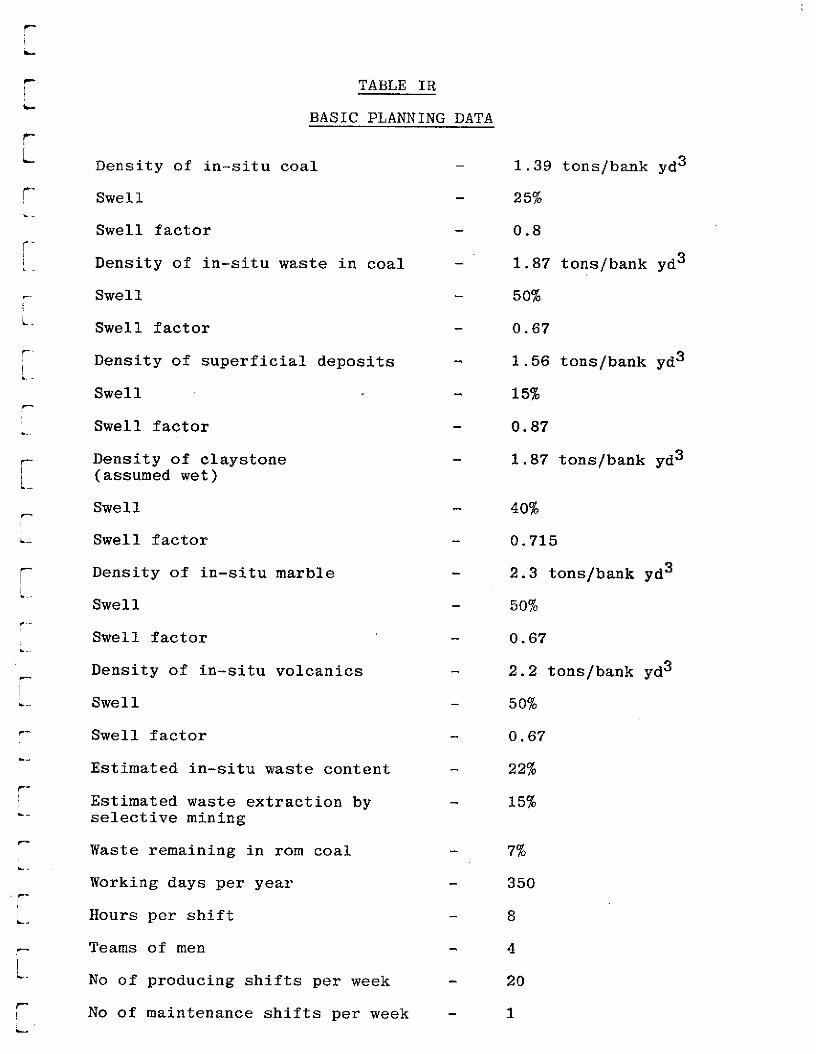
TABLE IR
BASIC PLANNING DATA
Density of in-situ coal
Swell
Swell factor
Density of in-situ waste in coal
Swell
Swell factor
Density of superficial deposits
Swell
Swell factor
Density of claystone (assumed wet)
Swell
Swell factor
Density of in-situ marble
Swell
Swell factor
Density of in-situ volcanics
Swell
Swell factor
Estimated in-situ waste content
Estimated waste extraction by selective mining
Waste remaining in rom coal
Working days per year
Hours per shift
Teams of men
No of producing shifts per week
No of maintenance shifts per week
- 1.39 tons/bank yd3
25%
0.8
1.87 tons/bank yd3
50%
0.67
1.56 tons/bank yd3
15%
0.87
1.87 tons/bank yd3
40%
0.715
2.3 tons/bank yd3
50%
0.67
2.2 tons/bank yd3
50%
0.67
22%
15%
7%
350
8
4
20
1

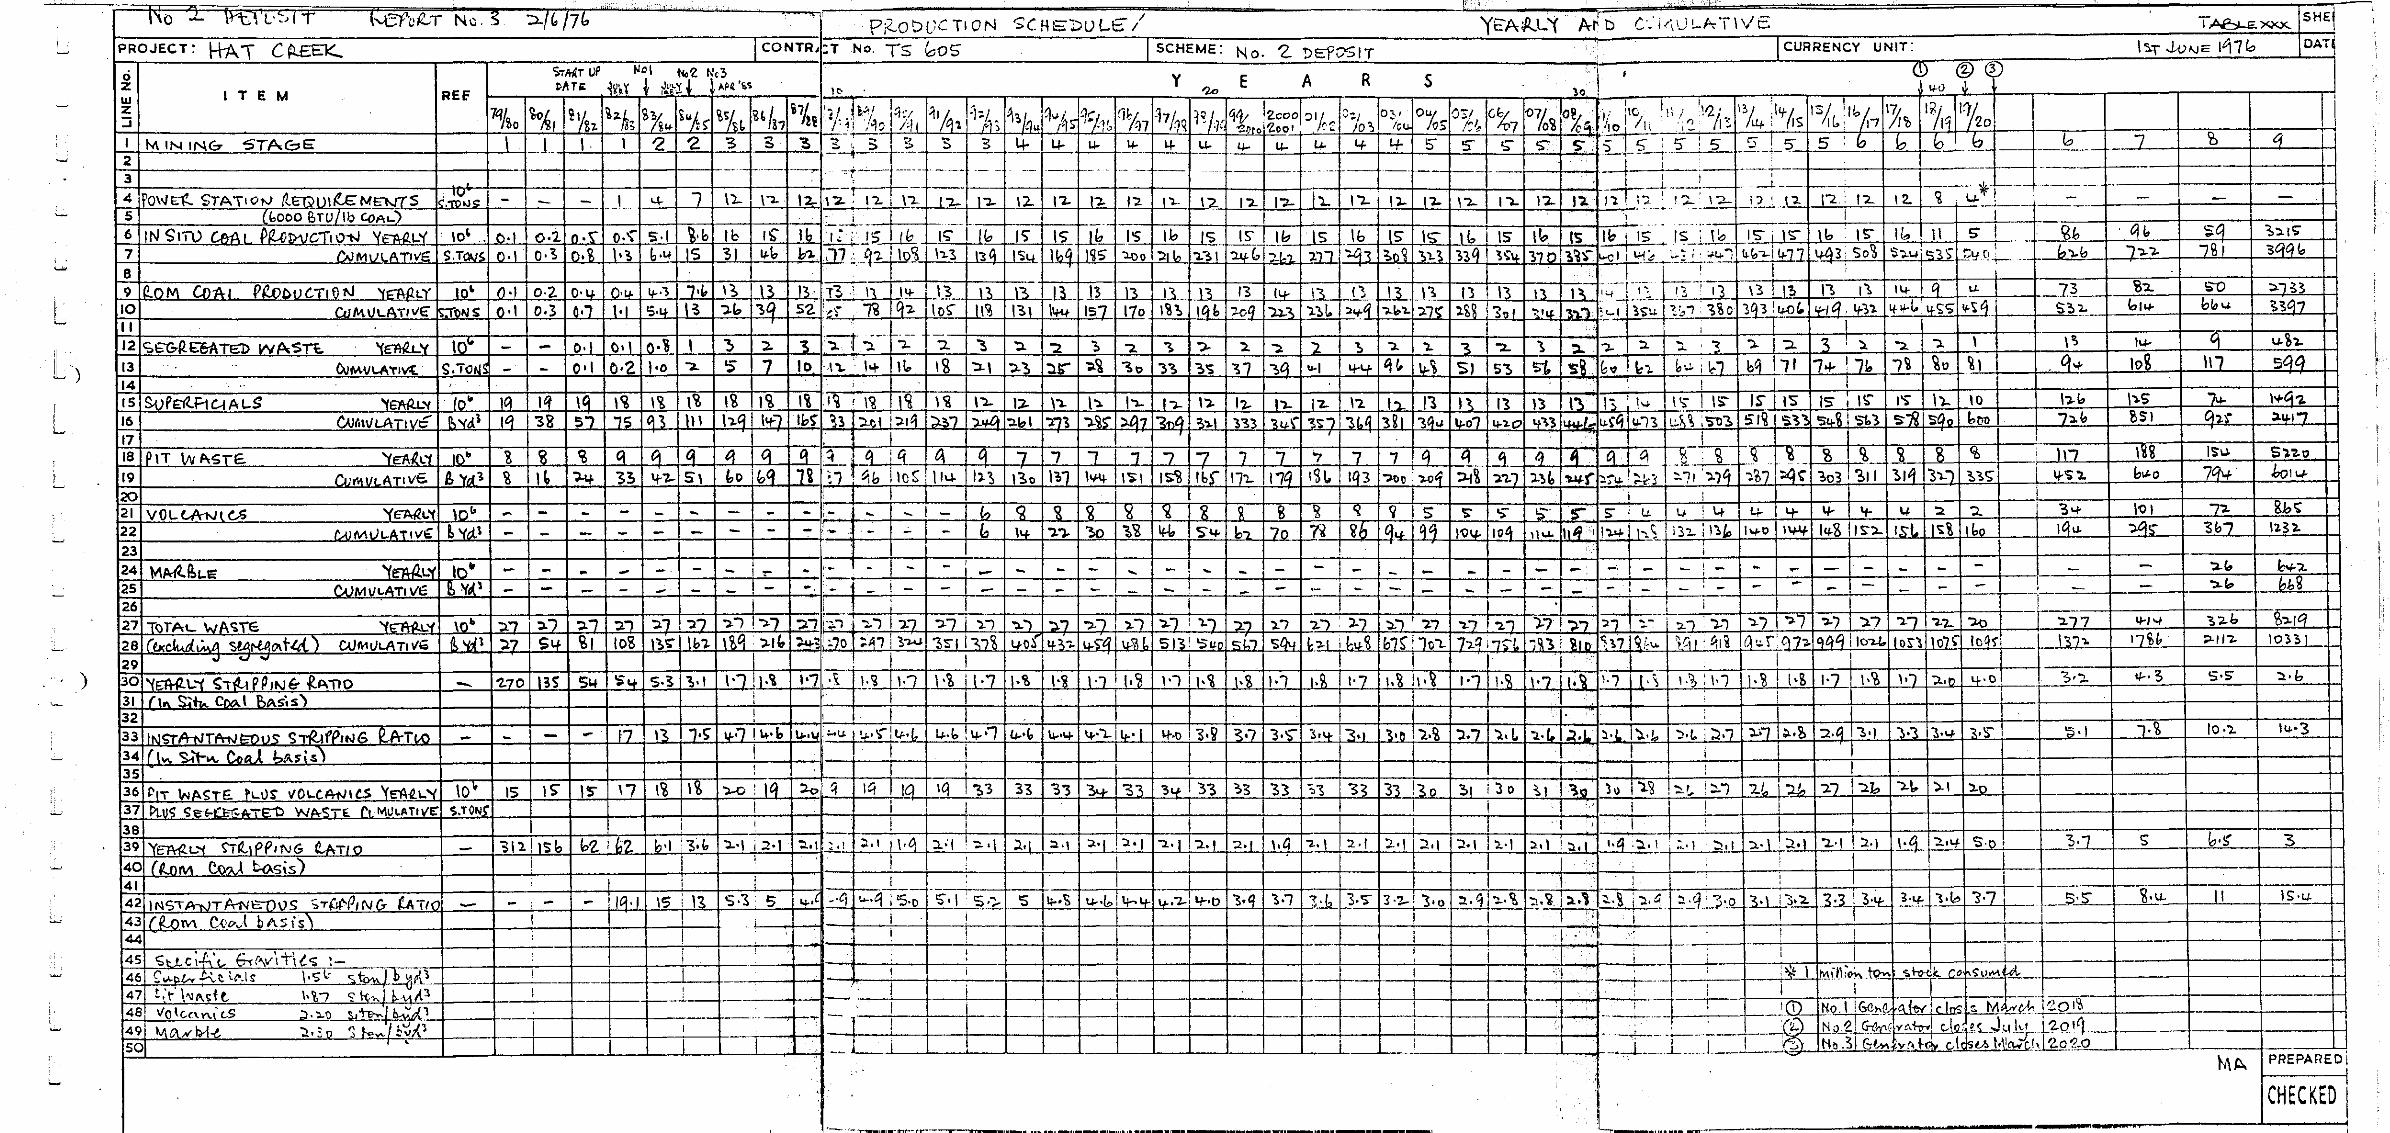
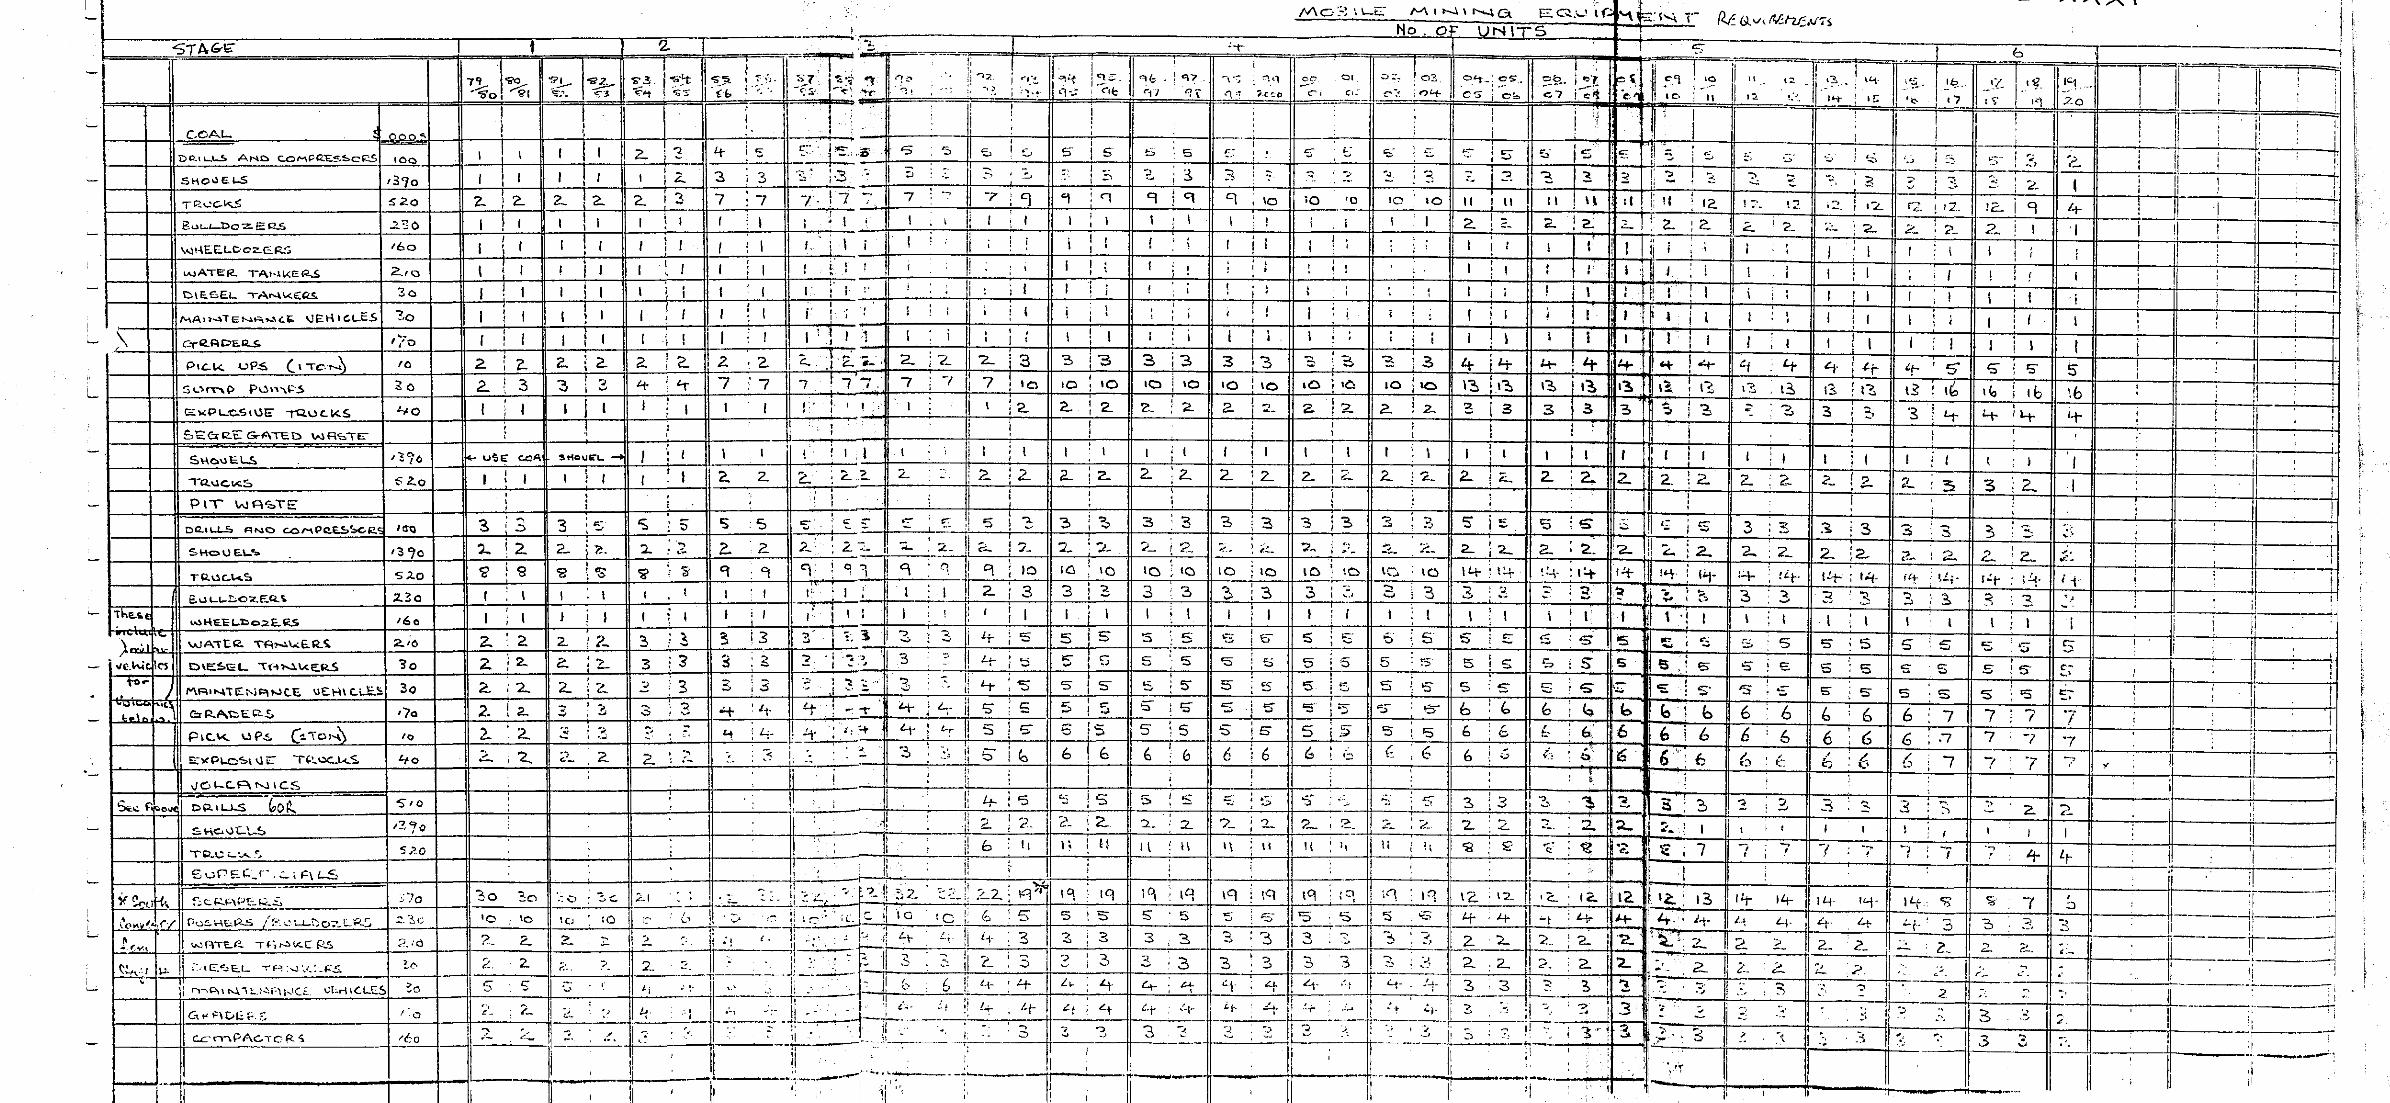
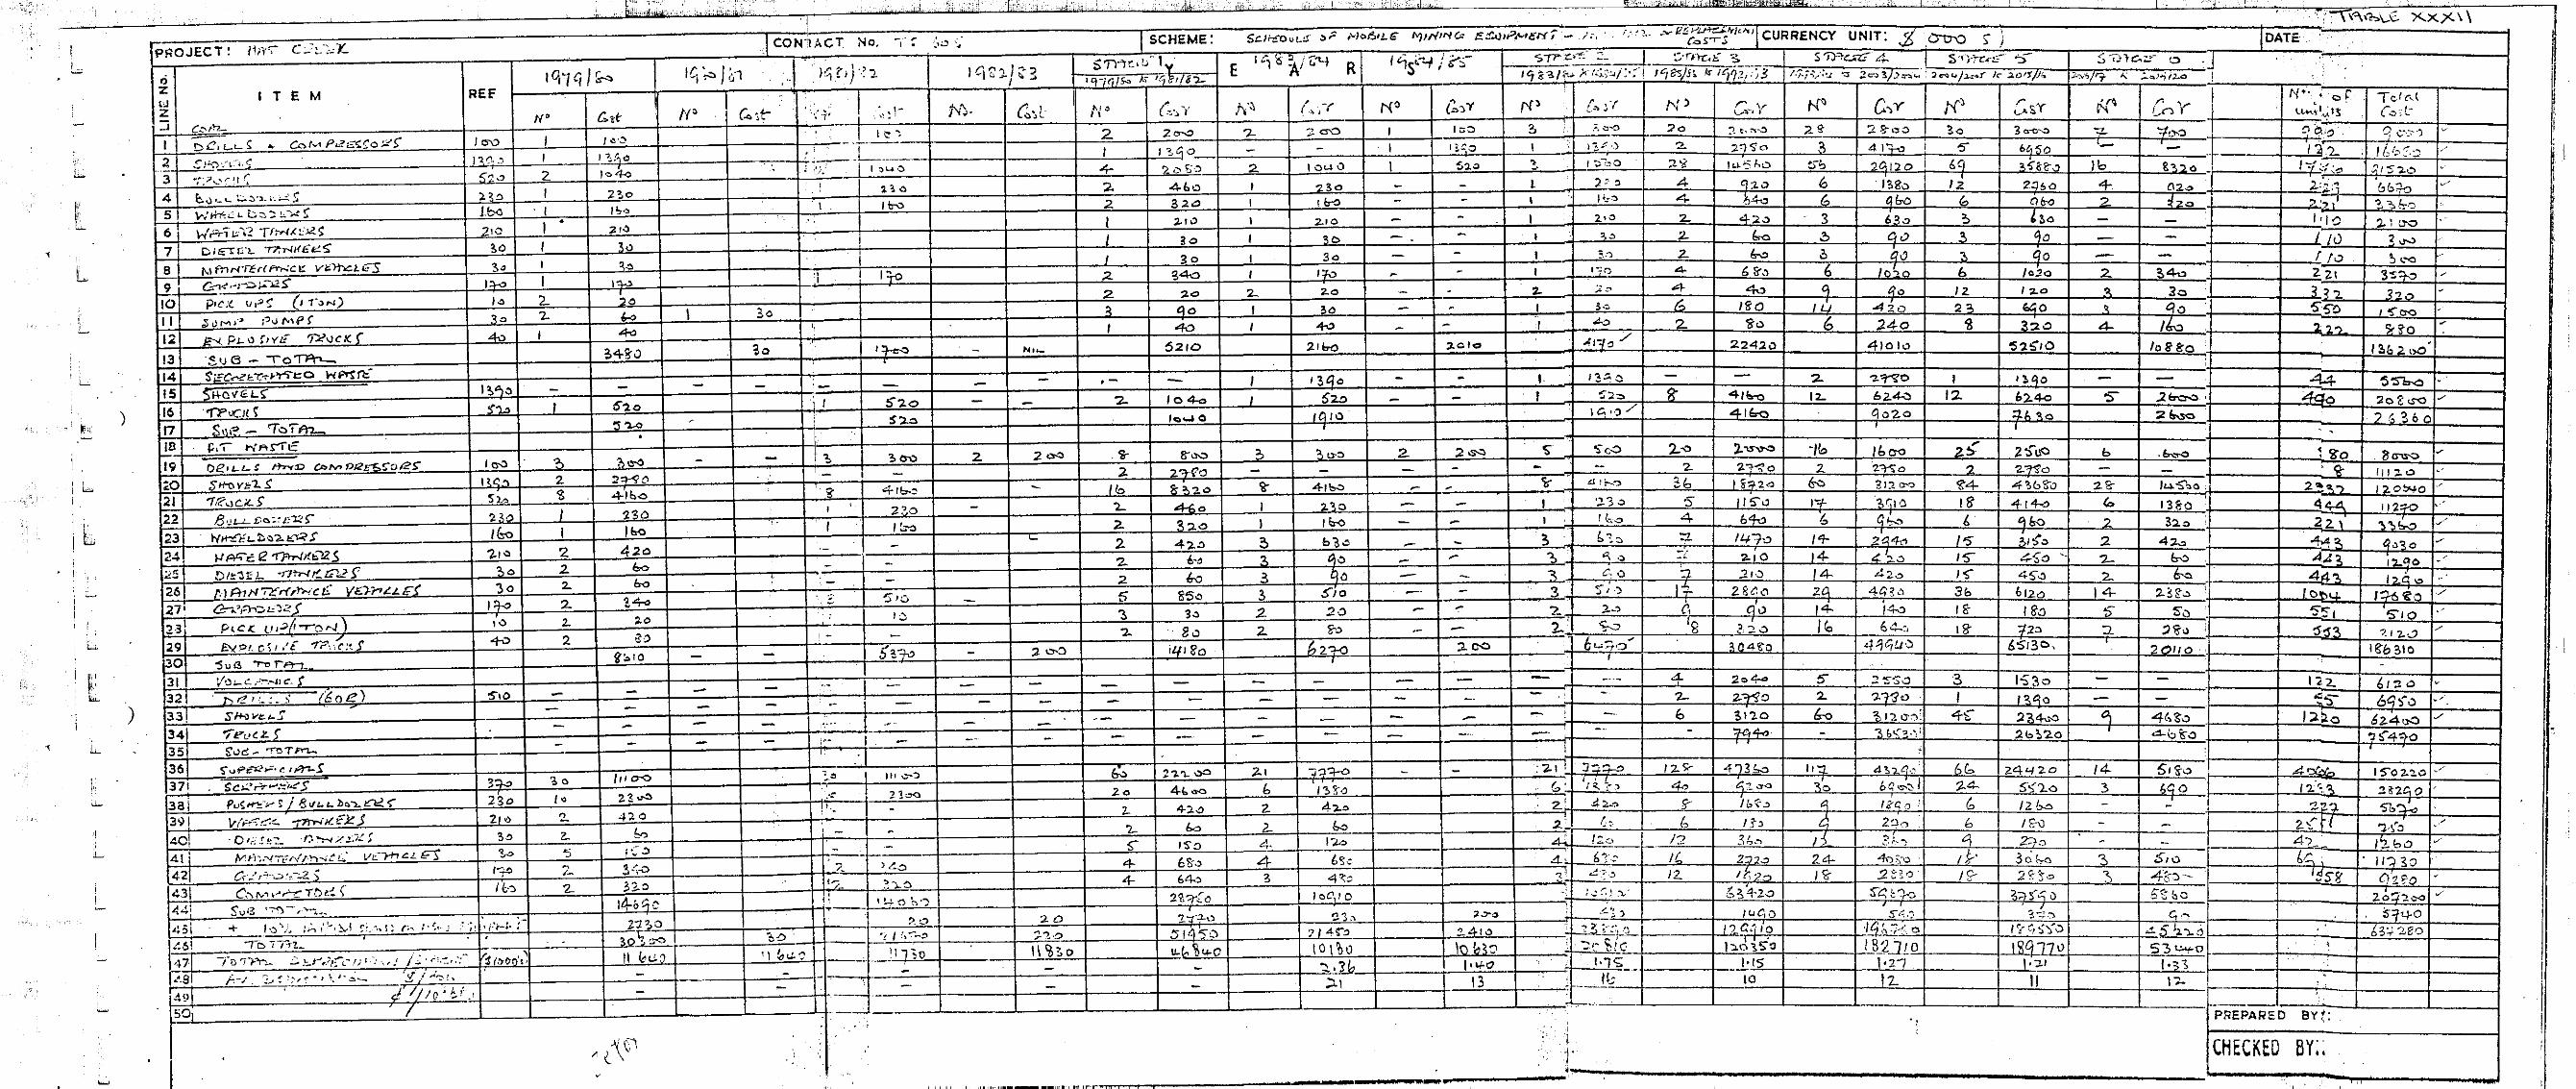
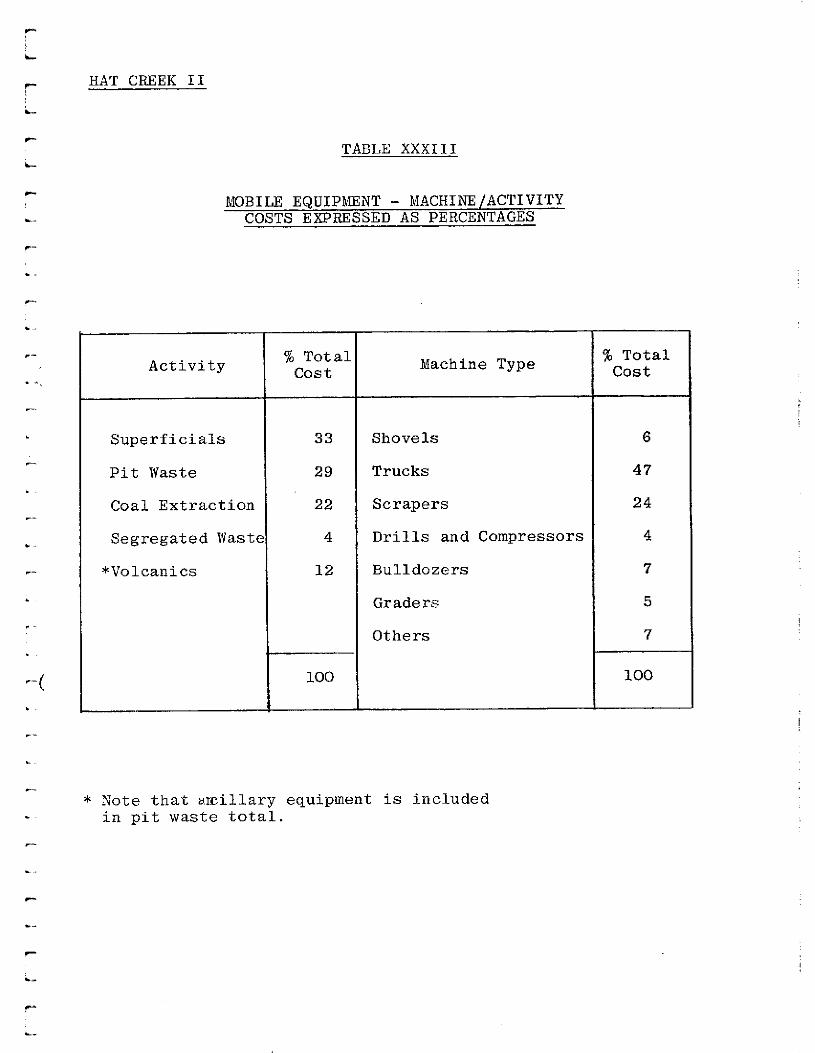
HAT CREEK II
TABLE XXX111
MOBILE EQUIPMENT - MACHINE/ACTIVITY COSTS EXPRESSED AS PERCENTAGES
Activity % Total
cost Machine Type % Total
cost
Superficials 33 Shovels 6
Pit Waste 29 Trucks 47
Coal Extraction 22 Scrapers 24
Segregated Waste 4 Drills and Compressors 4
*Volcanics 12 Bulldozers 7
Graders 5
Others 7
100 100
* Note that ancillary equipment is included in pit waste total.

r TABLE XXXIV L
SCHEDULE OF TYPICAL EQUIP.\IENT
Category Type Manufacturer Model Capacity
Shovel Electric Bucyrus Eyrie 195 15 yd3
Drills ( Compressed air Gardner Denver 3100A 4-in ho~les ( Electric Bucyrus Eyrie 60R 9"-123"holes
Compressors Diesel Gardner Denver SP600 600 ft3/min
Off-highway trucks Diesel Wabco 150 C 117 tons coal
Bulldozers Diesel Caterpillar D9H
Wheeldozers Diesel Caterpillar 824
Graders Diesel Caterpillar 16G
Scrapers- Diesel Caterpillar 666 41 bank yd3
Compactors. Diesel Caterpillar 825
Water tanker Diesel Caterpillar 631 10,000 US gal2
Bucket wheel excavator Electric Knupp 500C 2,000 yd3/hr -
e: The manufacturers' names and model numbers have been given to enable production details and costs to be specified concisely. They are not intended to indicate any preference.
c-
.
-_
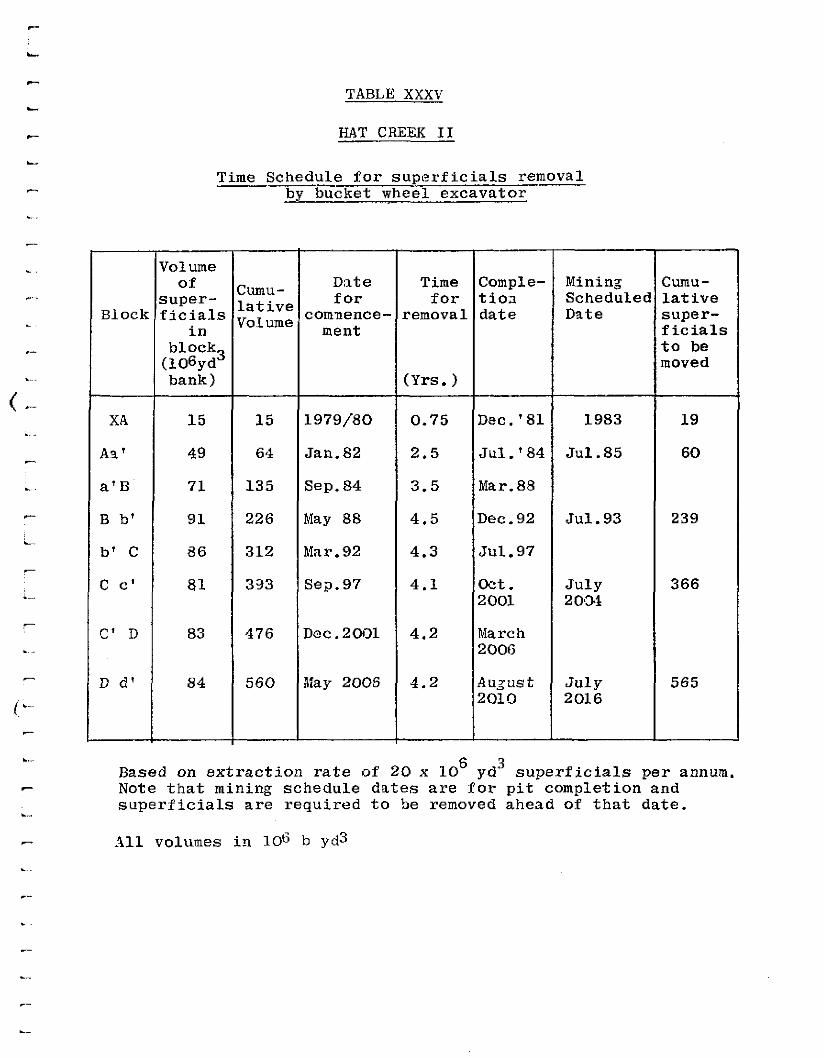
Block
XA
Aa'
a'B
B b'
b' C
c c'
C' D
D d'
TABLE XXXV
BAT CREEK II
Time Schedule for superficials removal by bucket wheel excavator
--
lolume of :umu-
Date Time Comple- Mining hmu- iuper- lative for for tio3. Scheduler Lative licials lolume comaence- removal date Date super-
bl::k ment Iicials
:106yd3 ;o be loved
bank) LYrs. )
15 15 1979/80 0.75 Dec.'81 1983 19
49 64 Jan.62 2.5 Jul.'84 Jul.85 60
71 135 Sep. 84 3.5 Mar.88
91 226 May 88 4.5 Dec.92 Jul.93 239
66 312 Mar.92 4.3 Jul.97
81 393 Sep.97 4.1 Oct. July 366 2001 20,3*
83 476 Dec.2001 4.2 March 2006
84 560 Xay 2006 4.2 Au&ust July 565 2010 2016
Based on extraction rate of 20 x lo6 yd3 superficials per annum, Note that mining schedule dates are for pit completion and superficials are required to be removed ahead of that date.
111 volumes in 106 b yd3
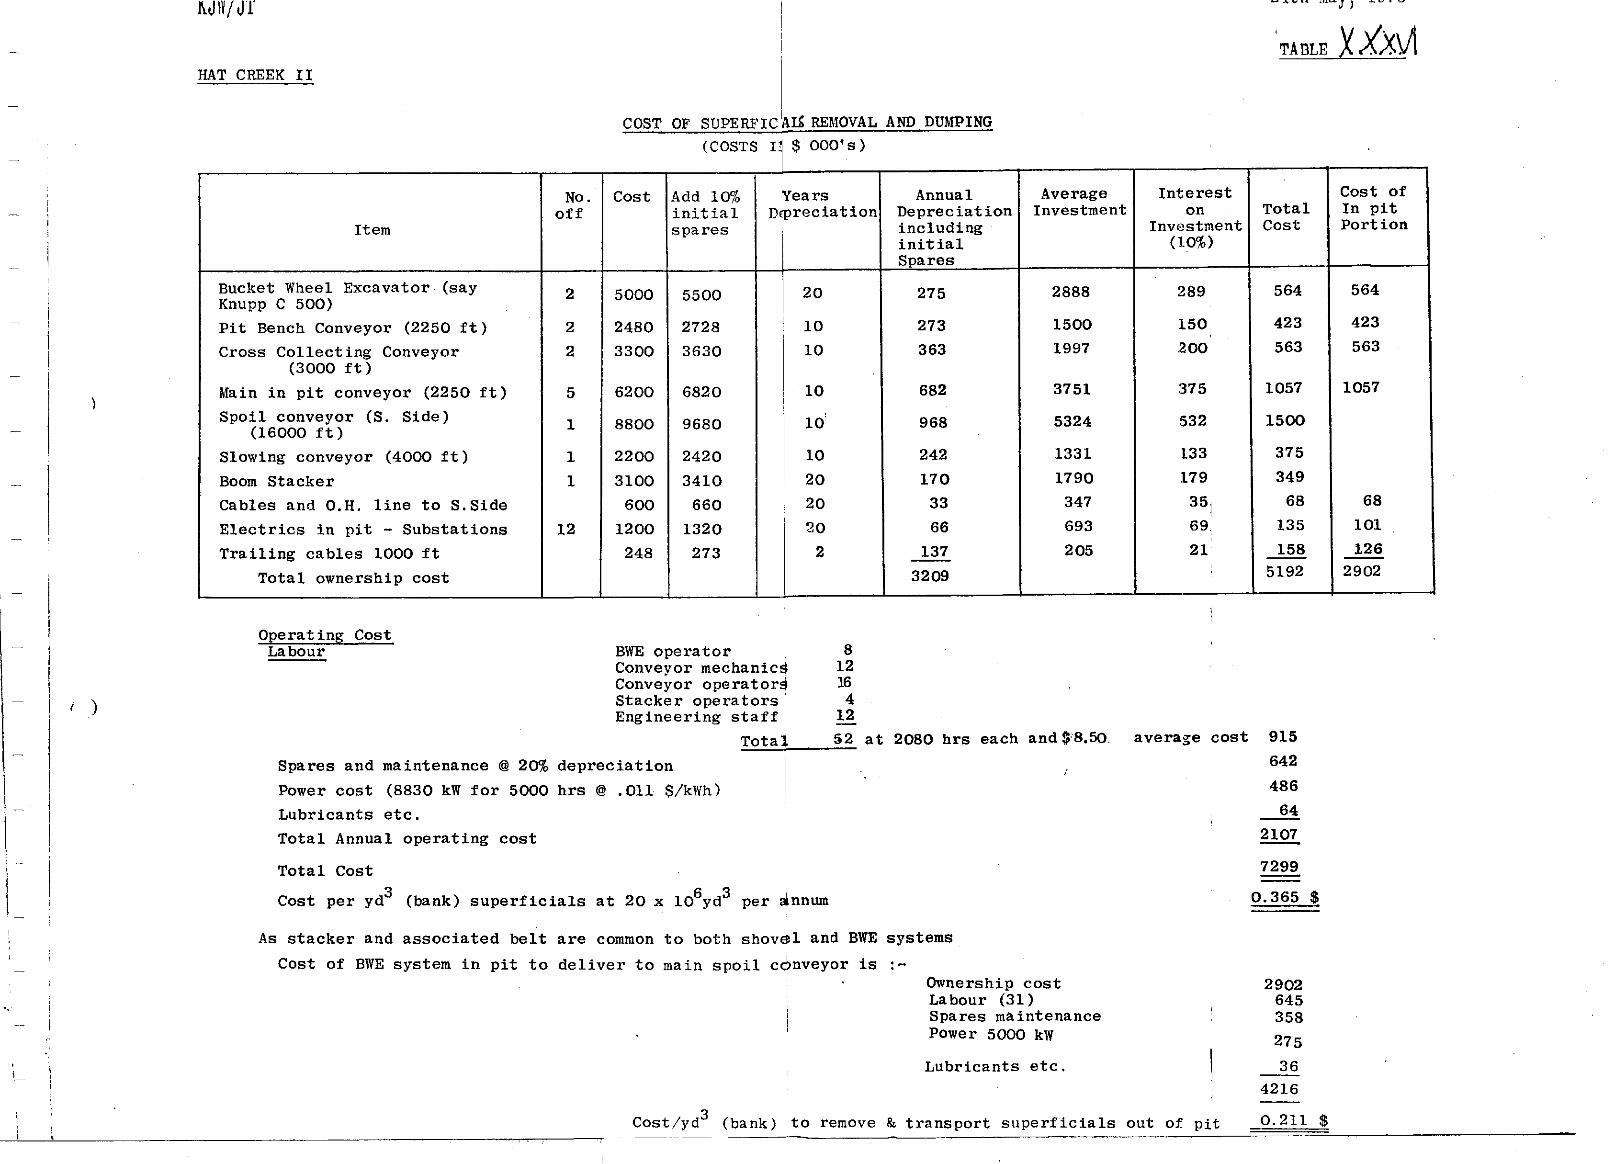
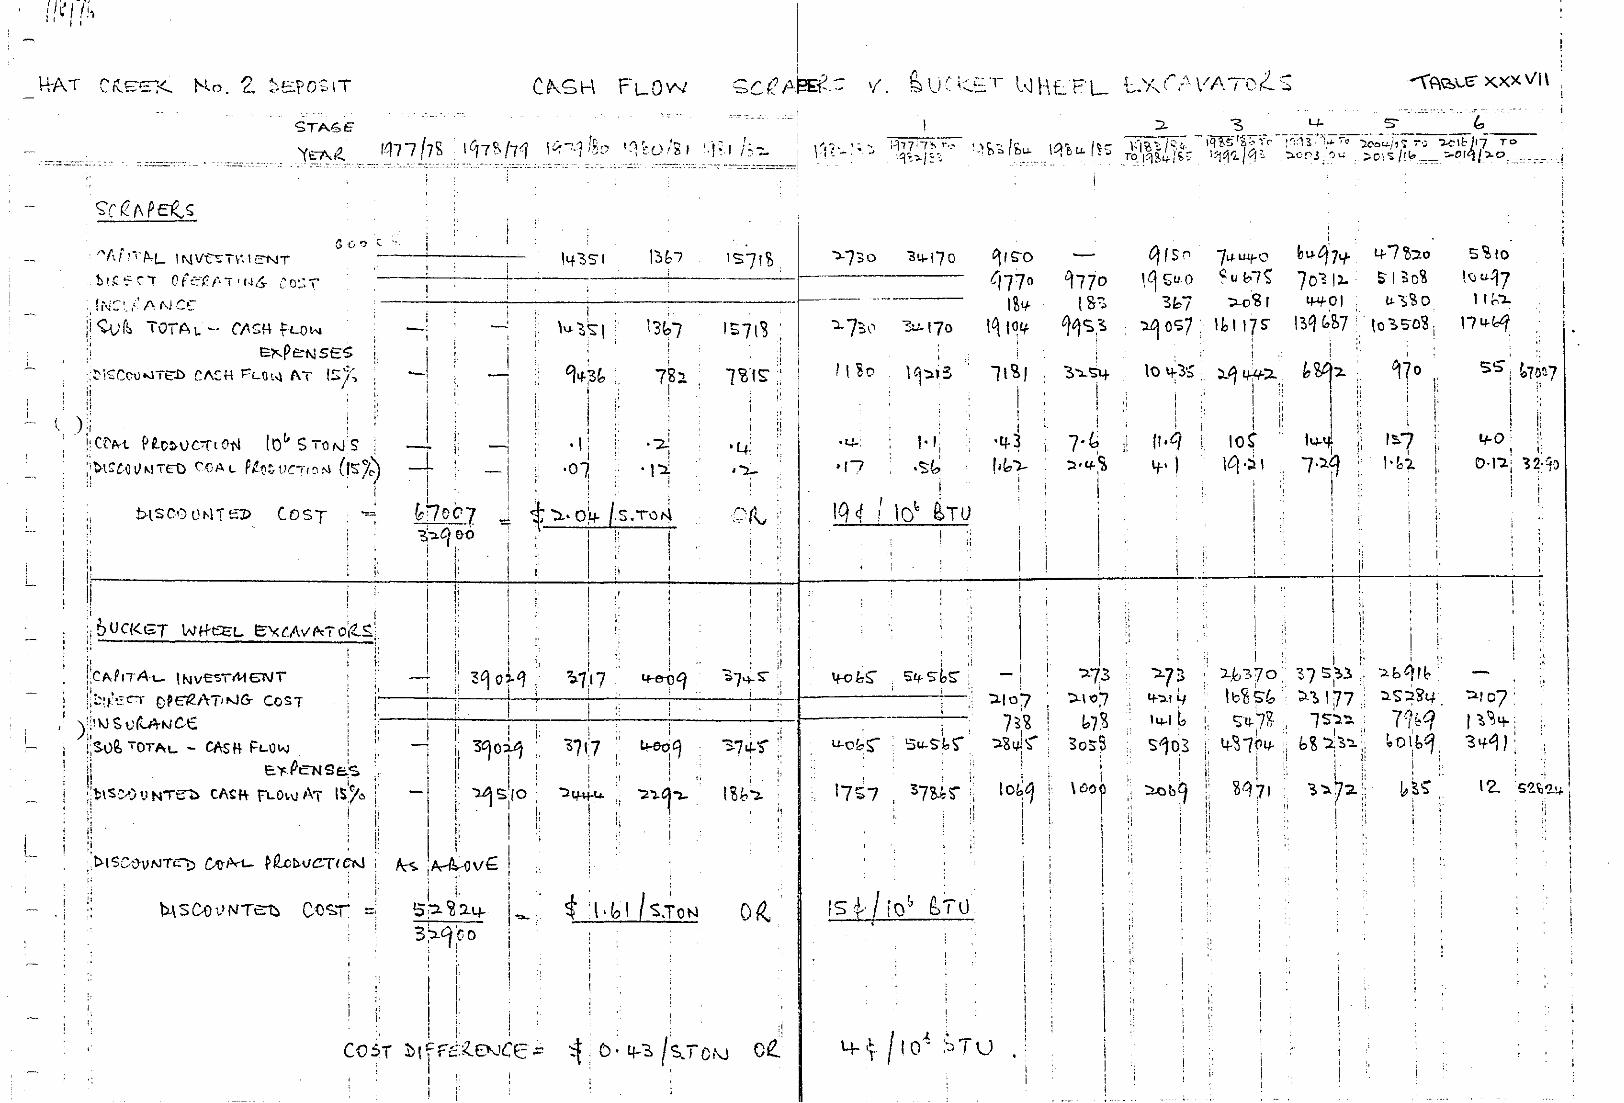

TABLE XXXVIII
COAL REQUIREMENTS FOR DIFFERENT DEGREES OF WASHING - BASED ON LORING TESTS ON --
SAMPLE FROM BOREHOLE NO 75-74
At boilers:
Calorific value, (Btu/lb)
Moisture, %
Ash, %
Boiler feed requirement, (lo6 tpa:
At washery:
Estimated yield, %
Was ery rejects, % (10 tpa)
Washery feed (ie ram) requirement, (lo6 tpa:
In pit:
Pit rejects, (lo6 tpa)*
In-situ coal requirement (lo6 tpa)'
r F a Lam coal as tssumed in ;his report ,unwashed)
Laboratory Sample
Jnwashec 1 p Vashing tc lashing to 15% ash 10% ash
5,500 6,700 8,000 8,800
20 20 20 20
32 22.4 15 10
13.1 10.7 9.0 8.2
100 100 80 56
0 0 2.3 6.4
13.1 10.7 14.6
2.3 1.9 2.6
15.4 12.6
11.3
2.0
13.3 17.2
* based on same selective mining as discussed in Chapter III
1
Note : Sample (dry basis):-
cv - 8,400 Btu/lb Ash - 28%
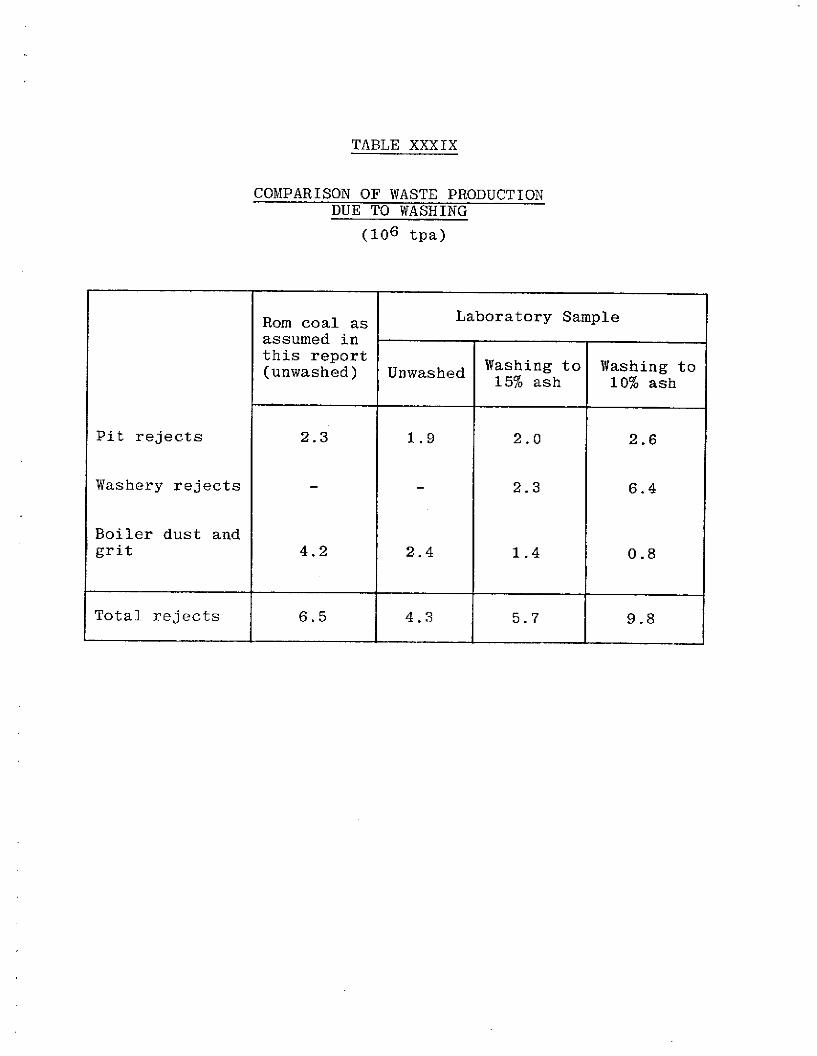
TABLE XXXIX
Pit rejects
Washery rejects
Boiler dust and grit
1 Total rejects
COMPARISON OF WASTE PRODUCTION DUE TO WASHING
(106 tpa)
Rom coal as assumed in this report (unwashed)
Laboratory Sample
Unwashed Washing to Washing to 15% ash 10% ash
2.3 1.9 2.0 2.6
2.3 6.4
4.2 2.4 1.4 I
0.8
6.5 4.3

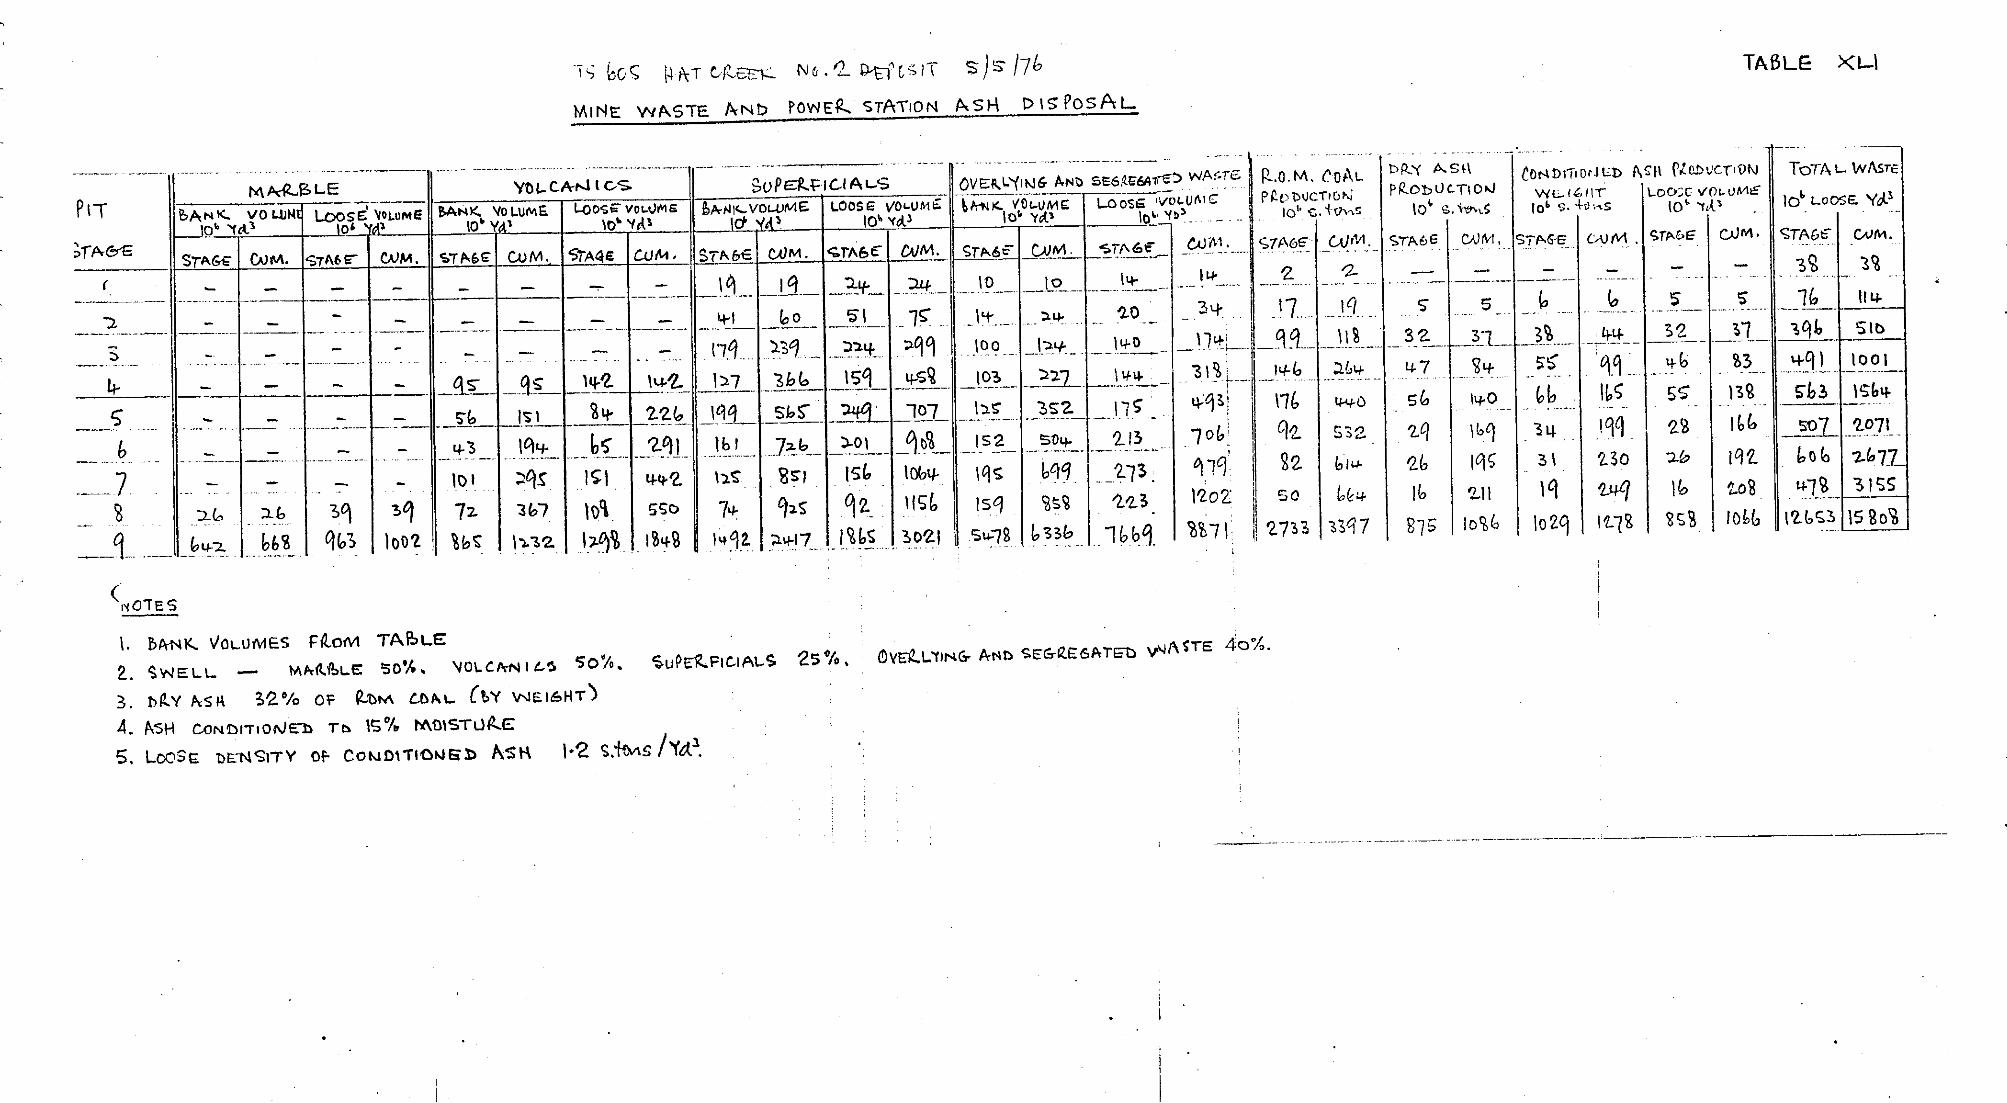

3,300-3,400
3,400-3,500
3,500-3,600
3,600-3,700
3,700-3,800
3,830-3,900'
3,900-4,000
~1 4,000-4,100
d _, loo-4,200;
11
21
27
33
36
No. No. r- r- 3 Dump 3 Dump iler-ation iler-ation
(ft (ft Elev. Elev. CLlIll.
3,200-3,300 - 3,200-3,300 -
TABLE XLII __-.~-
TOTAL DUKPING SP:1CE Al'A1LABI.E Units - 10Tyd"
- 1, -
11
32
59
92
128
128
128
12s
128
128
-
3 I
I I
-
\Jo. 4 Dump No. 5 Dump T Clev
8
29
52
100
143
197
244
307
-
1,080 331
L,OSO 434
1,080 528
1,080 604
1,080 676
---
- I 1
1
2
2
-
CUBI
21
126
7 j 0 .>
671
,105
,633
,237
,913
t
Yo. 6 Duq
Tlev aml.
1
13
50
99
143
193
247
1
14
64
L63
306
k99
'46
Total
Zlev. CUEl.
8 8
29 37
52 89
111 200
164 364
245 609
383 992
570 ,562
381 ,943
533 ,476
671 ,147
797 ,944
923 ,867
ISfer to Plete 77

TABLE XL111 -
DU?;IPING SPACE AVAILABLE IN DUWS 4 A?;D 5
Units - 106 yd3
Elevation (ft)
3,200-3,300
3,300-3,400
3,400-3,500
3,500-3,600
3,600-3,700
3,700-3,800
3,800-3,900
3,900-4,000
4,000-4,100
4,100-4,200
4,200-4,300
4,300-4,400
4,400-4,500
-
Dump No. 4
- I
Elev. CUIll. Elev. CUm. Elev. Cum.
8
29
52
100
143
197
244
307
8
37
89
189
332
529
773
1,080
1,080
1,080
1,080
1,080
1,080
21 21
105 126
214 340
331 671
434 1,105
528 1,633
604 2,237
676 2,913
8 8
29 37
52 89
100 189
143 332
218 550
349 899
521 1,420
331 1,751
434 2,185
528 2,713
604 3,317
676 3,993
Dump h'o. 5 Total
Refer to Plate 78
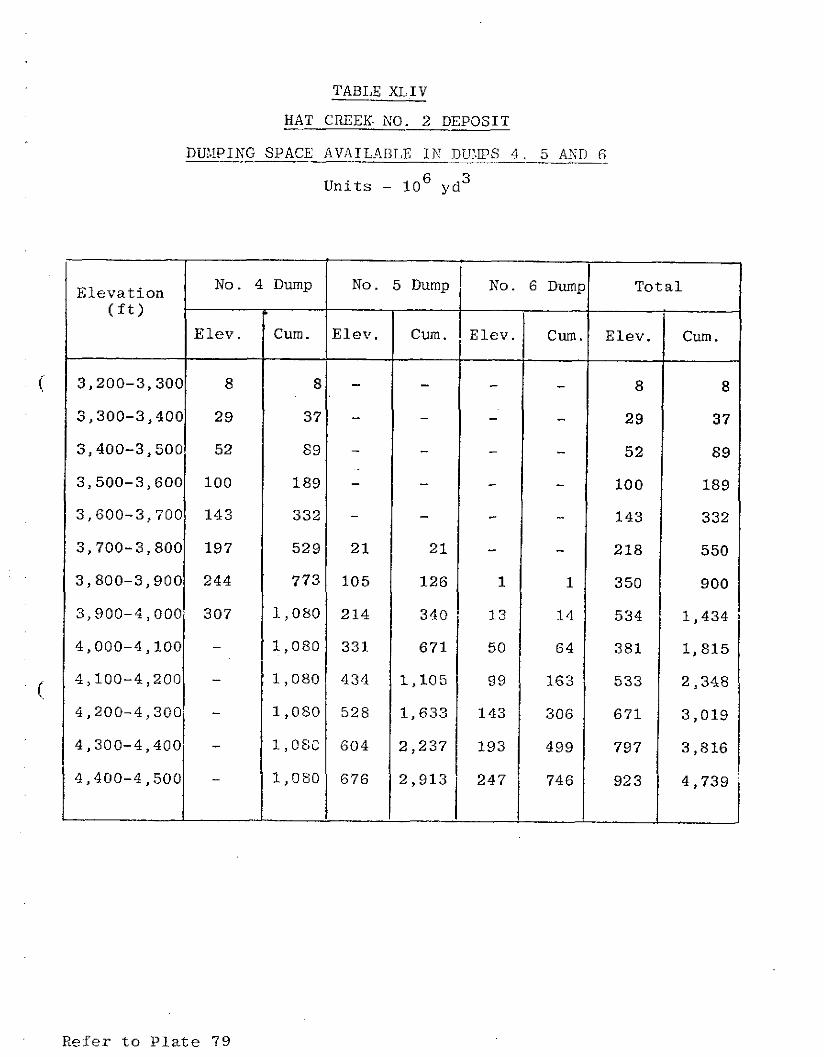
TABLE XLIV
HAT CREEK- MO. 2 DEPOSIT
DiJI.!PING SPACE AVAIL.kBLE IK Dmm 4, 5 AzD 6 ---~-
Units - 106 yd3
Elevation No. 4 Dump
(ft) F Elev.
t
3,200-3,300 8
3,300-3,400 23
3,400-3,500 52
3,500-3,600 100
3,600-3,700 143
3,700-3,800 197
3,800-3,900 244
3,900-4,000 307
4,000-4,100 -
?,lOO-4,200 -
Cum.
8
37
89
189
332
529
773
1,080
1,080
1,080
1,080
1,082
1,080
No. 5 Dump
CUn.
-
21 21
105 126
214 340
331 671
434 1,105
528 1,633
604 2,237
676 2,913
-
i
I
-
No. 6 Dun
-
P I - -
Elev. Chill Elev. Cum.
1
13
50
93
143
193
247
I -
1
I4
64
163
306
499
746
8 8
29 37
52 89
100 189
143 332
218 550
350 900
534 1,434
381 1,815
533 2,348
671 3,019
737 3,816
923 4,733
Total
i
Refer to Plate 79

TABLE XLV
HAT CREEK DIVERSION - ESTIMATED COST
Amount $
Ponding dam and spillway
Dam outlet culvert
Western canal
Pit-wall conduit
Eastern and southern ditches
Sub-total
Engineering and contingencies ?25%
Total
350,000
60,000
1,775,ooo
76,000
50,000
2,311,OOO
579,000
2,890,OOO
Notes: 1. The amount included for the western canal provides for a one-lane maintenance road adjacent to the canal. Widening of this road for the relocation of the Hat Creek road would cost an additional $200,000, very approximately.
2. It is emphasised that these estimates are very approximate due to lack of detailed hydrological, topographic and geological information.
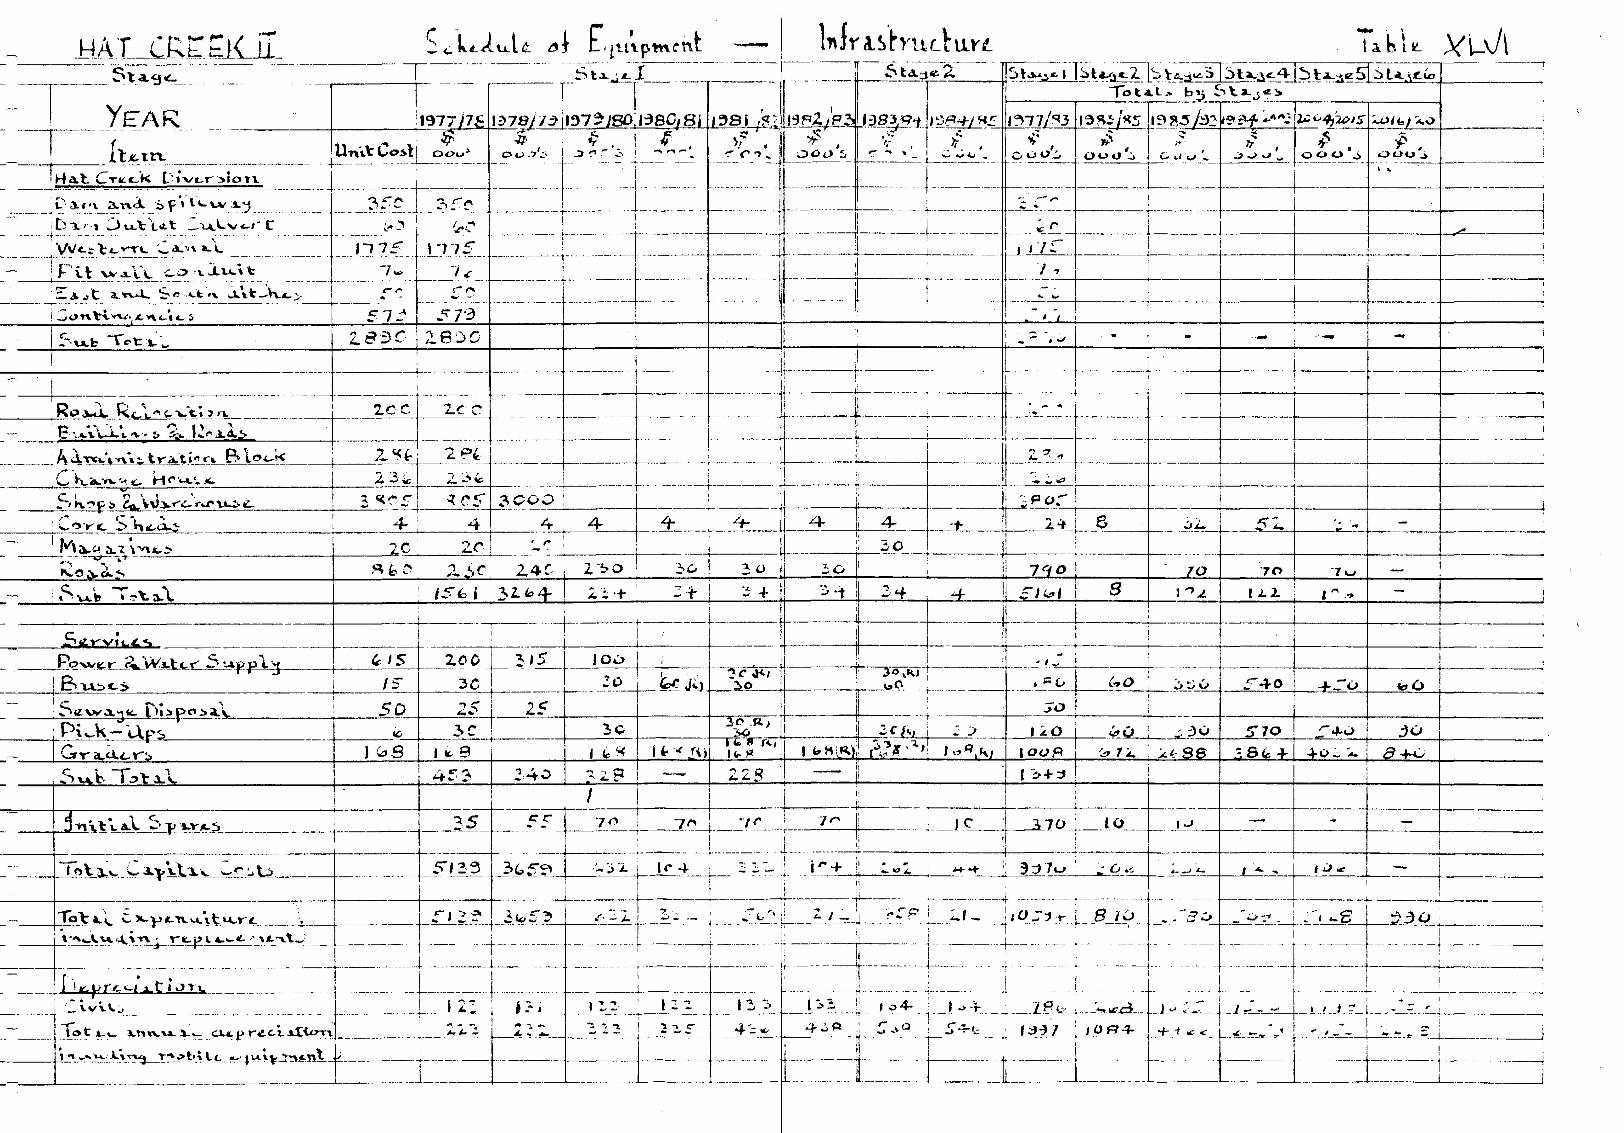
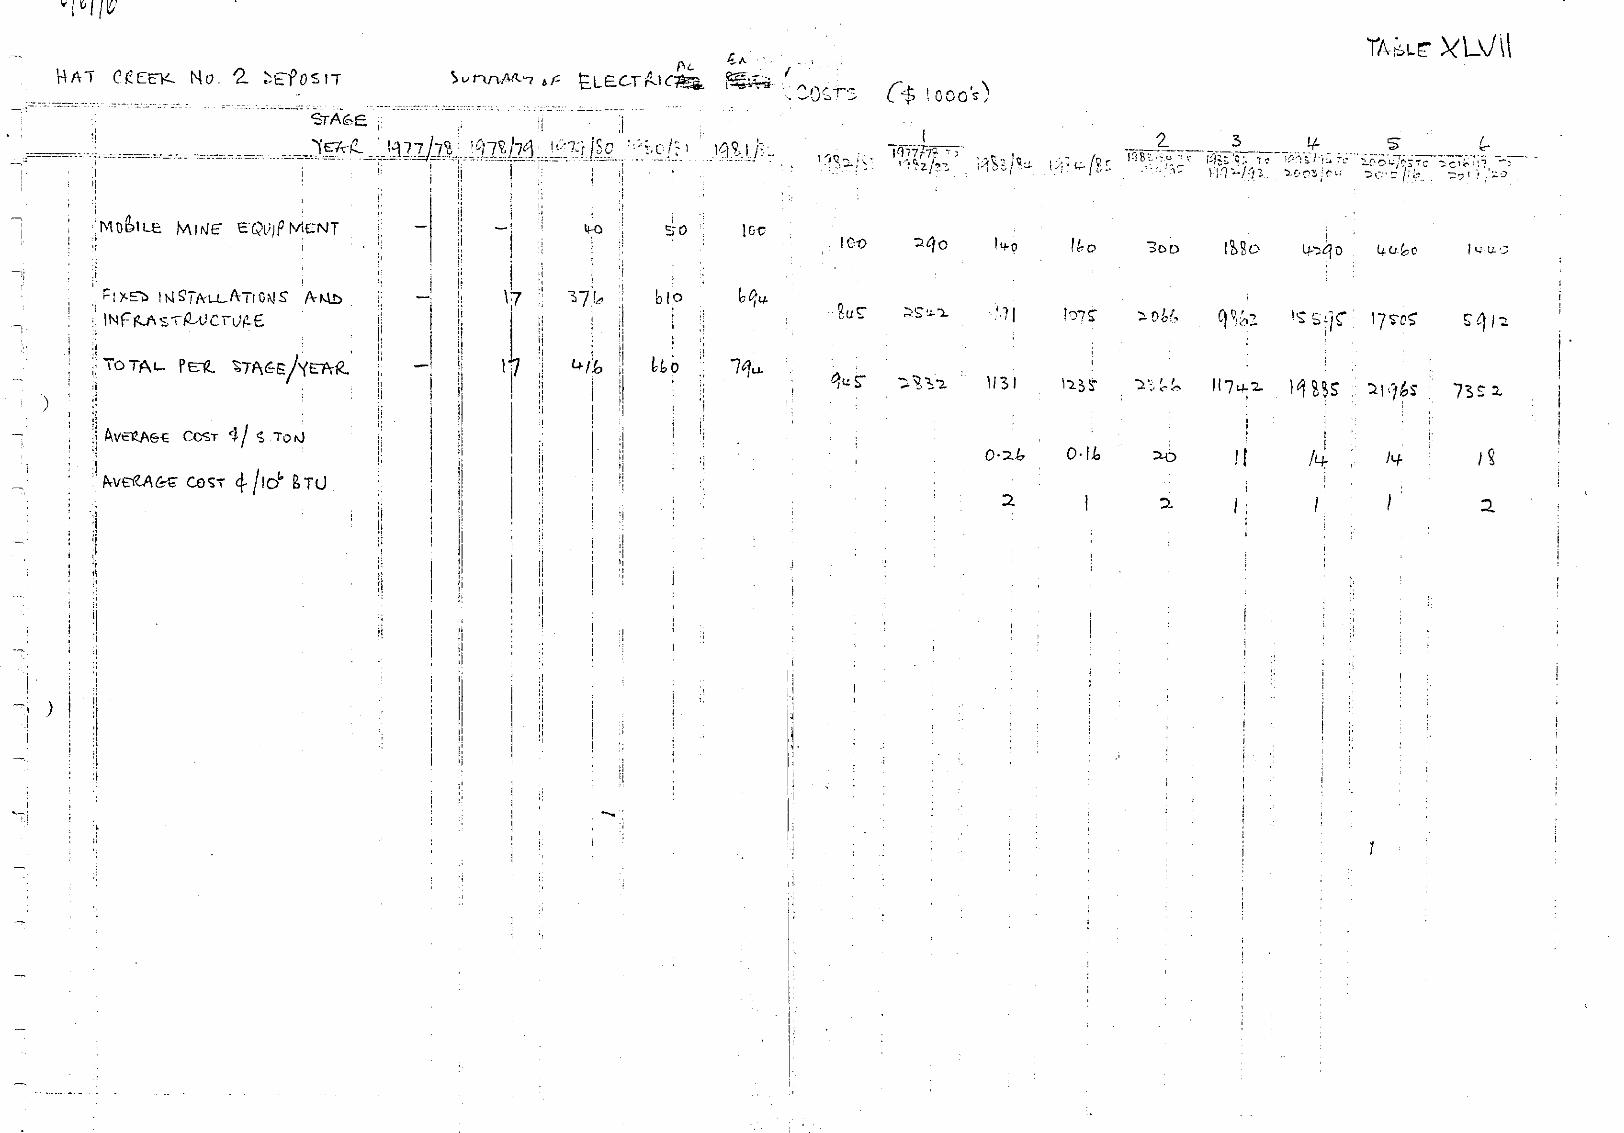
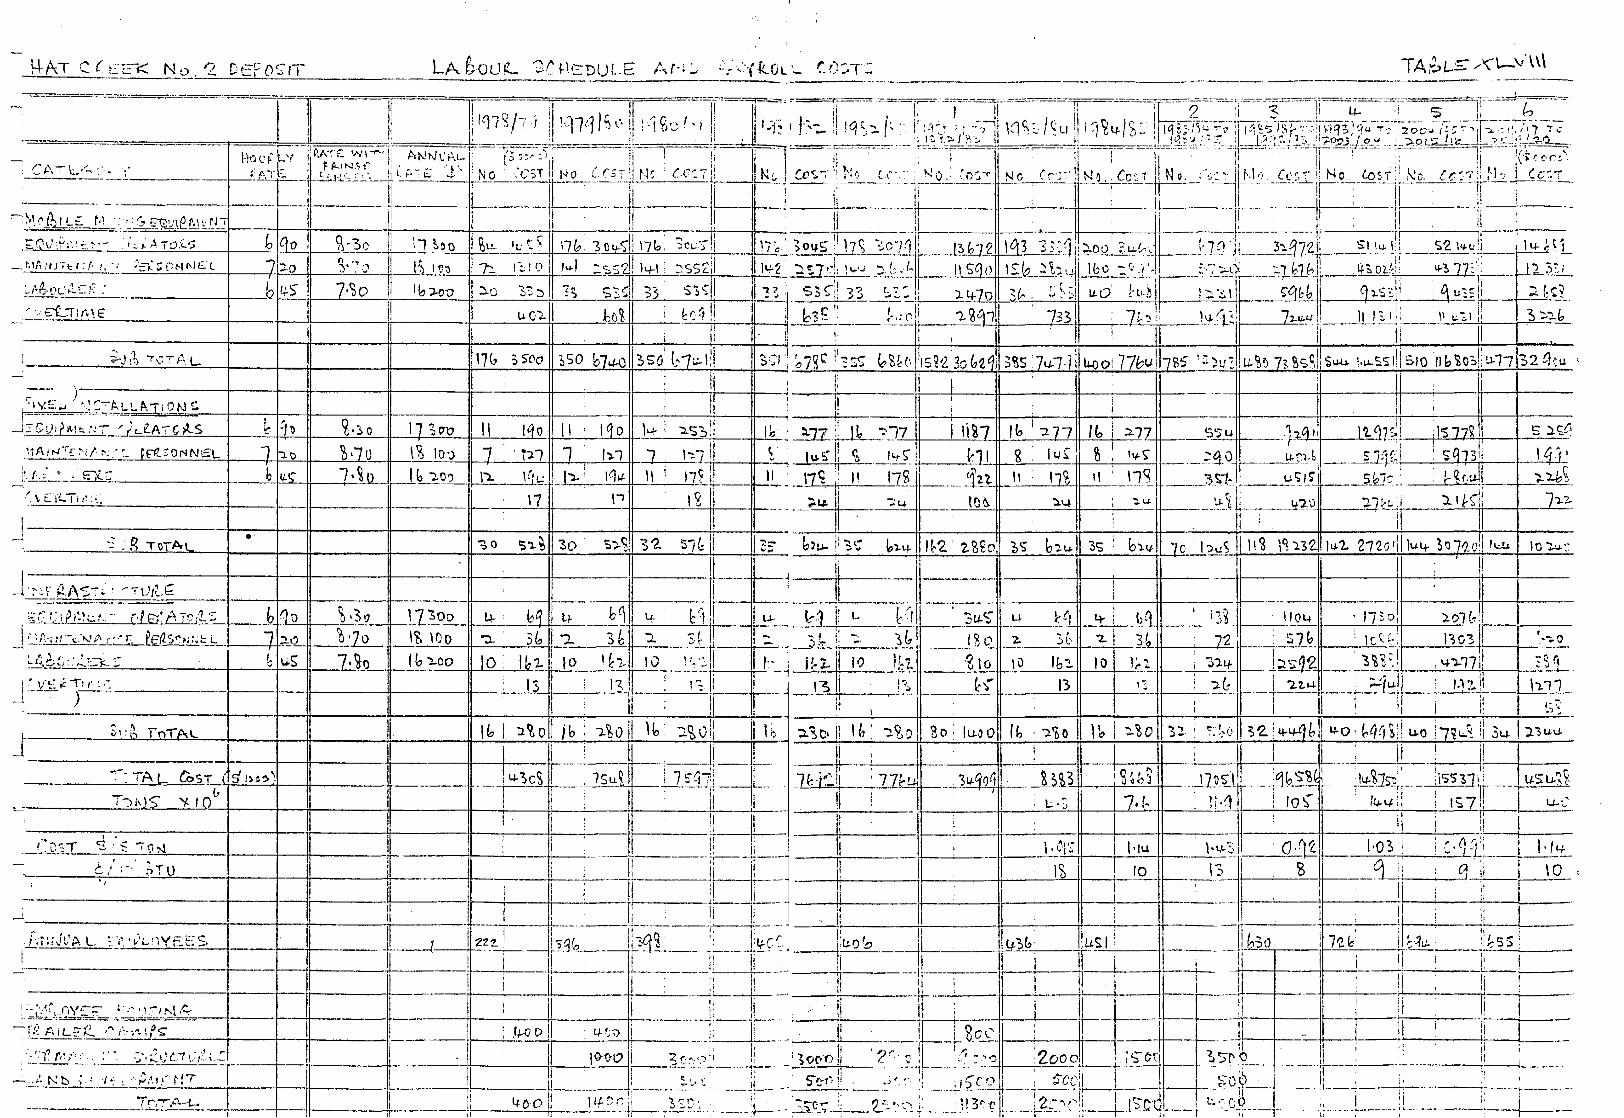
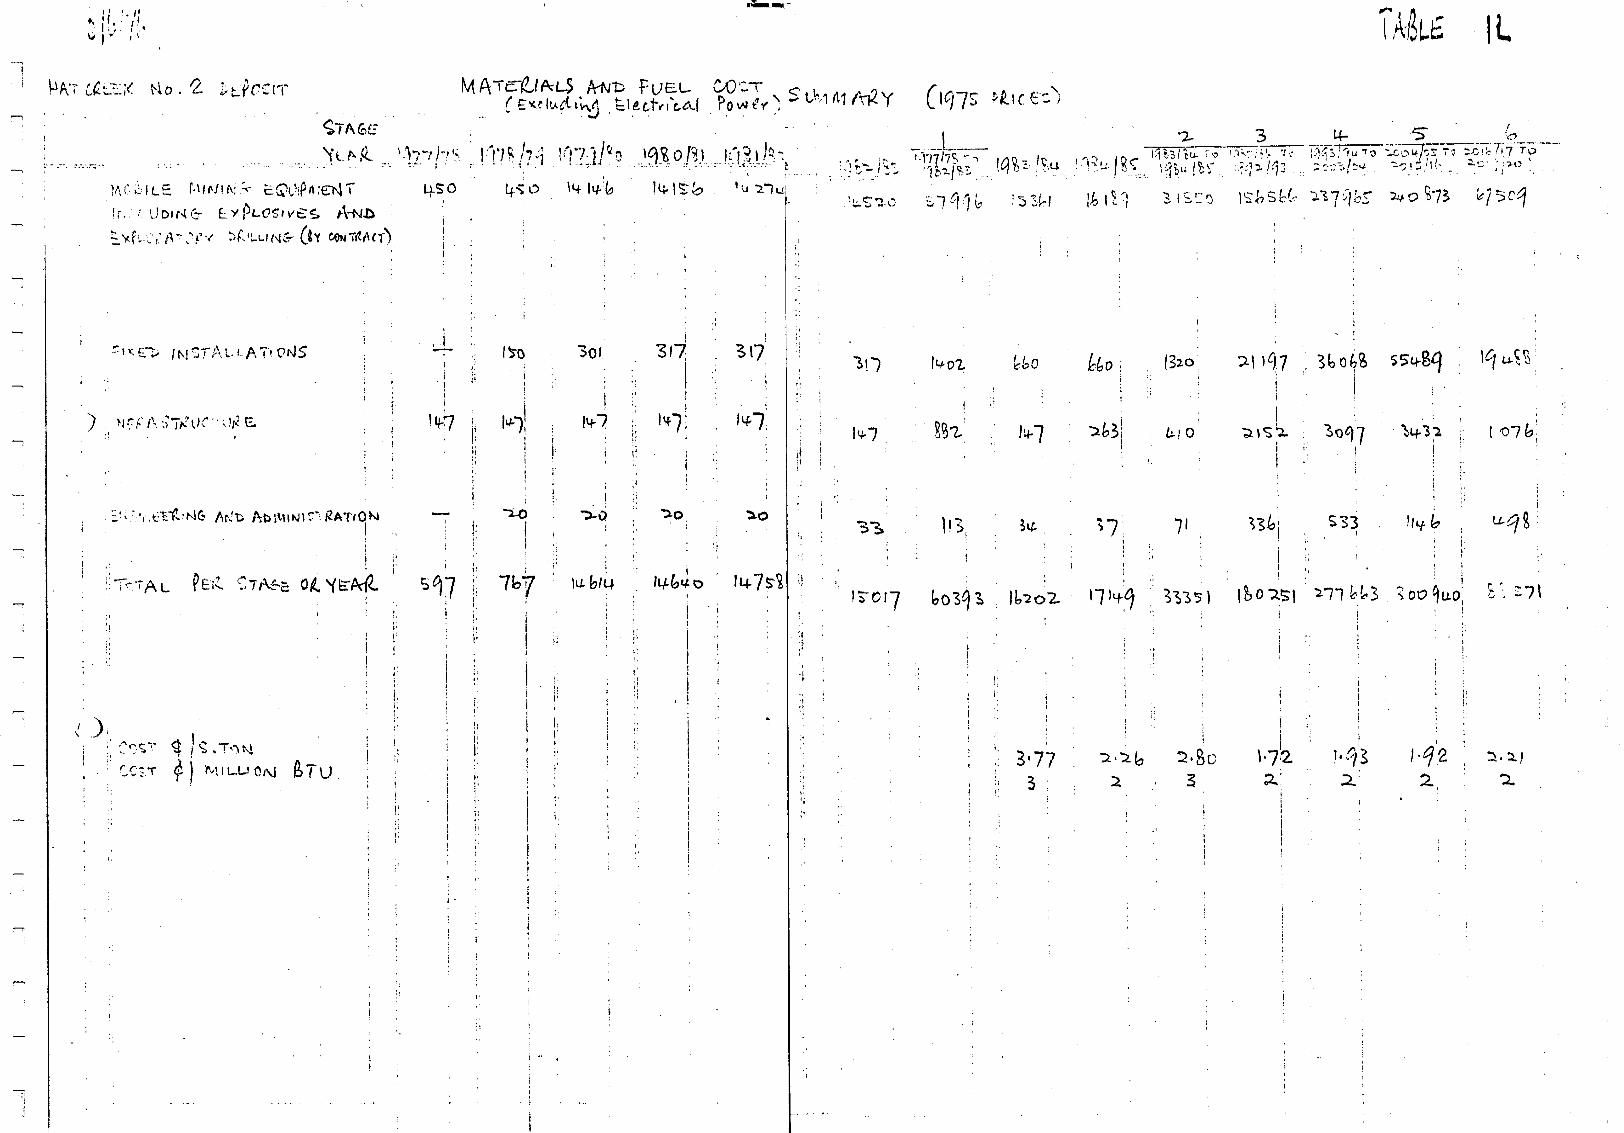


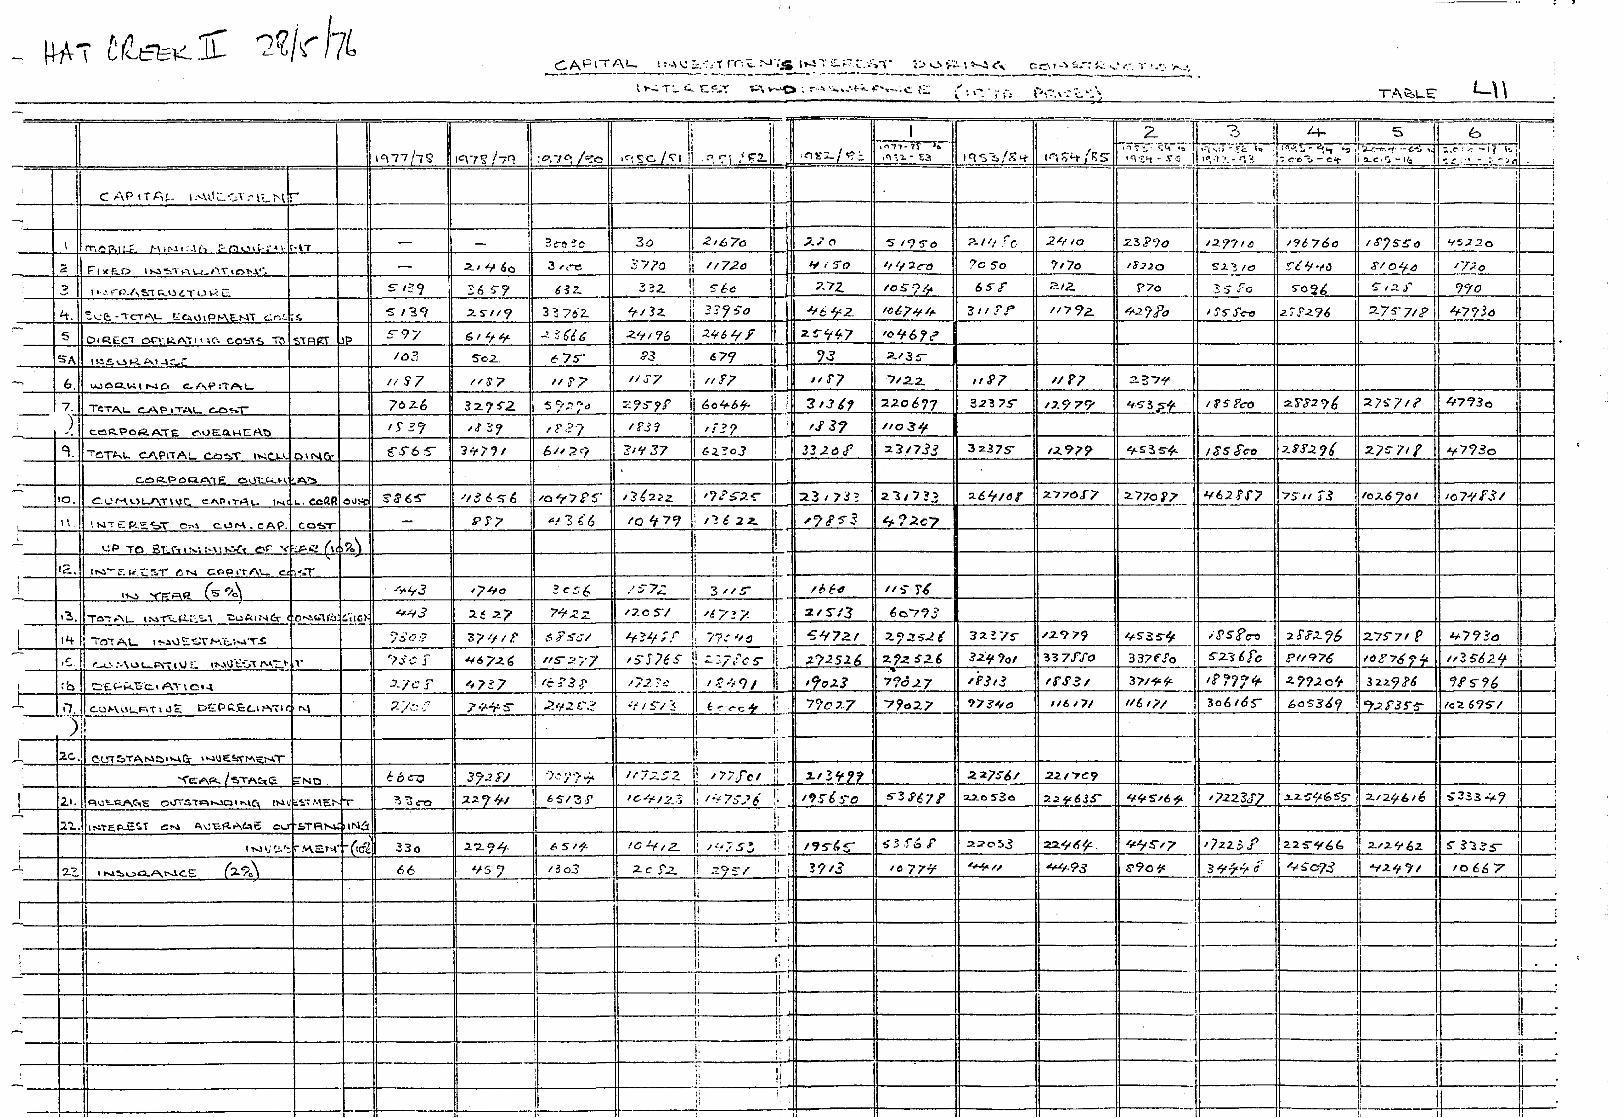

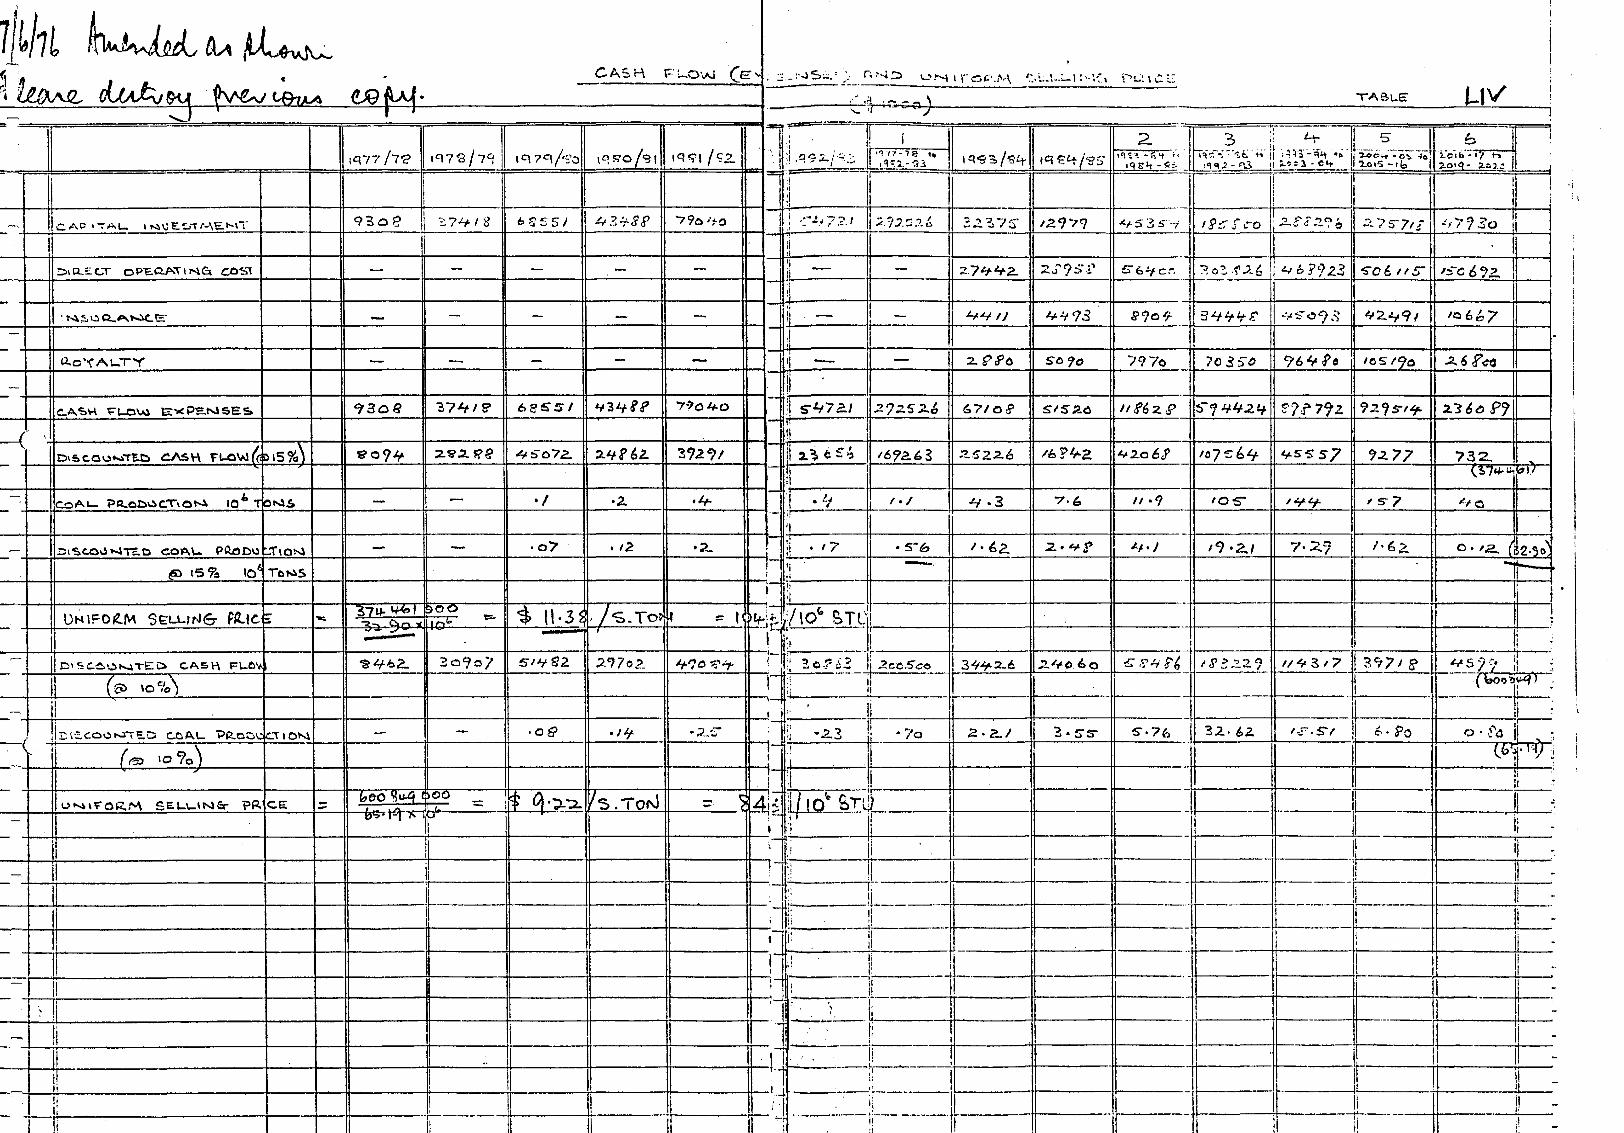
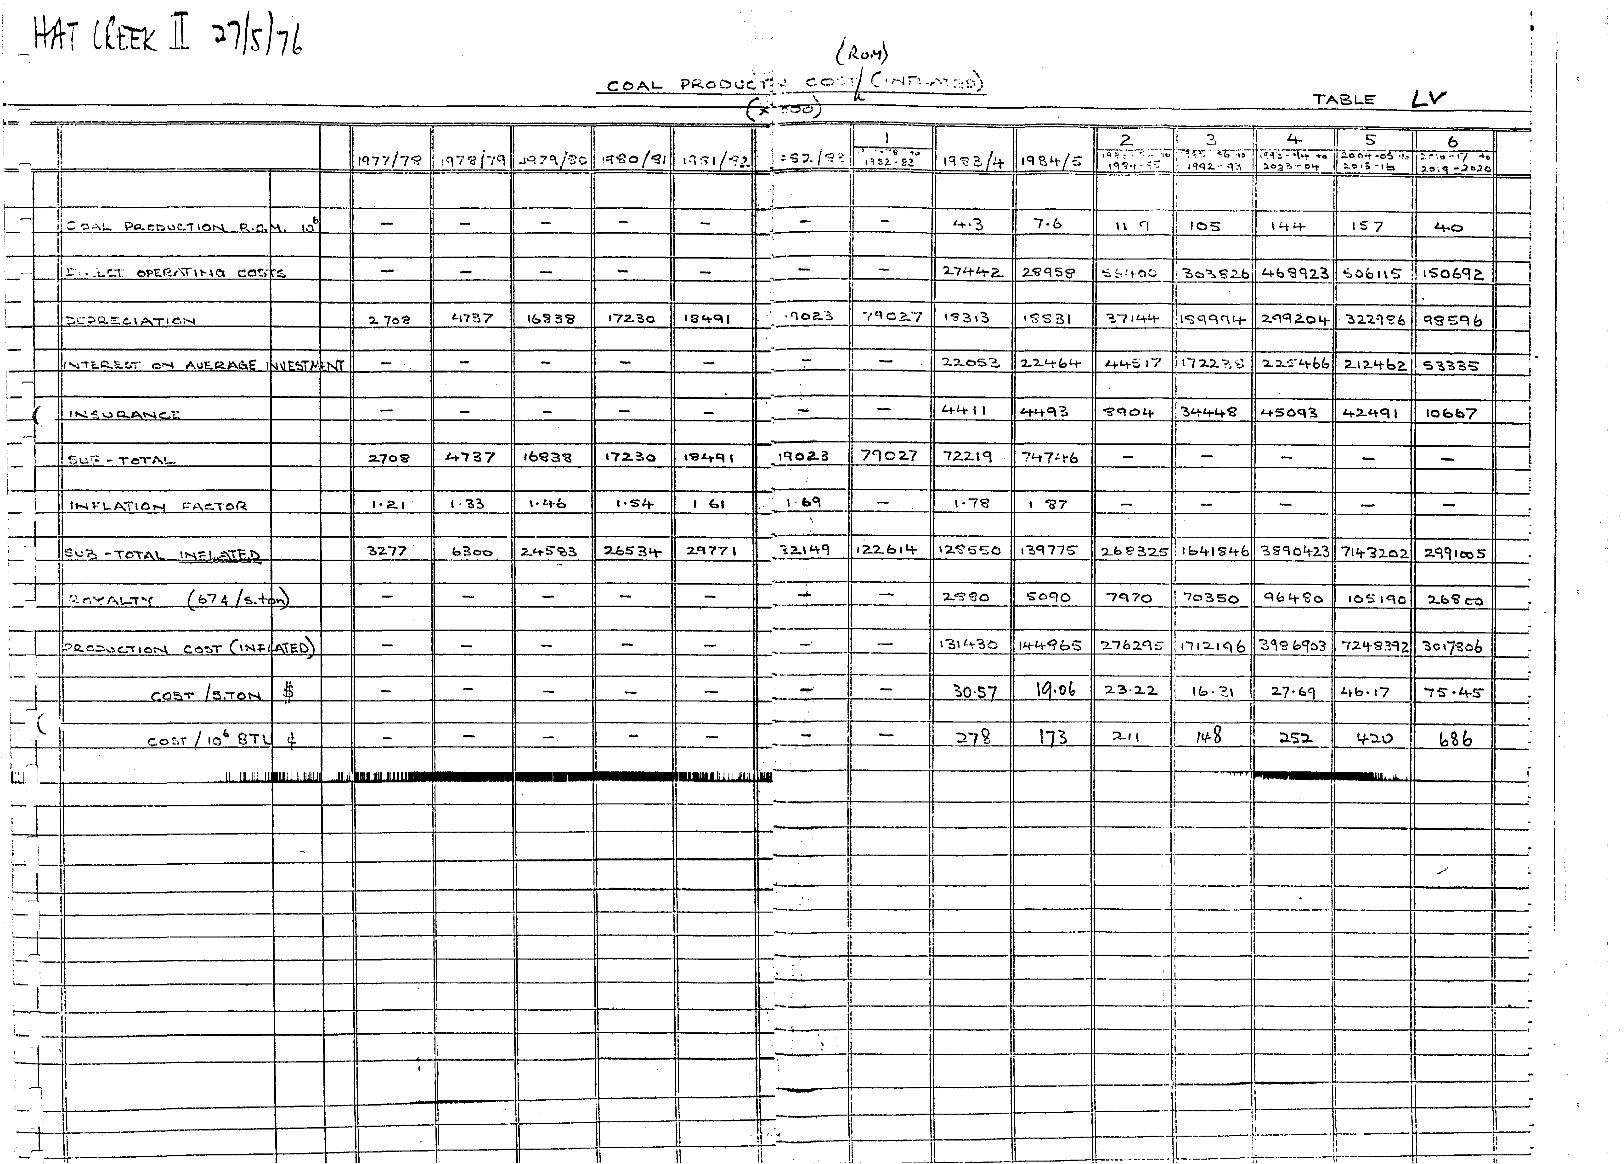

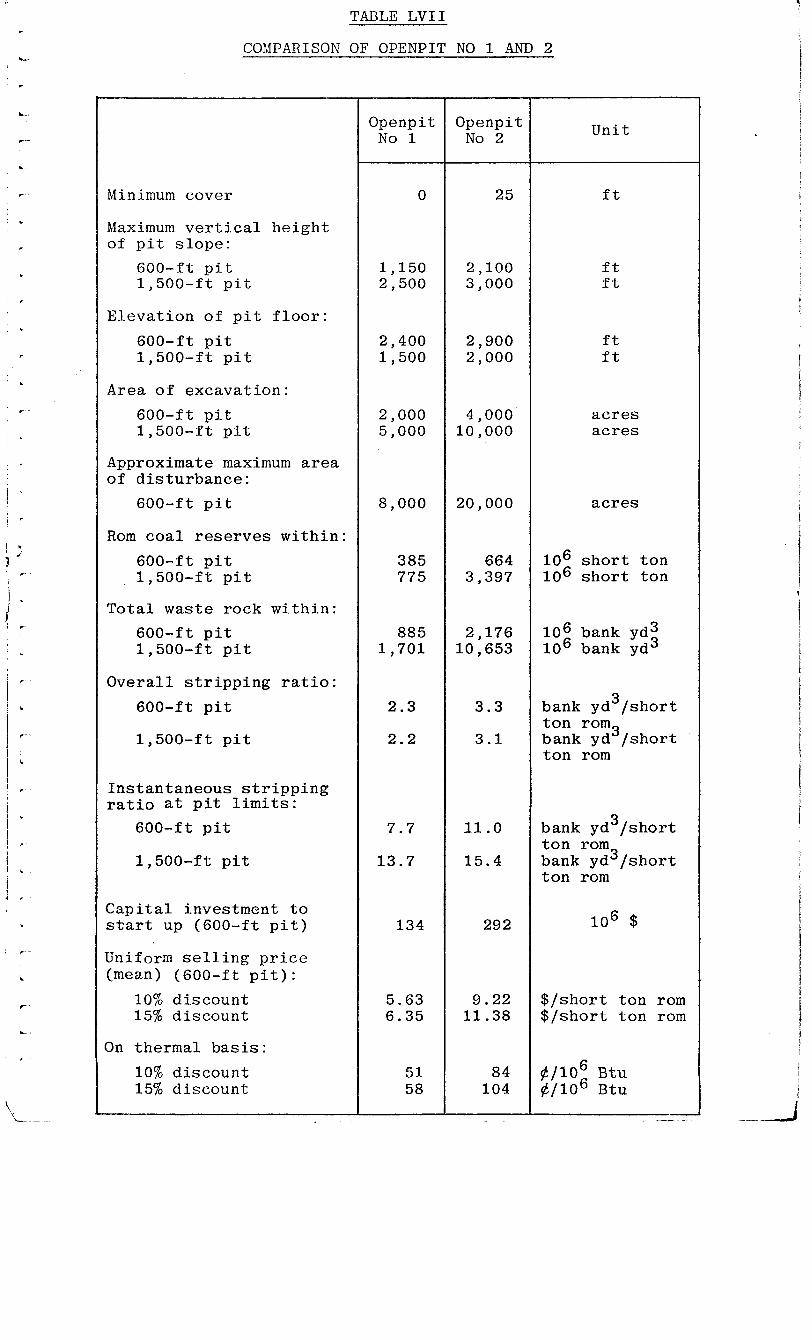
I ,
.
C’
,
c
.
r
L
c
L
r-‘
L
TABLE LVII
COMPARISON OF OPENPIT NO 1 AND 2
Minimum cover 0 25 ft
Maximum vertical height of pit slope:
600-ft pit 1,150 2,100 ft 1,500-ft pit 2,500 3,000 ft
Elevation of pit floor:
600-ft pit 1,500-ft pit
Area of excavation
600-ft pit 1,500-ft pit
Approximate maximum area of disturbance:
600-ft pit
Rom coal reserves within:
600-ft pit 385 664 lo6 short ton 1,500-ft pit 775 3,397 lo6 short ton
Total waste rock with in:
600-ft pit 885 2,176 1,500-ft pit 1,701 10,653
lo6 bank yd3 lo6 bank yd3
Overall stripping ratio:
600-ft pit
1,500-ft pit
Instantaneous stripping ratio at pit limits:
600-ft pit
1,500-ft pit
Capital investment to start up (600-ft pit)
Uniform selling price (mean) (600-ft pit):
10% discount 5.63 9.22 $/short ton rom 15% discount 6.35 11.38 $/short ton rom
On thermal basis:
10% discount 15% discount
Openpit Openpit No 1 No 2 Unit
2,400 2,900 ft 1,500 2,000 ft
2,000 5,000
4,000 10,000
acres acres
8,000 20,000 acres
2.3 3.3
2.2 3.1
bank yd3/short ton rom3 bank yd /short ton rom
7.7
13.7
11.0
15.4
bank yd3/short ton rom bank yd3/short ton rom
134 292 lo6 $
53. 84 58 104
#/lo6 Btu #/lo6 Btu