Embed Size (px)
Citation preview
Preliminary Results
Third Quarter 2012
October 30, 2012
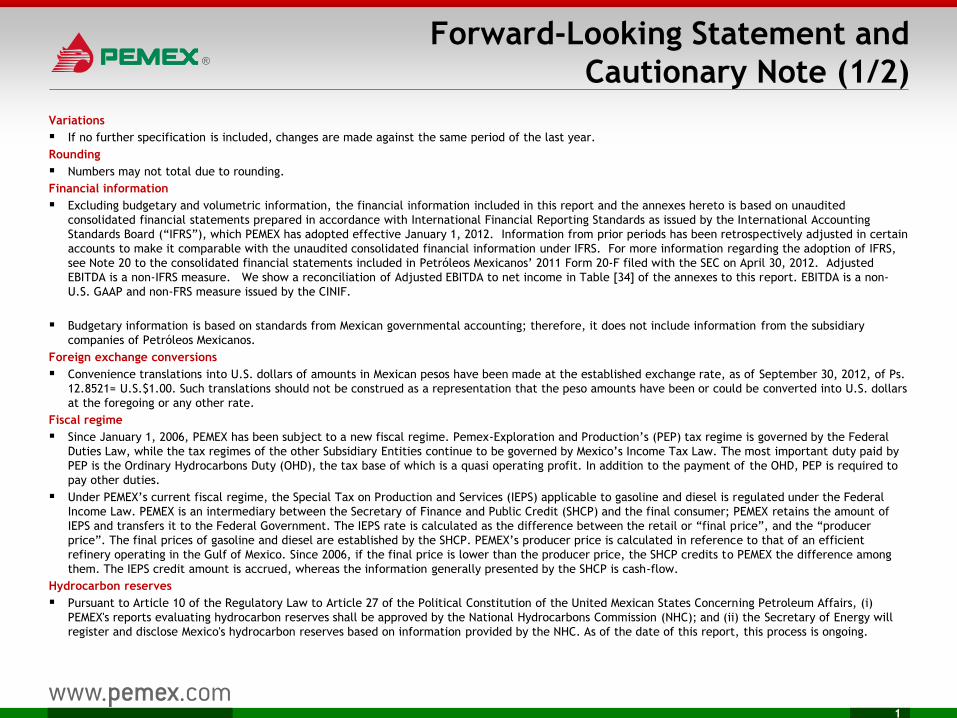
Forward-Looking Statement and
Cautionary Note (1/2)
1
Variations
If no further specification is included, changes are made against the same period of the last year.
Rounding
Numbers may not total due to rounding.
Financial information
Excluding budgetary and volumetric information, the financial information included in this report and the annexes hereto is based on unaudited
consolidated financial statements prepared in accordance with International Financial Reporting Standards as issued by the International Accounting
Standards Board (“IFRS”), which PEMEX has adopted effective January 1, 2012. Information from prior periods has been retrospectively adjusted in certain
accounts to make it comparable with the unaudited consolidated financial information under IFRS. For more information regarding the adoption of IFRS,
see Note 20 to the consolidated financial statements included in Petróleos Mexicanos’ 2011 Form 20-F filed with the SEC on April 30, 2012. Adjusted
EBITDA is a non-IFRS measure. We show a reconciliation of Adjusted EBITDA to net income in Table [34] of the annexes to this report. EBITDA is a non-
U.S. GAAP and non-FRS measure issued by the CINIF.
Budgetary information is based on standards from Mexican governmental accounting; therefore, it does not include information from the subsidiary
companies of Petróleos Mexicanos.
Foreign exchange conversions
Convenience translations into U.S. dollars of amounts in Mexican pesos have been made at the established exchange rate, as of September 30, 2012, of Ps.
12.8521= U.S.$1.00. Such translations should not be construed as a representation that the peso amounts have been or could be converted into U.S. dollars
at the foregoing or any other rate.
Fiscal regime
Since January 1, 2006, PEMEX has been subject to a new fiscal regime. Pemex-Exploration and Production’s (PEP) tax regime is governed by the Federal
Duties Law, while the tax regimes of the other Subsidiary Entities continue to be governed by Mexico’s Income Tax Law. The most important duty paid by
PEP is the Ordinary Hydrocarbons Duty (OHD), the tax base of which is a quasi operating profit. In addition to the payment of the OHD, PEP is required to
pay other duties.
Under PEMEX’s current fiscal regime, the Special Tax on Production and Services (IEPS) applicable to gasoline and diesel is regulated under the Federal
Income Law. PEMEX is an intermediary between the Secretary of Finance and Public Credit (SHCP) and the final consumer; PEMEX retains the amount of
IEPS and transfers it to the Federal Government. The IEPS rate is calculated as the difference between the retail or “final price”, and the “producer
price”. The final prices of gasoline and diesel are established by the SHCP. PEMEX’s producer price is calculated in reference to that of an efficient
refinery operating in the Gulf of Mexico. Since 2006, if the final price is lower than the producer price, the SHCP credits to PEMEX the difference among
them. The IEPS credit amount is accrued, whereas the information generally presented by the SHCP is cash-flow.
Hydrocarbon reserves
Pursuant to Article 10 of the Regulatory Law to Article 27 of the Political Constitution of the United Mexican States Concerning Petroleum Affairs, (i)
PEMEX's reports evaluating hydrocarbon reserves shall be approved by the National Hydrocarbons Commission (NHC); and (ii) the Secretary of Energy will
register and disclose Mexico's hydrocarbon reserves based on information provided by the NHC. As of the date of this report, this process is ongoing.

Forward-Looking Statement and
Cautionary Note (2/2)
2
Hydrocarbon reserves
As of January 1, 2010, the SEC changed its rules to permit oil and gas companies, in their filings with the SEC, to disclose not only proved reserves, but
also probable reserves and possible reserves. In addition, we do not necessarily mean that the probable or possible reserves described herein meet the
recoverability thresholds established by the SEC in its new definitions. Investors are urged to consider closely the disclosure in our Form 20-F and our
annual report to the Mexican Banking and Securities Commission, available at http://www.pemex.com/.
Forward-looking statements
This report contains forward-looking statements. We may also make written or oral forward-looking statements in our periodic reports to the CNBV and the
SEC, in our annual reports, in our offering circulars and prospectuses, in press releases and other written materials and in oral statements made by our
officers, directors or employees to third parties. We may include forward-looking statements that address, among other things, our:
– Drilling and other exploration activities;
– Import and export activities;
– Projected and targeted capital expenditures; costs; commitments; revenues; liquidity, etc.
Actual results could differ materially from those projected in such forward-looking statements as a result of various factors that may be beyond our
control. These factors include, but are not limited to:
– Changes in international crude oil and natural gas prices;
– Effects on us from competition;
– Limitations on our access to sources of financing on competitive terms;
– Significant economic or political developments in Mexico;
– Developments affecting the energy sector; and
– Changes in our regulatory environment.
Accordingly, you should not place undue reliance on these forward-looking statements. In any event, these statements speak only as of their dates, and we
undertake no obligation to update or revise any of them, whether as a result of new information, future events or otherwise. These risks and uncertainties
are more fully detailed in PEMEX’s most recent Form 20-F filing with the SEC (www.sec.gov), and the PEMEX prospectus filed with the CNBV and available
through the Mexican Stock Exchange (www.bmv.com.mx). These factors could cause actual results to differ materially from those contained in any
forward-looking statement.
PEMEX
PEMEX is Mexico’s national oil and gas company. Created in 1938, it is the exclusive producer of Mexico’s oil and gas resources. The operating subsidiary
entities are Pemex-Exploration and Production, Pemex-Refining, Pemex-Gas and Basic Petrochemicals and Pemex-Petrochemicals. The principal subsidiary
company is PMI.
Content
3
Highlights
Upstream
Downstream
Financial Results
Questions and Answers
Highlights 3Q12
4
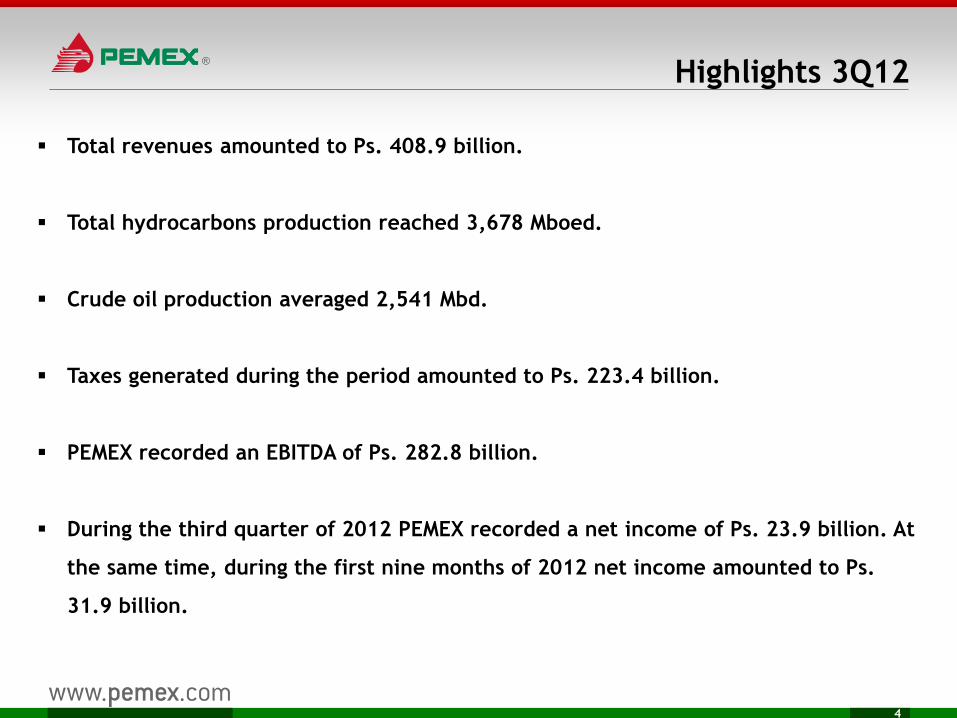
Total revenues amounted to Ps. 408.9 billion.
Total hydrocarbons production reached 3,678 Mboed.
Crude oil production averaged 2,541 Mbd.
Taxes generated during the period amounted to Ps. 223.4 billion.
PEMEX recorded an EBITDA of Ps. 282.8 billion.
During the third quarter of 2012 PEMEX recorded a net income of Ps. 23.9 billion. At
the same time, during the first nine months of 2012 net income amounted to Ps.
31.9 billion.
Context 3Q12
5
70
80
90
100
110
120
130
7/11 9/11 11/11 1/12 3/12 5/12 7/12 9/12
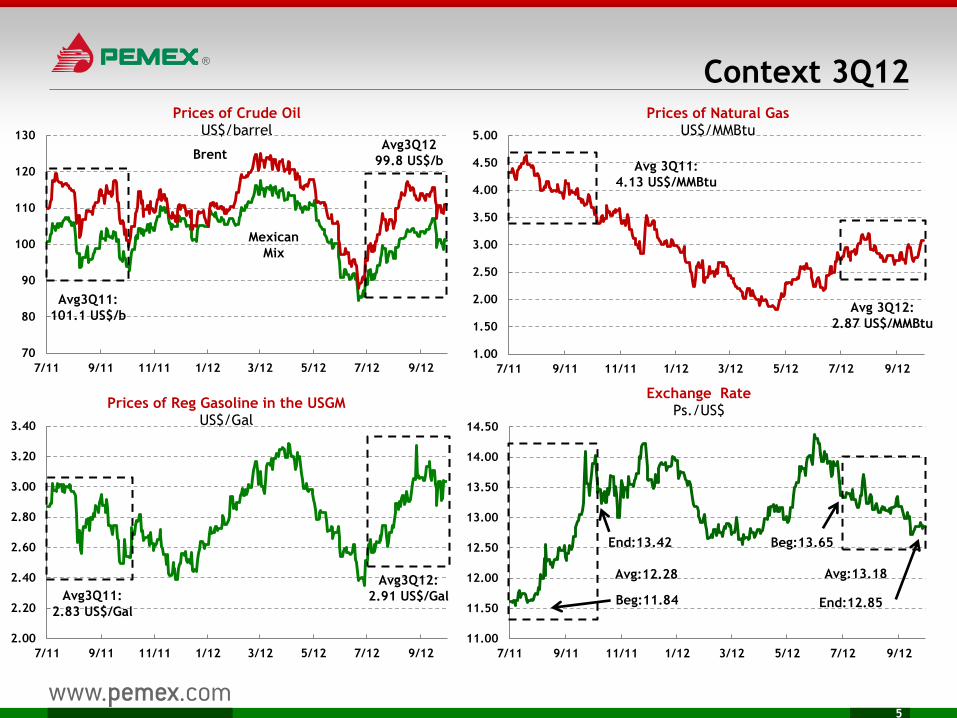
Prices of Crude Oil US$/barrel
Avg3Q12
99.8 US$/b
Mexican
Mix
Brent
Avg3Q11:
101.1 US$/b
2.00
2.20
2.40
2.60
2.80
3.00
3.20
3.40
7/11 9/11 11/11 1/12 3/12 5/12 7/12 9/12
Prices of Reg Gasoline in the USGM US$/Gal
Avg3Q11:
2.83 US$/Gal
Avg3Q12:
2.91 US$/Gal
1.00
1.50
2.00
2.50
3.00
3.50
4.00
4.50
5.00
7/11 9/11 11/11 1/12 3/12 5/12 7/12 9/12
Prices of Natural Gas US$/MMBtu
Avg 3Q11:
4.13 US$/MMBtu
Avg 3Q12:
2.87 US$/MMBtu
11.00
11.50
12.00
12.50
13.00
13.50
14.00
14.50
7/11 9/11 11/11 1/12 3/12 5/12 7/12 9/12
Exchange Rate Ps./US$
Avg:12.28
Beg:11.84
End:13.42 Beg:13.65
End:12.85
Avg:13.18
Content
6
Highlights
Upstream
Downstream
Financial Results
Questions and Answers
Crude Oil Production
7
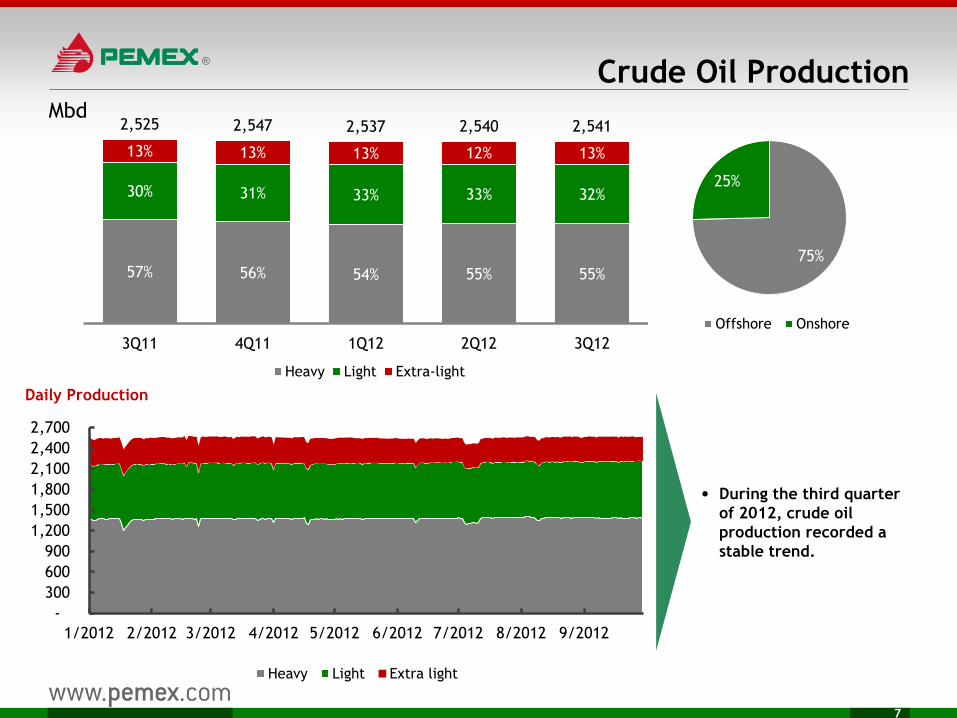
• During the third quarter
of 2012, crude oil
production recorded a
stable trend.
Mbd
57% 56% 54% 55% 55%
30% 31% 33% 33% 32%
13% 13% 13% 12% 13%
2,525 2,547 2,537 2,540 2,541
3Q11 4Q11 1Q12 2Q12 3Q12
Heavy Light Extra-light
75%
25%
Offshore Onshore
-
300
600
900
1,200
1,500
1,800
2,100
2,400
2,700
1/2012 2/2012 3/2012 4/2012 5/2012 6/2012 7/2012 8/2012 9/2012
Daily Production
Heavy Light Extra light
Natural Gas Production
8
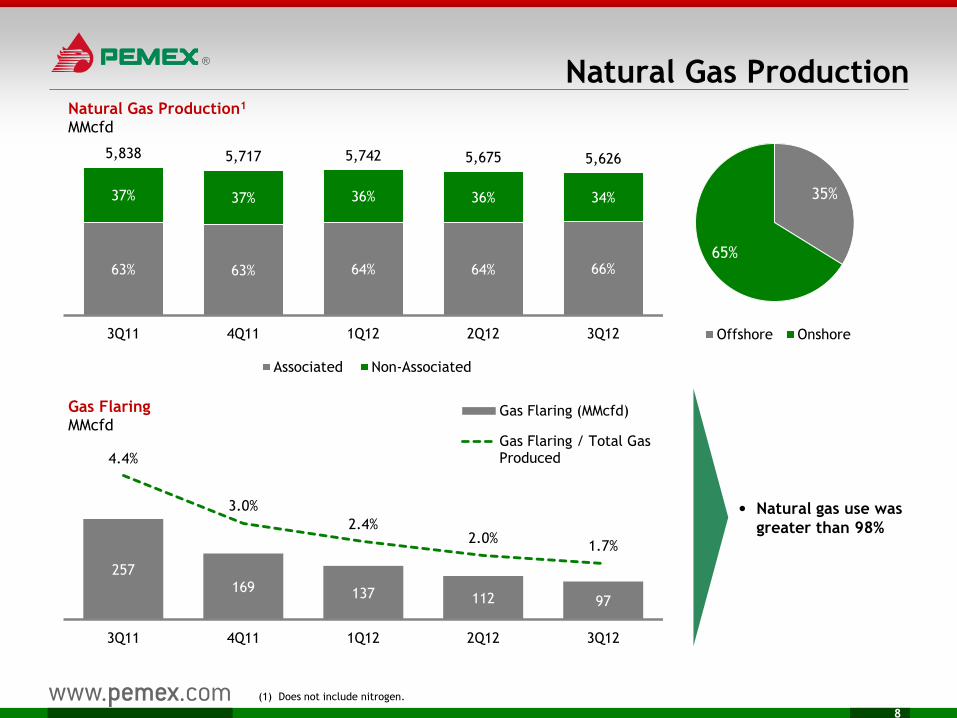
(1) Does not include nitrogen.
• Natural gas use was
greater than 98%
35%
65%
Offshore Onshore
63% 63% 64% 64% 66%
37% 37% 36% 36% 34%
5,838 5,717 5,742 5,675 5,626
3Q11 4Q11 1Q12 2Q12 3Q12
Natural Gas Production1
MMcfd
Associated Non-Associated
257 169 137 112 97
4.4%
3.0%
2.4% 2.0%
1.7%
3Q11 4Q11 1Q12 2Q12 3Q12
Gas Flaring MMcfd
Gas Flaring (MMcfd)
Gas Flaring / Total GasProduced
Operational Infrastructure
9 9
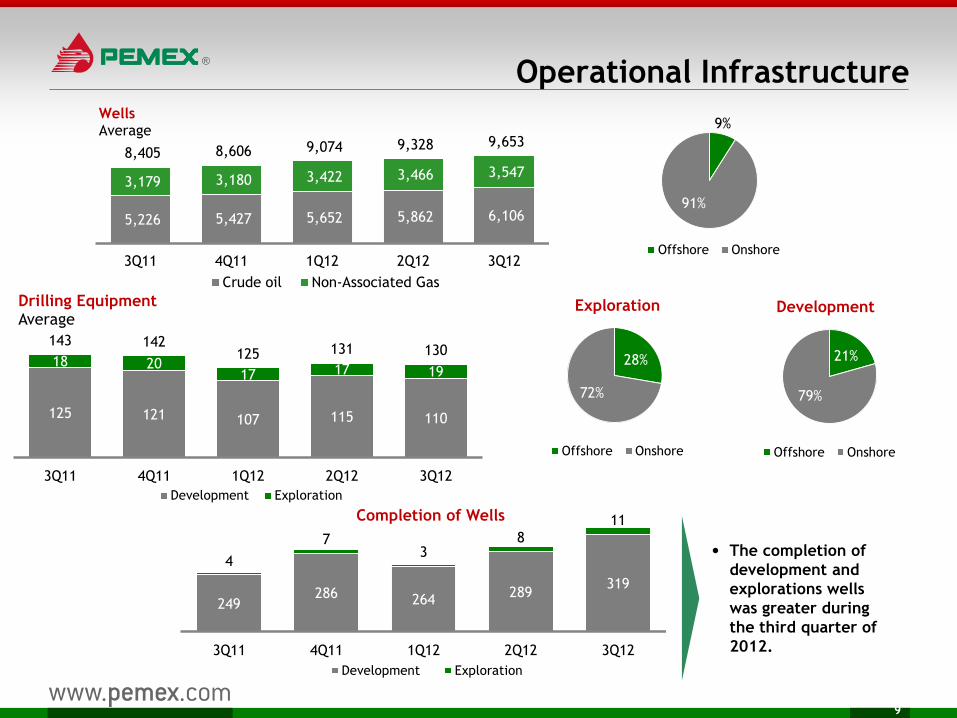
• The completion of
development and
explorations wells
was greater during
the third quarter of
2012.
9%
91%
Offshore Onshore
5,226 5,427 5,652 5,862 6,106
3,179 3,180 3,422 3,466 3,547
8,405 8,606 9,074 9,328 9,653
3Q11 4Q11 1Q12 2Q12 3Q12
Wells Average
Crude oil Non-Associated Gas
125 121 107 115 110
18 20 17 17 19
143 142 125 131 130
3Q11 4Q11 1Q12 2Q12 3Q12
Drilling Equipment Average
Development Exploration
249 286 264
289 319
4
7 3
8
11
3Q11 4Q11 1Q12 2Q12 3Q12
Completion of Wells
Development Exploration
28%
72%
Exploration
Offshore Onshore
21%
79%
Development
Offshore Onshore
10
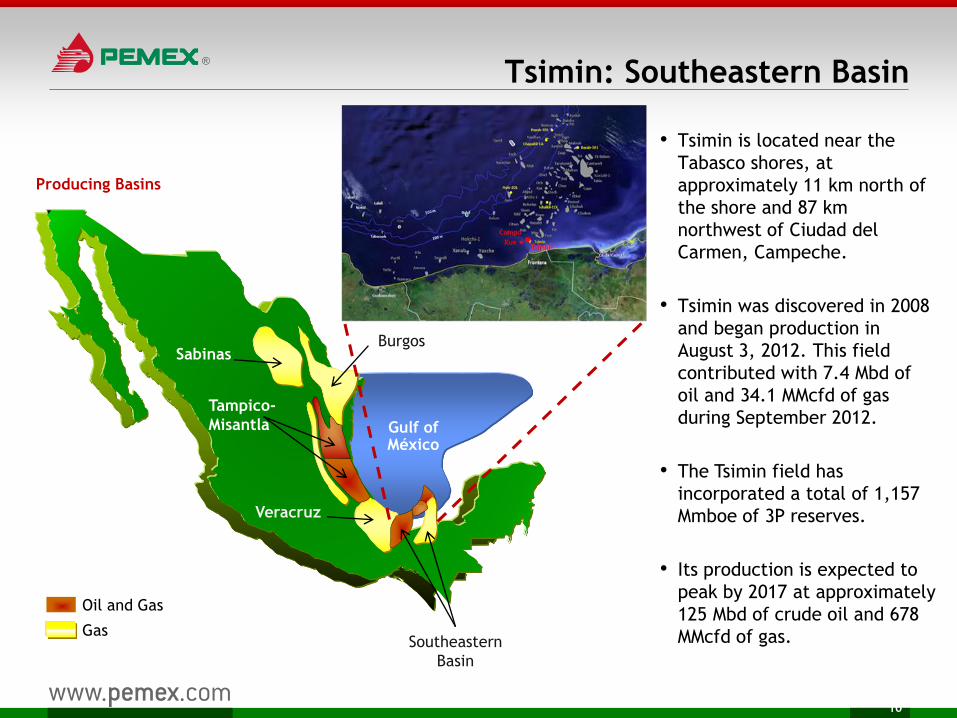
Tsimin: Southeastern Basin
Producing Basins
Oil and Gas
Gas Southeastern
Basin
Veracruz
Tampico-
Misantla
Burgos Sabinas
Gulf of México
• Tsimin is located near the
Tabasco shores, at
approximately 11 km north of
the shore and 87 km
northwest of Ciudad del
Carmen, Campeche.
• Tsimin was discovered in 2008
and began production in
August 3, 2012. This field
contributed with 7.4 Mbd of
oil and 34.1 MMcfd of gas
during September 2012.
• The Tsimin field has
incorporated a total of 1,157
Mmboe of 3P reserves.
• Its production is expected to
peak by 2017 at approximately
125 Mbd of crude oil and 678
MMcfd of gas.
11
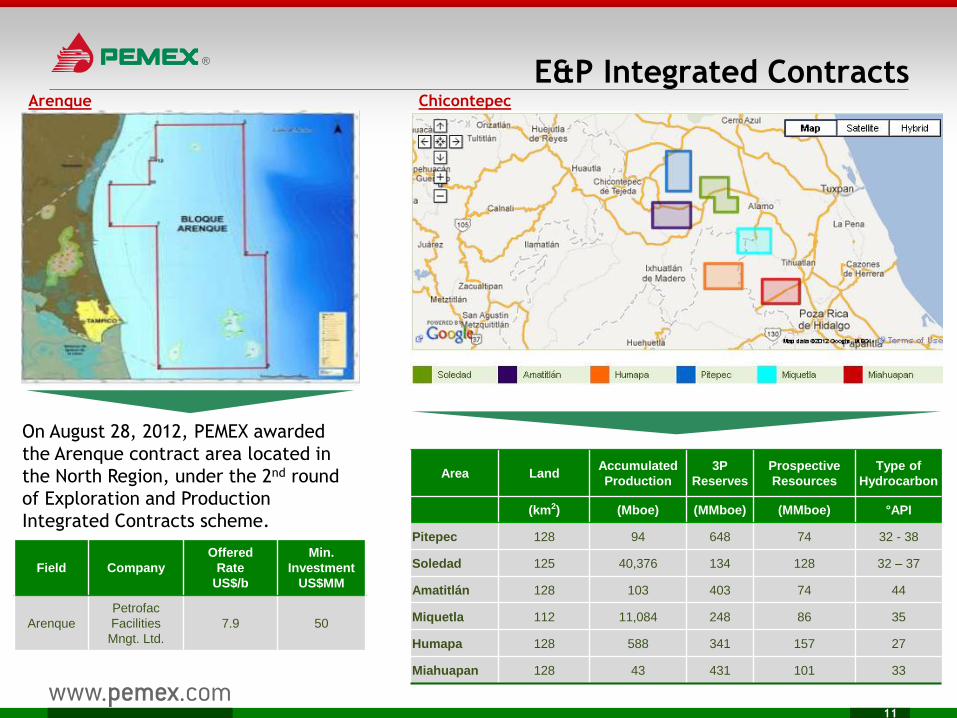
E&P Integrated Contracts
On August 28, 2012, PEMEX awarded
the Arenque contract area located in
the North Region, under the 2nd round
of Exploration and Production
Integrated Contracts scheme.
Field Company
Offered
Rate
US$/b
Min.
Investment
US$MM
Arenque
Petrofac
Facilities
Mngt. Ltd.
7.9 50
Arenque Chicontepec
Area Land Accumulated
Production
3P
Reserves
Prospective
Resources
Type of
Hydrocarbon
(km2) (Mboe) (MMboe) (MMboe) °API
Pitepec 128 94 648 74 32 - 38
Soledad 125 40,376 134 128 32 – 37
Amatitlán 128 103 403 74 44
Miquetla 112 11,084 248 86 35
Humapa 128 588 341 157 27
Miahuapan 128 43 431 101 33
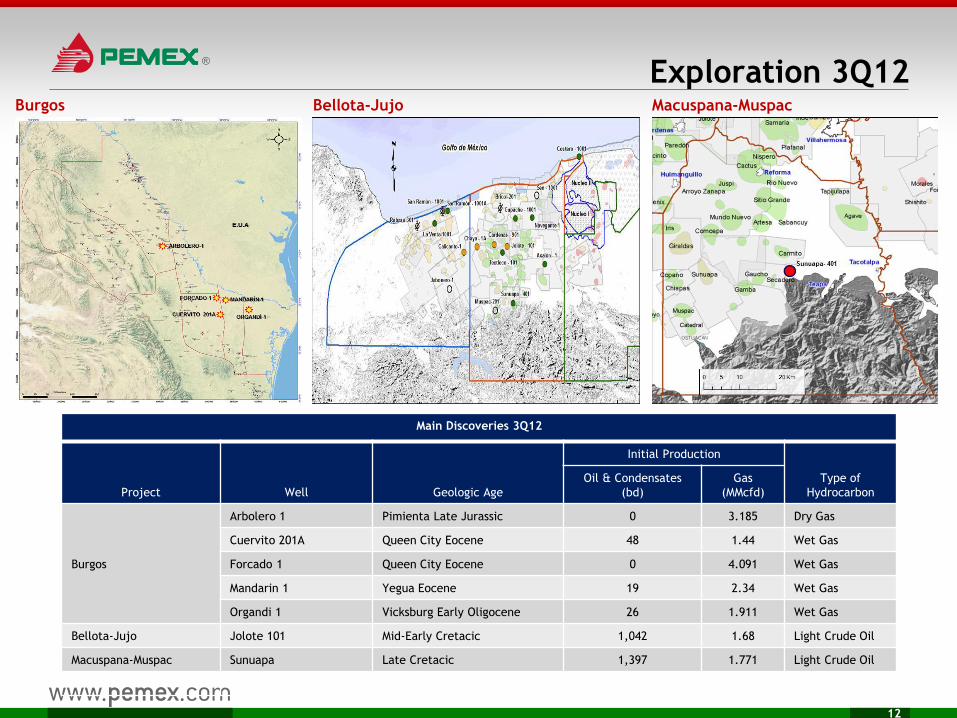
Exploration 3Q12
12
Main Discoveries 3Q12
Project Well Geologic Age
Initial Production
Type of
Hydrocarbon
Oil & Condensates
(bd)
Gas
(MMcfd)
Burgos
Arbolero 1 Pimienta Late Jurassic 0 3.185 Dry Gas
Cuervito 201A Queen City Eocene 48 1.44 Wet Gas
Forcado 1 Queen City Eocene 0 4.091 Wet Gas
Mandarin 1 Yegua Eocene 19 2.34 Wet Gas
Organdi 1 Vicksburg Early Oligocene 26 1.911 Wet Gas
Bellota-Jujo Jolote 101 Mid-Early Cretacic 1,042 1.68 Light Crude Oil
Macuspana-Muspac Sunuapa Late Cretacic 1,397 1.771 Light Crude Oil
Burgos Bellota-Jujo Macuspana-Muspac
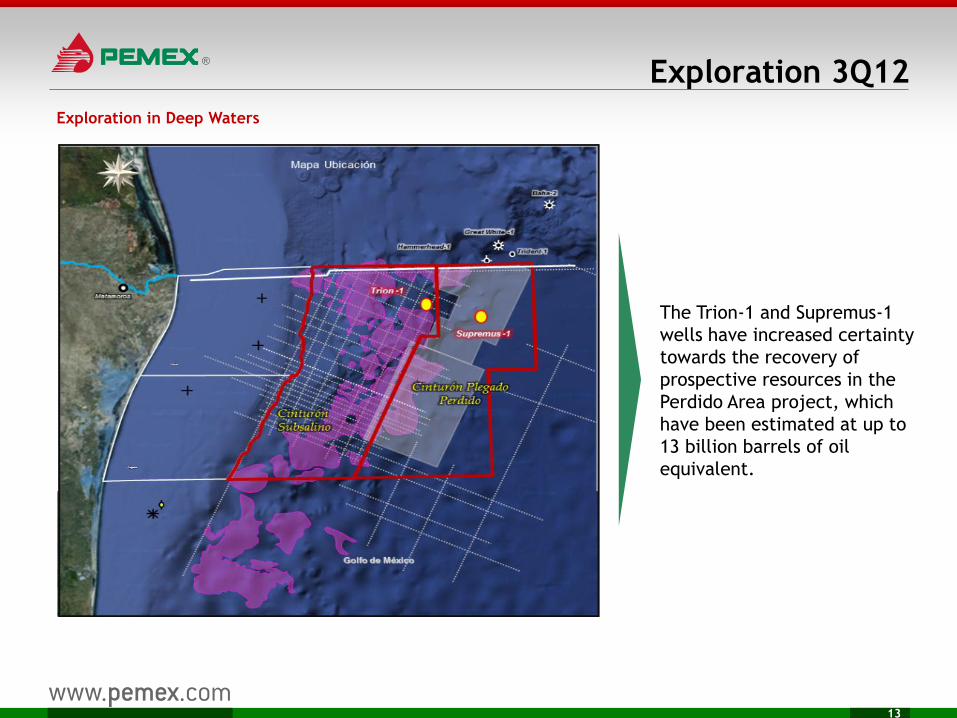
Exploration 3Q12
13
Exploration in Deep Waters
The Trion-1 and Supremus-1
wells have increased certainty
towards the recovery of
prospective resources in the
Perdido Area project, which
have been estimated at up to
13 billion barrels of oil
equivalent.
Content
14
Highlights
Upstream
Downstream
Financial Results
Questions and Answers
406 427
309 283
274 306
211 208 57 57 65 86 1,323
1,343 1,391
1,367
1H11 1Q12 2Q12 1H12
Production of Petroleum Products Mt
Other
Jet Fuel
LPG
Diesel
Fuel oil
Automotive gasolines
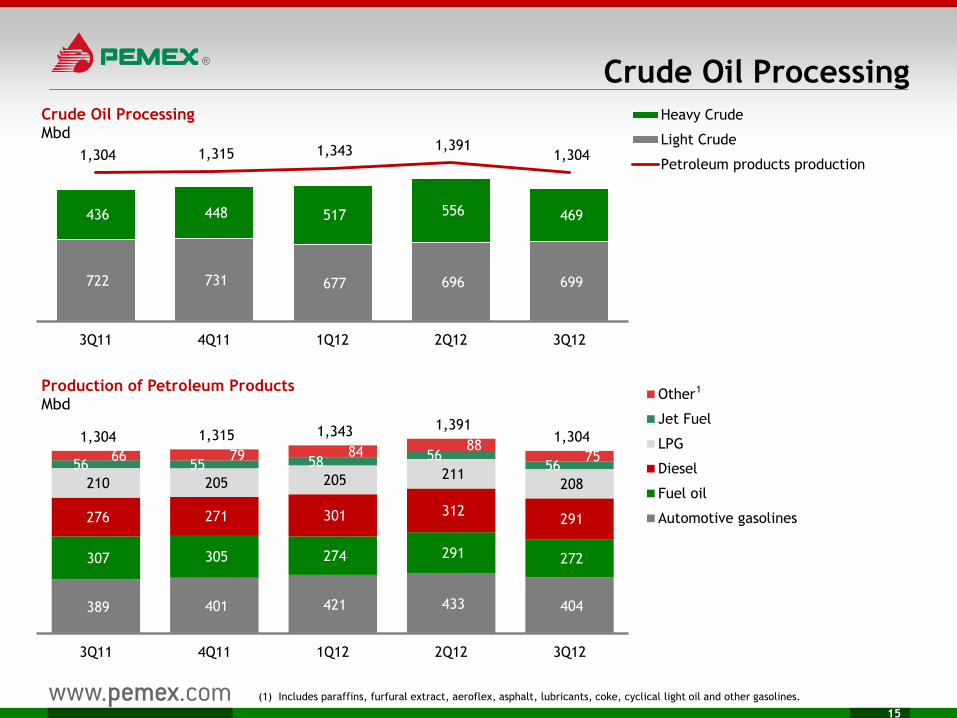
Crude Oil Processing
15
(1) Includes paraffins, furfural extract, aeroflex, asphalt, lubricants, coke, cyclical light oil and other gasolines.
722 731 677 696 699
436 448 517 556 469
1,304 1,315 1,343 1,391 1,304
3Q11 4Q11 1Q12 2Q12 3Q12
Crude Oil Processing Mbd
Heavy Crude
Light Crude
Petroleum products production
389 401 421 433 404
307 305 274 291 272
276 271 301 312 291
210 205 205 211 208
56 55 58 56 56
66 79 84 88 75
1,304 1,315 1,343 1,391 1,304
3Q11 4Q11 1Q12 2Q12 3Q12
Production of Petroleum Products Mbd
Other
Jet Fuel
LPG
Diesel
Fuel oil
Automotive gasolines
1
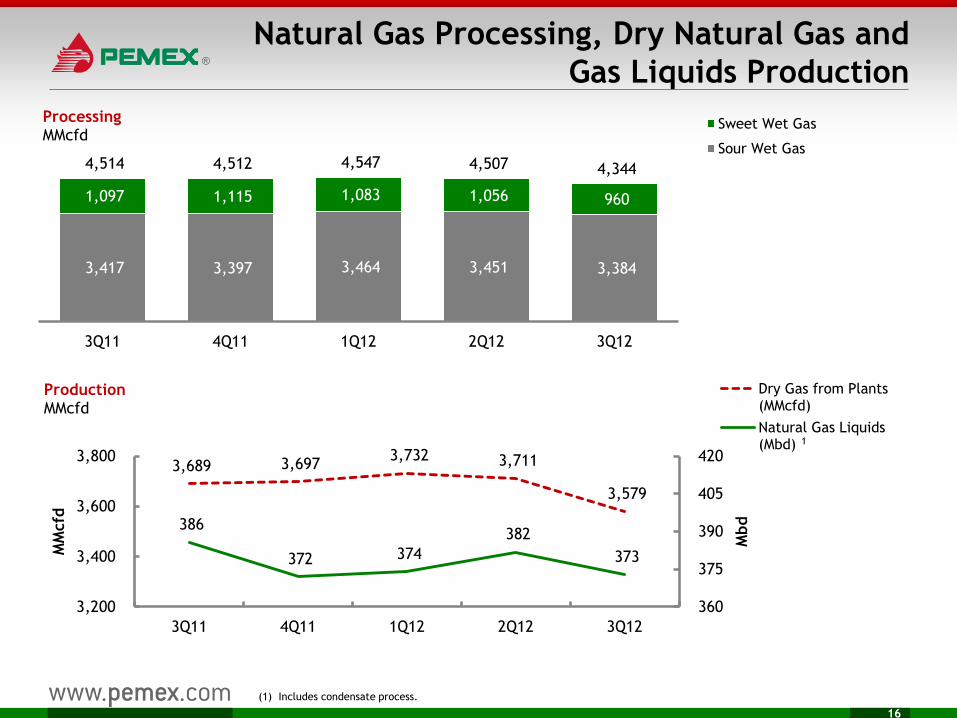
Natural Gas Processing, Dry Natural Gas and
Gas Liquids Production
16
(1) Includes condensate process.
3,417 3,397 3,464 3,451 3,384
1,097 1,115 1,083 1,056 960
4,514 4,512 4,547 4,507 4,344
3Q11 4Q11 1Q12 2Q12 3Q12
Processing MMcfd
Sweet Wet Gas
Sour Wet Gas
3,689 3,697 3,732 3,711
3,579
386
372 374
382
373
360
375
390
405
420
3,200
3,400
3,600
3,800
3Q11 4Q11 1Q12 2Q12 3Q12
Mbd
MM
cfd
Production MMcfd
Dry Gas from Plants(MMcfd)
Natural Gas Liquids(Mbd) 1
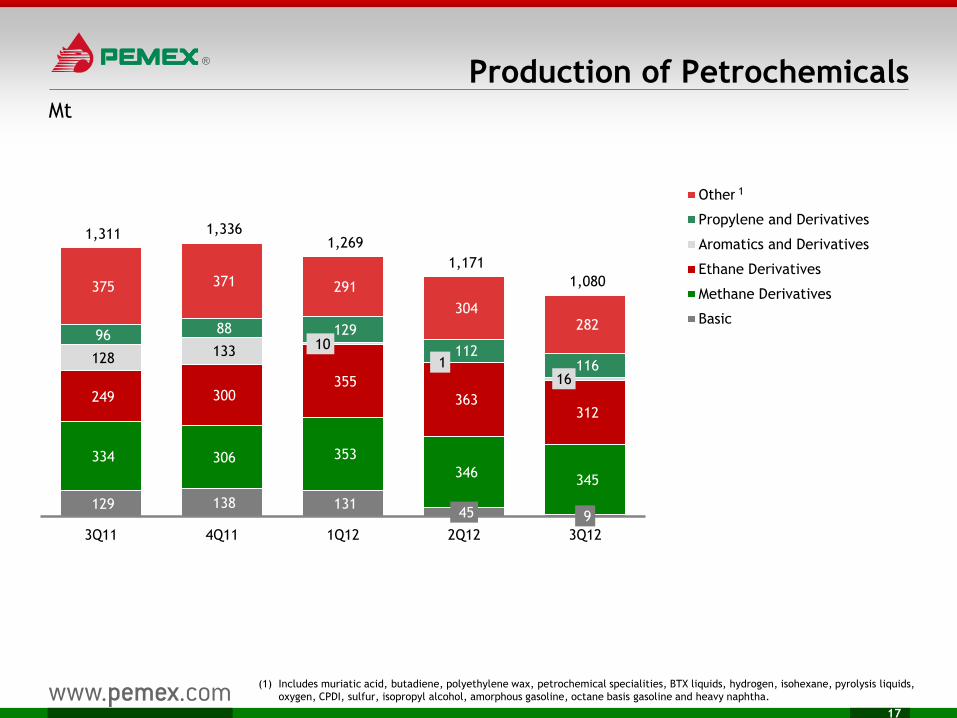
Production of Petrochemicals
17
(1) Includes muriatic acid, butadiene, polyethylene wax, petrochemical specialities, BTX liquids, hydrogen, isohexane, pyrolysis liquids,
oxygen, CPDI, sulfur, isopropyl alcohol, amorphous gasoline, octane basis gasoline and heavy naphtha.
Mt
129 138 131 45 9
334 306 353
346 345
249 300 355
363 312
128 133 10
1 16
96 88 129
112 116
375 371 291
304 282
1,311 1,336 1,269
1,171
1,080
3Q11 4Q11 1Q12 2Q12 3Q12
Other
Propylene and Derivatives
Aromatics and Derivatives
Ethane Derivatives
Methane Derivatives
Basic
1
Content
18
Highlights
Upstream
Downstream
Financial Results
Questions and Answers
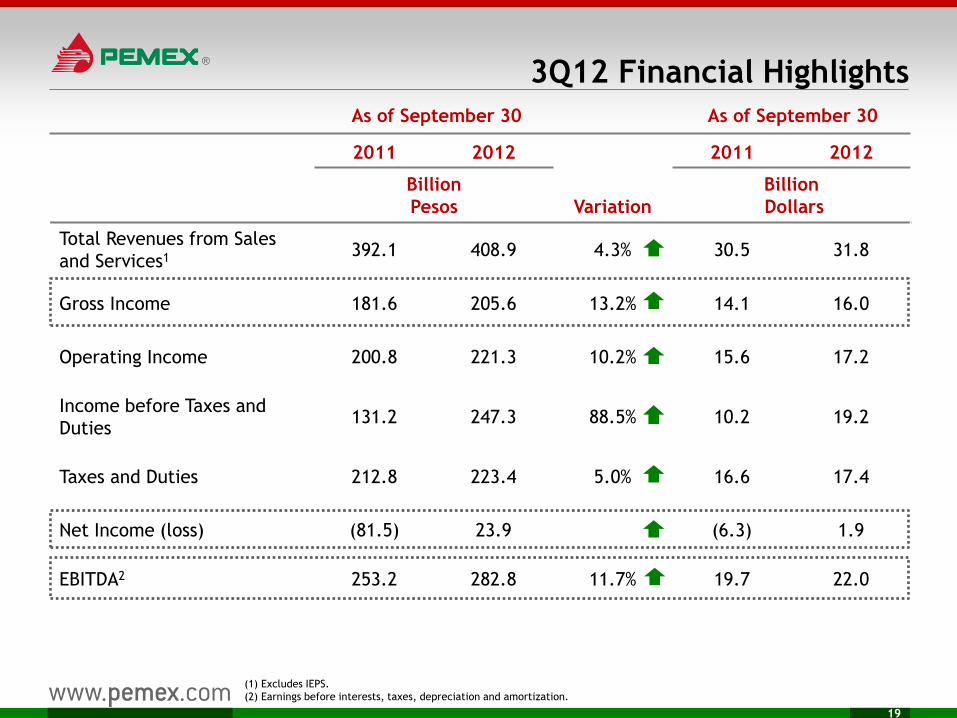
3Q12 Financial Highlights
19
(1) Excludes IEPS.
(2) Earnings before interests, taxes, depreciation and amortization.
2011 2012
Variation
2011 2012
Billion
Pesos
Billion
Dollars
Total Revenues from Sales
and Services1 392.1 408.9 4.3% 30.5 31.8
Gross Income 181.6 205.6 13.2% 14.1 16.0
Operating Income 200.8 221.3 10.2% 15.6 17.2
Income before Taxes and
Duties 131.2 247.3 88.5% 10.2 19.2
Taxes and Duties 212.8 223.4 5.0% 16.6 17.4
Net Income (loss) (81.5) 23.9 (6.3) 1.9
EBITDA2 253.2 282.8 11.7% 19.7 22.0
As of September 30 As of September 30
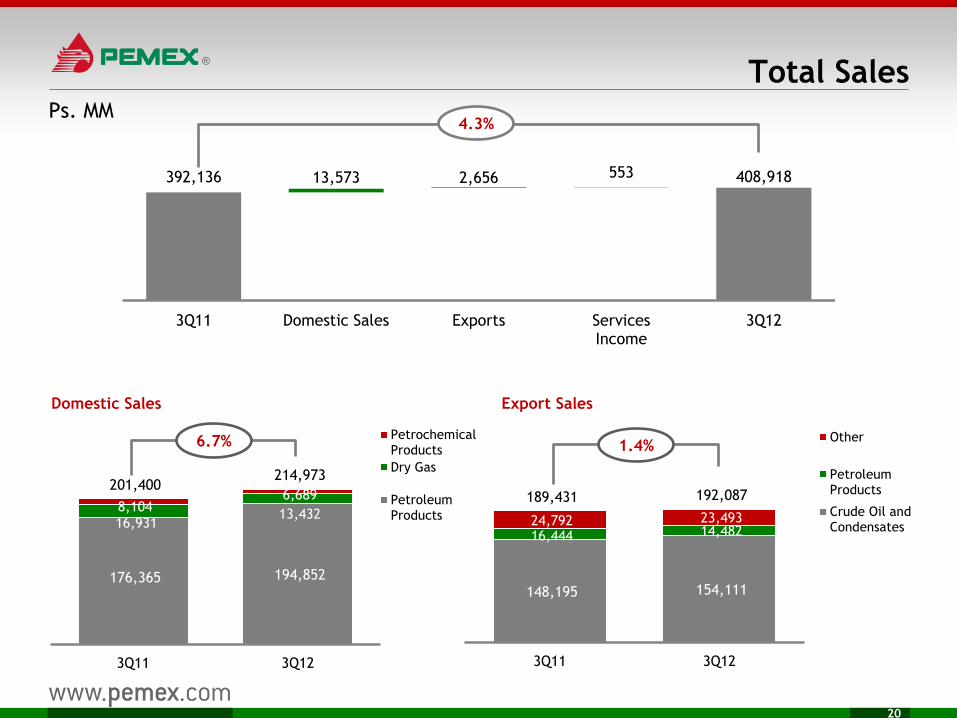
148,195 154,111
16,444 14,482 24,792 23,493
189,431 192,087
3Q11 3Q12
Other
PetroleumProducts
Crude Oil andCondensates
176,365 194,852
16,931 13,432
8,104 6,689
201,400 214,973
3Q11 3Q12
PetrochemicalProducts
Dry Gas
PetroleumProducts
392,136 408,918 13,573 2,656 553
3Q11 Domestic Sales Exports ServicesIncome
3Q12
Total Sales
20
Ps. MM
Export Sales Domestic Sales
1.4% 6.7%
4.3%
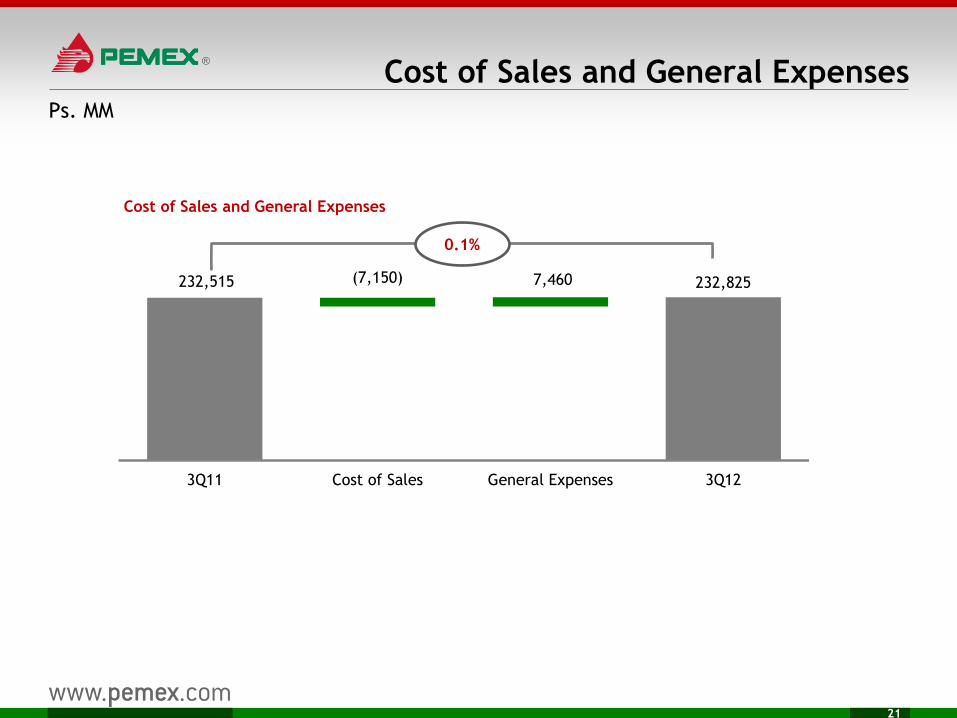
232,515 232,825 (7,150) 7,460
3Q11 Cost of Sales General Expenses 3Q12
Cost of Sales and General Expenses
Cost of Sales and General Expenses
21
Ps. MM
0.1%
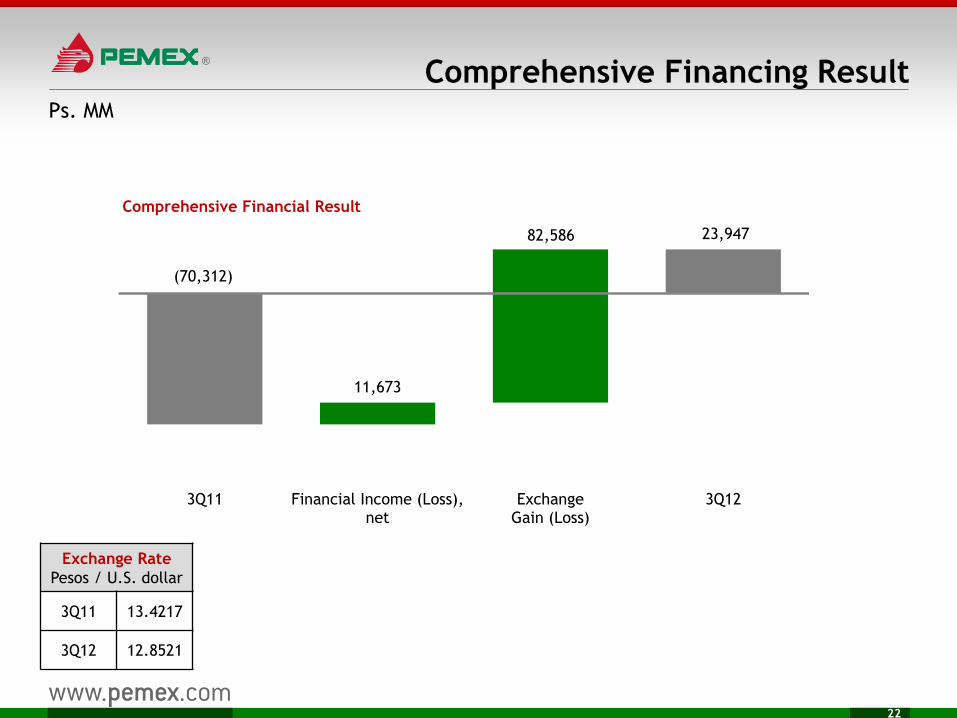
Comprehensive Financing Result
22
Ps. MM
(70,312)
23,947
11,673
82,586
3Q11 Financial Income (Loss),net
ExchangeGain (Loss)
3Q12
Comprehensive Financial Result
Exchange Rate
Pesos / U.S. dollar
3Q11 13.4217
3Q12 12.8521
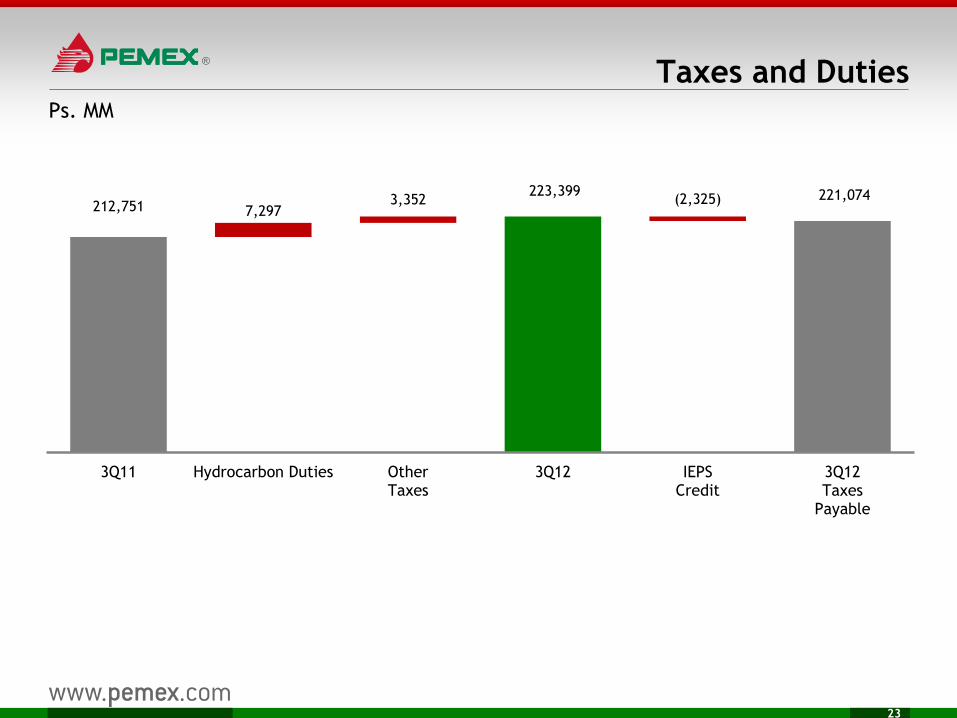
Taxes and Duties
23
Ps. MM
212,751 223,399 221,074
7,297 3,352 (2,325)
3Q11 Hydrocarbon Duties OtherTaxes
3Q12 IEPSCredit
3Q12Taxes
Payable
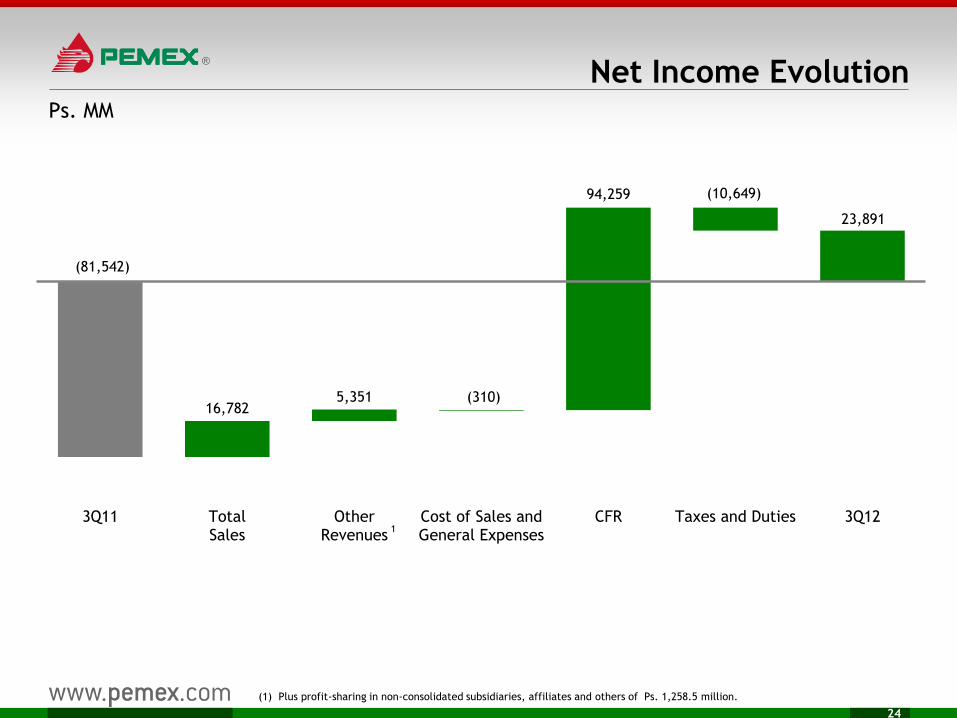
Net Income Evolution
24
(1) Plus profit-sharing in non-consolidated subsidiaries, affiliates and others of Ps. 1,258.5 million.
Ps. MM
(81,542)
16,782 5,351 (310)
94,259 (10,649)
23,891
3Q11 TotalSales
OtherRevenues
Cost of Sales andGeneral Expenses
CFR Taxes and Duties 3Q121
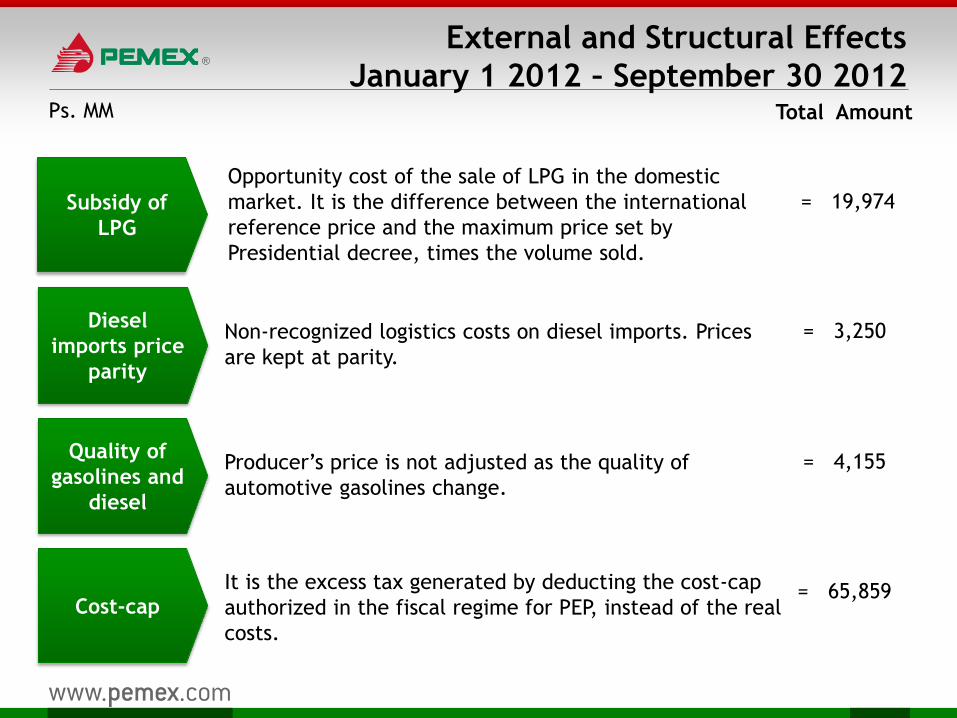
External and Structural Effects
January 1 2012 – September 30 2012
Subsidy of
LPG
Opportunity cost of the sale of LPG in the domestic
market. It is the difference between the international
reference price and the maximum price set by
Presidential decree, times the volume sold.
Quality of
gasolines and
diesel
Diesel
imports price
parity
Non-recognized logistics costs on diesel imports. Prices
are kept at parity.
Producer’s price is not adjusted as the quality of
automotive gasolines change.
Total Amount
Cost-cap It is the excess tax generated by deducting the cost-cap
authorized in the fiscal regime for PEP, instead of the real
costs.
Ps. MM
= 19,974
= 3,250
= 4,155
= 65,859
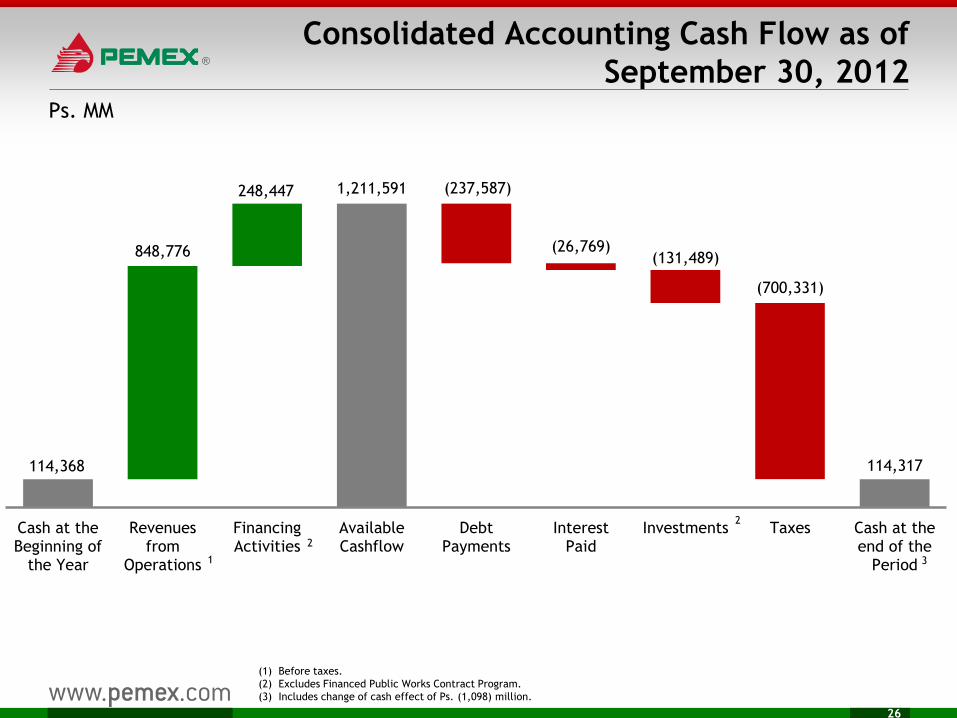
Consolidated Accounting Cash Flow as of
September 30, 2012
26
(1) Before taxes.
(2) Excludes Financed Public Works Contract Program.
(3) Includes change of cash effect of Ps. (1,098) million.
Ps. MM
114,368
848,776
248,447 1,211,591
114,317
(237,587)
(26,769) (131,489)
(700,331)
Cash at theBeginning of
the Year
Revenuesfrom
Operations
FinancingActivities
AvailableCashflow
DebtPayments
InterestPaid
Investments Taxes Cash at theend of the
Period 3
2
2
1
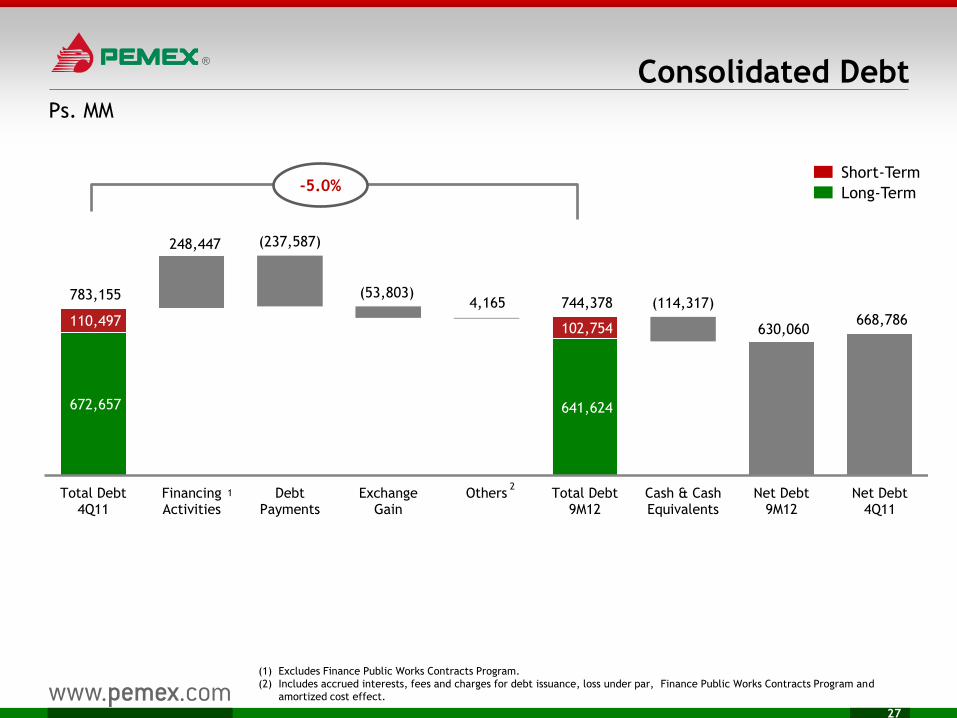
Consolidated Debt
27
(1) Excludes Finance Public Works Contracts Program.
(2) Includes accrued interests, fees and charges for debt issuance, loss under par, Finance Public Works Contracts Program and
amortized cost effect.
Ps. MM
Short-Term
Long-Term
672,657 641,624
630,060 668,786
248,447 (237,587)
110,497 102,754
(53,803) (114,317)
783,155 744,378 4,165
Total Debt4Q11
FinancingActivities
DebtPayments
ExchangeGain
Others Total Debt9M12
Cash & CashEquivalents
Net Debt9M12
Net Debt4Q11
1 2
-5.0%
Highlights 3Q12
28
Total revenues amounted to Ps. 408.9 billion.
Total hydrocarbons production reached 3,678 Mboed.
Crude oil production averaged 2,541 Mbd.
Taxes generated during the period amounted to Ps. 223.4 billion.
PEMEX recorded an EBITDA of Ps. 282.8 billion.
During the third quarter of 2012 PEMEX recorded a net income of Ps. 23.9 billion. At
the same time, during the first nine months of 2012 net income amounted to Ps.
31.9 billion.

Content
29
Main Highlights
Upstream
Downstream
Financial Results
Questions and Answers
Investor Relations
(+52 55) 1944 - 9700
@PEMEX_RI