Embed Size (px)
Citation preview
Anal. Chem. 1995,67, 735-743
Preparation and Characterization Monolayers
Katherine C. Grabar, R. GrWith Freeman,t Michael B. Hommer, and Michael J. Natan*
Department of Chemistty, The Pennsylvania State Universily, Universily Park, Pennsylvania 16802
The design and initial characterization of two-dimensional arrays of colloidal Au particles are reported. These surfaces are prepared by self-assembly of 12 nm diameter colloidal Au particles onto immobilized polymers having pendant functional groups with high attinity for Au (Le., CN, SH, and NH2). The polymers are formed by conden- sation of functionalized alkoxysilanes onto cleaned quartz, glass, and Si02 surfaces. The assembly protocol is carried out completely in solution: cleaned substrates are im- mersed in methanolic solutions of organosilane, rinsed, and subsequently immersed in aqueous colloidal Au solutions. Two-dimensional arrays spontaneously form on the polymer surface. The resulting substrates have been characterized by UV-vis spectroscopy, transmission electron microscopy ("EM), and surface-enhanced Raman scattering (SEE). TEM data show that the particles are spatially separated but close enough to interact electro- magnetically (small spacing compared to A). The UV- vis data show that collective particle surface plasmon modes are present in the 650-750 nm region, suggesting that these assemblies are SEE-active. This is indeed the case, with enhancement factors of roughly lo4. Au colloid monolayers possess a set of features that make them very attractive for both basic and applied uses, including uniform roughness, high stability, and biocompatibility.
In the nearly 20 years since the discovery of surface-enhanced Raman scattering (SERS)'-'j of molecules adsorbed at roughened Ag electrode^^,^ and the accompanying theoretical work demon- strating the need for surface roughness,+ll there have been numerous reports of new architectures for SERS substrate~.~~-31
' Present address: Division of Science, Northeast Missouri State University, Kirksville, MO 63501.
(1) Garrell, R L. Anal. Chem. 1989, 61, 40lA-411A. (2) Creighton, J. A In Advances in Spectroscopy; Clark R J. H., Hester, R. E.,
Eds.; John Wiley and Sons: Chicester, 1988; Vol. 16, pp 37-89. (3) Chang, R IC In Spectroscopic and Dzfiaction Techniques in Intetjkcial
Electrochemisty; Gutierrez, C., Melendres, C., Eds.; Kluwer Academic: The Netherlands, 1990 pp 155-180.
(4) Birke, R L.; Lu, T.; Lombardi, J. R In Techniques for Characterization of Electrodes and Electrochemical Processes; Varma, R, Selman, J. R, Eds.; John Wiley & Sons: New York, 1991; pp 211-277.
(5) Moskovits, M. Rev. Mod. Phys. 1985, 57, 783-826. (6) Brandt, E. S.; Cotton, T. M. In Investigations of Su?faces and Intelfaces-Pari
B Rossiter, B. W., Baetzold, R C., Eds.; John Wiley & Sons: New York,
(7) Jeanmaire, D. L.; Van Duyne, R P. J. Electroanal. Chem. 1977, 84, 1-20. (8) Albrecht, M. G.; Creighton, J. A]. Am. Chem. SOC. 1977, 99, 5215-5217. (9) Gersten, J.; Nitzan, A. J. Chem. Phys. 1980, 73, 3023-3037.
1993; pp 633-718.
(10) Liao, P. F.; Wokaun, A]. Chem. Phys. 1982, 76, 751-752. (11) Schatz, G. C. Acc. Chem. Res. 1984, 17, 370-376. (12) Liao, P. F.; Bergman, J. G.; Chemla, D. S.; Wokaun, A; Melngailis, J.;
Hawyrluk, A M.; Economou, N. P. Chem. Phys. Lett. 1981, 82, 355-359.
0003-2700/95/0367-0735$9.00/0 0 1995 American Chemical Society
These surfaces span a wide range of assembly principles and encompass similarly broad levels of complexity. Examples of SERSactive surfaces include electrochemically roughened elec- trodes, microlithographically prepared elliptical Ag posts,12 ag- gregates of colloidal Au or Ag particles (both in solution13 and associated with chromatographic medial4-I6), evaporated thin b s ,17 Agcoated latex particles,I8 substrates prepared by chemical reduction of A g + , l g and liquid Ag films.2o The motivation for this work stems from several intrinsically attractive aspects of SERS as a vibrational spectroscopy-based structural tool and/or analyti- cal method million-fold enhancements compared to solution Raman attomole mass sen~itivity,~~ adsorption-induced fluorescence q~enching?~ a lack of interference from HzO, and molecular generality.2 However, while SERS has been invaluable for certain narrowly dehed application^,^-^^ most spectroscopists
(13) (a) Creighton, J. A; Blatchford, C. G.; Albrecht, M. G.J. Chem. Soc., Faraday Trans. 2 1979, 75, 790-798. 6) Blatchford, C. G.; Campbell, J. R; Creighton, J. A S u ~ Sci. 1982, 120, 435-455.
(14) Tran, C. D. Anal. Chem. 1984, 56, 824-826. (15) Soper, S. A; Ratzhlaff, IC L.; Kuwana, T. Anal. Chem. 1990, 62, 1438-
(16) Sequaris, J.-M.; Koglin, E. Fresenius J. Anal. Chem. 1985, 321, 758-759. (17) Aroca, R; Jennings, C.; Kovacs, G. J.; Loutfy, R. 0.; Vincett, P. S. J. Phys.
(18) Moody, R L.; Vo-Dinh, T.; Fletcher, W. H. Apjl. Spectrosc. 1987,41,966-
(19) Ni, F.; Cotton, T. M. Anal. Chem. 1986, 58, 3159-3163. (20) Yogev, D.; Efrima, S. ]. Phys. Chem. 1988, 92, 5761-5765. (21) Goudonnet, J. P.; Bijeon, J. L.; Warmack, R J.; Ferrell, T. L. Phys. Rev. E:
(22) Murray, C. A; Allara, D. L J. Chem. Phys. 1982, 76, 1290-1303. (23) Brandt, E. S. Appl. Spectrosc. 1993, 47, 85-93. (24) Alsmeyer, Y. W.; McCreery, R L. Anal. Chem. 1991, 63, 1289-1295. (25) Mullen, IC; Carron, IC Anal. Chem. 1994, 66, 478-483. (26) Beer, K. D.; Tanner, W.; Garrell, R L. J. Electroanal. Chem. 1989, 258,
313-325. (27) Dawson, P.; Alexander, IC B.; Thompson, J. R; Haas, J. W., 111; Ferrell, T.
L. Phys. Rev. B: Condens. Matter 1991, 44, 6372-6381. (28) (a) Roark, S. E.; Rowlen, IC L. Appl. Spectrosc. 1992, 46, 1759-1761. 6)
Roark, S. E.; Rowlen, IC L Chem. By. Lett. 1993,212,50-56. (c) Roark, S. E.; Rowlen, IC L. Anal. Chem. 1994, 66, 261-270.
(29) Walls, D.; Bohn, P. J. Phys. Chem. 1989, 93, 2976-2982. (30) Dutta, P. IC; Robins, D. Lungmuir 1991, 7, 2004-2006. (31) Sheng, R.-S.; Zhu, L.; Morris, M. D. Anal. Chem. 1986, 58, 1116-1119. (32) Van Duyne, R P.; Haller, IC L.; Altkom, R I. Chem. Phys. Lett. 1986, 126,
(33) Pettinger, B.; Gerolymatou, A Ber. Bunsen-Ges. Phys. Chem. 1984,88,359-
(34) Broderick, J. B.; Natan, M. J.; O'Halloran, T. V.; Van Duyne, R P.
(35) Boerio, F. J.; Tsai, W. H.; Hong, P. P.; Montaudo, G. Macromolecules 1989,
(36) Picorel, R; Chumanov, G.; Cotton, T. M.; Montoya, G.; Toon, S.; Siebert,
(37) Rospendowski, B. N.; Kelly, IC; Wolf, C. R; Smith, W. E.]. Am. Chem. SOC.
(38) McGlashen, M. L.; Davis, IC L.; Moms, M. D. Anal. Chem. 1990,62,846-
1444.
Chem. 1985, 89, 4051-4054.
970.
Condens. Matter 1991, 43, 4605-4612.
190-196.
363.
Biochemisty 1993, 32, 13771-13776.
22, 3955-3960.
M. ]. Phys. Chem. 1994, 98, 6017-6022.
1991, 113, 1217-1225.
849.
Analytical Chemistry, Vol. 67, No. 4, February 15, 1995 735
Scheme 1 Scheme 2
9 ,
would agree that potential.
the technique has not lived up to its enormous
The problem has been the inability of any previous surface to meet all, or even most, of the essential criteria that would define a truly useful SERS substrate: strongly enhancing, reproducible, uniformly rough, easy to fabricate, and stable over time. Bio- compatibility is also extremely important, insofar as previous studies demonstrating partial or full protein denaturation upon adsorption to SERsactive s u b ~ t r a t e s ~ ~ ~ ~ ~ have proven to be a major setback to the use of SERS in biological systems. Other desirable characteristics include electromagnetic tunability (i.e., the ability to control the wavelength where optimal enhancement so as to match the substrate to the photon source), electrochemi- cal addressability (to control the extent of adsorption4 and the redox state of adsorbed species43), a lack of surface "activation" steps, and a low cost per substrate.
We report here a new approach to SERS substrates that meets all of the criteria delineated above. Our strategy involves assembly of colloidal Au particles into macroscopic two-dimensional arrays on polymer-immobilized substrates (Scheme 1). In the first, covalent approach, reactive hydroxyl/oxide groups are generated on a substrate. For many substrates (glass, metal, etc.), such functional groups are already present in high concentration. A second step involves surface-initiated polymerization of bifunc- tional organosilanes such as (R0)3Si (CH2)3A. The alkoxysilane forms covalent attachments to the surface via hydrolysis. The pendant functional group A, chosen for its high affinity toward noble metal surfaces, extends out into solution. In the final step, the polymerderivatized substrate is immersed into a solution of colloidal Au particles, where surface assembly spontaneously occurs. An alternate approach based on high-affinity binding of streptavidin to biotin can also be used (Scheme 2).44.45 Here, a
(39) Todd, E. A; Moms, M. D. Appl. Spectrosc. 1993.47,855-857. (40) Holt, R E.; Cotton, T. M.J. Am. Chem. Sot. 1989, 111,2815-2821. (41) Lee, N.-S.; Hsieh, Y.-2.; Moms, M. D.; Schopfer, L M. J. Am. Chem. Soc.
(42) Chase, B.; Parkinson, B.J. Phys. Chem. 1991,95,7810-7813. (43) Nie, S. Ph.D. Thesis, Northwestem University, Evanston, IL, 1989. (44) Wilchek, M.; Bayer, E. A Anal. Biochem. 1988, 171, 1. (45) Anzai, J.; Hoshi, T.; Osa, T. Trends Anal. Chem. 1994, 13,205-210.
1987,109, 1353-1363.
= streptavidin ?= biotin a = bovine serum albumin
biotinylated surface is reacted with a colloidal Au-streptavidin conjugate to form a colloid-based surface held together by noncovalent interactions.
With molecular self-assembly on metal substrate^^^^^^ now established as an important route to controlling interfacial proper- ties, it should be pointed out that the two approaches delineated in Schemes 1 and 2 define what is essentially the inverse process: self-assembly of welldefined particulate metal films on organic substrates. The term self-assembly refers to our finding that interparticle spacing is governed by interparticle repulsive forces. We have explored this chemism in detail by varying substrate, polymer, colloid diameter, and reaction conditions. Moreover, the electrochemical characteristics of colloid-based surfaces, the kinetics of surface formation, and the electromagnetic properties of composite particles have been This report describes the basic steps involved in surface assembly and characterization, as well as experimental verification of SERS activity. It should be noted that the use of bifunctional organosi- lanes as coupling agents between Au films and quartz substrates has been d e s ~ r i b e d ~ ~ . ~ and numerous reports of SERS spectra using colloidal Au and Ag have appeared."-% What distinguishes this work are the following features: macroscopic surfaces of controlled and uniform roughness can be prepared by self- assembly, the resulting substrates are compatible with biomol- ecules, and the surfaces exhibit a high degree of durability/ stability over time.
EXPERIMENTAL SECTION Materials. The following materials were obtained from
Aldrich: HAuCk3H20, AgNO3, trisodium citrate dihydrate, trans-
(46) Nuzzo, R G.; Allara, D. LJ. Am. Chem. Soc. 1983. 105,4481-4483. (47) Bain, C. D.; Whitesides, G. M. Angew. Chem., Int. Ed. Engl. 1989,28,506-
512. (48) Freeman, R G.; Grabar, K. C.; Allison, K J.; Bright, R. M.; Davis, J. A;
Guthrie, A P.; Hommer, M. B.; Jackson, M. A; Smith, P. C.; Walter, D. G.; Natan, M. J. Science. in press.
(49) Yee, J. K; Parry, D. B.; Caldwell. K D.; Hams, J. M. Langmuir 1991. 7, 307-313.
(50) Goss, C. A; Charych, D. H.; Majda, M. Anal. Chem. 1991. 63,85-88. (51) Ahem, A M.; Garrell, R L Langmuir 1991, 7, 254-261. (52) Angel, S. M.; Katz, L. F.; Archibald, D. D.; Honigs. D. E. Appl. Spectrosc.
(53) Clarkson, J.; Campbell, C.; Rospendowski. B. N.; Smith, W. E. J. Ruman
(54) Fomasiero, D.; Grieser, F. J. Chem. Phys. 1987,87,3213-3217.
1989.43.367-372.
Spectrosc. 1991.22. 771-775.
736 Analytical Chemistry, Vol. 67, No. 4, February 15, 1995
12-bis (4pyridyl) ethylene (BPE) , and trimethoxypropylsilane. The following organosilanes were obtained from Huls America, Inc., and used as received (3aminopropyl)trimethoxysilane (AFTh!lS), (3qanopropyl)dimethyl)methoxysilane (CPDMMS) , (3-mercap topropyl) methyl) dimethoxysilane (MPMDMS) , and (3qanopro- py1)triethoxysilane (CPTES). Concentrated HCl, HNO3, and HzS04 were purchased from J. T. Baker Inc., and 30% HzOz was obtained from VWR. CH30H (spectrophotometric grade) was obtained from EM Science; all HzO was 18 MQ, distilled through a Barnstead Nanopure water purification system. Streptavidin, bovine serum albumin (BSA), and 3-(N-maleimidopropionyl)- biocytin (MP-biocytin) were purchased from Sigma. BPE was recrystallized several times from a mixture of HzO and CH30H; the other materials were used as received. Substrates were obtained as follows: glass and quartz microscope slides from Fisher Scientifk and Technical Glass Products, respectively; SiO, coated TEM grids from Ted Pella, Inc.; and self-assembled monolayers (SAMs) of HS(CHZ)~~COZH on Au foil from literature pr0cedures.5~
Colloid Preparation. All glassware used in these prepara- tions was thoroughly cleaned in aqua regia (3 parts HCl, 1 part HN03), rinsed in triply distilled HzO, and oven-dried prior to use. Au colloids were prepared according to F r e n ~ ~ ~ or S~ the r l and~~ with slight modifkations. The following stock solutions were prepared from triply distilled HzO that had been filtered through a 0.8 ym membrane filter (Gelman Scientific): 1% HAuCL, 38.8 mM sodium citrate, and 1% sodium citrate. Other solutions were made fresh as needed using triply distilled, filtered HzO. Two typical Au preparations and one Ag preparation are described below.
Preparation I. In a 1 L round-bottom flask equipped with a condenser, 500 mL of 1 mM HAuCb was brought to a rolling boil with vigorous stirring. Rapid addition of 50 mL of 38.8 mM sodium citrate to the vortex of the solution resulted in a color change from pale yellow to burgundy. Boiling was continued for 10 min; the heating mantle was then removed, and stirring was continued for an additional 15 min. After the solution reached room temperature, it was filtered through a 0.8 ym Gelman membrane filter. The resulting solution of colloidal particles was characterized by an absorption maximum at 520 nm. Transmis- sion electron microscopy (TEM) indicated a particle size of 13 nm f 1.7 nm (100 particles sampled).
Preparation ZZ. In a 1 L round-bottom flask equipped with a condenser, 500 mL of 0.01% HAuCL was brought to a boil with vigorous stirring. To this solution was added 7.5 mL of 1% sodium citrate. The solution turned blue within 25 s; the final color change to red-violet occurred 70 s later. Boiling continued for an additional 10 min, the heating source was removed, and the colloid was stirred for another 15 min. TEM data indicated an average diameter of 18 nm 4.6 nm (89 particles sampled). Particle diameter was varied by adding larger or smaller amounts of sodium citrate to decrease or increase the particle size, respec- tively.
Ag colloid was prepared according to Lee and Meisel.% Using a heating plate and a 1 L flask, a solution of 90 mg &No3 in 500
(55) Bain, C. D.; Troughton, E. B.;Tao, Y.-T.; Evall, J.; Whitesides, G. M.; Nuzzo,
(56) Frens, G. Nature Phys. Sci. 1 9 7 3 , 2 4 1 , 2 0 - 2 2 . (57) Sutherland, W. S.; Winefordner, J. D. j . Colloid. Intelface Sci. 1 9 9 2 , 48,
(58) Lee, P. C.; Meisel, D. J. Phys. Chem. 1 9 8 2 , 8 6 , 3391-3395.
R G. J. Am. Chem. SOC. 1 9 8 9 , 111, 321-335.
129-141.
mL of triply distilled HzO was brought to boiling with rapid stirring. To this solution was added 10 mL of 1% sodium citrate. Boiling continued for 30 min, after which time the flask was removed from the heat source, and the solution was diluted with triply distilled H20 to obtain a final volume of 420 mL.
All colloids were stored at room temperature in dark bottles and were generally used within 1-2 months after preparation. Samples for particle sizing by TEM were prepared by drop coating 10 pL of the colloid onto a Formvar-coated Cu grid and allowing the sample to dry. Average sizes were determined by measuring diameters along a consistent axis throughout the sample.
Protein-Colloid Conjugates. Streptavidin-labeled Au par- ticles were prepared according to modifications of literature protocol^.^^^^ To 25 mL of colloidal Au (preparation I) were added 0.725 mL of streptavidin (0.34 mg/mL in triply distilled HzO) and 0.241 mL of BSA (7.24 mg/mL in triply distilled HzO). The protein-Au conjugates were observed to sediment within 24 h.
Surface Derivatization. Substrates were cleaned prior to derivatization as follows: glass and quartz, cut to dimensions of approximately 2 cm x 0.7 cm, were cleaned for 10 min in a bath consisting of 4 parts HzS04 to 1 part 30% HzOz at 60 "C. The samples were rinsed in spectrophotometric grade CH30H and stored in this solvent until needed. SiOdoated TEM grids were cleaned in an ozone plasma for 30 min using a home-built instrument. Cleaning often preceded use of the grids by several weeks; during this period, the grids were stored in TEM grid holders in air.
Derivatization of glass and quartz substrates with alkoxysilanes was accomplished in the following manner: clean substrates were submerged into vials of silane diluted 1:4 with spectrophotometric grade CH30H. After 24 h, the substrates were removed and rinsed profusely with CH30H to remove unbound monomer from the surface. At this point, silanized substrates were stored in CHr OH until needed. Prior to derivatization with colloidal Au, the substrates were rinsed with HzO; they were then immersed in vials of colloidal Au for 24 h. A final HzO rinse concluded the derivatization process. Similarly, carboxyl-terminated SAMs pre- pared on Au-coated silicon substrates were immersed in colloidal Au solutions for several days. The substrates were stored in HzO until needed for analysis.
Due to their inherent fragility and small size, greater care was required for the derivatization of TEM grids. Specikally, the SiO, coated TEM grids were immersed in neat silane for 3 h, followed by extensive methanol rinses and a HzO rinse. The rinsing was accomplished by pipetting solvent across the grid surface or by swishing the grid back and forth in a vial of solvent. Effort was made to minimize the solvent flow perpendicular to the grid face in order to better preserve the Formvar film. Finally, the grids were floated on a colloid solution for 12 h. Samples were rinsed with HzO and allowed to air-dry on filter paper prior to analysis.
Sample Preparation. Two methods were employed for mounting the substrates for SERS detection. The first method involved mounting the substrate via double-sided tape to a black mount positioned in the laser beam ('EM grids, SAM substrate). In the second, the substrate (glass or quartz) was supported in the front of a quartz cuvette by means of a Teflon block whose
(59) Handley, D. A In Colloidal Gold: Principles, Methods, and Applications; Hayat,
(60) Liesi, P.; Julien, J.-P.; Vilja, P.; Grosveld, F.; Rechanrdt, L. J. Histochem. M. A, Ed.; Academic Press: San Diego, 1989 Vol. 1, pp 13-32.
Cytochem. 1 9 8 6 , 34, 923.
Analytical Chemistry, Vol. 67, No. 4, February 15, 1995 737
height was only one-third that of the sample. This cuvette could be filled with solvent or empty. The cuvette rested in a snug, home-built cuvette holder. Both sample configurations were mounted on a stage such that the sample position could be adjusted in all three dimensions. For measurements carried out in air, solutions of BPE in CH30H were dropcoated onto the substrate surface and allowed to evaporate; alternatively, the substrates were placed in cuvettes containing known concentra- tions of BPE.
Instrumentation. SERS spectra were obtained with a Coher- ent Kr+ ion laser, Model 3000K, operated at 647.1 nm in TEMw. Spectral scanning and detection were accomplished through the use of a Spex Model 1404 scanning double monochromator with a pair of 1800 grooves/" gratings and a thermoelectrically cooled Hamamatsu R928 photomultiplier tube housed in a Products for Research casing. Monochromator entrance and exit slits were typically set at 700 pm, and center slits were set at 1400 pm to yield an effective band pass of 5 cm-'. Grating movement and spectral acquisition were controlled using the DM3000 software provided by Spex. Plasma lines were filtered out of the incident laser beam through the use of a band pass filter (Ealing ElectroOptics) or a premonochromator tuned to the 647 nm line (Optometrics). The laser beam was focused onto the substrate sample at an angle of <30° from the surface normal. Scattered radiation was collected and collimated with a Minolta 50 mm camera lens (H1.2) and focused through a polarization scrambler (Spex) onto the entrance slits of the monochromator.
Absorption spectra were obtained using a Hewlett-Packard 8452A diode array spectrophotometer (2 nm spectral resolution, 1 s integration time). Again, substrates in quartz cuvettes were maintained in an upright position through the use of a Teflon block. Transmission electron microscopy was performed on a JEOL Model 1200 EXII instrument operating at 80 kV accelerating voltage; the images were not manipulated, altered, or enhanced in any way.
RESULTS AND DISCUSSION Assembly Strategy. Scheme 1 depicts the basic strategy for
preparation of macroscopic two-dimensional surfaces by colloid assembly. Hydroxyl/oxide groups on the substrate surface provide active sites for the attachment of an alkoxysilane pos- sessing functional group A, where A has a high affinity for Au. Nanometer scale particles are then reacted with the derivatized surface. Colloidal Au particles can be prepared conveniently with reasonably high monodispersity in the 5-70 nm size range.59 With particles of this size, numerous linkages to the surface are to be expected: using the figure of 4.5 hydroxyl groups/nm2 on Si0z6l and assuming for the moment that the particles are cubic, a 15 nm diameter particle would have over 800 linkages. While this number is an overestimate, the particles are nevertheless tightly bound. As we describe below, the thermodynamic stability of these surfaces is very high, and exchange with molecules in solution containing the functional group A does not occur.
The method of Scheme 1 is very general. Our work has encompassed a multitude of variations on this theme. Viable substrates run the gamut from glass and SnOz to Pt and SiOr coated Cu TEM grids. Thus, samples can be prepared for a wide
(61) Kruger, A A. In Surface and Near-Surface Chemisty of Oxide Materials; Nowotny, J., Dufour, L. C.. Eds.; Elsevier Science Publishers: Amsterdam, 1988; pp 413-448.
range of applications and characterization requirements. Ad- ditionally, the structure of the organosilane coupling agent can be varied at both ends of the molecule: mono-, di-, and trialkox- ysilanes have been used successfully, as have molecules with CN, NH2, and SH end groups. The siloxane linkage is itself not necessary, as evidenced by colloid-based surfaces held together by noncovalent streptavidin-biotin linkages (Scheme 2). Our work has focused on Au and Ag particles, but with the right functional group A, a wide variety of colloidal particles could constitute building blocks for well-defined macroscopic surfaces.
This preparation method differs greatly from electrochemical roughening of electrodes and metal vapor deposition, the most common routes to solid SERS substrates. Each of these protocols yields surfaces with polydisperse roughness on the nanometer scale. This problem is circumvented by the methods of Schemes 1 and 2. Since the size of the colloid precursor can be easily varied and controlled, the defining roughness of the surface is prede- termined. Not only can the roughness be tuned according to experimental needs, but the roughness is uniform-all particles are of the same size and dimensions. This is of particular importance in SERS, where enhancement at the surface is directly correlated to nanometer scale roughness.
Two-dimensional colloid self-assembly also differs from the numerous methods for preparation of SERSactive substrates involving colloidal p a r t i ~ l e s . l ~ - ~ ~ , ~ ~ - ~ ~ In those methods, there is a single size of particle, but since there is no control over interparticle interactions, aggregates of ill-defined dimensions are often formed. In this work, strong covalent or noncovalent bonds to the substrate reduce the surface mobility of the nanoparticles and prevent the spontaneous coalescence of particles on the surface. Thus, the initial size uniformity is maintained.
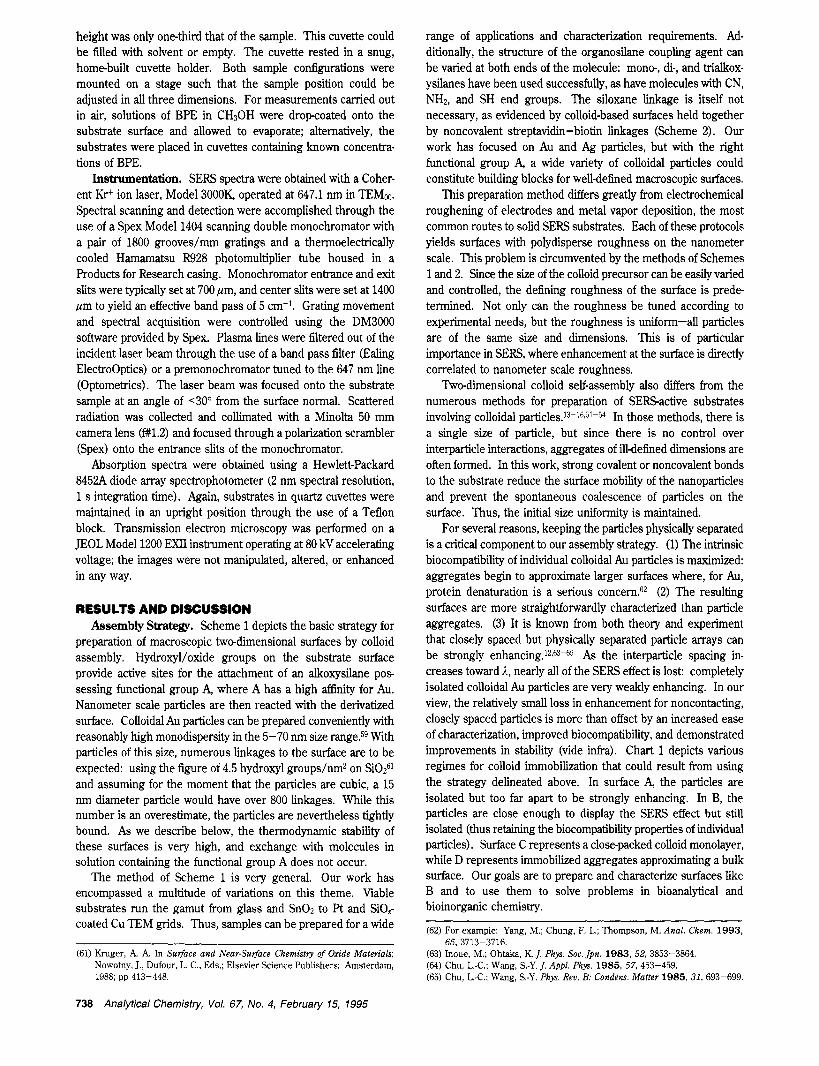
For several reasons, keeping the particles physically separated is a critical component to our assembly strategy. (1) The intrinsic biocompatibility of individual colloidal Au particles is maximized: aggregates begin to approximate larger surfaces where, for Au, protein denaturation is a serious concern.@ (2) The resulting surfaces are more straightforwardly characterized than particle aggregates. (3) It is known from both theory and experiment that closely spaced but physically separated particle arrays can be strongly e n h a n ~ i n g . ' ~ ~ ~ - ~ ~ As the interparticle spacing in- creases toward A, nearly all of the SERS effect is lost: completely isolated colloidal Au particles are very weakly enhancing. In our view, the relatively small loss in enhancement for noncontacting, closely spaced particles is more than offset by an increased ease of characterization, improved biocompatibility, and demonstrated improvements in stability (vide infra). Chart 1 depicts various regimes for colloid immobilization that could result from using the strategy delineated above. In surface A, the particles are isolated but too far apart to be strongly enhancing. In B, the particles are close enough to display the SERS effect but still isolated (thus retaining the biocompatibility properties of individual particles). Surface C represents a close-packed colloid monolayer, while D represents immobilized aggregates approximating a bulk surface. Our goals are to prepare and characterize surfaces like B and to use them to solve problems in bioanalytical and bioinorganic chemistry.
(62) For example: Yang, M.; Chung, F. L.; Thompson, M. Anal. Chem. 1993,
(63) Inoue, M.; Ohtaka, K. J. Phys. SOC. JPn. 1983, 52, 3853-3864.
(65) Chu, L.-C.; Wang, S.-Y. Phys. Rev. B: Condens. Matter 1985, 31, 693-699.
65, 3713-3716.
(64) Chu, L.-C.; Wmg, S:Y. J. Appl. PhF. 1985, 57, 453-459.
738 Analytical Chemistry, Vol. 67, No. 4, February 15, 1995
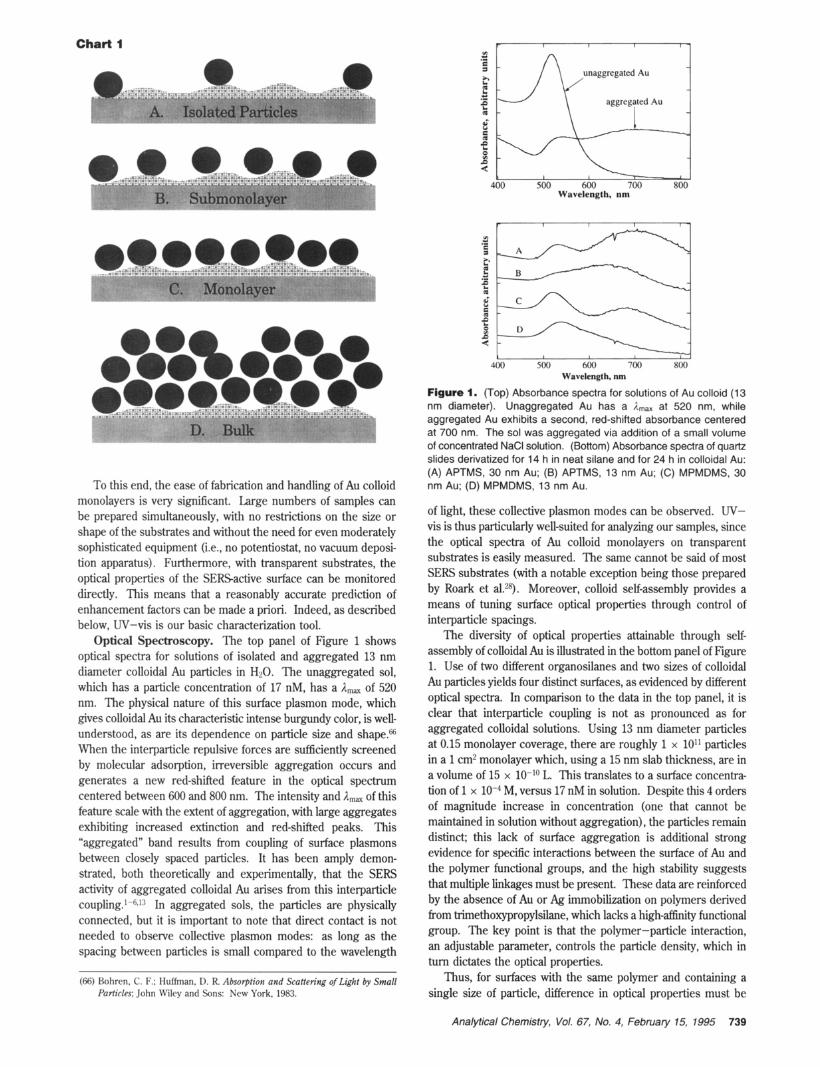
Chart I
A. Isolated Particles
B. Submonolayer
C. Monolayer
B
To this end, the ease of fabrication and handling of Au colloid monolayers is very significant. Large numbers of samples can be prepared simultaneously, with no restrictions on the size or shape of the substrates and without the need for even moderately sophisticated equipment (i.e., no potentiostat, no vacuum deposi- tion apparatus). Furthermore, with transparent substrates, the optical properties of the SERSactive surface can be monitored directly. This means that a reasonably accurate prediction of enhancement factors can be made a priori. Indeed, as described below, W-vis is our basic characterization tool.
Optical Spectroscopy. The top panel of Figure 1 shows optical spectra for solutions of isolated and aggregated 13 nm diameter colloidal Au particles in H20. The unaggregated sol, which has a particle concentration of 17 nM, has a Amax of 520 nm. The physical nature of this surface plasmon mode, which gives colloidal Au its characteristic intense burgundy color, is well- understood, as are its dependence on particle size and shape.ffi When the interparticle repulsive forces are sufficiently screened by molecular adsorption, irreversible aggregation occurs and generates a new red-shifted feature in the optical spectrum centered between 600 and 800 nm. The intensity and Amax of this feature scale with the extent of aggregation, with large aggregates exhibiting increased extinction and red-shifted peaks. This "aggregated" band results from coupling of surface plasmons between closely spaced particles. It has been amply demon- strated, both theoretically and experimentally, that the SERS activity of aggregated colloidal Au arises from this interparticle coupling.l-6J:i In aggregated sols, the particles are physically connected, but it is important to note that direct contact is not needed to observe collective plasmon modes: as long as the spacing between particles is small compared to the wavelength
(66) Bohren. C. F.; Huffman. D. R. Absotption and Scattering ofLight by Small Particles; John Wiley and Sons: New York, 1983.
I 1 I I
aggregated Au
Wavelength, nm
m h
400 500 600 700 800
Figure 1. (Top) Absorbance spectra for solutions of Au colloid (1 3 nm diameter). Unaggregated Au has a Rma, at 520 nm, while aggregated Au exhibits a second, red-shifted absorbance centered at 700 nm. The sol was aggregated via addition of a small volume of concentrated NaCl solution. (Bottom) Absorbance spectra of quartz slides derivatized for 14 h in neat silane and for 24 h in colloidal Au: (A) APTMS, 30 nm Au; (6) APTMS, 13 nm Au; (C) MPMDMS, 30 nm Au; (D) MPMDMS, 13 nm Au.
Wavelength, nm
of light, these collective plasmon modes can be observed. W- vis is thus particularly well-suited for analyzing our samples, since the optical spectra of Au colloid monolayers on transparent substrates is easily measured. The same cannot be said of most SERS substrates (with a notable exception being those prepared by Roark et a1.28). Moreover, colloid self-assembly provides a means of tuning surface optical properties through control of interparticle spacings.
The diversity of optical properties attainable through self- assembly of colloidal Au is illustrated in the bottom panel of Figure 1. Use of two different organosilanes and two sizes of colloidal Au particles yields four distinct surfaces, as evidenced by different optical spectra. In comparison to the data in the top panel, it is clear that interparticle coupling is not as pronounced as for aggregated colloidal solutions. Using 13 nm diameter particles at 0.15 monolayer coverage, there are roughly 1 x 10" particles in a 1 cm2 monolayer which, using a 15 nm slab thickness, are in a volume of 15 x 1O-Io L. This translates to a surface concentra- tion of 1 x M, versus 17 nM in solution. Despite this 4 orders of magnitude increase in concentration (one that cannot be maintained in solution without aggregation), the particles remain distinct; this lack of surface aggregation is additional strong evidence for specific interactions between the surface of Au and the polymer functional groups, and the high stability suggests that multiple linkages must be present, These data are reinforced by the absence of Au or Ag immobilization on polymers derived from trimethoxypropylsilane, which lacks a high-affinity functional group. The key point is that the polymer-particle interaction, an adjustable parameter, controls the particle density, which in turn dictates the optical properties.
Thus, for surfaces with the same polymer and containing a single size of particle, difference in optical properties must be
Analytical Chemistry, Vol. 67, No. 4, February 15, 1995 739
I I years after 7 months l a / initial O * * t /o 0.2
400 500 600 700 400 500 600 700 Wavelength (nm) Wavelength (nm)
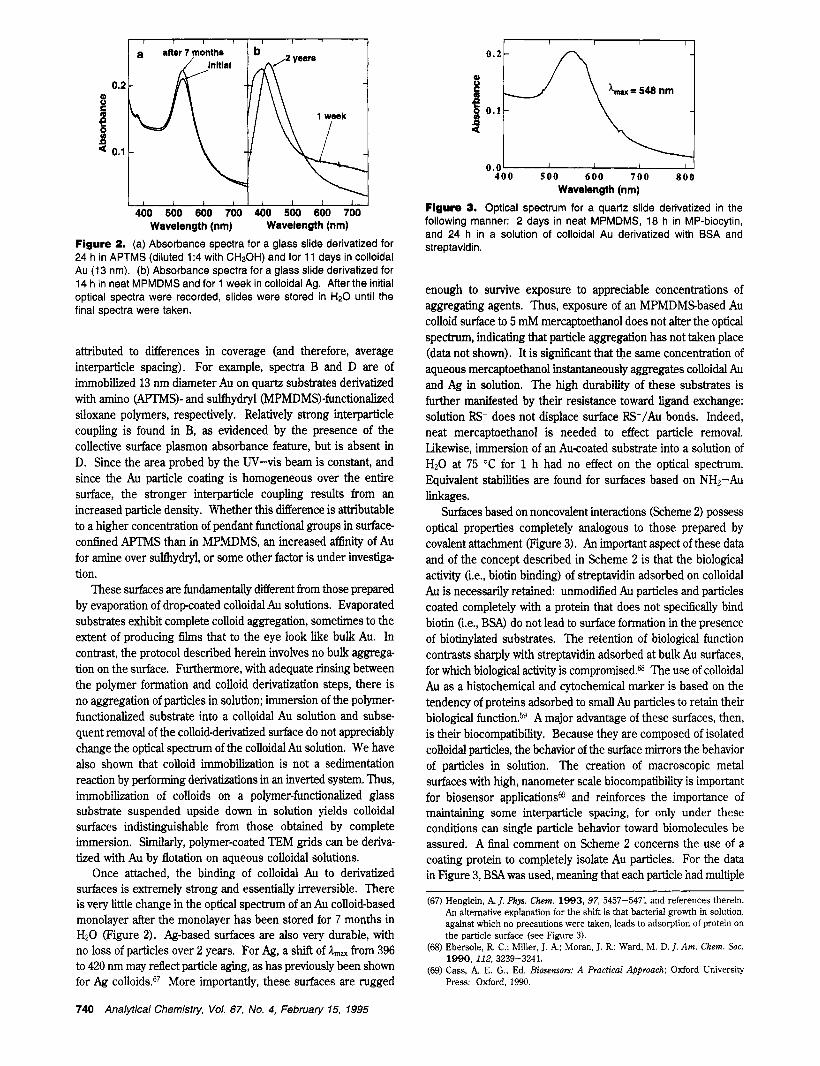
Figure 2. (a) Absorbance spectra for a glass slide derivatized for 24 h in APTMS (diluted 1:4 with CH30H) and for 11 days in colloidal Au (13 nm). (b) Absorbance spectra for a glass slide derivatized for 14 h in neat MPMDMS and for 1 week in colloidal Ag. After the initial optical spectra were recorded, slides were stored in H20 until the final spectra were taken.
attributed to differences in coverage (and therefore, average interparticle spacing). For example, spectra B and D are of immobilized 13 nm diameter Au on quartz substrates derivatized with amino (APTMS)- and sulfhydryl (MPMDMS)-functionalbed siloxane polymers, respectively. Relatively strong interparticle coupling is found in B, as evidenced by the presence of the collective surface plasmon absorbance feature, but is absent in D. Since the area probed by the UV-vis beam is constant, and since the Au particle coating is homogeneous over the entire surface, the stronger interparticle coupling results from an increased particle density. Whether this difference is attributable to a higher concentration of pendant functional groups in surface- confined APTMS than in MPMDMS, an increased afEnity of Au for amine over sulfhydryl, or some other factor is under investiga- tion.
These surfaces are fundamentally different from those prepared by evaporation of dropcoated colloidal Au solutions. Evaporated substrates exhibit complete colloid aggregation, sometimes to the extent of producing films that to the eye look like bulk Au. In contrast, the protocol described herein involves no bulk aggrega- tion on the surface. Furthermore, with adequate rinsing between the polymer formation and colloid derivatization steps, there is no aggregation of particles in solution; immersion of the polymer- functionalized substrate into a colloidal Au solution and subse- quent removal of the colloidderivatized surface do not appreciably change the optical spectrum of the colloidal Au solution. We have also shown that colloid immobilization is not a sedimentation reaction by performing denvatkitions in an inverted system. Thus, immobilization of colloids on a polymer-functionalbed glass substrate suspended upside down in solution yields colloidal surfaces indistinguishable from those obtained by complete immersion. Similarly, polymer-coated TEM grids can be deriva- tized with Au by flotation on aqueous colloidal solutions.
Once attached, the binding of colloidal Au to derivatized surfaces is extremely strong and essentially irreversible. There is very little change in the optical spectrum of an Au colloid-based monolayer after the monolayer has been stored for 7 months in HzO (Figure 2). Ag-based surfaces are also very durable, with no loss of particles over 2 years. For Ag, a shift of I,, from 396 to 420 nm may reflect particle aging, as has previously been shown for Ag colloids.67 More importantly, these surfaces are rugged
0.01 I 1 I I 400 500 6 0 0 7 0 0 8 0 0
Wavelength (nm)
Figure 3. Optical spectrum for a quartz slide derivatized in the following manner: 2 days in neat MPMDMS, 18 h in MP-biocytin, and 24 h in a solution of colloidal Au derivatized with BSA and streptavidin.
enough to survive exposure to appreciable concentrations of aggregating agents. Thus, exposure of an MPMDMSbased Au colloid surface to 5 mh4 mercaptoethanol does not alter the optical spectrum, indicating that particle aggregation has not taken place (data not shown). It is signiscant that the same concentration of aqueous mercaptoethanol instantaneously aggregates colloidal Au and Ag in solution. The high durability of these substrates is further manifested by their resistance toward ligand exchange: solution RS- does not displace surface RS-/Au bonds. Indeed, neat mercaptoethanol is needed to effect particle removal. Likewise, immersion of an Au-coated substrate into a solution of HzO at 75 "C for 1 h had no effect on the optical spectrum. Equivalent stabilities are found for surfaces based on NH2-Au linkages.
Surfaces based on noncovalent interactions (Scheme 2) possess optical properties completely analogous to those prepared by covalent attachment (Figure 3). An important aspect of these data and of the concept described in Scheme 2 is that the biological activity (i.e., biotin binding) of streptavidin adsorbed on colloidal Au is necessarily retained: unmodified Au particles and particles coated completely with a protein that does not specifically bind biotin (Le., BSA) do not lead to surface formation in the presence of biotinylated substrates. The retention of biological function contrasts sharply with streptavidin adsorbed at bulk Au surfaces, for which biological activity is compromised.@ The use of colloidal Au as a histochemical and cytochemical marker is based on the tendency of proteins adsorbed to small Au particles to retain their biological function.59 A major advantage of these surfaces, then, is their biocompatibility. Because they are composed of isolated colloidal particles, the behavior of the surface mirrors the behavior of particles in solution. The creation of macroscopic metal surfaces with high, nanometer scale biocompatibility is important for biosensor applicati0ns6~ and reinforces the importance of maintaining some interparticle spacing, for only under these conditions can single particle behavior toward biomolecules be assured. A final comment on Scheme 2 concerns the use of a coating protein to completely isolate Au particles. For the data in Figure 3, BSA was used, meaning that each particle had multiple
(67) Henglein, A J. Phys. Chem. 1993, 97, 5457-5471 and references therein. An altemative explanation for the shift is that bacterial growth in solution, against which no precautions were taken, leads to adsorption of protein on the particle surface (see Figure 3).
(68) Ebersole, R C.; Miller, J. A; Moran, J. R; Ward, M. D. J . Am. Chem. SOC. 1990, 112, 3239-3241.
(69) Cass, A E. G., Ed. Biosensors: A Practical Approach; Oxford University Press: Oxford. 1990.
740 Analytical Chemisfry, Vol. 67, No. 4, February 15, 1995
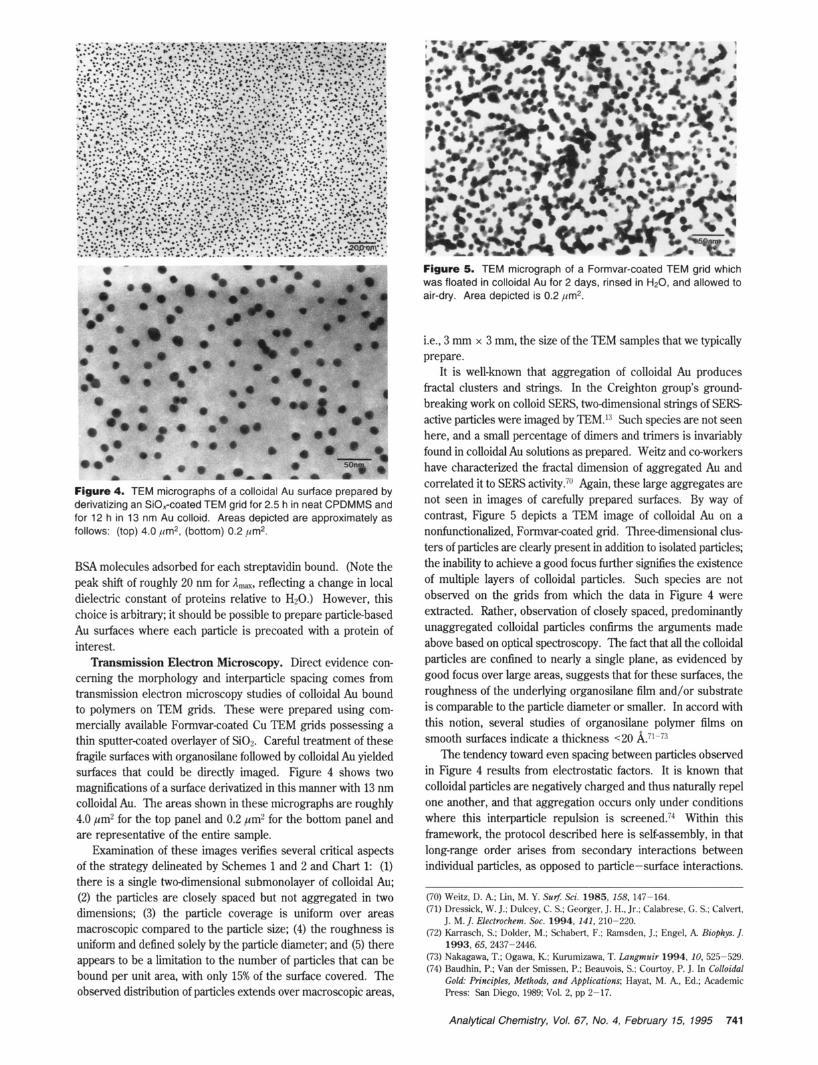
Figure 5. TEM micrograph of a Formvar-coated TEM grid which was floated in colloidal Au for 2 days, rinsed in H20, and allowed to air-dry. Area depicted is 0.2 pm2.
i.e., 3 mm x 3 mm, the size of the TEM samples that we typically prepare.
It is well-known that aggregation of colloidal Au produces fractal clusters and strings. In the Creighton group’s ground- breaking work on colloid SERS, two-dimensional strings of SERS active particles were imaged by TEM.13 Such species are not seen here, and a small percentage of dimers and trimers is invariably found in colloidal Au solutions as prepared. Weitz and ceworkers have characterized the fractal dimension of aggregated Au and correlated it to SERS activity.70 Again, these large aggregates are not Seen in images Of prepared surfaces. By way Of contrast, figure 5 depicts a TEM image of colloidal on a nonfunctionalized, Formvar-coated grid. Three-dimensional clus-
Figure 4. TEM micrographs of a colloidal Au surface prepared by derivatizing an SiOxcoated TEM grid for 2.5 h in neat CPDMMS and for 12 h in 13 nm Au colloid. Areas depicted are approximately as follows: (top) 4.0 pm2, (bottom) 0.2 pm2.
BSA molecules adsorbed for each streptavidin bound. (Note the peak shift of roughly 20 nm for Amax, reflecting a change in local dielectric constant of proteins relative to HzO.) However, this choice is arbitrary; it should be possible to prepare particlebased Au surfaces where each particle is precoated with a protein of interest. Transmission Electron Microscopy. Direct evidence con-
cerning the morphology and interparticle spacing comes from transmission electron microscopy studies of colloidal Au bound to polymers on TEM grids. These were prepared using com- mercially available Formvar-coated Cu TEM grids possessing a thin sputter-coated overlayer of SiOz. Careful treatment of these fragile surfaces with organosilane followed by colloidal Au yielded surfaces that could be directly imaged. Figure 4 shows two magnifications of a surface derivatized in this manner with 13 nm colloidal Au. The areas shown in these micrographs are roughly 4.0 pm2 for the top panel and 0.2 pm2 for the bottom panel and are representative of the entire sample.
Examination of these images verifies several critical aspects of the strategy delineated by Schemes 1 and 2 and Chart 1: (1) there is a single two-dimensional submonolayer of colloidal Au; (2) the particles are closely spaced but not aggregated in two dimensions; (3) the particle coverage is uniform over areas macroscopic compared to the particle size; (4) the roughness is uniform and defined solely by the particle diameter; and (5) there appears to be a limitation to the number of particles that can be bound per unit area, with only 15% of the surface covered. The observed distribution of particles extends over macroscopic areas,
ters of particles are clearly present in addition to isolated particles; the inability to achieve a good focus further signifies the existence of multiple layers of colloidal particles. Such species are not observed on the grids from which the data in Figure 4 were extracted. Rather, observation of closely spaced, predominantly unaggregated colloidal particles confirms the arguments made above based on optical spectroscopy. The fact that all the colloidal particles are confined to nearly a single plane, as evidenced by good focus over large areas, suggests that for these surfaces, the roughness of the underlying organosilane film and/or substrate is comparable to the particle diameter or smaller. In accord with this notion, several studies of organosilane polymer films on smooth surfaces indicate a thickness <20 81.71-73
The tendency toward even spacing between particles observed in Figure 4 results from electrostatic factors. It is known that colloidal particles are negatively charged and thus naturally repel one another, and that aggregation occurs only under conditions where this interparticle repulsion is ~creened.7~ Within this framework, the protocol described here is self-assembly, in that long-range order arises from secondary interactions between individual particles, as opposed to particle-surface interactions.
(70) Weitz. D. A; Lin. M. Y. Surf: Sei. 1985, 158, 147-164. (71) Dressick. W. J.; Dulcey, C. S.; Georger, J. H., Jr.; Calabrese, G. S.; Calvert,
(72) Karrasch, S.; Dolder, M.; Schabert, F.; Ramsden, J.; Engel, A Biophys. J.
(73) Nakagawa. T.; Ogawa, IC; Kurumiziwa. T. Lungmuir 1994, IO, 525-529. (74) Baudhin. P.; Van der Smissen, P.; Beauvois, S.; Courtoy, P. J. In Colloidal
Gold: Principles, Methods, and Applications; Hayat, M. A. Ed.; Academic Press: San Diego, 1989; Vol. 2, pp 2-17.
J. M. J. Electrochem. SOC. 1994, 141, 210-220.
1993,65,2437-2446.
Analytical Chemistry, Vol. 67, No. 4, February 15, 1995 741
9 4000t I A 3000
B .* d I 2 0 0 0 -
2000 1500 1000 500 Raman shift, cm.'
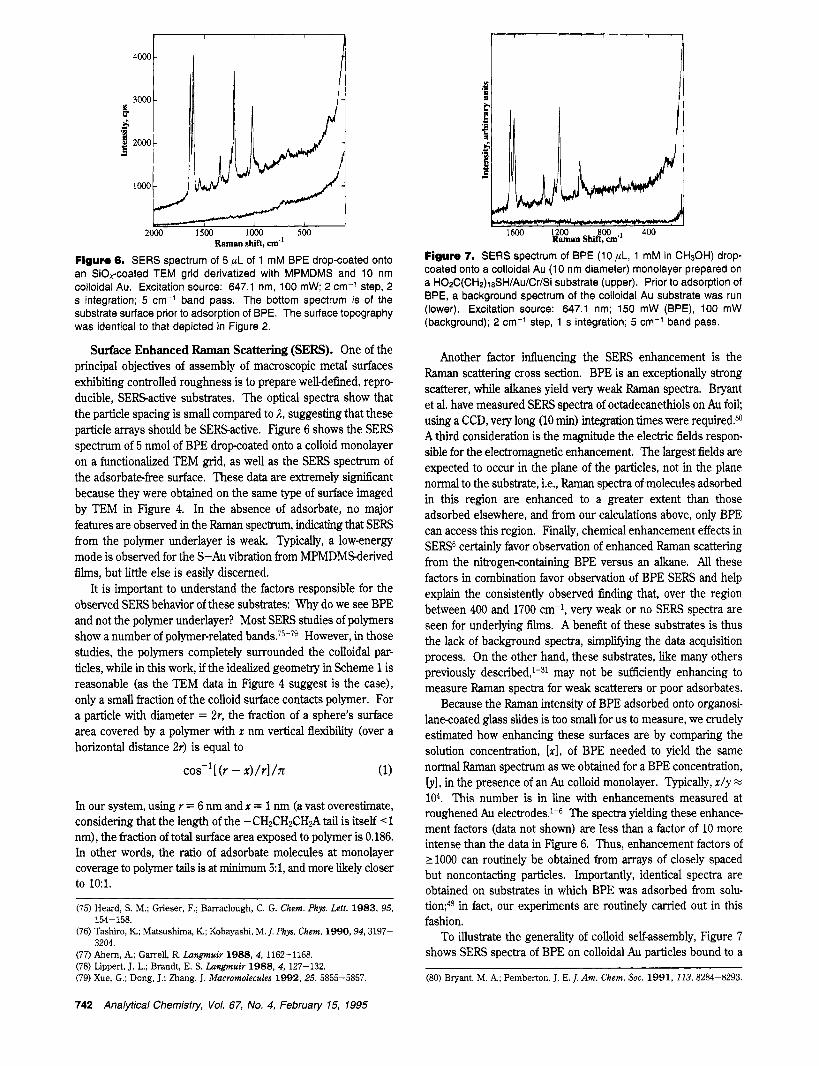
Figure 6. SERS spectrum of 5 pL of 1 mM BPE drop-coated onto an SiOrcoated TEM grid derivatized with MPMDMS and 10 nm colloidal Au. Excitation source: 647.1 nm, 100 mW; 2 cm-' step, 2 s integration; 5 cm-' band pass. The bottom spectrum is of the substrate surface prior to adsorption of BPE. The surface topography was identical to that depicted in Figure 2.
Surface Enhanced Raman Scattering (SEW). One of the principal objectives of assembly of macroscopic metal surfaces exhibiting controlled roughness is to prepare well-defined, repro- ducible, SERSactive substrates. The optical spectra show that the particle spacing is small compared to 1, suggesting that these particle arrays should be SERSactive. Figure 6 shows the SERS spectrum of 5 nmol of BPE dropcoated onto a colloid monolayer on a functionalized TEM grid, as well as the SERS spectrum of the adsorbate-free surface. These data are extremely significant because they were obtained on the same type of surface imaged by TEM in Figure 4. In the absence of adsorbate, no major features are observed in the Raman spectrum, indicating that SERS from the polymer underlayer is weak. Typically, a lowenergy mode is observed for the S-Au vibration from MPMDMSderived films, but little else is easily discerned.
It is important to understand the factors responsible for the observed SERS behavior of these substrates: Why do we see BPE and not the polymer underlayer? Most SERS studies of polymers show a number of polymer-related band^.^^-^^ However, in those studies, the polymers completely surrounded the colloidal par- ticles, while in this work, if the idealized geometry in Scheme 1 is reasonable (as the TEM data in Figure 4 suggest is the case), only a small fraction of the colloid surface contacts polymer. For a particle with diameter = 2r, the fraction of a sphere's surface area covered by a polymer with x nm vertical flexibility (over a horizontal distance 2r) is equal to
(1) cos-1 [ (r - x ) /rl /n
In our system, using r = 6 nm and x = 1 nm (a vast overestimate, considering that the length of the -CH&HzCHA tail is itself 1 nm), the fraction of total surface area exposed to polymer is 0.186. In other words, the ratio of adsorbate molecules at monolayer coverage to polymer tails is at min ium 5:1, and more likely closer to 103.
(75) Heard, S. M.; Grieser, F.; Barraclough, C. G. Chem. Phys. Lett 1983, 95,
(76) Tashiro, K; Matsushima, IC; Kobayashi, M. J. Phys. Chem. 1990,94,3197-
(77) Ahem, A; Garrell, R Longmuir 1988, 4, 1162-1168. (78) Lippert, J. L.; Brandt, E. S. Langmuir 1988, 4, 127-132. (79) Xue, G.; Dong, J.; Zhang, J. Macromolecules 1992, 25, 5855-5857.
154- 158.
3204.
i'l 9 II I
1600 I200 800 ., 400 Raman Shift, cm
Figure 7. SERS spectrum of BPE (lOpL, 1 mM in CH30H) drop- coated onto a colloidal Au (10 nm diameter) monolayer prepared on a H02C(CH&&HIAu/Cr/Si substrate (upper). Prior to adsorption of BPE, a background spectrum of the colloidal Au substrate was run (lower). Excitation source: 647.1 nm; 150 mW (BPE), 100 mW (background); 2 cm-I step, 1 s integration; 5 cm-I band pass.
Another factor influencing the SERS enhancement is the Raman scattering cross section. BPE is an exceptionally strong scatterer, while alkanes yield very weak Raman spectra. Bryant et al. have measured SERS spectra of octadecanethiols on Au foil; using a CCD, very long (10 min) integration times were required.80 A third consideration is the magnitude the electric fields respon- sible for the electromagnetic enhancement. The largest fields are expected to occur in the plane of the particles, not in the plane normal to the substrate, i.e., Raman spectra of molecules adsorbed in this region are enhanced to a greater extent than those adsorbed elsewhere, and from our calculations above, only BPE can access this region. Finally, chemical enhancement effects in S E E 6 certainly favor observation of enhanced Raman scattering from the nitrogen-containing BPE versus an alkane. All these factors in combination favor observation of BPE SERS and help explain the consistently observed finding that, over the region between 400 and 1700 cm-l, very weak or no SERS spectra are seen for underlying films. A benefit of these substrates is thus the lack of background spectra, simplifying the data acquisition process. On the other hand, these substrates, like many others previously may not be sufficiently enhancing to measure Raman spectra for weak scatterers or poor adsorbates.
Because the Raman intensity of BPE adsorbed onto organosi- lanecoated glass slides is too small for us to measure, we crudely estimated how enhancing these surfaces are by comparing the solution concentration, [ X I , of BPE needed to yield the same normal Raman spectrum as we obtained for a BPE concentration, b], in the presence of an Au colloid monolayer. Typically, x l y %
104. This number is in line with enhancements measured at roughened Au The spectra yielding these enhance- ment factors (data not shown) are less than a factor of 10 more intense than the data in Figure 6. Thus, enhancement factors of zl000 can routinely be obtained from arrays of closely spaced but noncontacting particles. Importantly, identical spectra are obtained on substrates in which BPE was adsorbed from solu- tion;@ in fact, our experiments are routinely carried out in this fashion.
To illustrate the generality of colloid self-assembly, Figure 7 shows SERS spectra of BPE on colloidal Au particles bound to a
(80) Bryant, M. A; Pemberton, J . E. J. Am. Chem. SOC. 1991, 113, 8284-8293.
742 Analytical Chemisfry, Vol. 67, No. 4, February 75, 7995
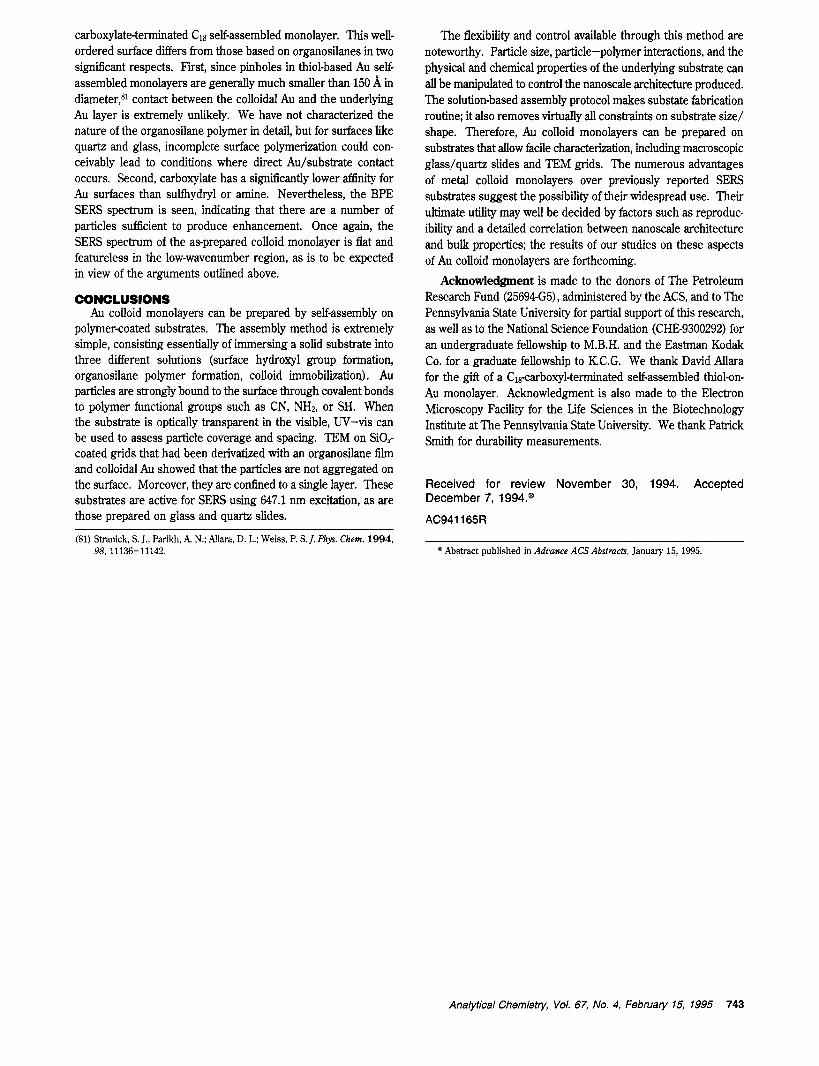
carboxylate-terminated CIS self-assembled monolayer. This well- ordered surface differs from those based on organosilanes in two significant respects. First, since pinholes in thiol-based Au self- assembled monolayers are generally much smaller than 150 A in diameter,8l contact between the colloidal Au and the underlying Au layer is extremely unlikely. We have not characterized the nature of the organosilane polymer in detail, but for surfaces like quartz and glass, incomplete surface polymerization could con- ceivably lead to conditions where direct Au/substrate contact occurs. Second, carboxylate has a significantly lower affinity for Au surfaces than sulfkydryl or amine. Nevertheless, the BPE SERS spectrum is seen, indicating that there are a number of particles sufticient to produce enhancement. Once again, the SERS spectrum of the as-prepared colloid monolayer is flat and featureless in the low-wavenumber region, as is to be expected in view of the arguments outlined above.
CONCLUSIONS Au colloid monolayers can be prepared by self-assembly on
polymer-coated substrates. The assembly method is extremely simple, consisting essentially of immersing a solid substrate into three different solutions (surface hydroxyl group formation, organosilane polymer formation, colloid immobilization). Au particles are strongly bound to the surface through covalent bonds to polymer functional groups such as CN, NH2, or SH. When the substrate is optically transparent in the visible, UV-vis can be used to assess particle coverage and spacing. TEM on SiOr coated grids that had been derivatized with an organosilane film and colloidal Au showed that the particles are not aggregated on the surface. Moreover, they are confined to a single layer. These substrates are active for SERS using 647.1 nm excitation, as are those prepared on glass and quartz slides.
The flexibility and control available through this method are noteworthy. Particle size, particle-polymer interactions, and the physical and chemical properties of the underlying substrate can all be manipulated to control the nanoscale architecture produced. The solution-based assembly protocol makes substate fabrication routine; it also removes virtually all constraints on substrate size/ shape. Therefore, Au colloid monolayers can be prepared on substrates that allow facile characterization, including macroscopic glass/quartz slides and TEM grids. The numerous advantages of metal colloid monolayers over previously reported SERS substrates suggest the possibility of their widespread use. Their ultimate utility may well be decided by factors such as reproduc- ibility and a detailed correlation between nanoscale architecture and bulk properties; the results of our studies on these aspects of Au colloid monolayers are forthcoming.
Acknowledgment is made to the donors of The Petroleum Research Fund (25694G5), administered by the ACS, and to The Pennsylvania State University for partial support of this research, as well as to the National Science Foundation (CHE9300292) for an undergraduate fellowship to M.B.H. and the Eastman Kodak Co. for a graduate fellowship to K.C.G. We thank David Allara for the gift of a Clgcarboxyl-terminated self-assembled thiol-on- Au monolayer. Acknowledgment is also made to the Electron Microscopy Facility for the Life Sciences in the Biotechnology Institute at The Pennsylvania State University. We thank Patrick Smith for durability measurements.
Received for review November 30, 1994. Accepted December 7, 1994.@
AC941165R ~~
(81) Stranick, S. J.; Parikh, A N.; Allara, D. L.; Weiss, P. S.J. Phys. Chem. 1994, 98, 11136-11142. @ Abstract published in Advance ACS Abstracts, January 15, 1995.
Analytical Chemistry, Vol. 67, No. 4, February 15, 1995 743