Embed Size (px)
Citation preview

GSJ: Volume 6, Issue 4, APRIL 2018 120
GSJ© 2018
www.globalscientificjournal.com
GSJ: Volume 6, Issue 4, April 2018, Online: ISSN 2320-9186
www.globalscientificjournal.com
PREPARATION AND CHARACTERIZATION OF RESOMER
RG 503 BASED NANOSUSPENSION FOR OPHTHALMIC
IN SITU GEL OF SULPHACETAMIDE Pinal J. Patel*, Dr. J. K. Patel, Dr. Anita P. Patel
Pinal J. Patel, Nootan Pharmacy College, Visnagar, Gujarat,India, [email protected]
ABSTRACT
The purpose of studywas to develop Resomer RG 503 based nanosuspension for ophthalmic in situ gel
of sulphacetamide using nanoprecipitation method to improve absorption, penetration, retention time at
the site of action in treatment of conjunctivitis.The process was optimized by studying the effect of
various process parameters on the size of nanosuspension using factorial design approach. Various
formulations of PLGA nanoparticles prepared by nanoprecipitation method which affect the properties
like particle size, drug release study and entrapment efficiency.Particle size of nanosuspension is
controlled by Stabilizer ratio, the Organic/aqueous phase volume ratio.The O/A ratio was exercised as
1:12 in which organic phase composed of mixture of acetone and ethanol in ratio of 5:1. Gellan gum
(1.7%) is used in situ gelling polymer.FTIR and DSC study revealed no interaction between
Sulphacetamide and excipients. Formulation parameters were optimized by 23 factorial designs. SEM
imaging was confirmed the nanosized drug particles. The optimized formulation shows spherical shape
and mean particle diameter 107.0 nm. Ophthalmic in situ gel of Sulphacetamide exhibits 88.58% total
cumulative release up to 8 h. In conclusion in situ forming gel comprise of resomer RG 503 is a
promising tool in treatment of conjunctivitis.
Key words: Sulphacetamide, Resomer RG 503, Nanosuspension, Nanoprecipitation, In-situ gel,
Gellan gum

GSJ: Volume 6, Issue 4, APRIL 2018 121
GSJ© 2018
www.globalscientificjournal.com
INTRODUCTION
Conjunctivitis is an inflammatory process of the conjunctiva that varies in mild hyperemia to sever
purulent discharge. The more common causes of conjunctivitis include viruses, allergies,
environmental irritants, contact lenses and chemicals, the more commonly reported infection agents are
adenovirus and herpes simplex virus, followed by other viral and bacterial source. Effective
management is based on selection of an appropriate antibiotic for suspected bacterial pathogens[1]
.
An ideal drug therapy achieves effective concentration of drug at the target for a specified period of
time in order to minimize general and local side effects. An exciting challenge for developing suitable
drug delivery systems targeted for ocular diseases is one of today’s major focuses of pharmaceutical
scientists. Conventionally, most ocular diseases or disorders are treated with water-soluble drugs in
aqueous solution while water insoluble drugs in ointments or aqueous suspension [2]
.
Sulphacetamide is sulfonamides antibiotics used to treat pink eye (conjunctivitis)[3]
.They are
bacteriostatic in nature and inhibit bacterial synthesis of dihydrofolic acid by preventing condensation
of pteridine with amino benzoic acid through competitive inhibition of the enzyme dihydropteroate
synthetized[4]
. The drug is marketed as ophthalmic solution of its sodium salt, in a USP concentration
of 10 %(W/V) under the brand name Blepha®-10. The usual adult dose for conjunctivitis is 1 to 2
drops into the conjunctival sac every 2 to 3 h for 7 to 10 days[5]
The drug has an ionization constant of
5.4 and an elimination half-life 3of 7 to 13 h[5]
.
The Aim of present study to prepare nanosuspension based ophthalmicin-situ gel of Sulphacetamide in
order to improve absorption, penetration, retention time and antibacterial activity at site of
action.Resomer RG 503 nanosuspension attractive colloidal system as compare to conventional
dosageforms it having increase stability and longer elimination half-life in tear.
MATERIALS AND METHOD
Sulphacetamide was received from Ishita Pharma Ahemdabad, Resomer RG 503 was obtained from
Evonic industry Mumbai, gellan gum was obtained from ostrich bioscience Coimbatore, poloxamer
188 obtained from Chemdyes Corporation Ahemdabad, and other chemicals were analytical grade.
Method Preparation of Sulphacetamide Nanosuspension
In this method polymer (PLGA) is dissolved in organic phase contain Acetone: Ethanol in a different
ratio. Aqueous phase is prepared using poloxomer 188 in ultrapure water.Organic phase is Drop wise
added into aqueous phase with continuous stirring. Mixture is stirred for 4 h at 2400 rpm speed 6.

GSJ: Volume 6, Issue 4, APRIL 2018 122
GSJ© 2018
www.globalscientificjournal.com
Optimization formulation using 23design
23
design is used to study the effect of variables different variables on the quality determinant
parameters of any formulation. Based on the principle of design of experiments, this design was
working to study the effect of three independent factors. A 23 factorial design for three factors at two
levels each was selected to optimize the varied response variables. The three factors are organic to
aqueous ratio(X1), Poloxamer 188(X2) and Gellan gum(X3) and the levels were suitable coded.
Particle size (nm), gelling time(s) and Drug release (%) were taken as response variables. In this design
three factors are evaluated each at two levels. Experimental trials were performed at 8 possible
combinations. Regression polynomials equations for dependent variables were calculated by design
expert software version 10.
Table1:Variables levels for 23 factorial design
Variables -1(Low) +1(High)
Organic to aqueous phase 1:7 1:12
Poloxamer 188 400 600
Gellan gum 1.5 1.7
Table2:Formulation of nanosuspension based ophthalmic in situ gel of Sulphacetamide
Ingredients F1 F2 F3 F4 F5 F6 F7 F8
Sulphacetamide (%) 10 10 10 10 10 10 10 10
Resomer RG
503(mg)
100 100 100 100 100 100 100 100
Poloxamer 188(mg) 400 400 600 600 400 400 600 600
Acetone:Ehanol(ml) 5:1 5:1 5:1 5:1 5:1 5:1 5:1 5:1
Organic to aqueous
phase ratio
1:7 1:12 1:7 1:12 1:7 1:12 1:7 1:12
Gellangum(%) 1.5 1.5 1.5 1.5 1.7 1.7 1.7 1.7
Water(ml) 100 100 100 100 100 100 100 100
EVALUATION PARAMETERS
Thermal analysis using differential scanning calorimetric [7]

GSJ: Volume 6, Issue 4, APRIL 2018 123
GSJ© 2018
www.globalscientificjournal.com
Thermal behavior of the materials was determined using Differential Scanning Calorimetry(DSC 60
Shimadzu Japan). Approximately 5 mg drug and Physical polymer mixture of Sulphacetamide,
Resomer RG 503, gellan gum, Poloxamer 188 and their mixtures were accurately weighed into
aluminum pans and crimped by aluminum caps with a pinhole. Indium standard was used to calibrate
the DSC temperature and enthalpy scale. Nitrogen was used as the purge gas through DSC cell at flow
rate of 50 ml per min and 100 ml per min through the cooling unit. The sample (5-10mg) was heated
in a hermetically sealed aluminum pans.
Fourier Transform Infrared Spectrum Analysis[8]
Infrared spectrophotometry is a useful analytical technique utilized to check the chemical interaction
between the drug and other excipients used in the formulation. Fourier–transform infrared (FT–IR)
spectra of moisture free powdered samples of SS take 1-2 mg of solid fine powder of drug and 200-300
mg of dry fine powder of Potassium bromide(KBr) (IR grade) in a mortar and mix well with the help
of a spatula. Spectrum measurements were carried out using Potassium bromide(KBr)disk method in
the wavelength region of 2000-4000cm-1
by IR Affinity (Shimadzu Japan).
pH measurement
The pH of solution is measure by the digital pH meter. Electrode was immersed in solution and each
experiment performed in triplicate.
Rheological measurement[9]
Viscosity of in situ gelling solution and in situ gel was performed by Brookfield DV-E
VISCOMETER. Viscosity of in situ gelling solution was measured at 20 rpm using 61 spindle
numberfor and in situ gel is measuredat 64 spindle numbers at 20 rpm. Each experiment performed in
triplicate.
Drug entrapment efficiency[10]
A 20 ml portion of freshly prepared nanosuspension was centrifuged at 10000 rpm for 2 h. The amount
of unincorporated drug was measured by taking the absorbance of appropriately diluted supernant
solution at 258 nm using double beam UV spectrophotometer against blank/control nanosuspension.
By subtraction from the initial amount of drug taken, entrapment efficiency was calculated. Each
experiment performed in triplicate
Drug content
Drug content was determined by dissolving 10ml in situ gels in water. After suitabledilution
absorbance was recorded by using UV/Vis double beam Spectrophotometer at 258 nm. Each
experiment performed in triplicate.

GSJ: Volume 6, Issue 4, APRIL 2018 124
GSJ© 2018
www.globalscientificjournal.com
In vitro drug release study[10]
In vitro release of the drug from the different in situ gel was studied using Franz diffusion cell. The in
situ gel put on the prehydrated cellophane membrane between donor and compartments. The
prehydrated cellophane membrane act as corneal epithelium.The entire surface was in contact with
receptor compartment comprised of 10 ml of stimulated tear fluid pH 7.4. The content of the receptor
compartment was stirred continuously using magnetic stirrer and temperature was maintained at
37±0.50C, 1 ml sample was withdrawn from receptor compartment and replaced with fresh stimulated
tear artificial fluid pH 7.4. The sample was analyses for drug content using double beam
spectrophotometer against stimulated tear fluid pH 7.4.Each experiment performed in triplicate.
Statistical analysis of responses by design expert software
Design Expert 10 software (stat-Ease,USA) was used for the analysis of effect of each variable on the
designated response. Qualitative and quantitative contribution of each variable on each of the response
was analyzed.The significant response polynomial equation generated by design expert
used11
.Response surface plots were generated to visualize the simultaneous effect of each variable on
each response parameters[12]
.
Sterility testing[13]
The sterilized solution was removed from the pack and transfer to fluid thioglycolate medium and
soyabean-casein digestive medium separately at 30 to 350C and 20 to25
0 C respectively for 7 days. A
control evaluation was carried out.
Microbiological studies[14]
Microbiological studies were carried out to determine microbiological activity of drug against
microorganism. Staphylococcu saureus has been used as a test organism. The optimized formulation
was evaluated for microbiological study by Standard pour plate method. During the study strict aseptic
condition was maintained. Melted nutrient agar taken in test tube and inoculated with 4-5 loop full of
test organism from the provided culture. The inoculated medium was then poured in sterile petridish
and allows solidifying. Cups were made on the solidified agar layer with the help of sterile borer at 4
mm diameter. Then volume of the formulations (optimized formulation, control and conventional
suspension) containing equivalent amount of drug poured into the cups. The petridish was incubated at
37±0.50C for 24 h. After incubation the petridish was observed for the zone of inhibition around the
ophthalmic solution. The zone of inhibition was observed and recorded
Stability testing

GSJ: Volume 6, Issue 4, APRIL 2018 125
GSJ© 2018
www.globalscientificjournal.com
For any rational design and evaluation of dosage forms, the stability of the active component must be
major criterion in determining the acceptance or rejection. For stability studies, the formulations were
stored in hermetically closed glass vials and kept at 40 ± 20 0C/ 75 ± 5% RH for 1 month. The
samples were evaluated for particle size, zeta potential, and PDI and in-vitro drug release study after
1 month.
RESULT AND DISCUSSION
Drug excipient compatibility study
The DSC of Sulphacetamide peak was observed at 189.350 C where in DSC spectra of Sulphacetamide
and excipient mixture drug peak was observed at 170.450C, hence there is negligible change in drug
peak.It was found that all the excipient used in the formulation does not affect the melting point of
drug.This was conformed that there was no incompatibility between drug and excipient.
Infrared spectroscopy
The IR analysis of pure drug, excipient and physical mixture of all were done on FT-IR 8400 S
Shimadzu. It was found that all the prominent functional group picks of NH stretching (3469cm-1
),
NH2 stretching (3383cm-1
), Aromatic CH stretching(3000cm-1
), Aliphatic CH stretching (2910cm-1
)
O=C=O stretching (1325cm-1
), C=O stretching (1645cm-1
) and CH3 out of plane stretching (995cm-1
)
were observed in physical mixture. This was conformed that there was no interaction between drug -
excipient or incompatibility between drug and excipient.
%Entrapment efficiency
Eight different batches were prepared by various polymers and organic to aqueous ratio and drug keep
constant for all batches from the preliminary trials Drug entrapment efficacy of Sulphacetamide
nanosuspension for various batches were shown in table No.3.Drug entrapment efficacy of all batches
range from 39.01% to 65.18%, thereason for poor entrapment efficacy is may be water soluble drug.
High entrapment efficiency is may be due to higher solubility of Resomer RG 503 in organic phase.As
per graph Drug entrapment efficacy of Sulphacetamide nanosuspension for F6 having higher
entrapment efficiency 65.18%, it also higher organic to aqueous ratio.In F1, F3, F5, F7 batches organic
to aqueous ratio in this drug entrapment efficacy lower than other batches drug entrapment efficiency is
affected by organic to aqueous ratio.

GSJ: Volume 6, Issue 4, APRIL 2018 126
GSJ© 2018
www.globalscientificjournal.com
Particle size
Different polymer concentrations and organic to aqueous phase ratio have shown very major effect on
particle sizeof Sulphacetamide nanosuspension particle size is affected by different variables of
polymer and organic to aqueous phase(O/A) ratio, in which polymer ratio is keep constant for all
batches but poloxamer 188 and organic to aqueous phase ratio is differ. F2, F4, F6, F8 batches having
higher O/A ratio but F4 has good particle size but poor PDI because it have higher amount of stabilizer.
Were F2 and F6 having higher organic to aqueous phase ratio with good PDI. In reaming batches were
high particle sizes due to lower O/A ratio, so high concentration of O/A ratio decrease the particle size.
Were F6 batch having 115.6 nm particle size at higher O/A ratio with lower stabilizer ratio.
Viscosity of in situ gel
Table No.3 shows that different batches having different viscosity because the poloxamer 188 and
gellan gum concentration combination is different batches. As shown in table that the F1, F2, batches
having lower poloxamer 188 concentration and gellan gum (1.5%) having low viscosity in F3, F4
having higher concentration of poloxamer 188 and lower the concentration of gellan gum, its having
higher viscosity in other batches F5, F6, have lower concentration poloxamer 188 and higher
concentration of gellan gum decrease in viscosity, F7, F8 batches having higher the poloxamer 188 and
gellan gum increase viscosity.
DSC of sulphacetamide
Fig.1: DSC of Sulphacetamide

GSJ: Volume 6, Issue 4, APRIL 2018 127
GSJ© 2018
www.globalscientificjournal.com
DSC OF Mixture (Sulphacetamide +Resomer RG 503+Pluronic F 68+Gellan gum)
Fig.2: DSC of Mixture (Sulphacetamide+Resomer RG 503+Pluronic F 68+Gellan gum)
FTIR of Sulphacetamide

GSJ: Volume 6, Issue 4, APRIL 2018 128
GSJ© 2018
www.globalscientificjournal.com
Fig.3: FTIR of Sulphacetamide
FTIR of Mixture (Sulphacetamide +Resomer RG 503+Pluronic F 68+Gellan gum)
Fig.4: FTIR of Mixture (Sulphacetamide +Resomer RG 503+Pluronic F 68+Gellan gum)

GSJ: Volume 6, Issue 4, APRIL 2018 129
GSJ© 2018
www.globalscientificjournal.com
Evaluation parameters
Table 3:Evaluation parameters
Batch
code
Particle
size
(nm)
%Entrap
ment
efficiency
Gelling
time
(S)
pH of in
situ
gelling
solution
Viscosity
of in situ
gelling
solution
(Cps)
Viscosity of
in situ
gel(Cps)
Drug
content
(%)
F1 529.6 45.28±0.64 52 7.20± 0.10 81± 10.02 2128± 11.35 91.52±0.31
F2 185.5 55.55±0.71 45 7.04± 0.05 86± 5.51 1255± 10.0 94.55±0.32
F3 710.4 39.01±0.78 60 7.41± 0.03 102±.86 3550± 4.0 90.58±0.14
F4 197.6 61.17±0.87 55 6.99± 0.10 115± 7.00 2533± 12.4 95.64±0.11
F5 410.5 53.08±0.97 41 7.29± 0.04 85± 5.57 3646± 10.54 93.45±0.29
F6 115.6 65.18±0.64 26 7.25± 0.05 81± 7.09 3256± 10.15 97.70± 0.15
F7 312.4 56.74±0.45 30 7.45± 0.05 135± 5.57 4224± 10.50 95.73±0.23
F8 149.4 60.68±0.62 38 7.45± 0.05 143± 7.94 5055± 14.47 98.59±0.15
*(mean±SD,n=3)
Particle size of optimized batch of Resomer RG 503 based nanosuspension of sulphacetamide
Fig.5: Particle size of Resomer RG 503 based nanosuspension of sulphacetamide

GSJ: Volume 6, Issue 4, APRIL 2018 130
GSJ© 2018
www.globalscientificjournal.com
In vitro drug release study
Fig.6: In vitro drug release of 23 design batches F1 to F8
From the results figure No.2 shows% cumulative drug release of F1 to F8 Batches. In vitro drug release
study was performed onFranz diffusion cell using Stimulated tear fluid pH 7.4. Drug entrapment
efficiency and Particle size have a direct effect on the drug release profile from the eight formulations.
It shows increase in drug release with increase in Organic to aqueous phase ratio, so decrease in
particle size and increase entrapment efficiency result shows increase in drug release. But in F1,F3 and
F5 having higher particle size(529.7nm,710.4nm and 410.5nm) and low drug entrapment efficiency
(49.28%, 39.01% and 53.08%) it having lower drug release. Other batches having increasing drug
release with increasing entrapment efficiency and decreasing particle size. In which out of all batches
F6 was found smallest particle size that is 115.6 nm and higher entrapment efficiency 65.18%with
highest drug release 96.54% after 8 h.
Statistical design of response by design expert software
Based on results obtained for particle size, gelling time and % Drug release, the response polynomial
coefficient were determine in order to evaluate each response.
Correlating Y1 (Particle size), the result of multiple linear regression analysis showed that the
coefficients b1 and b3 stand negative effect sign and b2 stand positive sign. The fitted equation relating
the Y1 to the transferred factor are shown in following equation
Y1=326.36-164.34X1+16.09X2-79.39X3-4.16X1X2+49.86X2X3-32.16X1X3……eq. (1)
0
20
40
60
80
100
0 2 4 6 8 10
%
Cu
mu
lati
ve
dru
g re
lease
Time (h)
F1
F2
F3
F4
F5
F6
F7
F8
F9
GSJ: Volume 6, Issue 4, APRIL 2018 131
GSJ© 2018
www.globalscientificjournal.com
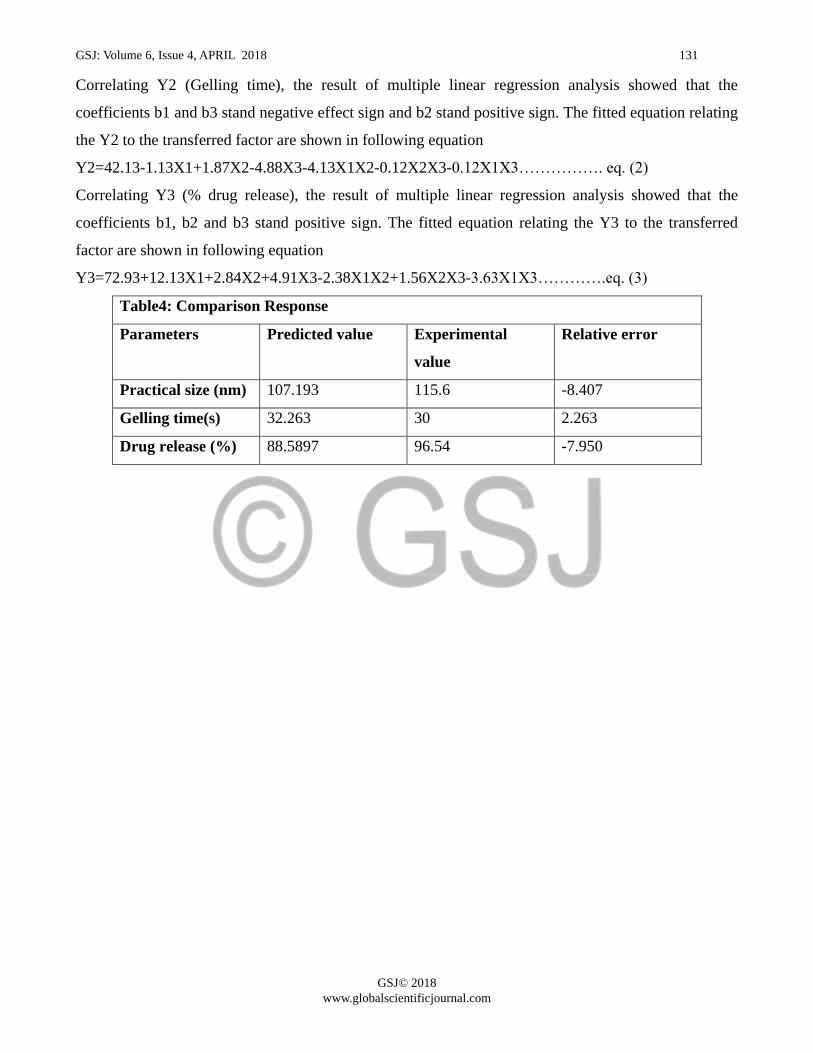
Correlating Y2 (Gelling time), the result of multiple linear regression analysis showed that the
coefficients b1 and b3 stand negative effect sign and b2 stand positive sign. The fitted equation relating
the Y2 to the transferred factor are shown in following equation
Y2=42.13-1.13X1+1.87X2-4.88X3-4.13X1X2-0.12X2X3-0.12X1X3……………. eq. (2)
Correlating Y3 (% drug release), the result of multiple linear regression analysis showed that the
coefficients b1, b2 and b3 stand positive sign. The fitted equation relating the Y3 to the transferred
factor are shown in following equation
Y3=72.93+12.13X1+2.84X2+4.91X3-2.38X1X2+1.56X2X3-3.63X1X3………….eq. (3)
Table4: Comparison Response
Parameters Predicted value Experimental
value
Relative error
Practical size (nm) 107.193 115.6 -8.407
Gelling time(s) 32.263 30 2.263
Drug release (%) 88.5897 96.54 -7.950

GSJ: Volume 6, Issue 4, APRIL 2018 132
GSJ© 2018
www.globalscientificjournal.com
RESPONSE SURFACE PLOTS
The response surface plots generated using polynomial equations represent quantitative simultaneous
effect of any two variables on response parameters taking one as cossnstant, using design expert
software.
Fig.7: Response surface plot for particle size
Design-Expert® SoftwareFactor Coding: Actualpartical size (nm)
710.4
115.6
X1 = A: Organic to aqueous ratioX2 = B: conc. Of Poloxomer188
Actual FactorC: conc of Gellan gum = 0
-1
-0.5
0
0.5
1
-1
-0.5
0
0.5
1-200
0
200
400
600
800
part
ical
siz
e (n
m)
A: Organic to aqueous ratio
B: conc. Of Poloxomer188 (mg)

GSJ: Volume 6, Issue 4, APRIL 2018 133
GSJ© 2018
www.globalscientificjournal.com
Fig.8: Response surface plot for gelling time
Fig.9: Response surface plot for % drug release
Design-Expert® SoftwareFactor Coding: Actualgelling time (sec)
52
30
X1 = A: Organic to aqueous ratioX2 = C: conc of Gellan gum
Actual FactorB: conc. Of Poloxomer188 = 0
-1
-0.5
0
0.5
1-1
-0.5
0
0.5
1
10
20
30
40
50
60
70
gelli
ng ti
me
(sec
)
A: Organic to aqueous ratio
C: conc of Gellan gum (%)
Design-Expert® SoftwareFactor Coding: Actualdrug release (%)
96.54
50.45
X1 = A: Organic to aqueous ratioX2 = C: conc of Gellan gum
Actual FactorB: conc. Of Poloxomer188 = 0
-1
-0.5
0
0.5
1
-1
-0.5
0
0.5
1
40
50
60
70
80
90
100
110
drug
rel
ease
(%
)
A: Organic to aqueous ratioC: conc of Gellan gum (%)

GSJ: Volume 6, Issue 4, APRIL 2018 134
GSJ© 2018
www.globalscientificjournal.com

GSJ: Volume 6, Issue 4, APRIL 2018 135
GSJ© 2018
www.globalscientificjournal.com
Scanning Electron Microscopy (SEM)
Fig.10: Scanning Electron Microscopy (SEM) of nanosuspension for ophthalmic in situ gel of
Sulphacetamide
The figure 5.31 showed that SEM image of nanosuspension for ophthalmic in situ gelling solution of
optimized batch.The figure shows the spherical shape of particle and crystals of drug and excipients.
Sterility testing
From the sterility testing it was found visually that the soyabean casein digest medium and fluid
thioglycolate medium containing sterilized ophthalmic in situ gel was free from turbidity. This conform
that absence of microbial growth. From this result conformed the sterility of ophthalmic in situ gel.

GSJ: Volume 6, Issue 4, APRIL 2018 136
GSJ© 2018
www.globalscientificjournal.com

GSJ: Volume 6, Issue 4, APRIL 2018 137
GSJ© 2018
www.globalscientificjournal.com
In vitro Microbial study
From results it was observed that optimized batch of nanosuspension for ophthalmic in situ gelling
solution showed that higher anti-microbial activity as compare to conventional suspension and control.
Increase an In vitro microbial study of nanosuspension based ophthalmic in situ gelling solution with
increasing microbial activity at site of action.
Fig.11: In vitro microbial study of ophthalmic in situ gel
Stability study of optimized formulation
Stability study was performed on only optimized batch The table 5.21 shows the stability study data
of optimized batch at 40 ± 20 0C/ 75 ± 5% RH for one month. Results of stability studies indicate that
there is no significant difference in mean particle size, zeta potential, pH, Viscosity and in- vitro drug
release study of optimized batch after a period of 1month.
0
5
10
15
20
25
30
Control Simple solution nanosuspension
Zon
e of
inh
ibit
ion
(mm
)
Formulations

GSJ: Volume 6, Issue 4, APRIL 2018 138
GSJ© 2018
www.globalscientificjournal.com
CONCLUSION:
From the present study nanosuspension of sulphacetamide was prepared by nanoprecipitation
method. Optimized formulation having lower particle size with higher entrapment efficiency and
higher drug release for eight hour, when solution is covert in to gel, rate of elimination is decrease
and contact time is increase and microbial activity was increase at site of action. so it conclude
Resomer RG 503 based nanosuspension for ophthalmic in situ gel of Sulphacetamide is more
effective dosage form as compare to conventional eye drops its provided better absorption and longer
retention time. Optimized formulation is effective in treatment of conjunctivitis.

GSJ: Volume 6, Issue 4, APRIL 2018 139
GSJ© 2018
www.globalscientificjournal.com
REFERENCE
1. Laurence L B, John S L and Parker L K. In Goodman and Gilman’s The pharmacological Basis
of therapeutics. 5th
ed.New York: McGRAW HILL; 2006.
2. Ding S. Recent developments in ophthalmic drug delivery. Pharmaceutical Science and
Technology Today.1998; 1: 328-335.
3. Roth H W, Leimbeck R, Sonnenschein B., Anger CB, Weber S. The effective Antibacterial
spectrum of sulfacetamide. KlinMonblAugenheilkd. 1992;200: 182-186.
4. Brown GM.Inhibition by sulfonamides of the biosynthesis of folic acid. International Journal of
Leprosy and Other Mycobacterial Diseases.1967;35(4):580-589.
5. Lacy CF, Armstrong LL, Goldman MP, Lance LL. In Drug information handbook;12th ed.
Ohio: Laxi-Comp inc, Hudson; 2005.
6.Kara A, OzturkN,Sarisozen C and ImranV. Investigation of Formulation Parameters of PLGA
Nanoparticles Prepared By Nanoprecipitation Technique. Proceedings of the 5th International
Conference on Nanotechnology: Fundamentals and Applications.2014: 94-1-3.
7.Gupta S, Samanta k. M and Raichur M. A. Dual Drug Delivery System Based on In Situ
gelforming Nanosuspension of Forskolin to Enhance Antiglaucoma Efficacy. AAPS
PharmSciTech. 2010;11(1):322–335.
8. Pandya M V, Patel K J. and Patel J. D. Formulation, Optimization and characterization of
Simvastatin Nanosuspension prepared by nanoprecipitation technique. Scholars Research
Library Der Pharmacia Letter. 2011; 3(2):129-140.
9. Lahori RS, Taur GN,Khan RA and Puranik KP. Enhancement iontophoretic permeation of
rizatriptanbenzoare from thermo-reversible gel based system:effect of penetration enhancer and
pulsed current.ind J PharmaEdu Res. 2012;46(2):105-111.
10. Mandal B. Preparation and Physicochemical Characterization of EudragitRL100
Nanosuspension with potential for Ocular Delivery of Sulfacetamide. The University of Toledo.
2010:1-180.
11. Bolton S, Bon C. Pharmaceutical statistical: practical and clinical applications.4th
ed. New York:
Marcel Dekkar; 2004.

GSJ: Volume 6, Issue 4, APRIL 2018 140
GSJ© 2018
www.globalscientificjournal.com
12. KumarP,chhabra C and pathakkamla. Development and stastical optimization of buccoadhesive
films of amiloridehydrochloride:in vitro and ex vivo evaluation.ind j pharma
res.2012;46(2):145-154.
13. Indian Pharmacopeia.Ministry of health and family welfare, Govt. of India. 3rd
ed. New delhi:
1996.
14. Gupta H, Aqil M, Khark. R, Ali A, Bhatnagar A, and Mittal G. Biodegradable levofloxacin
nanoparticles for sustained ocular drug delivery. Journal of Drug Targeting.2011; 19(6):409–
417.