Embed Size (px)
Citation preview
PREPARATION AND CHRACTERIZATION OF CELLULOSE NANOFIBRILS USING
VARIOUS PRETREAMENT TECHNIQUES
by
HANSOL LEE
(Under the Direction of Sudhagar Mani)
ABSTRACT
Cellulose nanofibrils (CNF) has received a great attention due to its renewability,
biodegradability and remarkable mechanical properties. This study investigated the effects of
mechanical pretreatment using a shear cutting mill and low-concentration NaOH pretreatment on
the production and properties of CNF. Three-cycle shear cutting of fluff pulp was suitable for
producing CNF precursors, while consuming lower energy compared with other mechanical
pretreatments by wet milling methods. Low-concentration NaOH (2wt.%) at low temperature
(below 0 ℃) was a promising alternative condition to prepare CNF with improved thermal
stability. CNF produced with 2wt% NaOH had comparable properties with the standard CNF
produced at pilot scale. A life cycle assessment study on the CNF production concluded that the
integration of mechanical and alkaline pretreatments potentially reduced the overall energy
consumption and the global warming potentials. Further research is required to validate the
proposed pretreatment techniques prior to commercialization.
INDEX WORDS: Cellulose nanofibrils, Shear cutting mill, Specific grinding energy, NaOH
treatment, Life cycle assessment
PREPARATION AND CHRACTERIZATION OF CELLULOSE NANOFIBRILS USING
VARIOUS PRETREAMENT TECHNIQUES
by
HANSOL LEE
B.S., Seoul National University, Republic of Korea, 2014.
A Thesis Submitted to the Graduate Faculty of The University of Georgia in Partial Fulfillment
of the Requirements for the Degree
MASTER OF SCIENCE
ATHENS, GEORGIA
2016

© 2016
Hansol Lee
All Rights Reserved
PREPARATION AND CHRACTERIZATION OF CELLULOSE NANOFIBRILS USING
VARIOUS PRETREAMENT TECHNIQUES
by
HANSOL LEE
Major Professor: Sudhagar Mani Committee: Hitesh Handa Peter Kner Electronic Version Approved: Suzanne Barbour Dean of the Graduate School The University of Georgia August 2016

iv
ACKNOWLEDGEMENTS
I would like to thank my advisor, Dr. Sudhagar Mani, who has guided me with patience
and support throughout my graduate studies. The completion of this work would not be possible
without his scientific insight and constant encouragement. I also would like to thank Dr. Hitesh
Handa and Dr. Peter Kner for serving on my graduate advisory committee and offering helpful
comments and suggestions. Thank to Dr. Eric Freeman for his generosity to allow me to work in
his lab. Thank also to Dr. Jaya Sundaram for providing technical assistance at various stages of
my research work. I am grateful to Dr. Hari P. Singh at Fort Valley State University for his
financial support on electron microscopic studies, which made this work much more fruitful.
I would like to acknowledge my fellow lab members: Kamalakanta Sahoo, Yue Yang,
Maryam Manouchehrinejad, Ikenna Joseph Okeke, and Thomas Brett Beery for their help over
years. I will always cherish the memories we have mad together, and I hope there will be many
more. I also appreciate the dedicated assistance of Lu Zhu, who provides a great deal of XRD
data for this work. I would like to offer a special thanks to Natalia Bhattacharjee (née Shim), as
she became one of my best friends. We shared every moment of happiness and sorrow with each
other, and her friendship has been incredibly importance to me.
I would like to thank my parents, who have been my biggest supporters, encouraging me
in every aspect of my life. I am thankful for everything that they have given me. Without their
unconditional love and support, I could not finish this hard work.

v
Last but not least, thank you to Seungwon Ryu. As my fiancé, he has encouraged me not
to give up on my goal. He has stayed by my side throughout everything, and I truly cannot
imagine going through these last several years without him.

vi
TABLE OF CONTENTS
Page
ACKNOWLEDGEMENTS ........................................................................................................... iv
LIST OF TABLES ......................................................................................................................... ix
LIST OF FIGURES ........................................................................................................................ x
CHAPTER 1 INTRODUCTION .................................................................................................... 1
CHAPTER 2 REVIEW OF LITERATURE ................................................................................. 11
Cellulose ......................................................................................................................... 11 1.
Nanocellulose ................................................................................................................. 12 2.
Production of cellulose nanofibrils ................................................................................ 15 3.
Pretreatment methods ..................................................................................................... 17 4.
4.1. Mechanical pretreatments for CNF production ................................................................... 17
4.2. Chemical pretreatments for CNF production ...................................................................... 20
Life cycle assessment (LCA) ......................................................................................... 26 5.
5.1. LCA of CNF production ..................................................................................................... 27
Summary ........................................................................................................................ 28 6.
CHAPTER 3 SHEAR CUTTING OF FLUFF PULP TO PRODUCE CELLULOSE
PRECURSORS FOR CELLULOSE NANOFIBRILS ................................................................. 54
Introduction .................................................................................................................... 56 1.
Materials and Method ..................................................................................................... 58 2.
2.1. Material and shear cutting process ...................................................................................... 58
2.2. Shear cutting energy consumption study ............................................................................ 58
2.3. Characterization of knife-milled powders ........................................................................... 59

vii
2.4. Cellulose nanofibrils preparation ........................................................................................ 62
2.5. Characterization of cellulose nanofibrils ............................................................................ 62
2.6. Statistical analysis ............................................................................................................... 64
Results and discussion .................................................................................................... 64 3.
3.1. Energy consumption for shear cutting process ................................................................... 64
3.2. Morphology of cellulose precursor/powder ........................................................................ 66
3.3. Physical properties of cellulose precursors/powder ............................................................ 67
3.4. Effect of shear cutting on CNF production ......................................................................... 69
Conclusions .................................................................................................................... 71 4.
CHAPTER 4 DEVELOPMENT OF THERMALLY STABLE CELLULOSE NANOFIBRILS
USING LOW-CONCENTRATION ALKALINE TREATMENT .............................................. 92
Introduction .................................................................................................................... 94 1.
Materials and Method ..................................................................................................... 97 2.
2.1. Materials and Chemicals ..................................................................................................... 97
2.2. Alkaline treatment ............................................................................................................... 98
2.3. Cellulose nanofibrils preparation ........................................................................................ 98
2.4. Characterization of alkali-treated cellulose ......................................................................... 99
2.5. Characterization of fibrillated cellulose ............................................................................ 100
2.6. Statistical analysis ............................................................................................................. 103
Results and Discussion ................................................................................................. 103 3.
3.1. Alkaline treatment ............................................................................................................. 103
3.2. Characterization of fibrillated cellulose ............................................................................ 105
Conclusions .................................................................................................................. 112 4.
CHAPTER 5 LIFE CYCLE ASSESSMENT OF PRODUCING CELLULOSE NANOFIBRILS
WITH MECHANICAL AND ALKALINE PRETREATMENT ............................................... 132
Introduction .................................................................................................................. 134 1.
LCA Scope and Functional unit definition .................................................................. 136 2.
Process description ....................................................................................................... 137 3.

viii
3.1. Pulp production ................................................................................................................. 137
3.2. Valley beating route .......................................................................................................... 137
3.3. Shear cutting route ............................................................................................................ 138
3.4. Alkaline pretreatment route .............................................................................................. 138
3.5. Key assumptions ............................................................................................................... 139
Life cycle inventory analysis (LCI) ............................................................................. 140 4.
Life cycle impact assessment (LCIA) .......................................................................... 141 5.
5.1. Fossil energy consumption ................................................................................................ 142
5.2. Global warming potential (GWP) ..................................................................................... 143
5.3. Water intake ...................................................................................................................... 144
5.4. Eutrophication potential .................................................................................................... 144
Sensitive analysis ......................................................................................................... 145 6.
6.1. Fossil energy consumption ................................................................................................ 146
6.2. Global warming potential (GWP) ..................................................................................... 147
6.3. Water intake ...................................................................................................................... 147
6.4. Eutrophication potential .................................................................................................... 148
7. Comparison to other carbon nanomaterials .................................................................. 148
8. Conclusions .................................................................................................................. 150
CHAPTER 6 CONCLUSIONS AND RECOMMENDATIONS ............................................... 161
APPENDIX A ............................................................................................................................. 164
APPENDIX B ............................................................................................................................. 171
APPENDIX C ............................................................................................................................. 177

ix
LIST OF TABLES
Page
Table 3.1: Grinding rate and effective specific energy of shear cutting process with the different
number of cycles ................................................................................................................77
Table 3.2: Average width, length and aspect ratio of fluff pulp and one to three-cycle knife-
milled powders ...................................................................................................................78
Table 3.3: Physical properties of one to three-cycle knife-milled powders ..................................79
Table 3.4: Average fiber width and specific surface area (SSA) for samples ...............................80
Table 4.1: Onset and DTG peak thermal degradation temperature of fibrillated cellulose fibers
prepared with various NaOH solutions with or without CMC ........................................118
Table 5.1: Input inventory for producing one kg of cellulose nanofibrils with three different
processing routes ..............................................................................................................155
Table 5.2: Emissions to air per kg cellulose nanofibrils from three production routes ...............156
Table 5.3: Life cycle impact assessment of producing one kg of cellulose nanofibrils with three
different processing routes ...............................................................................................157

x
LIST OF FIGURES
Page
Figure 2.1: Chemical strucutre of cellulose ...................................................................................41
Figure 2.2: Schematic structure of (a) cotton fiber and (b) wood fiber .........................................42
Figure 2.3: Cellulose fibrils surrounded by hemicellulose and lignin ...........................................43
Figure 2.4: Crystal structure of cellulose Iβ and cellulose II .........................................................44
Figure 2.5: A brief production process of cellulose nanofibrils (CNF) and cellulose nanocrystals
(CNC) from lignocellulosic materials ................................................................................45
Figure 2.6: Description of homogenizer systems ..........................................................................46
Figure 2.7: Description of microfluidizer systems ........................................................................47
Figure 2.8: French pressure cell press ............................................................................................48
Figure 2.9: PFI Mill and Valley beater ..........................................................................................49
Figure 2.10: TEMPO-mediated oxidation of cellulose at pH 10-11 ..............................................50
Figure 2.11: Carboxymethylation of cellulose...............................................................................51
Figure 2.12: Molecular rearrangement of cellulose chains in mercerization .................................52
Figure 2.13: Schematic conversion of cellulose I (a) into cellulose II (b) in a ramie fiber ...........53
Figure 3.1: A laboratory heavy-duty shear cutting mill .................................................................81
Figure 3.2: Complete flow diagram for shear cutting process .......................................................82
Figure 3.3: Fluff pulp (left) and three-cycle knife-milled powder (right) .....................................83
Figure 3.4: Optical microscopic images of (a) raw fluff pulp at 5 times magnification and (b)
one-, (c) two-, and (d) three-cycle knife-milled powders at 20 times magnification ........84
xi
Figure 3.5: Particle size distributions of one- to three-cycle knife-milled powders ......................85
Figure 3.6: X-ray diffraction patterns of fluff pulp and knife-milled powders with one to three
grinding cycles ...................................................................................................................86
Figure 3.7: A photo of fibrillated cellulose gel after 15 passes through a French press (left) and
standard CNF from University of Maine (right) ................................................................87
Figure 3.8: Optical microscopic images of the three-cycle knife-milled cellulose after passing
through a French press with (a) 10 passes and (b) 15 passes.............................................88
Figure 3.9: Scanning microscopic images of (a) the fibrillated cellulose with 15 passes through a
French press and (b) standard cellulose nanofibrils from University of Maine ................89
Figure 3.10: The distribution of fiber width for the fibrillated cellulose passed through a French
press with 15 passes (top) and standard cellulose nanofibrils from University of Maine
(bottom)..............................................................................................................................90
Figure 3.11: Dispersion states of the 0.1wt% suspensions of (a) the fibrillated cellulose passed
through a French press with 15 passes, and (b) standard cellulose nanofibrils from
University of Maine at 0, 10 and 90 minutes (from left to right) ......................................91
Figure 4.1: Summary of cellulose nanofibrils production procedure in this study ......................119
Figure 4.2: Cellulose Solubility in various concentrations of NaOH solutions with or without
CMC .............................................................................................................................120
Figure 4.3: Optical microscopic images of cellulose fibers treated with 2-6wt% NaOH solutions
without (left) or with CMC (right) (a,b : 0wt%, c,d : 2wt%, e,f : 4wt%, g,h : 6wt% NaOH
solutions) ..........................................................................................................................121
Figure 4.4: Fibrillated cellulose samples treated with 2-6wt% NaOH solutions without (left) or
with CMC (right) (a,b : 2wt%, c,d : 4wt%, e,f : 6wt% NaOH solutions) ........................122

xii
Figure 4.5 Dispersion states of the 0.1wt% fibrillated cellulose suspensions at 0, 10, 60 minutes
and 24 hours (a: standard CNF, b: H-CMC-CNF, c: 2NaOH, d: CMC-2NaOH, e: 4NaOH,
f: CMC-4NaOH, g: 6NaOH, and h: CMC-6NaOH) ........................................................123
Figure 4.6: Optical microscopic images of alkali-treated cellulose without (left) or with CMC
(right) after the fibrillation process through a French cell press 10 times (a,b : 2wt%, c,d :
4wt%, e,f : 6wt% NaOH solutions) .................................................................................124
Figure 4.7: Optical microscopic images of fibrillated cellulose samples treated with 2-6wt%
NaOH solutions without (left) or with CMC (right) (a,b : 2wt%, c,d : 4wt%, e,f : 6wt%
NaOH solutions) ..............................................................................................................125
Figure 4.8: SEM images of fibrillated cellulose samples treated with 2-6wt% NaOH solutions
without (left) or with CMC (right) (a,b: 2wt%, c,d : 4wt%, e,f : 6wt% NaOH solutions),
(g) standard CNF and (h) H-CMC-CNF ..........................................................................126
Figure 4.9: Diameter distribution of (a) the fibrillated cellulose treated with 2wt% NaOH
solution containing CMC, (b) standard CNF and (c) H-CMC-CNF ...............................127
Figure 4.10: STEM images of (a) the fibrillated cellulose treated with 2wt% NaOH solution
containing CMC, (b) standard CNF and (c) H-CMC-CNF .............................................128
Figure 4.11: Specific surface area of cellulose powder, the fibrillated cellulose treated with 2wt%
NaOH solution containing CMC, standard CNF and H-CMC-CNF ...............................129
Figure 4.12: XRD patterns of fibrillated cellulose treated with 2-6wt% NaOH solution (1)
without or (2) with CMC (a,d :2wt%, b,e : 4wt%, c,f : 6wt% NaOH solution), (g)
cellulose powder, (h) standard CNF, (i) H-CMC-CNF ...................................................130
Figure 4.13: TG (top) and DTG (bottom) curves of fibrillated cellulose treated with 2-6wt%
NaOH solution with or without CMC, standard CNF and H-CMC-CNF .......................131

xiii
Figure 5.1: A flowchart of CNF production with three different production routes: (1) the Valley
beating route (to the left), (2) the shear cutting route (in the middle), and (3) the alkaline
pretreatment route (to the right) .......................................................................................158
Figure 5.2: Comparative life cycle impact assessments of three different routes; Valley beating
route, shear cutting route and alkaline pretreatment route (left to right) .........................159
Figure 5.3: Sensitive analysis of four different factors on global warming potential (top), water
intake (middle) and cumulative energy demand, total (bottom) ......................................160

1
CHAPTER 1
INTRODUCTION
Cellulose is the most abundant natural biopolymer derived from wood, cotton and other
non-wood fiber sources (agricultural residues and grasses). Paper and pulp industries are
converting woody biomass into various formats of cellulose fibers for manufacturing papers,
tissues, moisture absorbents and several cellulose derivatives for chemical and pharmaceutical
applications. For example, ethylcellulose is commercially used in coating, binder, and
controlled-release drug systems, and other ether derivatives (carboxymethyl cellulose,
hydroxyethyl cellulose) are also used as a viscosity modifier, gelling agent, foaming agent, and
binding agent (Dufresne, 2013). Cellulose nanofibrils (CNF) is one type of nanocellulose, which
typically has a diameter in range of below 100 nm and a length of several micrometers. The
process of producing CNF was first developed by Turbak et al. (1983a) and Herrick et al. (1983).
CNF has many desirable characteristics that make it a promising material for a wide range of
applications, such as food, packaging, electronic, and biomedical applications. Firstly, CNF has
exceptional mechanical properties as it can form extensive network structures due to its nano-
scale dimensions. Yano and Nakahara (2004) reported that a pure CNF film had tensile strength
of 250 MPa, but the value varied widely (222-310 MPa) as reported in the literature (Abe and
Yano, 2009; Fukuzumi et al. 2009; Saito et al. 2009). The tensile strength of CNF is much higher
than that of commercial polymers, such as polyethylene, polystyrene, and polycarbonate (up to
70 MPa) and also higher than that of high performance polymers, such as polyimide and
polyetheretherketon (70-100 MPa) (Stevens, 1999). CNF is also lightweight (0.81-1.53 gcm-3)

2
and has a very good ability to form a transparent film (Yano and Nakahara, 2004; Abe and Yano,
2009; Syverud and Stenius, 2009). In addition, the cost of CNF could be reduced to relatively
low compared with that of petroleum-based polymers since forest biomass and energy grasses
are abundantly renewable feedstock and potential raw materials for manufacturing CNF.
Cellulose nanofibrils is manufactured from cellulose materials using a mechanical
disintegration process, such as high pressure homogenization, microfluidization, and micro-
grinding. In these approaches, cellulose fibers are delaminated by high shearing forces or/and
impact forces. However, the mechanical disintegration process requires a vast amount of energy
because the numerous processing cycles are necessary to obtain well-fibrillated cellulose
nanofibrils. More specifically, the energy needed for the high pressure homogenization reaches
as high as 70,000 kWh/ton (Eriksen et al. 2008).
To address this energy problem, various pretreatment processes have been developed
using mechanical, chemical or/and enzymatic methods. Mechanical pretreatment process reduces
cellulose fiber size and pre-fibrillates cellulose fibers. PFI mills and Valley beaters are
commonly used as mechanical pretreatment methods (Chakraborty et al. 2005; Zhang et al.
2012; Spence et al. 2011; Sharma et al. 2015). Chemical pretreatment process introduces
negatively charged functional groups on the cellulose surface, leading to repulsive forces
between cellulose fibers; thus facilitating the disintegration of cellulose fibers easily. TEMPO-
mediated oxidation and carboxymethylation are the common approaches for chemical
pretreatment (Saito et al. 2006; Wagberg et al. 2008; Eyholzer et al. 2010; Besbes et al. 2011a
and 2011b). However, each pretreatment technique achieved limited success because of its own
disadvantages.

3
Firstly, the mechanical pretreatment process needs a certain amount of energy, potentially
increasing the overall energy consumption for cellulose nanofibrils production. For instance,
refining wood pulps in a Valley beater required 2,000 kWh/ton for the total refining time of 3
hours (Atic et al. 2005; Spence et al. 2011). In addition, the mechanical pretreatments with a
Valley beater and a PFI mill (or wet milling) are performed in water at low pulp consistency of
approximately 2% and 10%, respectively. This indicates that these mechanical pretreatment
processes produce the cellulose precursors in wet form, which would make difficulties during
storage and handling. A shear cutting mill, known as a knife mill (or dry milling) has a potential
as a low-energy mechanical pretreatment method, producing the cellulose precursors in dry form,
which can be easily handled and stored. Shear cutting process has been used to grind food, feed
and biomass, and it was reported that the energy necessary for grinding grasses in a shear cutting
mill ranged in 150-200 kwh/ton with a screen size of one mm (Miao et al. 2011). Thus, it can be
expected that energy consumption for grinding wood pulps would be comparatively low. In
addition, the available screen size is as small as 0.25 mm, and the repeated shear cutting of
cellulose pulp with 0.25 mm screen could produce very fine cellulose powder, which can be used
as the cellulose precursors for CNF production.
Moreover, chemical pretreatment processes have some drawbacks. These processes
consume several organic solvents, leading to increased environmental impacts of cellulose
nanofibrils. Specifically, carboxymethylation requires 30 kg of organic solvents to produce one
kg of CNF (Arvidsson et al. 2015). It has been also reported that the introduction of functional
groups, such as carboxyl and carboxymethyl groups, causes the decrease in thermal stability of
cellulose nanofibrils. For example, the onset thermal decomposition of chemically-modified
CNF was up to 100 ℃ lower than that of untreated CNF (Fukuzumi et al. 2009; Eyholzer et al.
4
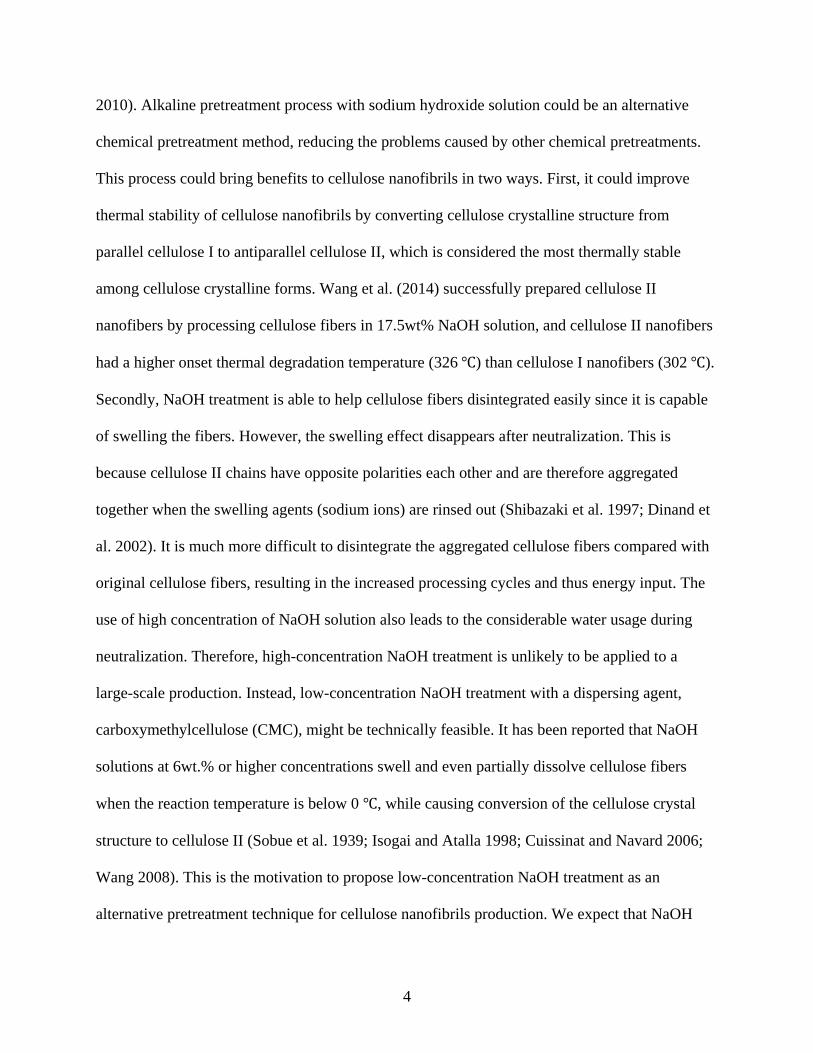
2010). Alkaline pretreatment process with sodium hydroxide solution could be an alternative
chemical pretreatment method, reducing the problems caused by other chemical pretreatments.
This process could bring benefits to cellulose nanofibrils in two ways. First, it could improve
thermal stability of cellulose nanofibrils by converting cellulose crystalline structure from
parallel cellulose I to antiparallel cellulose II, which is considered the most thermally stable
among cellulose crystalline forms. Wang et al. (2014) successfully prepared cellulose II
nanofibers by processing cellulose fibers in 17.5wt% NaOH solution, and cellulose II nanofibers
had a higher onset thermal degradation temperature (326 ℃) than cellulose I nanofibers (302 ℃).
Secondly, NaOH treatment is able to help cellulose fibers disintegrated easily since it is capable
of swelling the fibers. However, the swelling effect disappears after neutralization. This is
because cellulose II chains have opposite polarities each other and are therefore aggregated
together when the swelling agents (sodium ions) are rinsed out (Shibazaki et al. 1997; Dinand et
al. 2002). It is much more difficult to disintegrate the aggregated cellulose fibers compared with
original cellulose fibers, resulting in the increased processing cycles and thus energy input. The
use of high concentration of NaOH solution also leads to the considerable water usage during
neutralization. Therefore, high-concentration NaOH treatment is unlikely to be applied to a
large-scale production. Instead, low-concentration NaOH treatment with a dispersing agent,
carboxymethylcellulose (CMC), might be technically feasible. It has been reported that NaOH
solutions at 6wt.% or higher concentrations swell and even partially dissolve cellulose fibers
when the reaction temperature is below 0 ℃, while causing conversion of the cellulose crystal
structure to cellulose II (Sobue et al. 1939; Isogai and Atalla 1998; Cuissinat and Navard 2006;
Wang 2008). This is the motivation to propose low-concentration NaOH treatment as an
alternative pretreatment technique for cellulose nanofibrils production. We expect that NaOH

5
solutions at very low concentration (2-6wt.%) are also able to swell cellulose fibers, but without
significant dissolution of cellulose. This NaOH treatment also could help improve thermal
stability of the resultant cellulose nanofibrils by converting cellulose crystal structure. Wang et
al. (2008) demonstrated that cellulose crystal structure was transformed to cellulose II with only
4wt% NaOH. In addition, reduced NaOH concentration would decrease water usage for
neutralization.
Moreover, the addition of CMC would minimize the cellulose aggregation during
neutralization and facilitate fiber disintegration since it creates the repulsive forces and
lubricating effect between cellulose fibers (Yan et al. 2006; Ankerfors 2015). Therefore, the
pretreatment process with low-concentration NaOH solutions containing CMC could be a way to
make the CNF production easier as well as to improve CNF thermal stability, while causing low
environmental impacts compared with other chemical pretreatments.
Finally, a life cycle assessment (LCA) tool can be used to assess the environmental
impacts of producing CNF using mechanical and chemical pretreatments. LCA examines every
stage of the whole product life cycle from raw material production to final disposal of the
product. The impact categories typically include global warming, acidification, eutrophication,
ozone depletion, smog, ecotoxicity, and so on. It is very important to perform LCA of a new
product at the research and development stage in order to identify which step creates
environmental impacts the most and what improvement can be made against the benchmarking
product. Cellulose nanofibrils itself is considered sustainable and environmentally-friendly as it
can be prepared from forest biomass and energy grasses. However, the CNF production process
includes the use of energy and chemicals, which could negatively affect environment and human.
Three LCA studies of producing cellulose nanofibrils have been published in the literature

6
(Hohenthal et al. 2012, Li et al. 2013; Arvidsson et al. 2015). The LCA study by Arvidsson et al.
(2015) showed that using chemical pretreatments greatly increased the environmental impacts of
CNF production. For instance, CNF production with chemical pretreatments produced CO2 eq.
emission as high as 1,160 kg/kg CNF, which is much higher than from CNF production without
any pretreatment (1.2-23 kg/kg CNF). Although these three LCA studies assessed the
environmental impacts of producing cellulose nanofibrils with various pretreatment techniques,
the environmental impacts of CNF production with a mechanical or an alkaline pretreatment
process have been not studied.
Main objectives
The main objective of this study is to develop efficient and cost-effective pretreatment
technologies to manufacture cellulose nanofibrils (CNF) for food, biomedical and biomaterials
applications. The specific objectives are
• To determine the specific energy consumption and physical characterization of cellulose
precursors to produce CNF using a mechanical pretreatment technique (shear cutting
method)
• To experimentally investigate the effect of alkaline treatment (NaOH) on the production
and properties of CNF.
• To conduct a comparative life cycle assessment of manufacturing CNF from conventional
and proposed pretreatment techniques to evaluate energy and environmental impacts.

7
References
Abe, K., Yano, H., 2009, Comparison of the characteristics of cellulose microfibril aggregates of
wood, rice straw and potato tuber, Cellulose, 16:1017–1023.
Ankerfors, M., 2015, Microfibrillated cellulose: Energy-efficient preparation techniques and key
properties, PhD. Dissertation, KTH Royal Institute of Technology.
Arvidsson, R., Nguyen, D., Svanstrom M., 2015, Life cycle assessment of cellulose nanofibrils
production by mechanical treatment and two different pretreatment processes, Environ. Sci.
Technol., 49:6681-6890.
Atic, C., Immamoglu, S., Valchev, I., 2005, Determination of specific beating energy-applied on
certain pulps in a valley beater, J. Univ. Chem. Technol. Met., 40(3):199–204.
Besbes, I., Alila, S., Boufi, S., 2011a, Nanofibrillated cellulose from TEMPO-oxidized
eucalyptus fibers: Effects of the carboxyl content, Carbohydrate Polymers, 84:975-983.
Besbes, I., Vilar, M.R., Boufi, S., 2011b, Nanofibrillated cellulose from Alfa, Eucalyptus and
Pine fibres: Preparation, characteristics and reinforcing potential, Carbohydrate Polymers,
86:1198-1206.
Chakraborty, A., Sain, M., Kortschot, M., 2005, Cellulose microfibrils: A novel method of
preparation using high shear refining and cryocrushing, Holzforschung, 59:102-107.
Cuissinat, C., Navard, P., 2006, Swelling and dissolution of cellulose part II: free floating cotton
and wood fibres in NaOH–water–additives Systems, Macromolecular Symposia, 244(1):19-30.
Dinand, E., Vignon, M., Chanzy, H., Heux, L., 2002, Mercerization of primary wall cellulose
and its implication for the conversion of cellulose I to cellulose II, Cellulose, 9:7-18.
Dufresne, A., 2013, Nanocellulose: From Nature to High Performance Tailored Materials,
Walter de Gruyer, Berlin & New York.

8
Eriksen, Ø., Syverud, K. and Gregersen, Ø., 2008, The use of microfibrillated cellulose produced
from kraft pulp as strength enhancer in TMP paper, Nordic Pulp & Paper Research Journal,
23(3):299-304.
Eyholzer, Ch., Bordeanu N., Lopez-Suevos, F., Rentsch D., Zimmermann T., Oksman, K., 2010,
Preparation and characterization of water-redispersible nanofibrillated cellulose in powder form,
Cellulose 17:19-30.
Fukuzumi, H., Saito, T., Iwata, T., Kumamoto, Y., Isogai, A., 2009, Transparent and high gas
barrier films of cellulose nanofibers prepared by TEMPO-mediated oxidation,
Biomacromolecules, 10:162-165.
Herrick, F.W., Casebier, R.L., Hamilton, J.K., Sandberg, K.R., 1983, Microfibrillated cellulose:
Morphology and accessibility. J. Appl. Polym. Sci.: Appl. Polym. Symp. 37, 797-813.
Hohenthal, C., Ovasakainen, M., Bussini, D., Sadocco, P., Pajula, T., Hannele, L., Kautto, J.,
Salmenkivi, K., 2012, Final assessment of nanoenhanced new products, VTT Technical Research
Centre of Finland.
Li, Q., McGinnis, S., Sydnor, C., Wong, A., Renneckar, S., 2013, Nanocellulose life cycle
assessment, ACS Sustainable Chem. Eng., 1:919-928.
Miao, Z., Grift, T.E., Hansen, A.C., Ting, K.C., 2011, Energy requirement for comminution of
biomass in relation to particle physical properties, Industrial Crops and Products, 33(2):504-513.
Saito T., Nishiyama Y., Putaux J.L., Vignon M., Isogai A., 2006, Homogeneous suspensions of
individualized microfibrils from TEMPO-catalyzed oxidation of native cellulose,
Biomacromolecules, 7:1687-1691.

9
Saito, T., Hirota, M., Tamura, N., Kimura, S., Fukuzumi, H., Heuz, L., Isogai, A., 2009,
Individualization of nano-sized plant cellulose fibrils by direct surface carboxylation suing
TEMPO catalyst under neutral conditions, Biomacromolecules, 7:1687-1691.
Sharma, S. Nair, S.S., Zhang, Z., Ragauskas, A.J., Deng, Y., 2015, Characterization of micro
fibrillation process of cellulose and mercerized cellulose pulp, RSC Advances, 5:63111-63122.
Shibazaki, H., Kuga, S., Okano, T., 1997, Mercerization and acid hydrolysis of bacterial
cellulose, Cellulose 4:75-87.
Shibazaki, H., Kuga, S., Okano, T., 1997, Mercerization and acid hydrolysis of bacterial
cellulose, Cellulose, 4:75-87.
Sobue, H., Kiessig, H., Hess, K., 1939, The cellulose-sodium hydroxide-water system as a
function of the temperature, Z. Physik. Chem. B, 43:309–328.
Spence, K.L., Benditti, R.A., Rojas, O.J., Habibi, Y., Pawlak, J.J., 2011, A comparative study of
energy consumption and physical properties of microfibrillated cellulose produced by different
processing methods, Cellulose, 18:1097-1111.
Stevens, M.P., 1999, Polymer Chemistry: An introduction, 3rd edition, Oxford University Press,
New York.
Syverud, K. and Stenius, P., 2009, Strength and barrier properties of MFC films, Cellulose,
16:75-85.
Turbak, A.F., Snyder, F.W., Sandberg, K.R. 1983a, Microfibrillated cellulose, a new cellulose
product: Properties, uses, and commercial potential, J. Appl. Polym. Sci. Appl. Polym. Symp.,
37:815-827.

10
Wågberg, L., Norgren, G.D.M., Lindstrom, T., Ankerfors, M., Axnas, K., 2008, The build-up of
polyelectrolyte multilayers of microfibrillated cellulose and cationic polyelectrolytes, Langmuir,
24:784-795.
Wang, H., Li, D., Yano, H., Abe, K., 2014, Preparation of tough cellulose II nanofibers with high
thermal stability from wood, Cellulose, 21:1505.
Wang, Y., 2008, Cellulose fiber dissolution in sodium hydroxide solution at low temperature:
dissolution kinetics and solubility improvement, PhD dissertation, Georgia Institute of
Technology.
Yan, H., Lindstrom, T., Christiernin, M., 2006, Some ways to decrease fibre suspension
flocculation and improve sheet formation, Nordic Pulp & Paper Research Journal, 21(1):36-43.
Yano, H., Nakahara, S., 2004, Bio-composites produced from plant microfiber bundles with a
nanometer unit web-like network, Journal of Materials Science, 39:1635-1638.
Zhang, J., Song, H., Lin, L., Zhuang, J., Pang, C., 2012, Microfibrillated cellulose from bamboo
pulp and its properties, Biomass and Bioenergy, 39:78-83.

11
CHAPTER 2
REVIEW OF LITERATURE
Cellulose 1.
Cellulose is the most abundant natural organic polymer as it is a main component of plant
cell walls. Since the total annual biomass production is approximately 1.5×10¹² tons, cellulose is
an almost inexhaustible source. Cellulose is a linear polymer as the repeating units of β-d-
glucopyranose are linked by linear β -1, 4 glucosidic linkages (Figure 2.1.). Cellulose has a large
number of hydrogen groups at C-2, C-3 and C-6 atoms. Due to its linear structure and multiple
hydroxyl groups, cellulose can form extensive intra- and intermolecular hydrogen bonds, which
enables cellulose to form a stable three-dimensional structure. Intramolecular hydrogen bonds
are also responsible for cellulose stiffness and its insolubility in most solvents (Gavillon 2007;
Wang, 2008). Besides, cellulose has a hierarchical morphological structure; elementary fibrils
(1.5-3.5 nm in widths), microfibrils (10-30 nm in widths) and microfibrillar bands (larger than
100nm in widths) (Klemm et al. 2005). The elementary fibrils pack to the microfibrils, and the
microfibrils form the basic structural units of the plant cell wall. Each microfibril can be
considered as a string of cellulose crystals, linked along the chain axis by disordered amorphous
regions, merging into fibril bundles.
Cellulose is a skeletal component in plants that have ordered cell wall layers. Figure 2.2.
schematically represents the cell walls of cotton and wood fibers. In most plant fibers, cellulose
predominately exists in the central layer (S2) of a secondary cell wall, and it is surrounded by the
amorphous matrix substances (hemicellulose and lignin, Figure 2.3.). The distribution of

12
cellulose, hemicellulose and lignin differs depending on the plant type. For instance, softwood
typically has 42%, 27% and 28% of cellulose, hemicellulose and lignin content, respectively;
while hardwood has 45%, 30% and 20%, respectively (Smook, 2002).
Several crystalline forms of cellulose have been determined: cellulose I, II, III and IV, and
cellulose I and II have been widely studied. In nature, cellulose is found in the crystalline form of
cellulose I that contains two parallel cellulose chains in a unit cell. In the 1980s, CP/MAS NMR
spectroscopic studies showed that native cellulose is composed of two different crystalline
cellulose I modifications, Iα and Iβ (Atalla and VanderHart, 1984). The ratio of Iα and Iβ greatly
depends on cellulose sources. Iα is the main crystalline form in bacterial and algal celluloses;
while, Iβ is dominant in higher plants (cotton, wood and etc.). These two crystalline forms have
different patterns of hydrogen bonding. Iα has a triclinic cell with one-chain-per-unit cell;
whereas, Iβ has a monoclinic cell with two-chains-per-unit cell (Dufresne, 2013). Native
cellulose can be converted into cellulose II by two distinct processes: mercerization (treatment
with concentrated sodium hydroxide aqueous solutions) or dissolution followed by regeneration.
Cellulose II has a monoclinic unit cell like cellulose Iβ; however, the chain arrangement is
transited from parallel to antiparallel (Figure 2.4.). Such antiparallel arrangement allows the
formation of a larger number of intermolecular hydrogen bonds than the native form. Since the
conversion of cellulose I to cellulose II is irreversible, cellulose II is thermodynamically more
stable than cellulose I.
Nanocellulose 2.
Nanocellulose refers to a cellulosic material that has at least one dimension at a nano scale. It
can be classified into three types, cellulose nanofibrils (CNF), cellulose nanocrystals (CNC) and
bacterial nanocellulose (BNC) adapted from Klemm et al. (2011). Each type of nanocellulose is

13
obtained using a different preparation method, and it has different dimensions that affect its
functions. A brief production process for CNF and CNC is shown in Figure 2.5.
First, cellulose nanofibrils, known as microfibrillated cellulose, nanofibrillated cellulose, and
cellulose nanofibers, was first developed by Turbak et al. (1983a) and Herrick et al. (1983). They
conducted mechanical refining and a high pressure homogenization processes with wood
cellulose fibers, and they obtained a gel-like material, naming this new material as
microfibrillated cellulose. Since then, a number of studies have been conducted on cellulose
nanofibrils. Cellulose nanofibrils generally has a diameter of below 100 nm, and a length of
several micrometers (Klemm et al. 2011). Due to high aspect ratio (length/width), it forms rigid
network structures that induce remarkable mechanical properties. It has been reported that the
CNF films have a tensile strength of up to 310 MPa, which is much higher than commercial
polymers, such as polyethylene, polystyrene, and polycarbonate (up to 70 MPa) and high
performance polymers, such as polyimide and polyetheretherketon (70-100 MPa). (Stevens
1999; Yano and Nakahara 2004; Abe and Yano, 2009; Fukuzumi et al. 2009; Saito et al. 2009).
CNF has been incorporated as a reinforcing agent into various polymer matrices, such as
polypropylene, poly(lactic acid) and starch. For instance, Jonoobi et al. (2010) reported that
CNF-reinforced poly(lactic acid) had a higher tensile strength and modulus (71 MPa and 3.6
GPa, respectively) than pure poly(lactic acid), which had a tensile strength and modulus of 58
MPa and 2.9 GPa, respectively. In addition, CNF gels have not only high viscosity but also a
high degree of shear thinning, which makes CNF injectable (Pääkkö et al. 2007). CNF is also
renewable as it can be prepared from forestry and agricultural residues. Due to these outstanding
characteristics, cellulose nanofibrils has a wide range of potential application fields, such as
food, cosmetics, packaging, electronics, and biomedical applications.

14
Mechanical disintegration process is required to obtain well-delaminated cellulose
nanofibrils from cellulose fibers, which are held by hydrogen bonds. The equipment commonly
used to produce CNF includes a high pressure homogenizer, a microfluidizer, and an
microgrinder. However, there are several technical problems in the mechanical disintegration
process, such as high energy consumption and clogging in a homogenizer (Klemm et al. 2011).
More specifically, the energy required by a high pressure homogenizer reaches as high as 70,000
kWh/ton (Eriksen et al. 2008). By comparison, the average U.S. household consumed 11,320
kWh of electricity in 2009 (EIA, 2009). Due to this energy problem, it had been considered that
it was almost impossible to commercialize cellulose nanofibrils, and only few studies had been
conducted. However, after year 2000, the research on CNF has become a rapidly evolving
research area because of the increasing demand for renewable materials and interest of
nanotechnology. The development of mechanical, chemical or/and enzymatic pretreatment
makes CNF production available at a large scale since the pretreatment facilitates the fibrillation
process, reducing energy consumption and clogging. Several pilot and commercial plants for
cellulose nanofibrils have opened since 2011.
Cellulose nanocrystals, called nanocrystalline cellulose, cellulose whiskers, and cellulose
nanowhiskers, consist of rod-like cellulose particles. Its typical width ranges from 5 to 60 nm,
and its length varies on the cellulose sources. For instance, CNC obtained from plants has a
length of 100-250 nm, and CNC from tunicate, algae, and bacterial celluloses has a length from
100 nm to several microns. CNC is prepared by strong acid hydrolysis, often followed by
sonication. During the acid hydrolysis, amorphous regions of cellulose fibers are removed as the
hydronium ions attack weak points of cellulose (glucosidic bonds in amorphous regions); thus,
cellulose nanocrystals is highly crystalline (Siqueira et al. 2010). Hydrochloric acid or sulfuric

15
acid are the two most-used acids for CNC extraction. Sulfuric acid is more commonly used
because it reacts with the hydroxyl groups of cellulose, rendering the negatively charged surface
sulfate groups. This creates the repulsive forces between cellulose, which allow CNC
homogeneously dispersed in water (Dong et al. 1998). CNC acts as a reinforcing agent in
polymer composites, but it creates a weak reinforcing effect compared with CNF because of its
lower aspect ratio (Xu et al. 2013).
Bacterial nanocellulose (BNC) is generated by Gluconacetobacter bacteria strains. BNC is
produced by using a biotechnological bottom-up method unlike CNF and CNC, which are
produced by breaking macro-scale materials to nano-scale materials. Cellulose is synthesized
from biochemically activated dextrose between the outer and plasma membranes of the bacterial
cell by a cellulose-synthesizing complex. This complex is associated with pores at the surfaces of
the bacterial cell, having a diameter of around 3 nm (Gatenholm and Klemm, 2010). BNC has a
width ranging from 20 to 100 nm (Klemm et al. 2011). It has extensive networks due to the
random motion of bacteria. Moreover, BNC is pure cellulose that does not include functional
groups, such as carbonyl and carboxyl groups, and other polymers, such as hemicellulose and
lignin; therefore, it is the most-used nanocellulose in the biomedical application (Gatenholm and
Klemm, 2010).
Production of cellulose nanofibrils 3.
Cellulose nanofibrils is typically prepared by mechanical disintegration process using three
common methods: high pressure homogenization (Turbak et al. 1983a and 1983b; Herrick et al.
1983; Dufresne et al. 2000; Iwamoto et al. 2005; Malainine et al. 2005; Besbes at et al. 2011a
and 2011b; Li et al. 2012; Alila et al. 2013; Chaker et al. 2013), microfluidization (Pääkkö et al.
2007; Zimmermann et al. 2010; Spence et al. 2011; Zhu et al. 2011; Zhang et al. 2012) and
16
micro-grinding (Iwamoto et al. 2005, 2007 and 2008; Jonoobi et al. 2012; Josset et al. 2014).
Each method has its own advantages and disadvantages.
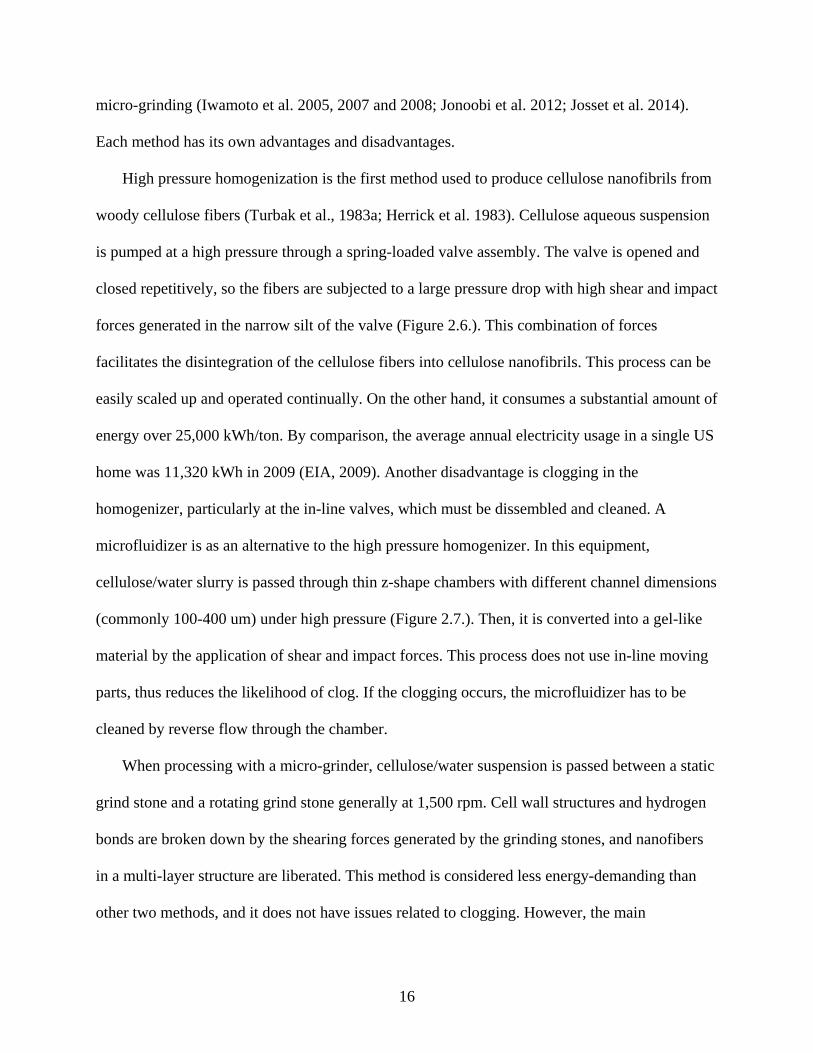
High pressure homogenization is the first method used to produce cellulose nanofibrils from
woody cellulose fibers (Turbak et al., 1983a; Herrick et al. 1983). Cellulose aqueous suspension
is pumped at a high pressure through a spring-loaded valve assembly. The valve is opened and
closed repetitively, so the fibers are subjected to a large pressure drop with high shear and impact
forces generated in the narrow silt of the valve (Figure 2.6.). This combination of forces
facilitates the disintegration of the cellulose fibers into cellulose nanofibrils. This process can be
easily scaled up and operated continually. On the other hand, it consumes a substantial amount of
energy over 25,000 kWh/ton. By comparison, the average annual electricity usage in a single US
home was 11,320 kWh in 2009 (EIA, 2009). Another disadvantage is clogging in the
homogenizer, particularly at the in-line valves, which must be dissembled and cleaned. A
microfluidizer is as an alternative to the high pressure homogenizer. In this equipment,
cellulose/water slurry is passed through thin z-shape chambers with different channel dimensions
(commonly 100-400 um) under high pressure (Figure 2.7.). Then, it is converted into a gel-like
material by the application of shear and impact forces. This process does not use in-line moving
parts, thus reduces the likelihood of clog. If the clogging occurs, the microfluidizer has to be
cleaned by reverse flow through the chamber.
When processing with a micro-grinder, cellulose/water suspension is passed between a static
grind stone and a rotating grind stone generally at 1,500 rpm. Cell wall structures and hydrogen
bonds are broken down by the shearing forces generated by the grinding stones, and nanofibers
in a multi-layer structure are liberated. This method is considered less energy-demanding than
other two methods, and it does not have issues related to clogging. However, the main

17
disadvantage of micro-grinding is disk maintenance and replacement because disks are worn
down.
Other than these three methods, French pressure cell press (Figure 2.8.) is a potential method
to produce cellulose nanofibrils. It is a high-pressure extrusion press commonly used to disrupt
cell under high pressure. It consists of a piston, a cell body and a closure plug with a needle
valve and an outlet tube. A compression force is exerted on the piston to drive it within the cell
body that contains a liquid sample. As the compressed fluid is dispensed through the outlet tube
(1/16 inch in diameter), the external pressure on the cell walls drops rapidly toward atmospheric
pressure. This large pressure drop leads to the disruption of cell wall membrane and the release
of the intra-cellular contents. The operating pressure can be as high as 40,000 psi and carefully
manipulated. However, the sample capacity of this method is limited up to 40 ml, and clogging
the valve may occur with certain types of samples.
Pretreatment methods 4.
4.1. Mechanical pretreatments for CNF production
Mechanical pretreatment aims to pre-fibrillate cellulose fibers and reduce fiber size in
order to facilitate the fiber disintegration easily. This process can damage the cellulose fibrillary
structure, causing external fibrillation that exposes secondary cell wall, where individual
cellulose fibrils are organized. Such process can also produce internal fibrillation that loosens the
fiber wall (Hamad 1997; Nakagaito and Yano 2004). Alternatives for mechanical pretreatment
include manual cutting, disk refiners, PFI mills, Valley beaters, and blenders (Turbak et al.
1983a; Herrick et al. 1983; Iwamoto et al. 2005; Chakraborty et al. 2005; Zhang et al. 2012;
Spence et al. 2011; Dinand et al. 1999, Dufresne et al. 2000; Malainine et al. 2005). The PFI mill
and the Valley beater are commonly used for refining pulps in the laboratory scale (Figure 2.9.).
18
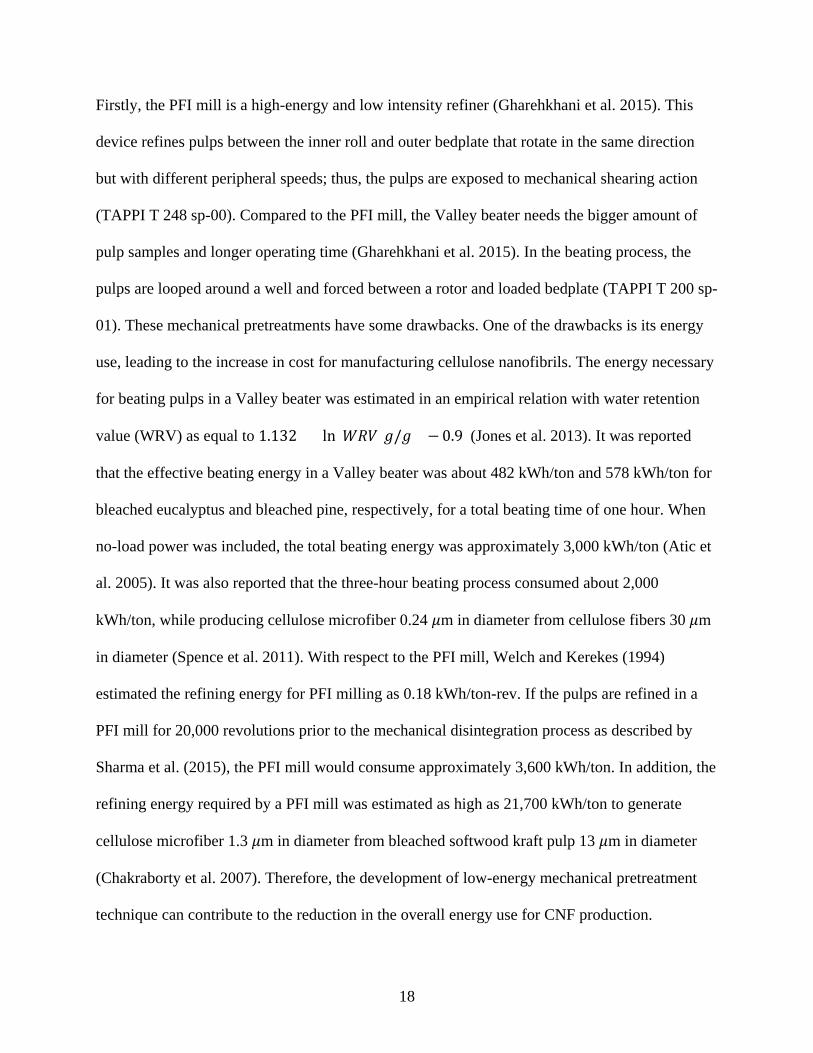
Firstly, the PFI mill is a high-energy and low intensity refiner (Gharehkhani et al. 2015). This
device refines pulps between the inner roll and outer bedplate that rotate in the same direction
but with different peripheral speeds; thus, the pulps are exposed to mechanical shearing action
(TAPPI T 248 sp-00). Compared to the PFI mill, the Valley beater needs the bigger amount of
pulp samples and longer operating time (Gharehkhani et al. 2015). In the beating process, the
pulps are looped around a well and forced between a rotor and loaded bedplate (TAPPI T 200 sp-
01). These mechanical pretreatments have some drawbacks. One of the drawbacks is its energy
use, leading to the increase in cost for manufacturing cellulose nanofibrils. The energy necessary
for beating pulps in a Valley beater was estimated in an empirical relation with water retention
value (WRV) as equal to 1.132 × ln(𝑊𝑊𝑊[𝑔/𝑔]) − 0.9 (Jones et al. 2013). It was reported
that the effective beating energy in a Valley beater was about 482 kWh/ton and 578 kWh/ton for
bleached eucalyptus and bleached pine, respectively, for a total beating time of one hour. When
no-load power was included, the total beating energy was approximately 3,000 kWh/ton (Atic et
al. 2005). It was also reported that the three-hour beating process consumed about 2,000
kWh/ton, while producing cellulose microfiber 0.24 𝜇m in diameter from cellulose fibers 30 𝜇m
in diameter (Spence et al. 2011). With respect to the PFI mill, Welch and Kerekes (1994)
estimated the refining energy for PFI milling as 0.18 kWh/ton-rev. If the pulps are refined in a
PFI mill for 20,000 revolutions prior to the mechanical disintegration process as described by
Sharma et al. (2015), the PFI mill would consume approximately 3,600 kWh/ton. In addition, the
refining energy required by a PFI mill was estimated as high as 21,700 kWh/ton to generate
cellulose microfiber 1.3 𝜇m in diameter from bleached softwood kraft pulp 13 𝜇m in diameter
(Chakraborty et al. 2007). Therefore, the development of low-energy mechanical pretreatment
technique can contribute to the reduction in the overall energy use for CNF production.
19
Moreover, the standard mechanical refining process is a wet processing. The mechanical
pretreatment process using a PFI mill is performed at the initial pulp consistency of 10%.
Specifically, 300g of cellulose slurry containing 30g of cellulose (dry basis) can be refined per
run (TAPPI T 248 sp-00). The process with a Valley beater is carried out at the pulp consistency
of 1.57%, having 360g of cellulose (dry basis) in 23 L (TAPPI T 200 sp-01). This indicates that
both mechanical pretreatment processes produce wet cellulose precursors, and their bulk volume
would make it difficult to store and handle these cellulose precursors.
A shear cutting mill, known as a knife mill, has a potential as a mechanical pretreatment
method. It has been widely used for size reduction of biomass, such as wood and agricultural
crops. The literature reported that the effective energy for grinding biomass in a shear cutting
mill ranged from several tens kWh/ton to 200 kWh/ton (Cadoche and López 1989; Bitra et al.
2009; Miao et al. 2011). The energy requirement for grinding depends on many factors, such as
machine parameters, initial particle size, moisture content, and material properties (Mani et al.
2004). Cadoche and López (1989) demonstrated that the effective energy necessary for the shear-
cutting mill to grind hardwood chips was 130 kWh/ton and 50 kWh/ton for 1.6 mm and 3.2 mm
particle size, respectively. Energy consumption for grinding miscanthus and switchgrass in the
shear cutting mill equipped with 1 mm screen was 200 kWh/ton and 150 kWh/ton, respectively.
When the screen size increased to 2 mm, the grinding energy decreased to 100 kWh/ton for both
grasses (Miao et al. 2011). Unfortunately, there is no study that has tested the shear cutting mill
either on cellulose pulps or for fine grinding even though the screen size is available as small as
0.25 mm. Shear cutting process with 0.25 mm screen would produce very fine particles. It is
expected that shear cutting of cellulose pulp with 0.25 mm screen would produce cellulose
precursors for manufacturing cellulose nanofibrils, while requiring a relatively low compared

20
with other mechanical pretreatment processes. Moreover, this process is performed without
water. Consequently, a shear cutting mill could be an alternative mechanical pretreatment
method which produces dry cellulose precursors and reduces overall energy consumption for
producing cellulose nanofibrils.
4.2. Chemical pretreatments for CNF production
4.2.1. Conventional chemical pretreatments for CNF production
Several chemical pretreatments have been developed in order to facilitate the mechanical
disintegration of cellulose. 2,2,6,6,-tetramethylpiperidine-1-oxyl radial (TEMPO)-mediated
oxidation has been widely studied as a chemical pretreatment for cellulose nanofibrils
production. (Saito et al. 2006 and 2007; Besbes et al. 2011a and 2011b; Zhang et al. 2012; Alila
et al. 2013; Chaker et al. 2013). This process converts half of C6 primary hydroxyl groups on
cellulose surface into C6 carboxyl groups (Figure 2.10.). TEMPO oxidation helps cellulose
fibers to be delaminated in several ways; 1) repulsive forces between cellulose fibers from the
introduction of the carboxyl groups, 2) TEMPO oxidation favors the hydration and swelling of
cellulose fibers, making the fibers more flexible and also increasing the accessibility of their
crystalline regions, 3) the oxidation also makes the S2 layer more accessible and more prone to
be fibrillated by loosening the primary S1 cell wall, and 4) the oxidation leads to chain scission
in the amorphous region, which creates weak points within the cell wall (Besbes et al. 2011a).
Carboxymethylation process is another common chemical pretreatment method.
Cellulose fibers are first reacted with sodium hydroxide to become more accessible to chemicals,
and then with monochloroacetic acid to introduce carboxymethyl groups as shown in Figure
2.11. The introduction of such charged groups is expected to enhance delamination of cellulose
fibers by giving electrostatic repulsive forces between fibers. In addition, carboxymethylation

21
leads to fiber swelling, and carboxymethyl groups should be in the form of their sodium salts in
order to cause as much swelling of cellulose fibers as possible. Swollen fibers are more
susceptible to be delaminated as they have lower cell-wall cohesion than less swollen fibers
(Klemm et al. 2011). It was reported that with the carboxymethylation process, cellulose
nanofibrils was successfully obtained only after one pass through a high pressure fluidizer and
had a diameter of 5-10 nm (Wågberg et al. 2008; Aulin et al. 2010).
There are several disadvantages of chemical pretreatment methods. First, these processes
require various chemicals and organic solvents, which is far from environmentally benign
technology. TEMPO oxidation uses sodium hypochlorite or/and sodium chlorite, sodium
bromide, TEMPO and ethanol. Carboxymethylation is based on the reaction in organic solvents,
such as ethanol, methanol and isopropanol. More specifically, a total of 30 kg of organic solvents
are consumed to manufacture one kg of cellulose nanofibrils (Arvidsson et al. 2015). In addition,
the introduction of functional groups, such as carboxyl and carboxymethyl groups, decreases
thermal stability of cellulose due to decarbonation (Britto and Assis 2009). Fukuzumi et al.
(2009) demonstrated that TEMPO-oxidized cellulose nanofibrils had an onset thermal
degradation temperature (To) of approximately 200 ℃, while original cellulose had a To of
approximately 300 ℃. Other studies also confirm that the thermal degradation of cellulose
nanofibrils containing functional groups takes place at lower temperature than pure cellulose
nanofibrils (Fukuzumi et al. 2010; Eyholzer et al. 2010).
4.2.2. Alkaline pretreatment for CNF production
Alkaline treatment with high concentrated sodium hydroxide solution has been used to
activate cellulose. When cellulose fibers are soaked in 17-20 wt.% NaOH solution at room
temperature, native cellulose is converted into alkali-cellulose (Na-cellulose) as below:

22
Cell-OH + NaOH Cell-O-, Na+ +H2O
In this stage, cellulose fibers are swollen and activated for further modification or/and dissolution
(Wang 2008). For instance, this treatment is a prerequisite in the production of cellulose
derivatives, such as carboxymethyl cellulose, and in the manufacturing of cellulose-based
sponges (Porro et al., 2007). NaOH treatment also enhances cellulose mobility, causing the
rearrangement of cellulose chains from cellulose I to Na-cellulose and after washing to cellulose
II as seen in Figure 2.12. (Simon et al. 1988; Shibazaki et al. 1997). This transformation is called
as mercerization. Cellulose II is considered more thermally stable than cellulose I as mentioned
earlier.
Few studies have been conducted on cellulose nanofibrils with a cellulose II crystal
structure (Shibazaki et al. 1997; Dinand et al. 1999, 2002; Abe and Yano 2012; Wang et al.
2014). Dinand et al. (2002) reported that fibrillated cellulose fibers became swollen and
mercerized when treated with 10% or higher NaOH. They found that the mercerization induced a
drastic modification of cellulose morphology. All individual microfibrils were destroyed and
irregularly aggregated. During subsequent washing, the entire sample was converted into a
precipitate. This morphological change can be explained by an interdigitation mechanism
suggested by Okano and Sarko (1985). A cell wall of native cellulose consists of microfibrils
with different polarities: “up” and “down”, and a single microfibril contains cellulose chains of
the same polarity. During the mercerization process, microfibrils are swollen and therefore
liberate cellulose chains. The cellulose chains of opposite polarity could coalesce and
interdigitate to form antiparallel cellulose II as shown in Figure 2.13. (Kim et al. 2006). Abe and
Yano (2012) produced cellulose II hydrogel by processing cellulose nanofiber suspension in 15
wt.% NaOH solution and suggested that the resultant hydrogels had a continuous and strong

23
network formed via the firm interdigitation between the nanofibers. Recently, well-dispersed
cellulose II nanofibrils was successfully prepared by delaminating cellulose II fibers (Wang et al.
2014; Sharma et al. 2015). Cellulose II nanofibers would have better thermal stability than
cellulose I nanofibers due to the stronger hydrogen bonding in cellulose II crystal structure if
both cellulose I and II nanofibers have a similar degree of fibrillation and therefore have a
similar surface area. Wang et al. (2014) found that cellulose II nanofibers had a higher onset and
maximum thermal decomposition temperature at 326 ℃ and 353 ℃, respectively, compared with
those for cellulose I nanofibers at 302 ℃ and 348 ℃, respectively. On the other hand, Sharma et
al. (2015) reported that cellulose I and II nanofibers had a different thermal behavior. In case of
cellulose I nanofibers, a significant drop in maximum thermal degradation temperature was
observed after microgrinding for 20 passes; while cellulose II nanofibers showed a large
decrease in thermal stability after microgrinding for 60 passes. This is because a significant
decrease in size of cellulose I and II nanofibers occurred at different stages of microgrinding
(after 20 and 60 passes, respectively). However, this NaOH treatment is unlikely to be applied to
the large-scale CNF production for the following reasons: difficulty in fibrillation of cellulose II
fibers and high water consumption for neutralization. Firstly, it is difficult to produce well-
delaminated cellulose II nanofibers due to the interdigitation and aggregation of cellulose II
fibers as described above. Wang et al. (2014) obtained well-delaminated cellulose II nanofibers
by a single grinder treatment followed by 50 homogenization treatments and centrifugation.
Sharma et al. (2015) also reported that the higher number of passes through a microgrinder was
required to produce cellulose II nanofibers compared to cellulose I nanofibers. They found that
cellulose II fibers at the submicron level could be obtained after microgrinding for 60 passes,
while cellulose I fibers had diameters of the order of hundreds of nanometers after 20 passes and
24
diameters of few nanometers after 60 passes. Moreover, cellulose II fibers are obtained by
processing cellulose I fibers in high concentration of NaOH solution. This results in the
considerable water usage during neutralization.
Instead of using high-concentration NaOH solution, Sobue et al. (1939) found that low-
concentration NaOH solution (6-10 wt.%) highly swelled and even partly dissolved cellulose
when temperature ranged from -10 ℃ to 4 ℃. Since then, extensive studies on NaOH treatment
of cellulose at low temperatures have been conducted (Isogai et al. 1998; Roy et al. 2001;
Cuissinat and Navard, 2006; Egal et al. 2007; Wang, 2008). Cuissinat and Navard (2006)
identified five modes of cellulose swelling and dissolution by the NaOH treatment; (a) Fast
dissolution by disintegration into rod-like fragments (Mode 1); (b) Large swelling by ballooning
and then dissolution of the whole fiber (Mode 2); (c) Large swelling by ballooning and partial
dissolution of the fiber, still keeping fibrous shape (Mode 3); (d) Homogeneous swelling and no
dissolution of any part of the fiber (Mode 4); and (e) No swelling and no dissolution (Mode 5,
case of a non-solvent). Cellulose with low degree of polymerization (DP < 200) could be fully
dissolved in 9wt% NaOH solution at low temperature, indicating mode 1. However, most
commercial wood pulps have DP value of about 800, which cannot be fully dissolved in NaOH
solution even at low temperature, and such high DP cellulose appears to be in mode 3.
Particularly, Wang (2008) reported that cotton fiber with DP value of 800 had a limited solubility
of up to 30% in 6% NaOH solution when the reaction temperature was below -10 ℃. In addition,
the low-concentration NaOH treatment converts cellulose crystalline structure to cellulose II as
the high-concentration NaOH treatment does. Even with 4wt% NaOH, cellulose crystal structure
was transformed from cellulose I to cellulose II at low temperature (Wang 2008).

25
4.2.3. Carboxymethylcellulose (CMC) addition for CNF production
Carboxymethylcellulose (CMC) is a cellulose derivative achieved by introducing
carboxymethyl groups on cellulose backbone. Several researchers used CMC for the production
of cellulose nanofibrils with redispersibility. Herrick (1984) reported that the addition of CMC
inhibited hydrogen bonds between cellulose fibers; thus, the resultant cellulose nanofibrils was
able to be redispersed after drying. However, a large amount of CMC was required, at least one
half the weight of cellulose on dry basis. Cantiani et al. (2002) used CMC with a high degree of
substitution (higher than 0.95) to prepare redispersible cellulose nanofibrils from cells with
primary walls. They reported that the required amount of CMC was relatively small, less than or
equal to 30% by weight relative to the weight of cellulose. Besides, it was found that CMC could
be irreversibly attached to cellulose fibers, and a small amount of the attached CMC was
sufficient to produce paper with high wet strength (Laine et al. 2000 and. 2002, Lindström, 2006;
Duker et al. 2008). Recently, CMC attachment was applied in cellulose nanofibrils production
(Ankerfors 2015). CMC attachment facilitates disintegration of cellulose fibers in two ways.
First, CMC basically introduces charges into cellulose fibers, preventing the formation of
hydrogen bonds between cellulose fibers. CMC also serves as a lubricant, creating the
lubricating effect between fibers and possibly between fibrils in the fiber wall (Yan et al. 2006
and Ankerfors 2015). CMC can be attached on the cellulose surface or in the fiber wall, and
whether CMC is attached on the surface or in the fiber wall depends on the molecular weight of
CMC (Laine et al. 2000). The attachment of high-molecular-weight CMC is limited on the fiber
surface, while low-molecular-weight CMC can penetrate the fiber wall; thus can be attached
either on the surface or in the fiber wall. Types of CMC play an important role in the production
of CNF. Ankerfors (2015) prepared cellulose nanofibrils using three different types of CMC:

26
amphoteric CMC, anionic CMC with high molecular weight, and anionic CMC with low
molecular weight. Cellulose nanofibrils gel was prepared with 20 mg or more of amphoteric
CMC per gram of cellulose. It was also able to obtain cellulose nanofibrils gel with high-
molecular-weight anionic CMC; however, the added amount of the CMC was 3-4 times higher
than that of the amphoteric CMC. In contrast, the addition of low-molecular-weight anionic
CMC could neither avoid clogging in a homogenizer, nor produce cellulose nanofibrils gel.
Life cycle assessment (LCA) 5.
Life cycle assessment (LCA) is a reliable tool to evaluate the environmental impacts of a
process or a product throughout its life cycle. LCA is used to quantify material usage, energy
consumption and emissions in a life cycle context. A LCA study includes several impact
categories, such as global warming potential, acidification, eutrophication, ozone depletion, and
ecotoxicity. The LCA process consists of four main phases: goal and scope definition, inventory
analysis, impact assessment, and interpretation. Goal and scope definition aims to clarify the
purpose and extent of the LCA study. At this phase, the functional unit or basis for assessment
should be determined, and a clear description of the system boundary should be provided. Life
cycle inventory analysis is a process of quantifying energy, water, raw material, and
environmental release. It begins with the construction of a process flowchart that shows the
inputs and outputs required for the life cycle of the product or the process. It also includes data
collection and data calculation in relation to the functional unit. Impact assessment uses the
inventory results to evaluate the potential impact on environment and human. Interpretation is
needed to analyze the results of the inventory analysis and impact assessment, reach conclusions,
explain limitations and provide recommendations.

27
5.1. LCA of CNF production
Three LCA studies related to cellulose nanofibrils have been conducted (Hohenthal et al.
2012, Li et al. 2013; Arvidsson et al. 2015). Hohenthal et al. (2012) assessed environmental
impacts of CNF production from three different processing routes, including TEMPO-oxidation
or enzymatic pretreatment with homogenization, and TEMPO-oxidation with Cavitron
dispersion. This LCA report unfortunately did not clearly describe the source for quantitative
inventory data. The LCA study conducted by Li et al. (2013) is the only one that studied CNF
production in the United States. They reported environmental impacts of CNF production from
four different processing routes in combination of two chemical pretreatments (TEMPO-
oxidation and chloroacetic acid etherification) and two mechanical disintegration processes (high
pressure homogenization and sonication). The results showed that the production route using
TEMPO oxidation and homogenization was the best process with the lowest energy demand of
3,470 MJ for producing one kg cellulose nanofibrils, while the production route with
etherification and sonication required the highest energy demand of 17,610 MJ for producing one
kg of CNF. Comparing the two chemical pretreatment techniques, TEMPO oxidation was less
energy-intensive than chloroacetic acid etherification since TEMPO oxidation needed a small
amount of organic solvents compared with chloroacetic acid etherification. With respect to the
mechanical disintegration process, the energy demand for sonication was around 3,000 MJ/kg
CNF higher than for homogenization. This was because sonication required an additional step of
centrifugation. However, this report has limitations since the data was obtained from lab-scale
measurements. Arvidsson et al. (2015) assessed the life cycle environmental impacts of CNF
produced from three different production routes; (1) enzymatic pretreatment with
microfluidization, (2) carboxymethylation with microfluidization, and (3) high pressure

28
homogenization with no pretreatment. In this report, four impact categories were selected:
energy use, global warming potential, acidification and water use. Carboxymethylation route had
the higher impact for all impact categories due to the high chemical consumption. In particular,
total chemical input for carboxymethylation was 30 kg for producing one kg of cellulose
nanofibrils. The carboxymethylation route required approximately 1,800 MJ of energy to
manufacture one kg CNF, which is 7-fold and 10-fold higher energy demand compared to the no
pretreatment route and enzymatic route, respectively. The global warming potential of the
carboxymethylation route was around 100 kg CO2 eq./kg CNF. In contrast, other routes
generated less than 5 kg CO2 eq. of emissions to produce one kg of CNF. With respect to
terrestrial acidification, the carboxymethylation route had the highest impacts, around 0.2 kg SO2
eq./kg CNF; whereas, the acidification impact of the enzymatic route and no treatment route was
20 times lower (around 0.01 kg SO2 eq./kg CNF). Finally, considering water use, the
carboxymethylation required the highest water intake of 1.2 m3 for producing one kg of cellulose
nanofibrils, followed by the enzymatic route (0.25 m3) and the no pretreatment route (0.1 m3).
Although these three LCA study thoroughly assessed the environmental impacts of producing
cellulose nanofibrils with various pretreatment techniques, the environmental impacts of CNF
production with mechanical and alkaline pretreatment techniques have been not investigated.
The environmental impacts of the mechanical and alkaline pretreatment and its contribution of
total environmental impacts of CNF production need to be verified.
Summary 6.
Cellulose nanofibrils (CNF) refers to the cellulosic material with a diameter of 5-100 nm and
a length of several microns. Cellulose nanofibrils was first obtained from wood pulps by high
pressure homogenization in early 1980s, but the commercialization of CNF is still challenging.

29
This is mainly due to high energy consumption for homogenization (over 25,000 kWh/ton) and
standardizing CNF production process and its characteristics for specific applications. In
addition, development of large volume use of CNF for specific field of application is critical for
accelerating commercialization of this technology. Although less energy-demanding
disintegration methods have been developed, such as microfluidization and microgrinding,
pretreatment processes are required to further reduce energy required for the mechanical
disintegration process, thus making CNF production economically favorable. Several
pretreatment processes have been developed using mechanical, chemical or/and enzymatic
methods. Each process has its own advantages and disadvantages. Firstly, mechanical
pretreatment by a wet milling method, such as a Valley beater and a PFI mill, has been used to
reduce fiber size and pre-fibrillate fibers, facilitating the delamination of cellulose fibers into
CNF. This pretreatment produces wet cellulose precursors, which make difficulties during
storage and handling. It would also contribute to the increase in the total energy demand for
CNF. A shear cutting mill known as a knife mill could be used as a mechanical pretreatment
method, producing dry cellulose precursors and potentially reducing overall energy consumption
for manufacturing cellulose nanofibrils since the shear cutting process is performed without
water and requires up to 200 kWh/ton to grind wood and grasses. In addition, chemical
pretreatment has been used to reduce interaction between cellulose fibers, making them more
accessible during fibrillation by introducing charged groups on the cellulose surface. However, it
leads to the increase in CNF environmental impacts as it uses chemicals and organic solvents.
The introduction of charged groups reduces the thermal stability of the resultant cellulose
nanofibrils. Alkaline treatment with low-concentration NaOH solutions in the presence of
carboxymethylcellulose (CMC) could be an alternative chemical pretreatment method over other

30
chemical pretreatment methods. This treatment could facilitate the fibrillation of cellulose fibers
due to the swelling effect of NaOH. It is environmentally friendly as well as simple because it is
a water-based process. NaOH-treated cellulose nanofibrils could present improved thermal
stability over original cellulose nanofibrils since it could have thermally stable crystal structure,
cellulose II. Finally, life cycle assessment (LCA) of producing cellulose nanofibrils has been
conducted to assess environmental impacts of CNF on its entire life cycle. Overall, the
environmental impacts of CNF depend on the pretreatment method and mechanical
disintegration method. The use of chemical pretreatment significantly increased the
environmental impacts of CNF, and high pressure homogenization generally creates high
environmental impacts compared with other mechanical disintegration methods
(microfluidization and microgrinding) because it requires a high amount of energy. None of the
published LCA studies investigated mechanical and alkaline pretreatment techniques and their
impacts on the environment. Thus, additional LCA study is needed to verify the effects of these
pretreatment technologies on the environmental impacts of CNF production.

31
References
Abe, K., Yano, H., 2009, Comparison of the characteristics of cellulose microfibril aggregates of
wood, rice straw and potato tuber, Cellulose, 16:1017–1023.
Abe, K., Yano, H., 2012, Cellulose nanofiber-based hydrogels with high mechanical strength,
Cellulose, 19:1907–1912.
Alila, S., Besbes, I., Vilar, M.R., Mutje, P., Boufi, S., 2013, Non-woody plants as raw materials
for production of microfibrillated cellulose (MFC): A comparative study, Industrial crops and
products, 41:250-259.
Ankerfors, M., 2015, Microfibrillated cellulose: Energy-efficient preparation techniques and key
properties, PhD. Dissertation, KTH Royal Institute of Technology.
Arvidsson, R., Nguyen, D., Svanstrom M., 2015, Life cycle assessment of cellulose nanofibrils
production by mechanical treatment and two different pretreatment processes, Environ. Sci.
Technol., 49:6681-6890.
Atalla, R.H., VanderHart, D.L., 1984, Native cellulose: a composite of two distinct crystalline
forms, Science, 223:283-285.
Atic, C., Immamoglu, S., Valchev, I., 2005, Determination of specific beating energy-applied on
certain pulps in a valley beater, J. Univ. Chem. Technol. Met., 40(3):199–204.
Aulin, C., Gällstedt, M., Lindström, T., 2010, Oxygen and oil barrier properties of
microfibrillated cellulose films and coatings, Cellulose, 17:559-574.
Besbes, I., Alila, S., Boufi, S., 2011a, Nanofibrillated cellulose from TEMPO-oxidized
eucalyptus fibers: Effects of the carboxyl content, Carbohydrate Polymers, 84:975-983.

32
Besbes, I., Vilar, M.R., Boufi, S., 2011b, Nanofibrillated cellulose from Alfa, Eucalyptus and
Pine fibres: Preparation, characteristics and reinforcing potential, Carbohydrate Polymers,
86:1198-1206.
Bitra, V.S.P., Womac, A.R., Igathinathane, C., Miu, P.I., Yang, Y.T., Smith, D.R., Chevanan, N.,
Sokhansanj, S., 2009, Direct measures of mechanical energy for knife mill size reduction of
switchgrass, wheat straw, and corn stover, Bioresource Technology 100:6578–6585.
Britto, D., and Assis, O.B.G., 2009, Thermal degradation of carboxymethylcellulose in different
salty forms, Thermochimica Acta, 494:115-122.
Cadoche, L., López, G.D., 1989, Assessment of size reduction as a preliminary step in the
production of ethanol for lignocellulosic wastes, Biological Wastes, 30:153–157.
Cantiani, R., Knipper, M., Vaslin, S., 2002, Use of cellulose microfibrils in dry form in food
formulations, US Patent 6,485,767 B1.
Chaker, A., Alila, S., Mutje, P., Vilar, M.R., Boufi, S., 2013, Key role of the hemicellulose
content and the cell morphology on the nanofibrillation effectiveness of cellulose pulps,
Cellulose, 20:2860-2875.
Chakraborty, A., Sain, M., Kortschot, M., 2005, Cellulose microfibrils: A novel method of
preparation using high shear refining and cryocrushing, Holzforschung, 59:102-107.
Chakraborty, A., Sain, M.M., Kortschot, M.T., Ghosh, S.B., 2007, Modeling energy
consumption for the generation of microfibres from bleached kraft pulp fibres in a PFI mill,
BioResources, 2(2):210-222.
Cuissinat, C., Navard, P., 2006, Swelling and dissolution of cellulose part II: free floating cotton
and wood fibres in NaOH–water–additives Systems, Macromolecular Symposia, 244(1):19-30.
33
Dinand, E., Chanzy, H., Vignon, M.R., 1999, Suspensions of cellulose microfibrils from sugar
beet pulp, Food hydrocolloids, 13:275-283.
Dinand, E., Vignon, M., Chanzy, H., Heux, L., 2002, Mercerization of primary wall cellulose
and its implication for the conversion of cellulose I to cellulose II, Cellulose, 9:7-18.
Doherty, W.O.S., Mousavioun, P., Fellows, C.M., 2011, Value-adding to cellulosic ethanol:
lignin polymers, Industrial Crops and Products, 33:259–276.
Dong, X.M., Revol. J., Gray. D.G., 1998, Effect of microcrystalline preparation conditions on
the formation of colloid crystals of cellulose, Cellulose, 5:19-32.
Dufresne, A., Dupeyre, D., Vignon, M.R., 2000, Cellulose Microfibrils from Potato Tuber Cells:
Processing and Characterization of Starch–Cellulose Microfibril Composites, Journal of Applied
Polymer Science, 76:2080-2092.
Dufresne, A., 2013, Nanocellulose: From Nature to High Performance Tailored Materials,
Walter de Gruyer, Berlin & New York.
Duker, E., Ankerfors, M., Lindström, T., Nordmark, G.G., 2008, The use of CMC as a dry
strength agent – the interplay between CMC attachment and drying, Nordic pulp & paper
research journal, 23(1):65-71.
Egal, M., Budtova, T., Navard, P., 2007, Structure of aqueous solutions of microcrystalline
cellulose/sodium hydroxide below 0 C and the limit of cellulose limitation, Biomacromolecules,
8(7):2282-2287.
EIA, 2009, Residential Energy Consumption Survey, U.S. Energy Information Administration.
Eriksen, Ø., Syverud, K., Gregersen, Ø., 2008, The use of microfibrillated cellulose produced
from kraft pulp as strength enhancer in TMP paper, Nordic Pulp & Paper Research Journal.
23(3):299-304.

34
Eyholzer, Ch., Bordeanu, N., Lopez-Suevos, F., Rentsch, D., Zimmermann, T., Oksman, K.,
2010, Preparation and characterization of water-redispersible nanofibrillated cellulose in powder
form, Cellulose 17:19-30.
Fukuzumi, H., Saito, T., Iwata, T., Kumamoto, Y., Isogai, A., 2009, Transparent and high gas
barrier films of cellulose nanofibers prepared by TEMPO-mediated oxidation,
Biomacromolecules, 10:162-165.
Fukuzumi, H., Saito, T., Okita, Y., Isogai, A., 2010, Thermal stabilization of TEMPO-oxidized
cellulose, Polymer Degradation and Stability, 95:1502-1508.
Gatenholm, P., Klemm, D., 2010, Bacterial nanocellulose as a renewable material for biomedical
applications, MRS Bulletin, 35:208-213.
Gavillon, R., 2007, Preparation and characterization of ultra porous cellulosic materials, Master’s
thesis, Mechanics. Ecole Nationale Superieure des Mines de Paris.
Gharehkhani, S., Sadeghinezhad, E., Kazi, S.N., Yarmand, H., Badarudin, A., Safaei, M.R.,
Zubir, M.N., 2015, Basic effects of pulp refining on fiber properties-a review, Carbohydrate
Polymer, 115:785-803.
Hamad, W.Y., 1997, Some microrheological aspects of wood-pulp fibres subjected to fatigue
loading, Cellulose 4:51-56.
Herrick, F.W., 1984, Redispersible microfibrillated cellulose, US patent 4,481,076.
Herrick, F.W., Casebier, R.L., Hamilton, J.K., Sandberg, K.R., 1983, Microfibrillated cellulose:
Morphology and accessibility, J. Appl. Polym. Sci. Appl. Polym. Symp., 37:797-813.
Hohenthal, C., Ovasakainen, M., Bussini, D., Sadocco, P., Pajula, T., Hannele, L., Kautto, J.,
Salmenkivi, K., 2012, Final assessment of nanoenhanced new products, VTT Technical Research
Centre of Finland.

35
Isogai A., Saito, T., Fukuzumi, H., 2011, TEMPO-oxidized cellulose nanofibers, Nanoscale,
3:71-85.
Isogai, A., Atalla, R.H., 1998, Dissolution of cellulose in aqueous NaOH solutions, Cellulose,
5:309-319.
Iwamoto, S., K. Abe, Yano, H., 2008, The effect of hemicellulose on wood pulp nanofibrillation
and nanofiber network characteristics, Biomacromolecules, 9:1022-1026.
Iwamoto, S., Nakagaito, A.N., Yano, H., 2007, Nano-fibrillation of pulp fibers for the processing
of transparent nanocomposites, Appl. Phys.A-Mater.Sci.Process, 89:461-466.
Iwamoto, S., Nakagaito, A.N., Yano, H., Nogi, M., 2005, Optically transparent composites
reinforced with plant fiber-based nanofibers, Appl. Phys. A, 81:1109-1112.
Jones, B.W., Venditti, R., Park, S., Jameel, H., Koo, B., 2013, Enhancement in enzymatic
hydrolysis by mechanical refining for pretreated hardwood lignocellulosics, Bioresource
Technology, 147:353-360.
Jonoobi, M., Harun, J., Mathew, A.P., Oksman, K., 2010, Mechanical properties of cellulose
nanofiber (CNF) reinforced polylactic acid (PLA) prepared by twin screw extrusion, Composites
Science and Technology, 70(12):1742-1747.
Jonoobi, M., Mathew, A.P., Oksman, K., 2012, Producing low-cost cellulose nanofiber from
sludge as new source of raw materials, Industrial Crops and Products, 40:232–238.
Josset, S., Orsolini, P., Siqueira, G., Tejado, A., Tingaut, P., Zimmermann, T., 2014, Energy
consumption of the nanofibrillation of bleached pulp, wheat straw and recycled newspaper
through a grinding process, Nordic Pulp & Paper Research Journal, 29(1):167-175.
Kim, N., Imai, T., Wada, M., Sugiyama, J., 2006, Molecular Directionality in Cellulose
Polymorphs, Biomacromolecules, 7:274-280.

36
Klemm, D., Heublein, B., Fink, H-P., Bohn, A., 2005, Cellulose: Fascinating biopolymer and
sustainable raw material, Angew. Chem. Int. Ed., 44:3358-3393.
Klemm, D., Kramer, F., Mortiz, S., Lindstrom, T., Ankerfors, M., Gray, D., Dorris, A., 2011,
Nanocelluloses: a new family of nature-based materials, Angew. Chem. Int. Ed., 50(24):5438-
5466.
Laine, J., Lindstrom, T., Nordmark, G.G., Risinger, G., 2000, Studies on topochemical
modification of cellulosic fibres Part1., Chemical conditions for the attachment of
carboxymethyl cellulose onto fibres, Nordic Pulp & Paper Research Journal, 15(5):520-526.
Laine, J., Lindstrom, T., Nordmark, G.G., Risinger, G., 2002, Studies on topo chemical
modification of cellulosic fibres Part2., The effect of carboxymethyl cellulose attachment on
fibre swelling and paper strength, Nordic Pulp & Paper Research Journal, 17(1):50-56.
Li, J., Wei, X., Wanga, Q., Chena, J., Changa, G., Kongc, L., Sud, J., Liue, Y., 2012,
Homogeneous isolation of nanocellulose from sugarcane bagasse by high pressure
homogenization, Carbohydrate polymer, 90:1609-1613.
Li, Q., McGinnis, S., Sydnor, C., Wong, A., Renneckar, S., 2013, Nanocellulose life cycle
assessment, ACS Sustainable Chem. Eng., 1:919-928.
Lindström, T., 2006, Modifying cellulose fibres by using amphoteric cellulose derivative Patent
WO2005080678A1.
Malainine, M.E., Mahrouz, M., Dufresne, A., 2005, Thermoplastic nanocomposites based on
cellulose microfibrils from Opuntia ficus-indica parenchyma cell, Composites Sci. and Tech.,
65:1520-1526.
Mani, S., Tabil, L.G., Sokhansanj, S., 2004, Grinding performance and physical properties of
wheat and barley straws, corn stover and switchgrass, Biomass and Bioenergy, 27(4):339-352.
37
Miao, Z., Grift, T.E., Hansen, A.C., Ting, K.C., 2011 Energy requirement for comminution of
biomass in relation to particle physical properties, Industrial Crops and Products, 33(2):504-513.
Missoum, K, Belgacem, M.N., Bras, J., 2013, Nanofibrillated cellulose surface modification: A
review, Material, 6:1745-1766.
Nakagaito A.N. Yano H., 2004, The effect of morphological changes from pulp fiber towards
nano-scale fibrillated cellulose on the mechanical properties of high-strength plant fiber based
composites, Appl. Phys. A, 78:547-552.
Okano, T., Sarko, A., 1985, Mercerization of cellulose. II. Alkali-cellulose intermediates and a
possible mercerization mechanism, J. Appl. Polym. Sci., 30:325–332.
Pääkkö, M., Ankerfors. M., Kosonen, H., Nykänen, A., Ahola, S., Osterberg, M., Ruokolainen,
J., Laine, J., Larsson, P.T., Ikkala, O., Lindström, T., 2007, Enzymatic hydrolysis combined with
mechanical shearing and high-pressure homogenization for nanoscale cellulose fibrils and strong
gels, Biomacromolecules, 8:1934-1941.
Porro, F., Bedue, O., Chanzy, H., Heux, L., 2007, Solid-state C-13 NMR study of Nacellulose
complexes. Biomacromolecules, 8(8):2586-2593.
Repellin, V., Govin, A., Rolland, M., Guyonnet, R., 2010, Energy requirement for fine grinding
of torrefied wood, Biomass & Bioenergy, 34(7):923-930.
Roy, C., Budtova, T., Navard, P., Bedue, O., 2001, Structure of cellulose-soda solutions at low
temperatures, Biomacromolecules, 2(3):687-693.
Saito, T., Nishiyama, Y., Putaux, J.L., Vignon, M., Isogai, A., 2006, Homogeneous suspensions
of individualized microfibrils from TEMPO-catalyzed oxidation of native cellulose,
Biomacromolecules, 7:1687-1691.
38
Saito, T., Hirota, M., Tamura, N., Kimura, S., Fukuzumi, H., Heuz, L., Isogai, A., 2009,
Individualization of nano-sized plant cellulose fibrils by direct surface carboxylation suing
TEMPO catalyst under neutral conditions, Biomacromolecules, 7:1687-1691.
Saito, T., Kimura, S., Nishiyama, Y., Isogai, A., 2007, Cellulose nanofibers prepared by
TEMPO-mediated oxidation of native cellulose, Biomacromolecules, 8:2485-2491.
Sharma, S. Nair, S.S., Zhang, Z., Ragauskas, A.J., Deng, Y., 2015, Characterization of micro
fibrillation process of cellulose and mercerized cellulose pulp, RSC Advances, 5:63111-63122.
Shibazaki, H., Kuga, S., Okano, T., 1997, Mercerization and acid hydrolysis of bacterial
cellulose, Cellulose 4:75-87.
Simon, I., Glasser, L., Scheraga, H. A., Manley, R. S. J., 1988, Structure of cellulose. 2. low-
energy crystalline arrangements, Macromolecules, 21:990–998.
Siqueira G., Tapin-Lingua S., Bras J., da Silva Perez D., Dufresne A., 2010, Morphological
investigation of nanoparticles obtained from enzymatic and acid hydrolysis of sisal fibers,
Cellulose, 17:1147-1158.
Smook, G.A., 2002, Handbook for Pulp & Paper Technologists, 3rd edition, Angus Wilde
Publications Inc., Vancouver, Canada.
Sobue, H., Kiessig, H., Hess, K., 1939, The cellulose-sodium hydroxide-water system as a
function of the temperature, Z. Physik. Chem. B, 43:309–328.
Spence, K.L., Benditti, R.A., Rojas, O.J., Habibi, Y., Pawlak, J.J., 2011, A comparative study of
energy consumption and physical properties of microfibrillated cellulose produced by different
processing methods, Cellulose, 18:1097-1111.
Stevens, M.P., 1999, Polymer Chemistry: An introduction, 3rd edition, Oxford University Press,
New York.

39
Syverud, K. and Stenius, P., 2009, Strength and barrier properties of MFC films, Cellulose,
16:75-85.
TAPPI, 2000, T248 sp-00, Laboratory beating of pulp (PFI mill method), Technical Association
of the Pulp and Paper Industry, Norcross, GA.
TAPPI, 2001, T200 sp-01, Laboratory beating of pulp (Valley beater method), Technical
Association of the Pulp and Paper Industry, Norcross, GA.
Tingaut, P., Eyholzer, C., Zimmermann, T., 2012, Functional Polymer Nanocomposite Materials
from Microfibrillated Cellulose, Advances in Nanocomposite Technology, Dr. Abbass Hashim
(Ed.), InTech, DOI: 10.5772/20817, Available from:
http://www.intechopen.com/books/advances-in-nanocomposite-technology/functional-polymer-
nanocomposite-materials-from-microfibrillated-cellulose, Last accessed on 07/02/16.
Turbak, A.F., Snyder, F.W., Sandberg, K.R. 1983a, Microfibrillated cellulose, a new cellulose
product: Properties, uses, and commercial potential, J. Appl. Polym. Sci. Appl. Polym. Symp.,
37:815-827.
Turbak, A.F., Snyder, F.W., Sandberg K.R., 1983b, Suspensions containing microfibrillated
cellulose, US Pat. 4378381 A.
Wågberg, L., Norgren, G.D.M., Lindstrom, T., Ankerfors, M., Axnas, K., 2008, The build-up of
polyelectrolyte multilayers of microfibrillated cellulose and cationic polyelectrolytes, Langmuir,
24:784-795.
Wang, H., Li, D., Yano, H., Abe, K., 2014, Preparation of tough cellulose II nanofibers with high
thermal stability from wood, Cellulose, 21:1505-1515.

40
Wang, Y., 2008, Cellulose fiber dissolution in sodium hydroxide solution at low temperature:
dissolution kinetics and solubility improvement, PhD dissertation, Georgia Institute of
Technology.
Welch, L.V., Kerekes, R.J., 1994, Characterization of the PFI mill by the C-factor, APPITA,
47(5):387-390.
Xu, X., Liu, F., Jiang, L., Zhu, J.Y., Haagenson, D., Wiesenborn, D.P., 2013, Cellulose
Nanocrystals vs. Cellulose Nanofibrils: A Comparative Study on Their Microstructures and
Effects as Polymer Reinforcing Agents, Appl. Mater. Interfaces, 5:2999-3009.
Yan, H., Lindstrom, T., Christiernin, M., 2006, Some ways to decrease fibre suspension
flocculation and improve sheet formation, Nordic Pulp & Paper Research Journal, 21(1):36-43.
Yano, H., Nakahara, S., 2004, Bio-composites produced from plant microfiber bundles with a
nanometer unit web-like network, Journal of Materials Science, 39:1635-1638.
Zhang, J., Song, H., Lin, L., Zhuang, J., Pang, C., 2012, Microfibrillated cellulose from bamboo
pulp and its properties, Biomass and Bioenergy, 39:78-83.
Zhu, J.Y., Sabo, R., Luo, X., 2011, Integrated production of nano-fibrillated cellulose and
cellulosic biofuel (ethanol) by enzymatic fractionation of wood fibers, Green Chem., 13:1339-
1344.
Zimmermann, T., Bordeanu, N., Strub, E., 2010, Properties of nanofibrillated cellulose from
different raw materials and its reinforcement potential, Carbohydrate polymers, 79:1086-1093.
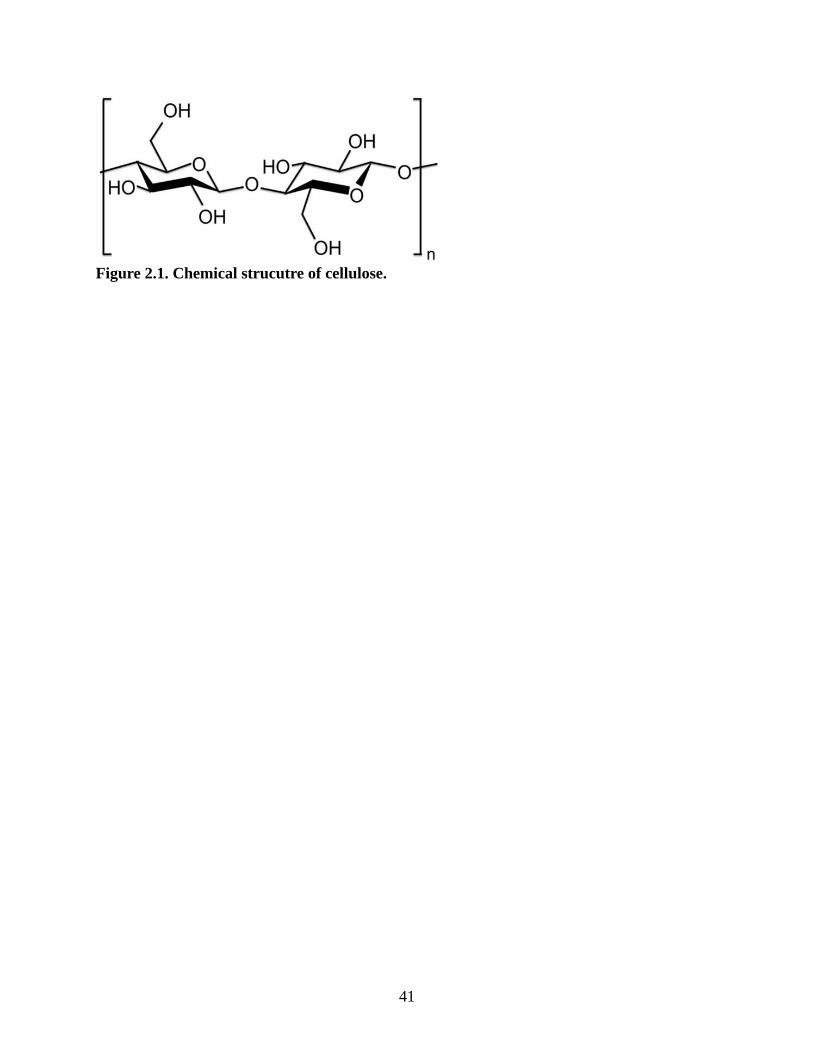
41
Figure 2.1. Chemical strucutre of cellulose.

42
Figure 2.2. Schematic structure of (a) cotton fiber and (b) wood fiber: C=cuticle layer, L=lumen, ML=middle lamella, P=primary cell wall layer, R=reversing point, S1=secondary cell wall layer 1, S2=secondary cell wall layer 2, T=tertiary cell wall, W=wart layer (Klemm et al. 2005).

43
Figure 2.3. Cellulose fibrils surrounded by hemicellulose and lignin (Doherty et al. 2011).
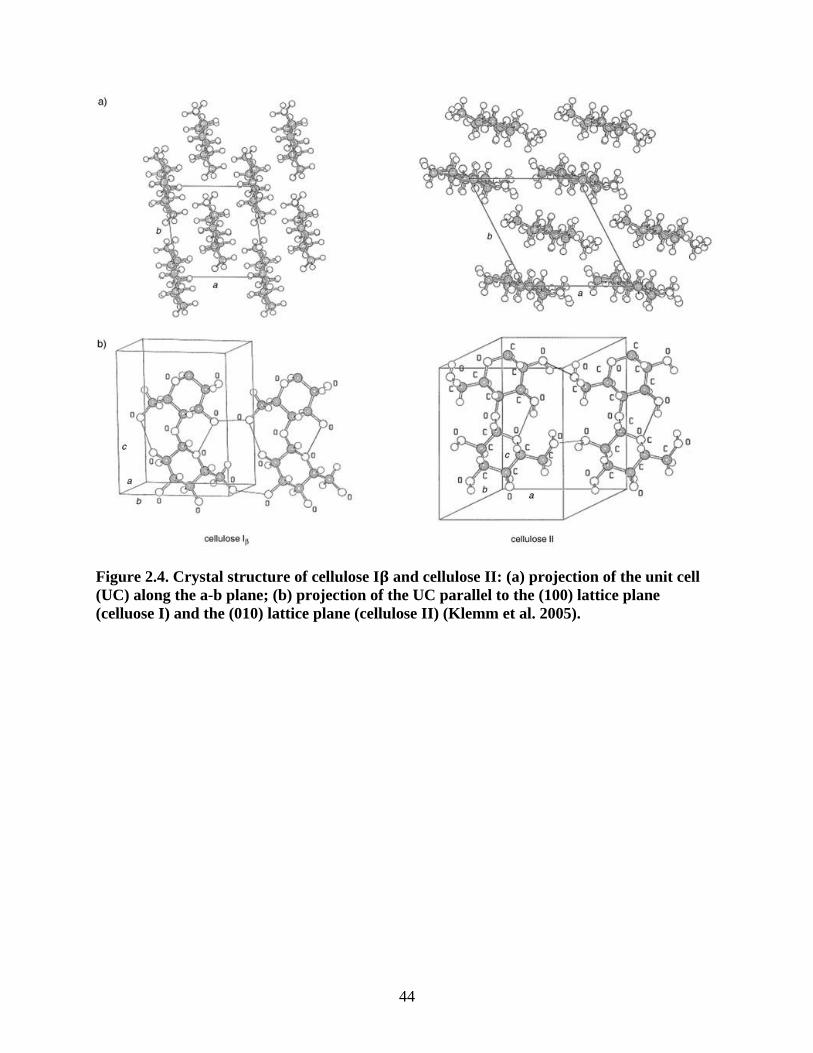
44
Figure 2.4. Crystal structure of cellulose I𝛃 and cellulose II: (a) projection of the unit cell (UC) along the a-b plane; (b) projection of the UC parallel to the (100) lattice plane (celluose I) and the (010) lattice plane (cellulose II) (Klemm et al. 2005).
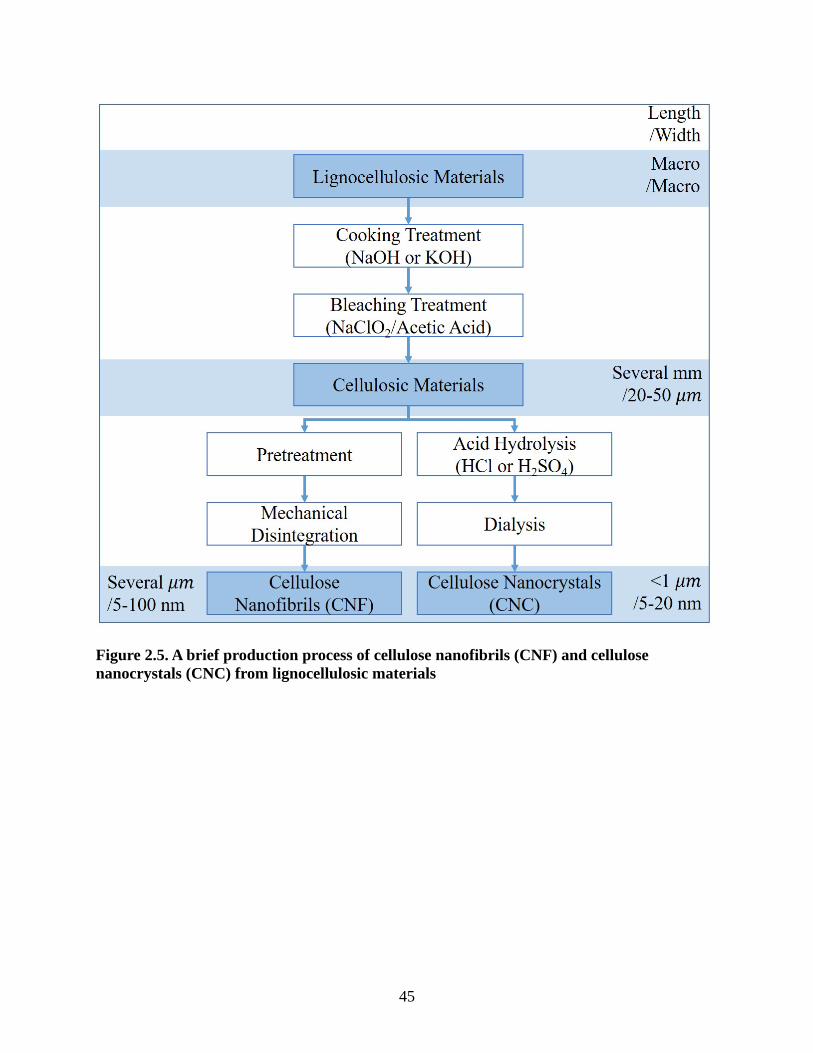
45
Figure 2.5. A brief production process of cellulose nanofibrils (CNF) and cellulose nanocrystals (CNC) from lignocellulosic materials

46
Figure 2.6. Description of homogenizer systems (Missoum et al. 2013).
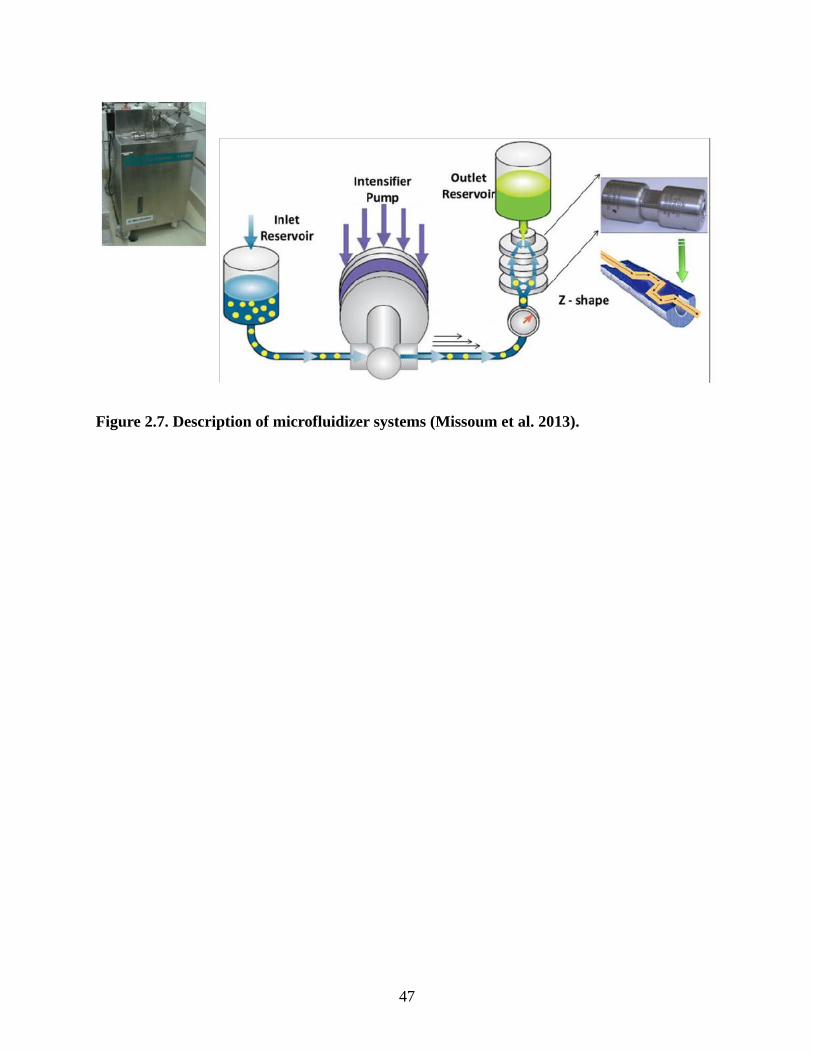
47
Figure 2.7. Description of microfluidizer systems (Missoum et al. 2013).

48
Figure 2.8. French pressure cell press.

49
Figure 2.9. PFI Mill (KRK Kumagai) and Valley beater (Testing Machines, Inc.).

50
Figure 2.10. TEMPO-mediated oxidation of cellulose at pH 10-11 (Isogai et al. 2011).

51
Figure 2.11. Carboxymethylation of cellulose (Tingaut et al. 2011).
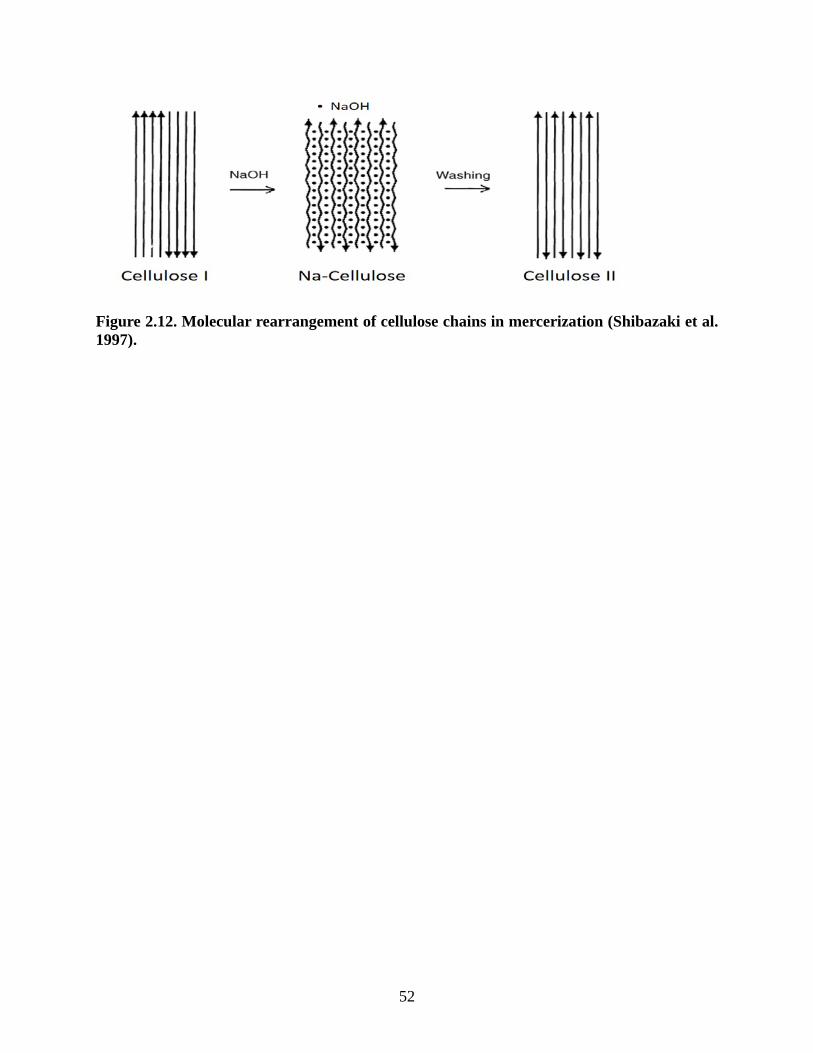
52
Figure 2.12. Molecular rearrangement of cellulose chains in mercerization (Shibazaki et al. 1997).

53
Figure 2.13. Schematic conversion of cellulose I (a) into cellulose II (b) in a ramie fiber. In (b) the dark dots correspond to chain ends of “up” polarity whereas the white dots correspond to chain end of “down” polarity (Kim et al. 2006).
54
CHAPTER 3
MECHANICAL PRETREATMENT OF FLUFF PULP TO PRODUCE CELLULOSE
NANOFIBRILS (CNF) PRECURSORS
Lee, Hansol and Mani, Sudhagar
To be submitted to the Journal of Industrial Crops and Products

55
Abstract
Cellulose nanofibrils (CNF) is commonly produced by mechanical pretreatment using
wet milling methods to facilitate easy disintegration of cellulose fibers by pre-fibrillation and
fiber size reduction. However, the use of high energy and water during wet milling methods
leads to the increase in overall energy consumption during CNF production and poses challenges
during storage and handling. The objectives of this study were to determine the specific energy
required for shear cutting of fluff pulp as CNF precursors and to determine the characteristics of
the precursors for manufacturing CNF. Specific energy required for shear cutting of fluff
cellulose pulp for up to three cycles with a screen size of 0.25 mm was measured. The ground
sample received after each cycle was sampled to characterize its properties and its potential to
produce CNF hydrogels. As the number of grinding cycle increased, the specific energy required
per cycle decreased. The first grinding cycle consumed the highest specific energy of 630
kWh/ton, followed by 186 kWh/ton for the second cycle and 78 kWh/ton for the third cycle.
Among three cycles, the third cycle cellulose powder was successfully disintegrated into
cellulose nanofibrils with an average diameter of 119 nm without any clogging. In conclusion,
the three-cycle shear cutting cellulose powder was sufficient to produce CNF, while reducing the
overall energy consumption during CNF production.
Keywords: Shear cutting mill, Cellulose nanofibrils, Mechanical pretreatment, Cellulose, Fluff
pulp, Specific grinding energy.
56
Introduction 1.
Cellulose nanofibrils (CNF) is one type of nano-structured cellulose. It typically has a width
of below 100 nm and a length of several micrometers. CNF exhibits a number of desirable
properties, such as high specific surface area (at least ten times larger than that of raw cellulose
fibers), extensive hydrogen-bonding ability, and high tensile strength up to 310 MPa (Abe and
Yano, 2009; Fukuzumi et al., 2009; Saito et al. 2009; Yano and Nakahara, 2004). Due to these
properties, CNF shows a wide range of applications, such as paper and pulp, biomedical,
electronic, automotive, and food applications (Lavoine et al., 2012). To produce cellulose
nanofibrils, cellulose fibers are subjected to the mechanical disintegration process where high
impact and shear forces are applied. Conventional disintegration methods include high pressure
homogenizers, microfluidizers and microgrinders. However, this process has two main
challenges; 1) high energy consumption, and 2) clogging problems in a homogenizer.
To address these problems, cellulose fibers are mechanically treated prior to the
disintegration process. The mechanical pretreatment process pre-fibrillates cellulose fibers,
reduces cellulose fiber size and produces fines (particles that will pass a round hole 76 μm or a
nominally 200 mesh screen). Therefore, it makes the disintegration process an easier task,
potentially reducing the energy use and clogging issues. Alternatives for mechanical
pretreatment include manual cutting, disk refiners, PFI mills, Valley beaters, and blenders
(Chakraborty et al., 2005; Dinand et al., 1999; Dufresne et al., 2000; Fukuzumi et al., 2009;
Herrick et al., 1983; Iwamoto et al., 2005; Malainine et al., 2005; Spence et al., 2011; Stelte and
Sanadi, 2009; Turbak et al., 1983; Zhang et al., 2012). The PFI mill and the Valley beater are
commonly used for producing cellulose precursors of cellulose nanofibrils in the laboratory
scale. These methods require energy input, leading to the increase in total manufacturing cost for
57
cellulose nanofibrils. It was reported that a Valley beater needed the effective and total energy of
approximately 500 kWh/ton and 3,000 kWh/ton, respectively, for beating bleached eucalyptus
and pine pulp for one hour (Atic et al., 2005). Spence et al. (2011) described that the required
energy for beating pulp in the Valley beater was 2,000 kWh/ton when a total refining time was
three hours. In case of the PFI mill, Welch and Kerekes (1994) estimated the refining energy for
PFI milling as 0.18 kWh/ton-rev. If the pulps are refined in a PFI mill for 20,000 revolutions
prior to the mechanical disintegration process as described by Sharma et al. (2015), the PFI mill
would consume approximately 3,600 kWh/ton. Moreover, theses mechanical pretreatment
processes are performed with water at low pulp consistency. The initial pulp consistency for
refining in a PFI mill is 10%. 300 g of cellulose slurry containing 30g of cellulose (dry basis) is
loaded per run (TAPPI T 248 sp-00). Valley beating is carried out at pulp consistency of 1.57%,
having 360g of cellulose (on dry basis) in 23 L (TAPPI T 200 sp-01). The cellulose precursors
produced from a PFI mill and a Valley beater are wet, which makes difficulties during storage
and handling due to the bulk volume and contamination issues.
A shear cutting mill known as a knife mill has been widely used to grind food and feed. It
also has been used for size reduction of biomass. The shear cutting mill could be used to produce
cellulose powders, which is can be used as cellulose precursors for cellulose nanofibrils. Energy
requirement for pretreating pulps in a shear cutting mill might be lower than that from a Valley
beater or a PFI mill. It has been reported that the effective energy for grinding biomass in a shear
cutting mill ranged from several tens kWh/ton to 200 kWh/ton although none of studies has
tested the shear cutting mill either on cellulose pulp or for fine grinding (Bitra et al., 2009;
Cadoche and López, 1989; Miao et al., 2011). In addition, the shear cutting process is a dry
processing, thus the cellulose precursors from the shear cutting mill would be easier to handle

58
and maintain their quality during storage. Consequently, the shear cutting mill can be an
alternative mechanical pretreatment method to produce CNF precursors in the form of dry
powder, while reducing overall manufacturing energy use.
The main objective of this study is to determine the specific energy consumption and
physical characterization of cellulose precursors to produce CNF using a mechanical
pretreatment technique (shear cutting method). The investigated physical properties include
morphology, moisture content, geometric mean diameter, particle size distribution, bulk and
tapped densities, and crystallinity. This study also aims to explore the production of cellulose
nanofibrils from cellulose powder obtained by shear cutting process and characterize the
resultant CNF.
Materials and Method 2.
2.1. Material and shear cutting process
Fluff cellulose pulp (dissolving pulp) was obtained from the commercial paper mill in
Georgia, USA. It was oven-dried overnight before grinding. A known quantity of the dried fluff
pulp was taken and ground one to three times through a laboratory heavy-duty knife mill (Retsch
SM 2000, Germany, Figure 3.1.) with a 0.25 mm screen. The knife mill consisted of a cutting
blade rotor (1690 rpm, 60 Hz) which was powered by a 1.5 kW electric motor. The sample was
continually fed without exceeding the maximum capacity of the knife mill.
2.2. Shear cutting energy consumption study
To calculate energy requirement for shear cutting of fluff pulp, a multi-function transducer
(CR Manetics Inc., MO) was assembled with a computer’s data logger and connected to the
shear cutting mill (the knife mill) to measure instantaneous power as shown in Figure 3.2. The
power data was recorded every 2 seconds. The power required to run the shear cutting mill

59
empty was measured before the material was fed into the mill in order to determine the net
power required to grind the material. Total specific energy consumption for grinding was
determined by integrating the area under the instantaneous power consumption curve over
grinding duration, and effective specific energy was calculated by subtracting the power
consumption under no-load condition from total specific energy (Mani et al., 2004). Each test
was repeated three times.
2.3. Characterization of knife-milled powders
2.3.1. Morphology
The morphology of raw fluff pulp and knife-milled powders was determined using an
optical microscope (DMI 3000B, Leica). Fluff pulp and knife-milled powder were observed at 5
times and 20 times magnification, respectively. The images presented were regarded to be
representative of the fiber surfaces of fluff pulp and knife-milled powder. To determine the
change in the morphology by shear cutting, the widths and lengths of fluff pulp and knife-milled
powder were measured (widths were measured at the thickest point). In case of fluff pulp, 30
measurements were made to obtain an average value. For the knife-milled powders, the powders
were divided into three groups by sieving; smaller than 45 μm, 45-100 μm and larger than 100
μm. 30 measurements were made for each group, and the weight averaged width and length were
calculated as follows:
Weight averaged width (μm) = (W1×Wt1 + W2×Wt2 + W3×Wt3)/30 (1)
Weight averaged length (μm) = (L1×Wt1 + L2×Wt2 + L3×Wt3)/30 (2)
where W1, W2 and W3 are the sum of widths of knife-milled powder from each group, and L1, L2
and L3 are the sum of lengths of knife-milled powder from each group. Wt1, Wt2, and Wt3 are the
60
weight percent of knife-milled powder smaller than 45 μm, in size of 45-100 μm and larger than
100 μm, respectively.
Average aspect ratio was calculated as:
Average aspect ratio = Weight averaged length/Weight averaged width (3)
2.3.2. Size distribution
A sample of 15 g cellulose powder was placed in a set of sieves. The sieve sizes used
were 250, 200, 160, 125, 100, 63, and 45 μm. Since the powder was very light and fluffy, two
glass beads (diameter: 1.5 cm) were placed on each sieve to make sure that the sieving was
complete. The set of sieves was placed on the analytical sieve shaker (Retsch AS 2000,
Germany), and sieving was performed for 15 minutes. After sieving, the mass of powder
remained on each sieve was measured and recorded as a percentage of the original sample mass.
Each test was repeated three times. The geometric mean diameter and geometric standard
deviation were calculated according to standard ANSI/ASAE-S319.4.
2.3.3. Determination of fines percentage
15 g of raw fluff pulp and knife-milled powders were placed in a sieve of 76 μm. For
fluff pulp, ten glass beads were placed on the sieve to facilitate sieving; otherwise, two glass
beads were placed on the sieve. Sieving was performed for 15 minutes. After sieving, the mass
of powder remained on the sieve was measured to calculate the fines percentage. Each test was
repeated three times.
2.3.4. Moisture content
The moisture contents of fluff pulp and knife-milled powders were determined by oven
drying and reported in wet basis (equation 4). 10g of the sample was placed on a weight dish and

61
dried in an oven at 105 ℃ until the weight becomes constant (ASTM D4442-15). Each test was
repeated three times.
Moisture content (%) = (wo – wd)/wo × 100 (4)
where wo and wd are the weight of original and dried sample, respectively.
2.3.5. Bulk density and tapped density
Bulk and tapped densities of knife-milled powders were measured. A known amount (m)
of the sample was gently poured into a dry graduated cylinder of 250 ml (readable to 2 ml)
without compacting. The volume of sample (Vo) was measured, and the bulk density was
determined as:
Bulk density (kg/m3) = m/Vo (5)
The cylinder with knife-milled powder was tapped 300±10 times on a wooden platform. The
final tapped volume (Vt) was measured, and tapped density was determined as:
Tapped density (kg/m3) = m/Vt (6)
2.3.6. X-ray diffraction analysis (XRD)
The X-ray diffraction analysis was performed to determine the effect of shear cutting on
the cellulose crystal structure and crystallinity. One gram of the sample was prepared for XRD in
the form of a film. XRD was carried out with the scanning region from 10° to 35° at scan rate of
1°/min, and crystallinity degree (CrD) was calculated using the Segal method as follows:
CrD (%) = (I200 – Iam)/I200 × 100 (7)
where I200 and Iam are the intensity value for the crystalline cellulose (2θ= 22.5°) and the
amorphous cellulose (2θ= 18.5°), respectively.
62
2.4. Cellulose nanofibrils preparation
Cellulose nanofibrils was prepared using a French pressure cell press. 2wt% cellulose
aqueous suspension was prepared by mixing 0.7 g of knife-milled cellulose powder and 35 ml of
hot water containing carboxymethylcellulose (CMC, 0.6 wt.%, average molecular weight
~250kD). The suspension was loaded and passed through the French press 15 times at the
operating pressure of 1,000-1,200 bar.
2.5. Characterization of cellulose nanofibrils
The properties of cellulose nanofibrils obtained through a French cell press were
investigated, such as morphology, light transmittance and suspension stability. Commercially
available cellulose nanofibrils from the University of Maine was used as a standard for all the
properties.
2.5.1. Morphology of cellulose nanofibrils
2.5.1.1. Optical microscopy
The obtained cellulose nanofibrils was observed using an optical microscope (DMI
3000B, Leica) at 20 times magnification as described in section 2.3.1. A drop of cellulose
nanofibrils suspension was placed on a glass side covered with a coverslip. The images presented
were considered to be representative of the fiber surfaces of cellulose nanofibrils
2.5.1.2. Field-emission scanning electron microscopy (FE-SEM)
The obtained CNF and standard CNF were observed using a scanning electron
microscopy (FEI Inspect F FEG-SEM). The CNF gel was diluted to 0.1wt%. A drop of the
diluted suspension was deposited on a silicon wafer and dried for 24 hours at room temperature.
The samples were coated with a thin gold-palladium layer applied by ion sputtering with a
thickness limited to 5 nm. To prevent damage on the samples, the relatively low acceleration

63
voltage was used at 4-5 kV. The fiber width was measured with 80 measurements to get an
average value. The images presented were considered to be representative of the fiber surfaces of
cellulose nanofibrils
2.5.2. Specific surface area study
Specific surface area (SSA) was measured using the Congo red adsorption method
(Ougiya et al. 1998; Goodrich and Winter 2007; and Spence et al. 2010b). SSA measurement
was made with the third cycle cellulose powder, cellulose nanofibrils prepared from the French
cell press, and the standard CNF. Samples were placed into a 0.1 M phosphate butter at pH 6 and
treated with various concentrations of Congo red at a final solid content of 0.5%. The samples
were incubated at 60 ℃ for 24 h. A small amount of NaCl (10wt% of cellulose weight on dry
basis) was added to the samples at the beginning of the experiment in order to neutralize charged
surface sites. After 24 hours, the samples were centrifuged at 12,000 rpm (14,000 rcf) for 5 min
and 15 min for cellulose powder and the CNF samples, respectively. The supernatant was put
into a quartz cuvette, and its absorbance was measured at 500 nm using an ultraviolet (UV)-
visible spectrometer (Genesys 10S, Thermo Fisher Scientific). All runs were duplicated with the
reported values being the averages. The maximum amount of Congo red absorbed was calculated
from the equation (8) derived from Langmuir’s absorption theory.
[E]/[A] = 1/Kad[A]max + [E]/[A]max (8)
where [E] is the solution concentration of Congo red at adsorption equilibrium in mg/ml, [A] is
the amount of Congo red adsorbed onto the cellulose surface in mg/g, [A]max is the maximum
amount of Congo red adsorbed onto the cellulose surface in mg/g, and Kad is the equilibrium
constant. The specific surface area was determined as follows:
SSA =([A]max × N × SA)/(Mw × 1021) (9)
64
where N is Avogadro’s constant, SA is the surface area occupied by a single dye molecule (1.73
nm2), and Mw is the molecular weight of Congo red (696 g/mole)
2.5.3. Visual examination
The stability of cellulose nanofibrils suspensions was investigated through visual
examination as described by other authors (Besbes et al., 2011; Chen et al., 2011), but at a lower
solid content. The cellulose nanofibrils gel was diluted with deionized water to 0.1 wt.% solid
content. The samples were placed motionlessly for 90 minutes, and the photos were taken at 0,
10 and 90 minutes.
2.6. Statistical analysis
Statistical analyses were performed using a scientific software (SAS, University Edition).
The effects of grinding amount on grinding energy and rate, and the physical properties of
cellulose powders (fines percentage, bulk density and tapped density) were evaluated using one-
way ANOVA. Multiple comparisons were also conducted using Tukey method. All differences
were considered significant at p<0.05. Detailed results are provided in Appendix A.
Results and discussion 3.
3.1. Energy consumption for shear cutting process
Specific energy consumption for grinding fluff pulp in a shear cutting mill is given in
Table 3.1. A required energy for shear cutting per cycle was reduced as the number of grinding
cycles increased. Effective specific energy for the first, second and third cycles were 630.40,
186.29 and 77.51 kWh/ton, respectively. The total effective energy for shear cutting process with
three cycles was estimated to be 894.20 kWh/ton. One-way ANOVA test also showed that the
specific energy depended on the grinding cycle (p <0.0001), but the multiple comparisons by

65
Turkey test indicated that the specific energy required for the second and third cycles was not
significantly different (p=0.1464).
The shear cutting mill required 100-200 W of power to be run without sample loaded.
When the energy required to run the shear cutting mill empty was included, the total energy for
three-cycle shear cutting process was increased to 1,458.54 kWh/ton, which could be lower than
the required energy for conventional mechanical pretreatment processes. For instance, Atic et al.
(2005) reported that refining bleached pine fibers in a Valley beater required a total beating
energy of 2,995 kWh/ton which included a net beating energy of 578 kWh/ton for a total refining
time of one hour. Spence et al. (2011) performed three-hour refining process using a Valley
beater prior to the mechanical disintegration process, and they reported that the required beating
energy was 2,000 kWh/ton. However, it is not clear whether this value included no-load power
or not. With respect to a PFI mill, Welch and Kerekes (1994) estimated the energy requirement
for pulp refining in the PFI mill as a function of revolutions (0.18 kWh/ton-rev.). If the pulp
fibers are refined in a PFI mill for 20,000 revolutions prior to the mechanical disintegration
process as described by Sharma et al. (2015), the required energy would be 3,600 kWh/ton based
on the estimation by Welch and Kerekes. The mechanical pretreatment process with the PFI mill
could be performed at very high revolutions. As an example, Chakraborty et al. (2005) refined
bleached kraft pulp in a PFI mill at 125,000 revolutions to produce submicron sized cellulose
precursors before the mechanical disintegration process. The energy consumption for this PFI
milling process was estimated to be 21,700 kWh/ton (Chakraborty et al., 2007). Consequently,
three-cycle shear cutting of fluff pulp has a potential to reduce energy consumption for the
mechanical pretreatment process up to 15 folds.

66
Besides, grinding rate was measured for every cycle of shear cutting process. It increased
with increasing grinding cycle from 7.42 to 34.73 g/min. One-way ANOVA results also showed
that there was a significant difference in the grinding rate across the number of the grinding
cycles (p = 0.0003). This increase in grinding rate indicates that the finer particles were obtained
with the increased grinding amount since fine particles can pass through the screen more easily
than coarse particles.
3.2. Morphology of cellulose precursor/powders
Fluff pulp consisting of long cellulose fibers was ground into powders by passing through
a shear cutting mill as shown in Figure 3.3. The number of grinding cycle did not affect visual
appearance of knife-milled powders. Optical microscopic images also show that during the first
grinding cycle, the major morphological change occurred; whereas, during the second and third
cycles, there was no significant change in morphology of knife-milled powders (Figure 3.4).
With respect to pulp dimensions, fluff pulp had an average length and width of 3.63 mm
and 41.69 𝜇m, respectively, and its average aspect ratio was calculated at 88.76. After the first
grinding cycle, the average length and width of cellulose fibers greatly decreased from 3.63 mm
to 302.67 𝜇m and from 41.69 𝜇m to 32.12 𝜇m, respectively. There was no further noticeable
decrease in the fiber width after the second and third cycles. The average width was 30.44 𝜇m
and 31.73 𝜇m for two-cycle and three-cycle knife-milled pulp, respectively. In contrast, the
average length continuously decreased with increasing grinding cycles. Two-cycle and three-
cycle knife-milled powders had an average length of 290.71 𝜇m and 271.78 𝜇m, respectively.
This indicates that the major size reduction was achieved during the first grinding cycle as
described earlier. In addition, the gradual decrease in length, but not in width suggests that
cellulose pulp was cut in longitudinal as well as transverse directions at the beginning of

67
grinding; afterward, pulp milling was performed mainly in a transverse direction. This change in
the fiber length is a distinct feature of shear cutting. The typical mechanical refining processes do
not have a significant effect on fiber shortening. For instance, fiber length was slightly reduced
from 1.2 mm to 1 mm after pulp refining in a PFI mill at 10,000 revolutions (Jones et al., 2013).
Other authors also reported that the refining in a PFI mill did not make an apparent reduction in
fiber length (Marrakchi et al., 2011; Zhang et al., 2004). Regarding refining in a Valley beater,
the effect on fiber shortening has not been confirmed. Zeng et al. (2012) refined bleached kraft
softwood pulp in a Valley beater for one hour, and the average fiber length was almost same
before and after the refining process; from 2.05 mm to 2.01 mm. However, Jones et al. (2013)
demonstrated that the average length of hardwood pulp gradually decreased to 0.4-0.5 mm from
1.2 mm as the refining process continued up to 90 minutes. In addition, Spence (2011) described
that fiber length was dramatically reduced after three-hour refining in a Valley beater, but the
exact fiber length was not reported. Consequently, the shear cutting process tends to reduce the
fiber length more efficiently than the refining process in a PFI mill or a Valley beater, and
cellulose fibers with decreased length can be easily delaminated into cellulose nanofibrils,
preventing plugging in a homogenizer.
3.3. Physical properties of cellulose precursors/powders
We investigated size distribution of knife-milled powders to evaluate the effect of grinding
amount on fiber size. First of all, a geometric mean diameter decreased with increasing grinding
amount. The geometric mean diameter for one-cycle and two-cycle knife-milled powders were
91.97 𝜇m and 87.10 𝜇m, respectively, and the geometric mean diameter was further reduced to
70.33 𝜇m after the third cycle. Figure 3.5. shows a particle size distribution of the powders. The
graphs of size distribution moved left with increasing grinding cycle, indicating the obtained

68
powder had smaller dimensions as the shear cutting proceeded. Besides, 2.7% of the first cycle
powder was larger than 250 𝜇m, which could impede the production of cellulose nanofibrils
although the grinding process was performed with a screen size of 250 𝜇m. This may be because
raw fluff pulp had knots, and the shear cutting process with one cycle was not sufficient to
remove the knots. It is likely that three-cycle shear cutting process removed almost all knots as
only 0.4% of the third cycle powder remained on the 250 𝜇m sieve.
In addition, the shear cutting process produced more fines with increasing grinding
amount. The fines percent for fluff pulp was 5.06% and dramatically increased to 25.84% for
one-cycle knife-milled powder. The fraction of fines gradually increased to 33.96%, and 37.22%
for two-cycle, and three-cycle knife-milled powder, respectively. One-way ANOVA test also
supported that the fines percent depended on the number of the grinding cycles with a p-value of
less than 0.0001. However, the Tukey test result indicated that there was no statistical
significance in fines percentages between the second and third cycles. Fines in the pulps
facilitate fiber disintegration because exposed cross-sections in fines are more accessible to
process (Herrick et al., 1983; Spence et al., 2010a).
Bulk and tapped densities of grinds were also measured. Both densities increased with
increasing grinding cycles. Three-cycle knife-milled powder had the highest bulk and tapped
densities of 111.59kg m-3 and 202.63 kg m-3 followed by two-cycle knife-milled powder (96.79
kg m-3 and 175.72 kg m-3) and one-cycle knife-milled powder (93.48 kg m-3 and 168.17 kg m-3),
One-way ANOVA test for both bulk and tapped densities also showed that bulk and tapped
densities of knife-milled powders were dependent on the grinding amount (p < 0.0001). Such
increase in bulk and tapped densities suggests that the particle size was reduced with increasing
grinding amount. As particle size decreased, the pore spaces between particles decreased,

69
resulting in the increase in bulk and tapped density. This was also confirmed by Mani et al.
(2004).
The shear cutting process did not affect other pulp properties, such as moisture content and
crystallinity. Fluff pulp and knife-milled powders had a moisture content of approximately 6.9
wb%. With respect to the effects on cellulose crystal structure, the shear cutting process did not
change cellulose crystal structure. All samples had the crystallinity in range of 73-75% and
showed similar X-ray diffraction patterns with three peaks at 2θ angles of approximately 14.6°
(11�0), 16.5° (110) and 22.5° (200), which were characteristic of cellulose I structure (Figure 3.6).
3.4. Effect of shear cutting on CNF production
Finally, we investigated the effect of grinding amount on the production of cellulose
nanofibrils. The increase in the grinding cycle tended to enhance the ease of cellulose fibrillation.
In case of one- or two-cycle knife-milled powders, it is likely that some of the powders would
remain inside the French press, leading to clogging the equipment because of their large size. In
contrast, knife-milled powder prepared with three cycles was small enough to produce cellulose
nanofibrils by passing through a French press 15 times without clogging. As shown in Figure
3.7, the obtained cellulose nanofibrils looked like a gel as standard CNF did. The fibrillated
samples with 10 and 15 passes through the French press were observed using an optical
microscope. The sample obtained with 10 passes was not well-fibrillated, consisting of large
fibers. After additional 5 passes, the well-fibrillated cellulose was prepared as shown in Figure
3.8. Figure 3.9 shows a scanning electron microscopic image of the fibrillated cellulose with 15
passes through the French press and standard cellulose nanofibrils. Both samples consisted of
well-delaminated fibers at the nano scale. Figure 3.10 presents the distribution of the fiber width
of these two samples. In case of the CNF obtained through the French press, 67% of the cellulose

70
fibers had a width of below 100 nm. The average width was calculated to be 118.7 nm with a
standard deviation of 113.5 nm. Such large standard deviation is because the fibers with a width
of 500-700 nm existed although only 11% of the fibers had a width of larger than 200 nm. In
case of standard CNF, 49% of the cellulose fibers had a width of below 100 nm, whereas 15% of
the fibers had a width of larger than 200 nm. As a result, its average width was larger than that of
CNF obtained from the French press; 134 nm with a standard deviation of 80.4 nm.
In addition, the specific surface area of the third cycle cellulose powder, CNF obtained
through the French press and standard CNF was measured since it is an indirect indicator of the
fibrillation degree. When cellulose fibers are delaminated into nano-scale fibers, the specific
surface area will be increased due to the change in external surface and internal pore structures of
the fibers (Spence et al., 2010b). As expected, the three-cycle knife-milled powder had a specific
surface area of 123 m2g-1, while two CNF samples had a much larger specific surface area. The
cellulose nanofibrils obtained in this study had a specific surface area of 269 m2g-1, which is
larger than that of the standard CNF (211 m2g-1). This suggests that the obtained CNF have a
comparable fibrillation degree to standard CNF.
The stability of the 0.1wt% aqueous suspensions of the fibrillated cellulose was investigated
by visual examination (Figure 3.11). The fibrillated cellulose prepared with 15 times through a
French press did not present sedimentation within 10 minutes. After 90 minutes of standing, a
small portion of the sample settled down to the bottom of the glass bottle, and most of the sample
was still dispersed in water. This suggests that this sample contained nano-scale cellulose fibers,
which can be dispersed in water for a long time. This is consistent with the results of SEM
images. In case of standard cellulose nanofibrils (sample b), the sample started to settle down
within 10 minutes after standing. Sedimentation further proceeded and two layers were clearly
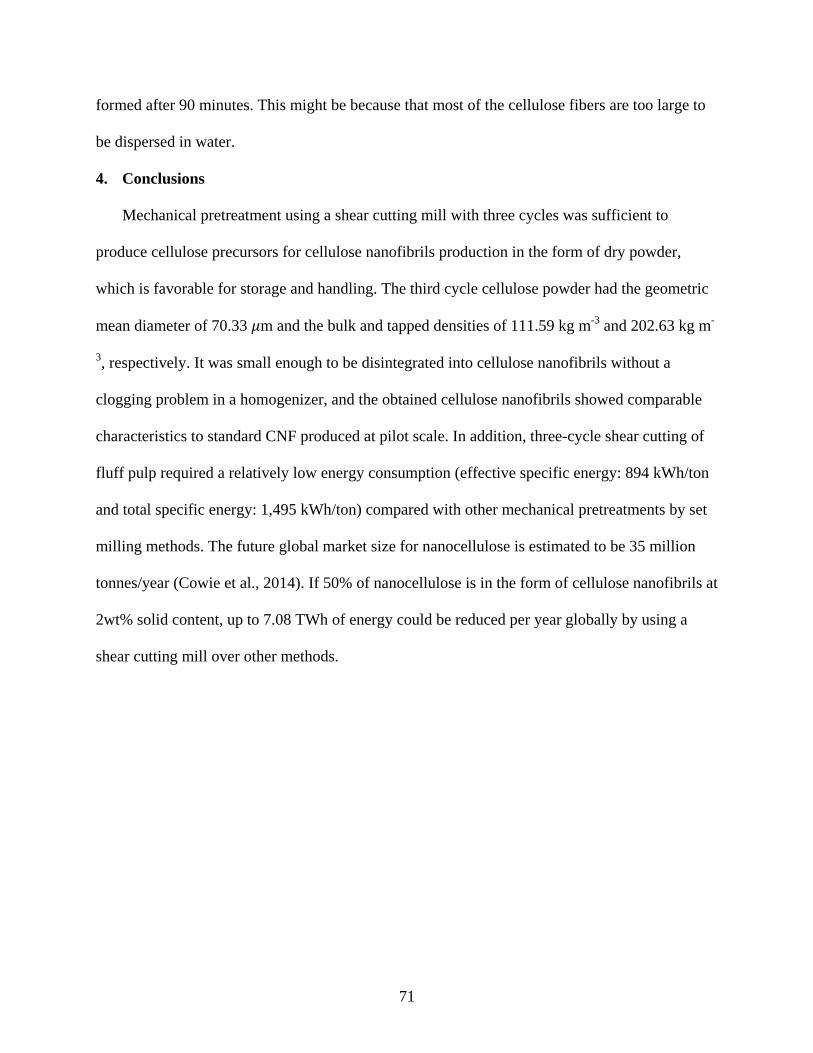
71
formed after 90 minutes. This might be because that most of the cellulose fibers are too large to
be dispersed in water.
Conclusions 4.
Mechanical pretreatment using a shear cutting mill with three cycles was sufficient to
produce cellulose precursors for cellulose nanofibrils production in the form of dry powder,
which is favorable for storage and handling. The third cycle cellulose powder had the geometric
mean diameter of 70.33 𝜇m and the bulk and tapped densities of 111.59 kg m-3 and 202.63 kg m-
3, respectively. It was small enough to be disintegrated into cellulose nanofibrils without a
clogging problem in a homogenizer, and the obtained cellulose nanofibrils showed comparable
characteristics to standard CNF produced at pilot scale. In addition, three-cycle shear cutting of
fluff pulp required a relatively low energy consumption (effective specific energy: 894 kWh/ton
and total specific energy: 1,495 kWh/ton) compared with other mechanical pretreatments by set
milling methods. The future global market size for nanocellulose is estimated to be 35 million
tonnes/year (Cowie et al., 2014). If 50% of nanocellulose is in the form of cellulose nanofibrils at
2wt% solid content, up to 7.08 TWh of energy could be reduced per year globally by using a
shear cutting mill over other methods.

72
References
Abe, K., Yano, H., 2009, Comparison of the characteristics of cellulose microfibril aggregates of
wood, rice straw and potato tuber, Cellulose, 16:1017–1023.
ASABE, 2008, ANSI/ASAE- S319.4, Method of Determining and Expressing Fineness of Feed
Materials by Sieving, American Society of Agricultural and Biological Engineers, Joseph, MI.
ASTM. 2015, ASTM-D4442-15, Standard Test Methods for Direct Moisture Content
Measurement of Wood and Wood-Based Materials, American Society for Testing and Materials,
West Conshohocken, PA.
Atic, C., Immamoglu, S., Valchev, I., 2005, Determination of specific beating energy-applied on
certain pulps in a valley beater, J. Univ. Chem. Technol. Met., 40(3):199–204.
Besbes, I., Alila, S., Boufi, S., 2011, Nanofibrillated cellulose from TEMPO-oxidized eucalyptus
fibers: Effects of the carboxyl content, Carbohydrate Polymers, 84:975-983.
Bitra, V.S.P., Womac, A.R., Igathinathane, C., Miu, P.I., Yang, Y.T., Smith, D.R., Chevanan, N.,
Sokhansanj, S., 2009, Direct measures of mechanical energy for knife mill size reduction of
switchgrass, wheat straw, and corn stover, Bioresource Technology, 100:6578–6585.
Cadoche, L., López, G.D., 1989, Assessment of size reduction as a preliminary step in the
production of ethanol for lignocellulosic wastes, Biological Wastes, 30:153–157.
Chakraborty, A., Sain, M., Kortschot, M., 2005, Cellulose microfibrils: A novel method of
preparation using high shear refining and cryocrushing, Holzforschung, 59:102-107.
Chakraborty, A., Sain, M.M., Kortschot, M.T., Ghosh, S.B., 2007, Modeling energy
consumption for the generation of microfibres from bleached kraft pulp fibres in a PFI mill,
BioResources, 2(2):210-222.

73
Chen, W., Yu, H., Liu, Y., Chen, P., Zhang M., Hai, Y., 2011, Individualization of cellulose
nanofibers from wood using high-intensity ultrasonication combined with chemical
pretreatments, Carbohydrate Polymers, 83:1804-1811.
Chevanan, N., Womac, A.R., Bitra, V.S.P., Igathinathane, C., Yang, Y.T., Miu, P.I., Sokhansanj,
S., 2010, Bulk density and compaction behavior of knife mill chopped switchgrass, wheat straw,
and corn stover, Bioresource Technology, 101:207-214.
Cowie, J., Bilek, E.M., Wegner, T.H., Shatkin, J.A., 2014, Market projections of cellulose
nanomaterial-enabled products – Part 2: Volume estimates, Tappi J., 13(6):57-69.
Dinand, E., Chanzy, H., Vignon, R.M., 1999, Suspensions of cellulose microfibrils from sugar
beet pulp, Food hydrocolloids, 13:275-283.
Dufresne, A., Dupeyre, D., Vignon, M.R., 2000, Cellulose Microfibrils from Potato Tuber Cells:
Processing and Characterization of Starch–Cellulose Microfibril Composites, Journal of Applied
Polymer Science, 76:2080-2092.
Fukuzumi, H., Saito, T., Iwata, T., Kumamoto, Y., Isogai, A., 2009, Transparent and High Gas
Barrier Films of Cellulose Nanofibers prepared by TEMPO-Mediated Oxidation,
Biomacromolecules, 10:162-165.
Goodrich, J.D., Winter, W.T., 2007, α-Chitin Nanocrystals Prepared from Shrimp Shells and
Their Specific Surface Area Measurement, Biomacromolecules, 8:252-257.
Herrick, F.W., Casebier, R.L., Hamilton, J.K., Sandberg, K.R., 1983, Microfibrillated cellulose:
Morphology and accessibility, J. Appl. Polym. Sci. Appl. Polym. Symp., 37: 797-813.
Iwamoto, S., Nakagaito, A.N., Yano, H., Nogi, M., 2005, Optically transparent composites
reinforced with plant fiber-based nanofibers, Appl. Phys. A, 81:1109-1112.

74
Jones, B.W., Venditti, R., Park, S., Jameel, H., Koo, B., 2013, Enhancement in enzymatic
hydrolysis by mechanical refining for pretreated hardwood lignocellulosics, Bioresource
Technology, 147:353-360.
Lavoine, N., Desloges, I., Dufresne, A., Bras, J., 2012, Microfibrillated cellulose - its barrier
properties and applications in cellulosic materials: a review, Carbohydr Polym., 90(2):735-64.
Malainine, M.E., Mahrouz, M., Dufresne, A., 2005, Thermoplastic nanocomposites based on
cellulose microfibrils from Opuntia ficus-indica parenchyma cell, Composites Sci. and Tech.,
65:1520-1526.
Mani, S., Tabil, L.G., Sokhansanj, S., 2004, Grinding performance and physical properties of
wheat and barley straws, corn stover and switchgrass, Biomass and Bioenergy, 27(4):339-352.
Marrakchi, Z., Khiari, R., Oueslati, H., Mauret, E., Mhenn, F., 2011, Pulping and papermaking
properties of Tunisian Alfa stems (Stipa tenacissima)—Effects of refining process, Industrial
Crops and Products, 34:1572-1582.
Miao, Z., Grift, T.E., Hansen, A.C., Ting, K.C., 2011, Energy requirement for comminution of
biomass in relation to particle physical properties, Industrial Crops and Products, 33(2), 504-513.
Ougiya, H., Hioki, N., Watanabe, K., Morinaga, Y., Yoshinaga, F., Samejima, M., 1998,
Relationship between the physical properties and surface area of cellulose derived from
adsorbates of various molecular sizes, Bioscience, Biotechnology, and Biochemistry.,
62(10):1880-1884.
Saito, T., Hirota, M., Tamura, N., Kimura, S., Fukuzumi, H., Heuz, L., Isogai, A., 2009,
Individualization of nano-sized plant cellulose fibrils by direct surface carboxylation suing
TEMPO catalyst under neutral conditions, Biomacromolecules, 7:1687-1691.

75
Spence, K.L., Benditti, R.A., Rojas, O.J., Habibi, Y., Pawlak, J.J., 2011, A comparative study of
energy consumption and physical properties of microfibrillated cellulose produced by different
processing methods, Cellulose, 18:1097-1111.
Spence, K.L., Benditti, R.A., Rojas, O.J., Habibi, Y., Pawlak, J.J., 2010a, The effect of chemical
composition on microfibrillar cellulose films from wood pulps: mechanical processing and
physical properties, Bioresource Tech., 101:5961-5968.
Spence, K.L., Venditti, R.A., Rojas, O.J., Habibi, Y., Pawlak, J.J., 2010b, The effect of chemical
composition on microfibrillar cellulose films from wood pulps: water interactions and physical
properties for packaging applications, Cellulose, 17:835-848.
Stelte, W., Sanadi, A.R., 2009, Preparation and characterization of cellulose nanofibers from two
commercial hardwood and softwood pulps, Ind. Eng. Chen. Res., 48:11211-11219.
TAPPI, 2000, T248 sp-00, Laboratory beating of pulp (PFI mill method). Technical Association
of the Pulp and Paper Industry, Norcross, GA.
TAPPI, 2001, T200 sp-01, Laboratory beating of pulp (Valley beater method). Technical
Association of the Pulp and Paper Industry, Norcross, GA.
Turbak, A.F., Snyder, F.W., Sandberg, K.R., 1983, Microfibrillated cellulose, a new cellulose
product: Properties, uses, and commercial potential., J. Appl. Polym. Sci. Appl. Polym. Symp.,
37:815-827.
Welch, L.V., Kerekes, R.J., 1994, Characterization of the PFI mill by the C-factor, APPITA,
47(5):387-390.
Xhanari, K., Syverud, K., Chinga-Carrasco, G., Paso, K., Stenius, P., 2011, Reduction of water
wettability of nanofibrillated cellulose by adsorption of cationic surfactants, Cellulose, 18:257-
270.

76
Yano, H., Nakahara, S., 2004, Bio-composites produced from plant microfiber bundles with a
nanometer unit web-like network, Journal of Materials Science, 39:1635-1638.
Zeng, X., Retulainen, E., Heinemann, S., Fu, S., 2012, Fibre deformations induced by different
mechanical treatments and their effect on zero-span strength, Nordic Pulp and Paper Research
Journal, 27(2):335-342.
Zhang, J., Song, H., Lin, L., Zhuang, J., Pang, C., 2012, Microfibrillated cellulose from bamboo
pulp and its properties, Biomass and Bioenergy, 39:78-83.
Zhang, M., Hubbe, M.A., Venditti, R.A., Heitmann, J.A., 2004, Refining to Overcome Effects of
Drying Unbleached Kraft Fibers in the Presence or Absence of Sugar, Progress in Paper
Recycling, 13(2):1-8.

77
Table 3.1. Grinding rate and effective specific energy of shear cutting process with the different number of cycles.
*a: Number enclosed in the parenthesis were standard deviations with n=3.
Grinding cycle
Grinding rate (g/min)a
Effective specific energy (kWh/metric tonne)a
Total specific energy (kWh/ metric tonne) a
1 7.42 (0.27) 630.40 (95.02) 1053.30 (35.33)
2 23.07 (6.09) 186.29 (42.17) 257.50 (61.47)
3 34.73 (0.97) 77.51 (4.90) 147.74 (11.86)
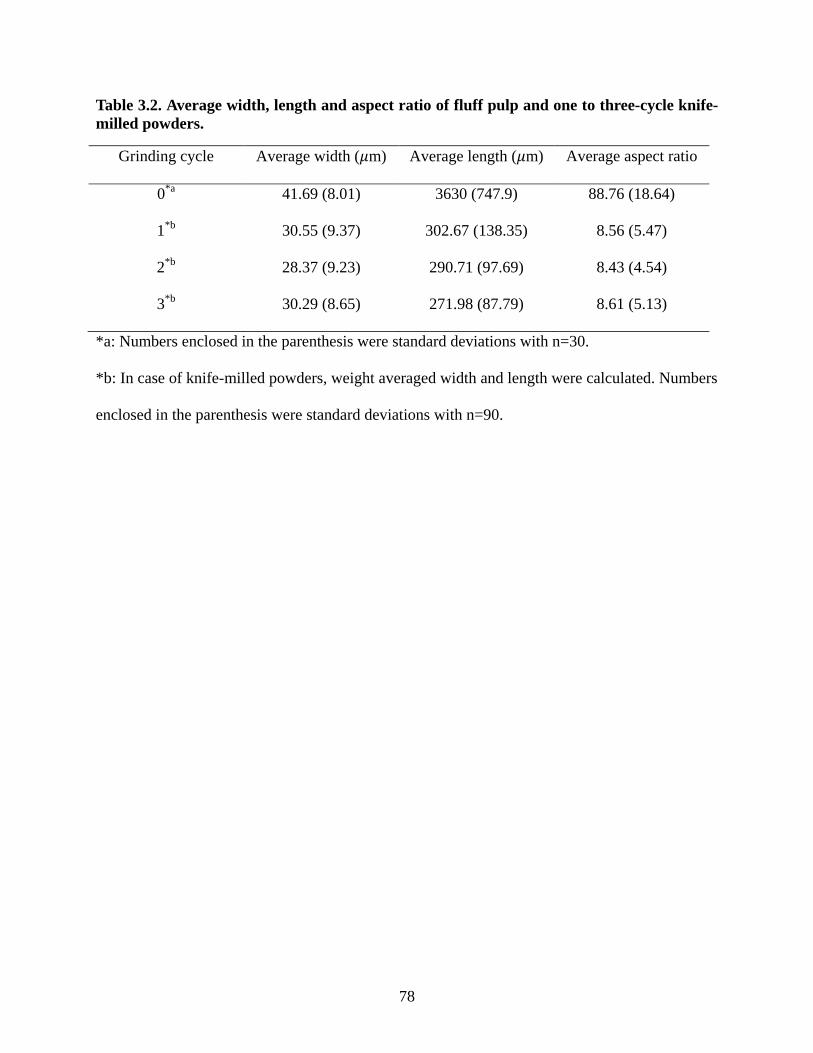
78
Table 3.2. Average width, length and aspect ratio of fluff pulp and one to three-cycle knife-milled powders.
*a: Numbers enclosed in the parenthesis were standard deviations with n=30.
*b: In case of knife-milled powders, weight averaged width and length were calculated. Numbers
enclosed in the parenthesis were standard deviations with n=90.
Grinding cycle Average width (𝜇m) Average length (𝜇m) Average aspect ratio
0*a 41.69 (8.01) 3630 (747.9) 88.76 (18.64)
1*b 30.55 (9.37) 302.67 (138.35) 8.56 (5.47)
2*b 28.37 (9.23) 290.71 (97.69) 8.43 (4.54)
3*b 30.29 (8.65) 271.98 (87.79) 8.61 (5.13)

79
Table 3.3. Physical properties of one to three-cycle knife-milled powders.
*a: Number enclosed in the parenthesis were standard deviations with n=3.
*b: Number enclosed in the parenthesis were standard deviations with n=5.
Grinding cycle
Moisture content (%wb)a
Geometric mean
diameter (𝜇m) a
Fines (%)a Bulk density (kg m-3)b
Tapped density
(kg m-3)b
Crystallinity (%)a
0 6.95 (0.10) - 5.06 (0.98) - - 75.19 (4.86)
1 6.90 (0.13) 91.97 (2.30) 25.84 (3.85) 93.48 (2.85) 168.17 (2.64) 73.40 (2.98)
2 6.82 (0.14) 87.10 (12.41) 33.96 (2.43) 96.79 (1.99) 175.72 (2.55) 75.12(3.76)
3 6.86 (0.15) 70.33 (3.05) 37.22 (3.48) 111.59 (3.06) 202.63 (1.19) 74.57 (1.77)

80
Table 3.4. Average fiber width and specific surface area (SSA) for samples.
Sample Average width (nm)*a SSA (m2/g)*b Cellulose powder 30,290 (8,650) 112.07±0.70 CNF from French press 118.73 (113.52) 269.46±3.43 Standard CNF 133.96 (80.43) 210.62±0.00 *a: Number enclosed in the parenthesis were standard deviations with n=90 for the cellulose
powder and n=80 for the CNF samples, respectively.
*b: ±1 the difference between the smallest and largest values indicated
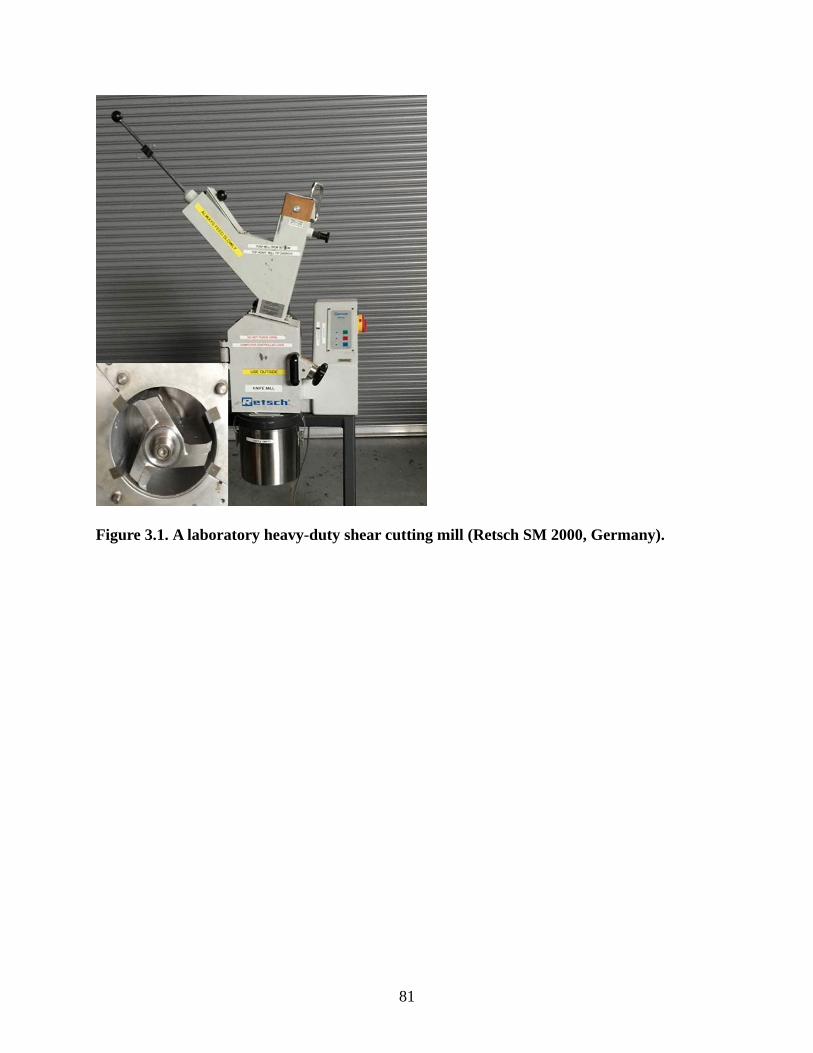
81
Figure 3.1. A laboratory heavy-duty shear cutting mill (Retsch SM 2000, Germany).
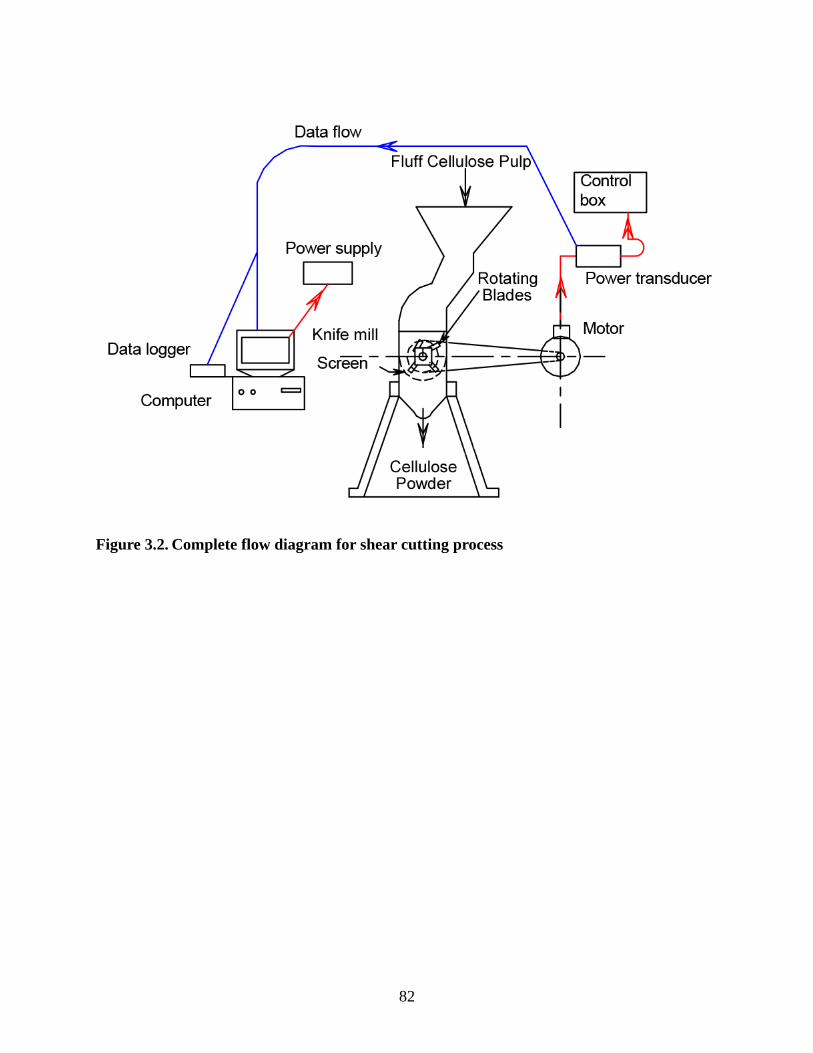
82
Figure 3.2. Complete flow diagram for shear cutting process

83
Figure 3.3. Fluff pulp (left) and three-cycle knife-milled powder (right).
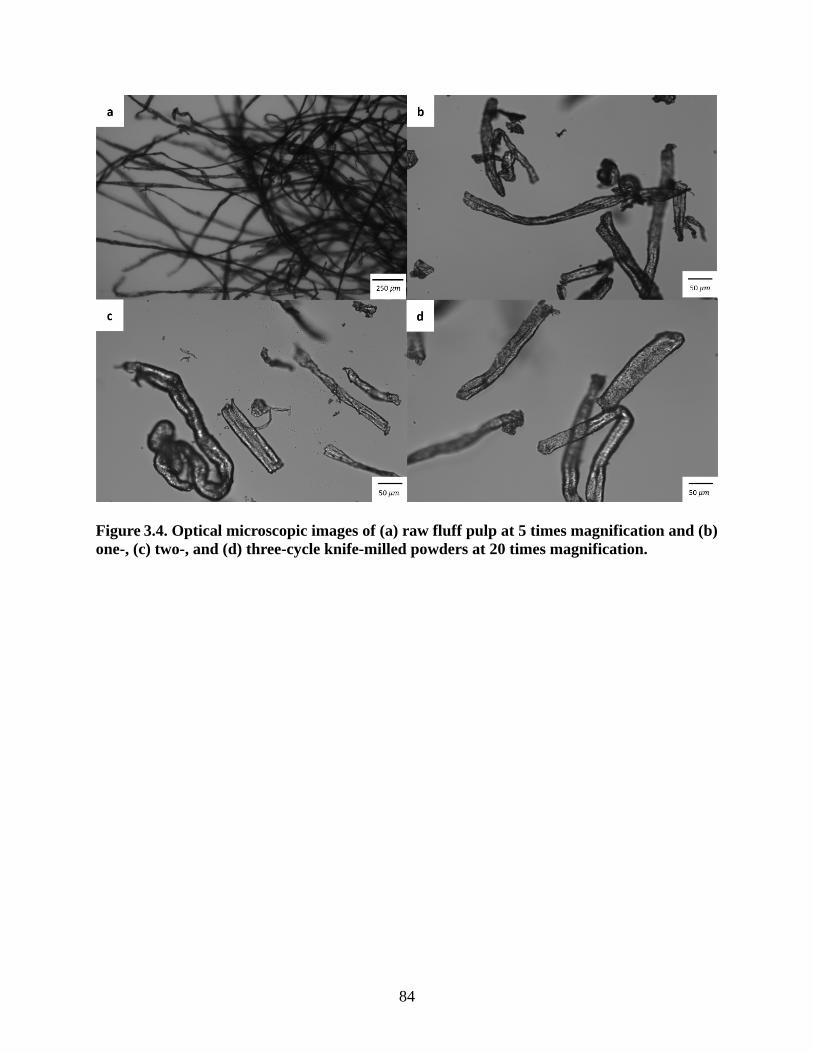
84
Figure 3.4. Optical microscopic images of (a) raw fluff pulp at 5 times magnification and (b) one-, (c) two-, and (d) three-cycle knife-milled powders at 20 times magnification.

85
Figure 3.5. Particle size distributions of one- to three-cycle knife-milled powders.

86
Figure 3.6. X-ray diffraction patterns of fluff pulp and knife-milled powders with one to three grinding cycles.

87
Figure 3.7. A photo of fibrillated cellulose gel after 15 passes through a French press (left)
and standard CNF from University of Maine (right).

88
Figure 3.8. Optical microscopic images of the three-cycle knife-milled cellulose after passing through a French press with (a) 10 passes and (b) 15 passes.
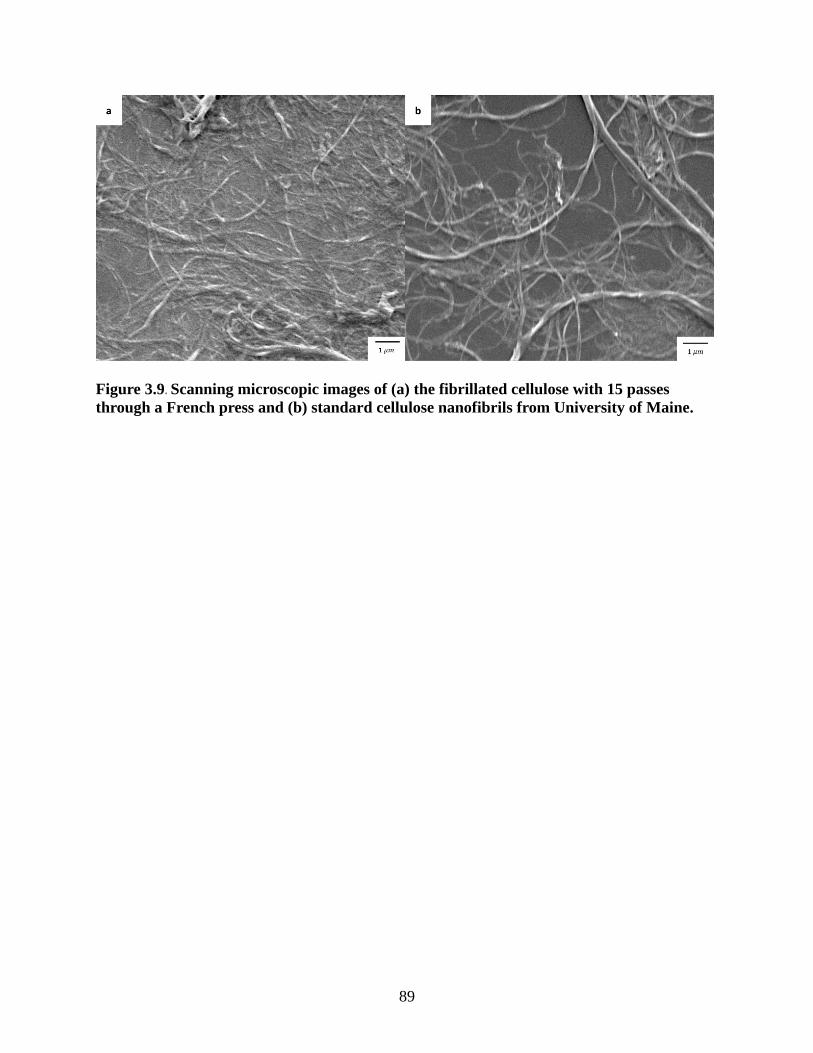
89
Figure 3.9. Scanning microscopic images of (a) the fibrillated cellulose with 15 passes through a French press and (b) standard cellulose nanofibrils from University of Maine.

90
Figure 3.10. The distribution of fiber width for the fibrillated cellulose passed through a French press with 15 passes (top) and standard cellulose nanofibrils from University of Maine (bottom).

91
Figure 3.11. Dispersion states of the 0.1wt% suspensions of (a) the fibrillated cellulose passed through a French press with 15 passes, and (b) standard cellulose nanofibrils from University of Maine at 0, 10 and 90 minutes (from left to right).

92
CHAPTER 4
DEVELOPMENT OF THERMALLY STABLE CELLULOSE NANOFIBRILS USING
LOW-CONCENTRATION ALKALINE TREATMENT
Lee, Hansol and Mani, Sudhagar
To be submitted to TAPPI Journal or ACS Sustainable Chemistry & Engineering

93
Abstract
High-concentration NaOH treatment has been used to prepare thermally stable cellulose
nanofibrils (CNF) by converting cellulose crystal structure from cellulose I to cellulose II.
However, a number of processing cycles was needed to obtain well-delaminated CNF, and a vast
amount of water was required during neutralization. These problems can be reduced by using
low-concentration NaOH treatment at low temperature. The objective of this study was to
investigate the effects of low-concentration NaOH treatment on the production and properties of
cellulose nanofibrils. Cellulose nanofibrils was successfully prepared by processing cellulose
powder with 2wt.% NaOH solution at low temperature (below 0 ℃), followed by the mechanical
disintegration through a French cell press with only ten passes. It had an average diameter of 90
nm and had a remarkable dispersion behavior in water. It also exhibited a comparatively high
thermal stability with the mean onset thermal degradation temperature and DTG peak thermal
degradation temperature of 305 ℃ and 343 ℃, respectively. Therefore, the low-concentration
alkaline pretreatment conditions could be used to produce thermally stable CNF for
nanocomposites applications.
Keywords: Cellulose nanofibrils, Cellulose II, Alkaline treatment, Thermal stability, French cell
press.
94
Introduction 1.
Cellulose is the most abundant renewable polymer on Earth as it is a naturally occurring
polymer produced by numerous sources, such as plants, algae, and bacteria. Throughout human
history, cellulose has been commonly used in the form of wood and plant fibers as fuel, building
materials and clothing. It has also been used as a chemical raw material for about 150 years.
Chemical modification of cellulose formed cellulose derivatives, such as cellulose ester and
cellulose ethers, which contributes to expanding the range of industrial applications of cellulose,
such as coating, films, new construction materials, pharmaceuticals, and food (Klemm et al.
2011). With increasing demand for environmentally friendly products as well as increasing
interest in nanotechnology, the development of novel forms of cellulosic material with at least
one dimension at the nanoscale has received considerable attention recently. Cellulose
nanofibrils (CNF) is one type of nano-structured cellulose with a diameter below 100 nm and a
length of several micrometers. Owing to its small dimentions, CNF is a lightweight material and
can form extensive network structures that induce high strength over 200 MPa (Yano and
Nakahara 2004; Fukuzumi et al. 2009; Saito et al. 2009; Abe and Yano, 2009). In addition,
cellulose nanofibrils exhibits unique rheological properties. CNF is viscous under normal
conditions, but flows once shear forces are introduced; thus, this shear-thinning behavior makes
CNF injectable while maintaining its viscosity when forces are removed (Bhattacharya et al.
2012). Therefore, cellulose nanofibrils provides great opportunities in various applications, such
as paper, films, food, automotive, electronic, and biomedical applications.
Cellulose nanofibrils can be obtained by mechanical methods where high shear and impact
forces are applied. Such combination of forces allows large cellulose fibers to be disintegrated
into nano-scale fibers Common disintegration methods include high-pressure homogenizers,

95
microfluidizers, and microgrinders. The disintegration process is responsible for the high energy
consumption over 25,000 kwh/ton, which restricts the commercialization of CNF. Clogging in a
homogenizer is another challenge for producing cellulose nanofibrils. In order to address these
problems, several pretreatments have been developed, such as mechanical, chemical, and/or
enzymatic pretreatment. Chemical pretreatment has been commonly used to produce high-
quality cellulose nanofibrils. It introduces negative-charged groups on the surface of cellulose
fibers, resulting in electrostatic repulsion between the fibers; therefore, the disintegration of
cellulose fibers can occur much more easily. Carboxymethylation and TEMPO (2,2,6,6-
tetramethylpiperidine-1-oxyl radical) oxidation are commonly used for the chemical
pretreatment process. However, using the chemical pretreatment causes two major problems.
Firstly, it requires various chemicals and organic solvents, which is far from environmentally
benign technology. For instance, carboxymethylation is performed in organic solvents, such as
ethanol, methanol and isopropanol. More specifically, this process requires 30 kg of organic
solvents to produce one kg of CNF on dry basis (Arvidsson et al. 2015). In addition, the
introduction of functional groups, such as carboxyl and carboxymethyl groups, decreases thermal
stability of cellulose nanofibrils by decarbonation (Britto and Assis 2009; Fukuzumi et al. 2009
and 2010; Eyholzer et al. 2010). Fukuzumi et al. (2009) demonstrated that the TEMPO-oxidized
cellulose nanofibrils had an onset thermal degradation temperature (To) of approximately 200 ℃,
while original cellulose had a To of approximately 300 ℃. This low thermal stability of
chemically-modified CNF is challenging for various applications because most commercial films
are produced as composites with thermoplastic polymers at the processing temperature over
200 ℃ (Chen et al. 2011).

96
Thermally stable cellulose nanofibrils can be prepared by processing cellulose fibers with
sodium hydroxide (NaOH). NaOH treatment is capable of converting cellulose crystal form into
stable antiparallel cellulose II from parallel cellulose I (Simon et al. 1988). Cellulose II is
believed to be more thermally stable than cellulose I. Wang et al. (2014) reported that cellulose
nanofibrils from cellulose pulps treated in 17.5wt% NaOH solution was found in the crystalline
form of cellulose II, and it had a higher onset and maximum thermal decomposition temperature
at 326 ℃ and 353 ℃, respectively, compared to those for untreated CNF at 302 ℃ and 348
℃, respectively. However, it would be difficult to use this NaOH treatment for the large-scale
CNF production due to the following reasons: a number of processing cycles for disintegrating
cellulose II fibers and high water consumption for neutralization. Firstly, it is difficult to produce
well-dispersed cellulose II nanofibers due to the interdigitation and aggregation of cellulose II
fibers (Shibazaki et al. 1997; Dinand et al. 2002; Abe and Yano 2012; Wang et al. 2014). Wang
et al. (2014) obtained well-delaminated cellulose II nanofibers by a single grinder treatment
followed by 50 homogenization treatments and centrifugation. Sharma et al. (2015) also reported
that the higher number of passes through a microgrinder was required to produce cellulose II
nanofibers than to produce cellulose I nanofibers. They found that cellulose II fibers at the
submicron level could be obtained after microgrinding for 60 passes, while cellulose I fibers had
diameters of the order of hundreds of nanometers after 20 passes and diameters of few
nanometers after 60 passes. In addition, cellulose II fibers are obtained by processing cellulose I
fibers in high concentration of NaOH solution. This results in the considerable water usage
during neutralization. Moreover, this approach did not take advantage of swelling effect of
NaOH. Cellulose fibers are swollen by treating in NaOH solutions, which are more accessible to
be fibrillated. However, in this approach, neutralization was carried out prior to the mechanical

97
disintegration process, and it led to the aggregation of cellulose fibers, making the fiber
disintegration a much more difficult task.
Instead of using high-concentration NaOH, low-concentration NaOH treatment with a
dispersing agent, carboxymethylcellulose (CMC), can be an alternative to produce thermally
stable cellulose nanofibrils, while reducing the number of passes through a homogenizer and
water use during neutralization. It has been reported that low-concentration NaOH solutions (>4
wt.%) are able to swell and partially dissolve cellulose at low temperature from -10 ℃ to 4 ℃,
converting the cellulose crystal structure of native cellulose to cellulose II (Sobue et al. 1939;
Isogai and Atalla 1998; Cuissinat and Navard 2006; Wang 2008). Moreover, CMC addition
would facilitate CNF production and prevent interdigitation of cellulose chains since it inhibits
hydrogen bonds between cellulose fibers by introducing negative charged groups on cellulose
backbone as well as acts as a lubricant between cellulose fibers, possibly between fibrils in the
cell wall (Herrick 1984; Cantiani et al. 2001; Yan et al. 2006; Ankerfors 2015).
The objective of this study is to explore the preparation of cellulose nanofibrils by using
low-concentration NaOH treatment and determine the best processing condition. This study also
aims to understand its properties. The investigated properties include dispersion behavior,
morphology, specific surface area, crystal structure crystallinity, and thermal stability.
Materials and Method 2.
2.1. Materials and Chemicals
Fluff cellulose pulp was obtained from the commercial paper mill in Georgia, USA and
milled into cellulose powder by passing through a heavy-duty knife mill three times with a
screen size of 250 microns (Retsch SM 2000, Germany). The cellulose powder was used as a
starting material for this study.
98
Sodium hydroxide was of reagent grade and in the form of beads, purchased from Amresco.
Sodium carboxymethyl cellulose (CMC, DS=0.9 and Mw ~250K) was used, purchased from
Aldrich. Congo red from Harleco was used at the total dye content of 80%. Sodium chloride was
of reagent grade, purchased from Fisher chemical. All chemicals were used without further
purification.
Cellulose nanofibrils obtained by using a high pressure homogenizer with CMC (0.25wt%
in water) was kindly provided by Department of textiles, merchandising and interior, UGA. This
CNF was produced from the same starting material (cellulose powder) used in this study; thus, it
was used to evaluate the effect of CMC itself on CNF production and its properties. It is named
as H-CMC-CNF. In addition, commercially available cellulose nanofibrils was purchased from
the University of Maine and used as a standard CNF.
2.2. Alkaline treatment
Cellulose powder was treated with 2-6 wt.% sodium hydroxide (NaOH) aqueous solutions.
The NaOH solutions were prepared with or without carboxymethylcellulose (CMC, 0.3wt% in
water) and pre-cooled in a freezer. The frozen solid was broken into ice slush. A certain amount
of cellulose powder was mixed with the ice slush at the solid content of 2 wt.%, and then placed
in an ice bath at least for 15 minutes. Afterward, cellulose/NaOH aqueous slurry was completely
thawed at room temperature prior to the following disintegration process.
2.3. Cellulose nanofibrils preparation
To produce cellulose nanofibrils, the alkali-treated cellulose was fibrillated through a
French pressure cell press. 35 ml of cellulose suspension was passed through the French cell
press ten times at operating pressure of 1,000-1,200 bar. The fibrillated cellulose was dialyzed

99
against deionized water until neutrality. Afterward, the sample was filtrated to make the solid
content of 2wt%.
2.4. Characterization of alkali-treated cellulose
2.4.1. Solubility of cellulose in NaOH solutions
Solubility of cellulose in the NaOH solutions (2, 4 and 6wt%) was evaluated with or
without CMC. To do so, 35 ml of cellulose/NaOH aqueous suspension was prepared with solid
content of 2 wt.% as described in section 2.2. The samples were centrifuged at 6,000 rpm for 20
min. The sediments were filtered and neutralized by rinsing with deionized water, and then dried
in an oven at 60 ℃ for 24 hours. The dry weight of the sediments was measured to calculate
solubility ratio of cellulose as the weight of dissolved cellulose divided by the original weight of
cellulose on dry basis as follow:
Equation (1): Solubility ratio = 𝑊𝑊𝑊𝑊
× 100 = 𝑊𝑊−𝑊𝑊𝑊𝑊𝑊𝑊
× 100 (%)
where 𝑊d is the weight of dissolved cellulose, 𝑊und is the weight of undissolved cellulose and
Wo is the original weight of cellulose. The value of solubility ratio represented three replicates.
2.4.2. Morphology of alkali-treated cellulose
The morphology of alkali-treated cellulose was determined using an optical microscope
(DMI 3000B, Leica) at 20 times magnification. A drop of cellulose/NaOH aqueous suspension
was placed on a glass side covered with a coverslip. The images presented were considered to be
representative of the surfaces of alkali-treated cellulose fibers.

100
2.5. Characterization of fibrillated cellulose
We characterized the fibrillated cellulose produced by NaOH treatment and
homogenization through the French cell press. The investigated properties were dispersion
behavior, morphology, specific surface area, crystalline structure, crystallinity and thermal
stability.
2.5.1. Visual examination
The dispersion behavior of the fibrillated cellulose was investigated through visual
examination as described by other authors (Besbes et al., 2011; Chen et al., 2011), but at a lower
solid content. The fibrillated cellulose was diluted with deionized water to 0.1 wt.% solid
content. The diluted samples were placed motionlessly for 24 hours, and the photos were taken at
0, 10, 60 minutes and 24 hours.
2.5.2. Morphology of fibrillated cellulose
2.5.2.1. Optical microscopy
The fibrillated cellulose was observed using an optical microscope (DMI 3000B, Leica)
at 20 times magnification. A drop of the fibrillated cellulose suspension was placed on a glass
side covered with a coverslip. The images presented were considered to be representative of the
fiber surfaces of the fibrillated cellulose.
2.5.2.2. Field-emission scanning electron microscopy (FE-SEM)
FE-SEM observation was performed to morphologically characterize the fibrillated
cellulose using a FEI Inspect F FEG-SEM. The fibrillated cellulose suspension will be diluted to
0.1wt%. A drop of the diluted suspension was deposited on a silicon substrate and dried for 24
hours at room temperature. The samples were coated with a thin gold/palladium layer applied by
ion sputtering with a thickness limited to 5 nm. To prevent damage on the samples, the relatively

101
low acceleration voltage was used at 5 kV. In case of the well-fibrillated samples, diameters of
cellulose fibers were measured with 80 replicates.
2.5.2.3. Scanning transmission electron microscopy (STEM)
A scanning transmission electron microscopy was used to observe the fibrillated cellulose
without sputtered metal coatings. The fibrillated cellulose suspension was diluted to 0.1wt%. A
drop of the diluted suspension was deposited on a glow-discharged copper grid with formvar and
carbon film (300 mesh). The samples were completely dried at room temperature and observed
using a FEI Teneo FE-SEM operated at 30 kV.
2.5.3. Specific surface area study
Specific surface area (SSA) was measured using the Congo red adsorption method
(Ougiya et al. 1998; Goodrich and Winter 2007; and Spence et al. 2010). SSA measurement was
made only with raw cellulose powder and well-fibrillated samples. Samples was placed into a 0.1
M phosphate butter at pH 6 and treated with various concentrations of Congo red at a final solid
content of 0.5%. The samples were incubated at 60 ℃ for 24 h. A small amount of NaCl (10wt%
of cellulose weight on dry basis) was added to the samples at the beginning of the experiment in
order to neutralize charged surface sites. After 24 hours, the samples were centrifuged at 12,000
rpm (14,000 rcf) for 5 min and 15 min for cellulose powder and the fibrillated samples,
respectively. The supernatant was put into a quartz cuvette, and its absorbance was measured at
500 nm using an ultraviolet (UV)-visible spectrometer (Genesys 10S, Thermo Fisher Scientific).
All runs were at least duplicated with the reported values being the averages. The maximum
amount of Congo red absorbed was calculated from the equation (2) derived from Langmuir’s
absorption theory.
Equation (2) ∶ [𝐸][𝐴]
= 1
𝐾𝐾𝐾[𝐴]𝑚𝐾𝑚+
[𝐸][𝐴]𝑚𝐾𝑚

102
where [E] is the solution concentration of Congo red at adsorption equilibrium in mg/ml, [A] is
the amount of Congo red adsorbed onto the cellulose surface in mg/g, [A]max is the maximum
amount of Congo red adsorbed onto the cellulose surface in mg/g, and Kad is the equilibrium
constant. The specific surface area was determined as follows:
Equation (3) ∶ 𝑆𝑆𝐴 =[𝐴] max × 𝑁 × 𝑆𝐴
𝑀𝑀 × 1021
where N is Avogadro’s constant, SA is the surface area occupied by a single dye molecule (1.73
nm2), and Mw is the molecular weight of Congo red (696 g/mole)
2.5.4. X-ray diffraction analysis (XRD)
The X-ray diffraction analysis was carried out to investigate the effect of NaOH
treatment on cellulose crystal structure and to measure the crystallinity of fibrillated cellulose. To
prepare the samples for XRD analysis, cellulose suspensions were poured onto a glass substrate
and degassed under a sonicating bath and vacuum. Then, it was dried at 60 ℃ to make a film
with a flat surface. The X-ray diffraction analysis was performed with the scanning region from
10° to 35° at scan rate of 1°/min, and crystallinity degree (CrD) was calculated using the Segal
method as follows:
Equation (4): CrD (%) = �I200−IamI200
� × 100
where I200 and Iam are the intensity value for the crystalline cellulose (2θ = 22.5°) and the
amorphous cellulose (2θ = 18.5°), respectively. When cellulose crystal structure was converted
to cellulose II, the intensity values of crystalline domain (200) and amorphous domain at 22.0°
and 15.0°, respectively, were used to calculate the crystallinity.
2.5.5. Thermal analysis of fibrillated cellulose
Thermogravimetric analysis (TGA) was performed to determine the thermal stability of
fibrillated cellulose. The dried samples were prepared as described in 2.5.4. and then cut into

103
small pieces for TGA. The sample weighing 4-5 mg was loaded, and the thermogravimetric
analysis was performed at a heating rate of 10 ℃/min from room temperature to 600 ℃ under N2
atmosphere with a 50ml/min flow rate. The weight-loss rate was obtained from the derivative
thermogravimetric (DTG) data. The onset degradation temperature was defined as the
intersection of tangent lines drawn from the TG curve; one before the cellulose degradation step
and another from the degradation step.
2.6. Statistical analysis
Statistical analyses were performed using a scientific software (SAS, University Edition).
The effects of CMC addition and NaOH concentration on cellulose solubility, crystallinity and
thermal stability of the fibrillated cellulose were evaluated using two-way ANOVA. Multiple
comparisons were also conducted using Tukey method. All differences were considered
significant at p<0.05. Detailed results are provided in Appendix B.
Results and Discussion 3.
3.1. Alkaline treatment
3.1.1. Solubility of cellulose in NaOH solutions
Overall, as the concentration of sodium hydroxide increased, the cellulose solubility
increased. The weight loss of cellulose treated in NaOH solutions without
carboxymethylcellulose increased from 5% to 24% when the NaOH concentration increased
from 2wt% to 6wt%. The more cellulose is dissolved, the more regenerated cellulose would be
obtained. The higher fraction of regenerated cellulose would lead to the reduction in thermal
stability of cellulose since it has been reported that thermal degradation of regenerated cellulose
takes place at lower temperature than that of original cellulose (Swatloski et al. 2002; Wu et al.
2009). In addition, the partial dissolution suggests that the NaOH treatment led to not only the

104
dissolution but also the swelling of cellulose fibers because the solvent system can dissolve
cellulose only after swelling it. Particularly, only 5% of cellulose was dissolved in 2wt% NaOH
solution, indicating that swelling was more dominant than dissolution. 2wt% NaOH treatemtn is
could facilitate cellulose nanofibrils production as swollen fibers are more responsive to be
disintegrated than untreated cellulose fibers.
In addition, CMC addition did not make any significant difference in cellulose solubility.
The percent of cellulose dissolved in 2-6wt% NaOH solutions with CMC ranged from 8% to
23%. Two-way ANOVA test also showed that NaOH concentration significantly affected
cellulose solubility (p<.0001), but CMC did not (p=0.6047), and it also showed that the effect of
NaOH concentration on cellulose solubility would not depend on whether CMC is present or not
(p=0.3601).
3.1.2. Morphology of alkali-treated cellulose
Figure 4.3 shows optical microscopic images of cellulose treated with various
concentrations of aqueous NaOH solutions. Cellulose fibers were swollen in all NaOH solutions,
but wer not in pure water or water containing CMC. The swelling behavior of cellulose fibers
was different according to NaOH concentrations. Cellulose fibers treated with 2wt% NaOH were
homogenously swollen without forming balloons; thereby, these fibers retained their fibrous
structure. In contrast, those treated with 4wt% and 6wt% NaOH showed large swelling by
ballooning, and some of these fibers completely lost their fibrous shapes and were fragmented.
Such extensive swelling with fragmentation provides the plausible explanation for the increase in
cellulose solubility with increasing NaOH concentration as described earlier. In addition, the
addition of carboxymethylcellulose (CMC) did not apparently affect the morphology of cellulose
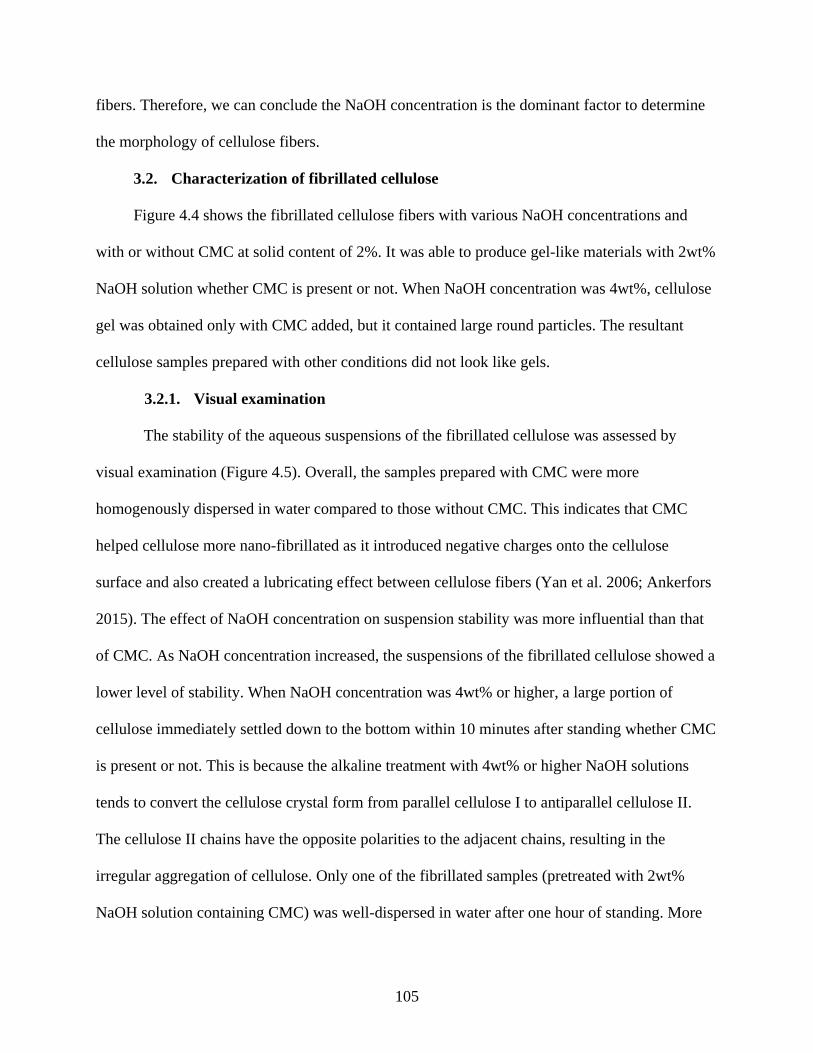
105
fibers. Therefore, we can conclude the NaOH concentration is the dominant factor to determine
the morphology of cellulose fibers.
3.2. Characterization of fibrillated cellulose
Figure 4.4 shows the fibrillated cellulose fibers with various NaOH concentrations and
with or without CMC at solid content of 2%. It was able to produce gel-like materials with 2wt%
NaOH solution whether CMC is present or not. When NaOH concentration was 4wt%, cellulose
gel was obtained only with CMC added, but it contained large round particles. The resultant
cellulose samples prepared with other conditions did not look like gels.
3.2.1. Visual examination
The stability of the aqueous suspensions of the fibrillated cellulose was assessed by
visual examination (Figure 4.5). Overall, the samples prepared with CMC were more
homogenously dispersed in water compared to those without CMC. This indicates that CMC
helped cellulose more nano-fibrillated as it introduced negative charges onto the cellulose
surface and also created a lubricating effect between cellulose fibers (Yan et al. 2006; Ankerfors
2015). The effect of NaOH concentration on suspension stability was more influential than that
of CMC. As NaOH concentration increased, the suspensions of the fibrillated cellulose showed a
lower level of stability. When NaOH concentration was 4wt% or higher, a large portion of
cellulose immediately settled down to the bottom within 10 minutes after standing whether CMC
is present or not. This is because the alkaline treatment with 4wt% or higher NaOH solutions
tends to convert the cellulose crystal form from parallel cellulose I to antiparallel cellulose II.
The cellulose II chains have the opposite polarities to the adjacent chains, resulting in the
irregular aggregation of cellulose. Only one of the fibrillated samples (pretreated with 2wt%
NaOH solution containing CMC) was well-dispersed in water after one hour of standing. More
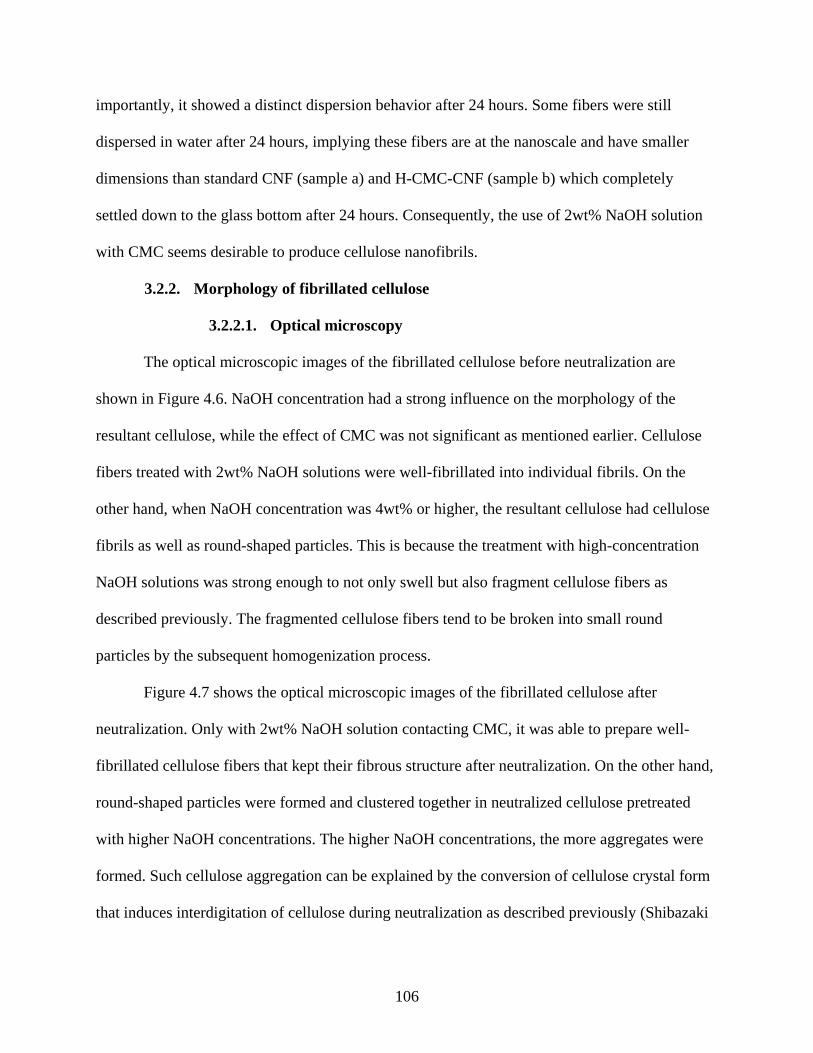
106
importantly, it showed a distinct dispersion behavior after 24 hours. Some fibers were still
dispersed in water after 24 hours, implying these fibers are at the nanoscale and have smaller
dimensions than standard CNF (sample a) and H-CMC-CNF (sample b) which completely
settled down to the glass bottom after 24 hours. Consequently, the use of 2wt% NaOH solution
with CMC seems desirable to produce cellulose nanofibrils.
3.2.2. Morphology of fibrillated cellulose
3.2.2.1. Optical microscopy
The optical microscopic images of the fibrillated cellulose before neutralization are
shown in Figure 4.6. NaOH concentration had a strong influence on the morphology of the
resultant cellulose, while the effect of CMC was not significant as mentioned earlier. Cellulose
fibers treated with 2wt% NaOH solutions were well-fibrillated into individual fibrils. On the
other hand, when NaOH concentration was 4wt% or higher, the resultant cellulose had cellulose
fibrils as well as round-shaped particles. This is because the treatment with high-concentration
NaOH solutions was strong enough to not only swell but also fragment cellulose fibers as
described previously. The fragmented cellulose fibers tend to be broken into small round
particles by the subsequent homogenization process.
Figure 4.7 shows the optical microscopic images of the fibrillated cellulose after
neutralization. Only with 2wt% NaOH solution contacting CMC, it was able to prepare well-
fibrillated cellulose fibers that kept their fibrous structure after neutralization. On the other hand,
round-shaped particles were formed and clustered together in neutralized cellulose pretreated
with higher NaOH concentrations. The higher NaOH concentrations, the more aggregates were
formed. Such cellulose aggregation can be explained by the conversion of cellulose crystal form
that induces interdigitation of cellulose during neutralization as described previously (Shibazaki
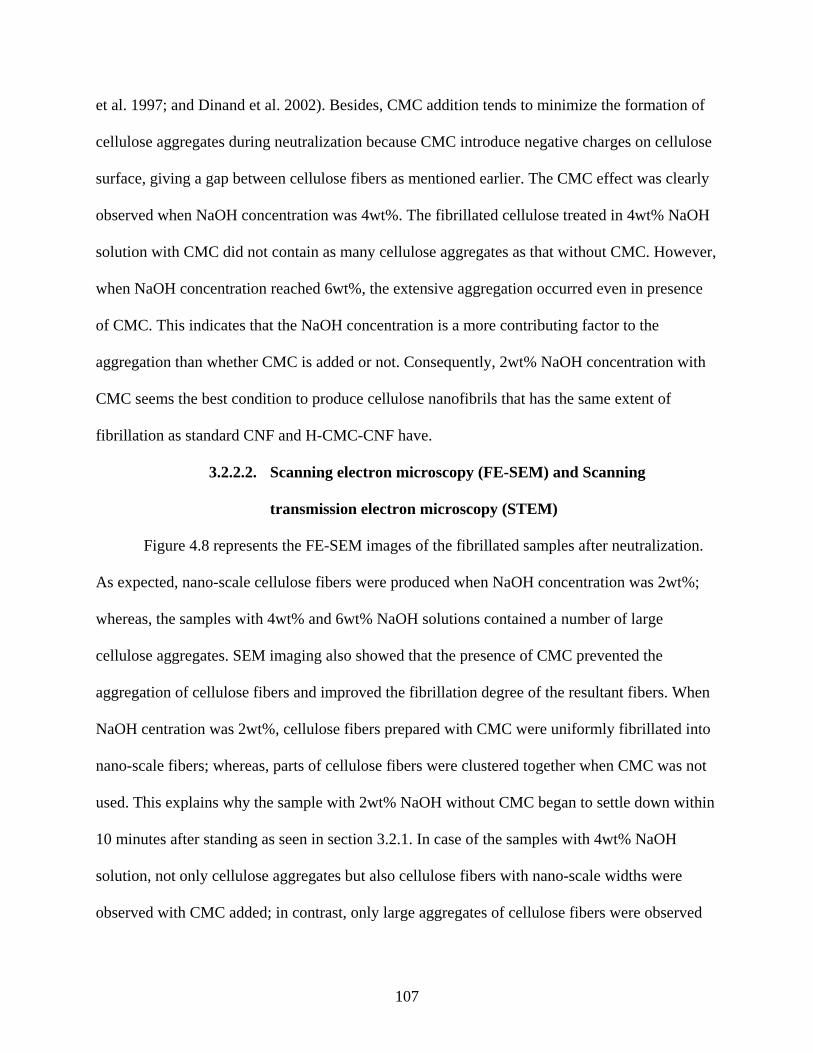
107
et al. 1997; and Dinand et al. 2002). Besides, CMC addition tends to minimize the formation of
cellulose aggregates during neutralization because CMC introduce negative charges on cellulose
surface, giving a gap between cellulose fibers as mentioned earlier. The CMC effect was clearly
observed when NaOH concentration was 4wt%. The fibrillated cellulose treated in 4wt% NaOH
solution with CMC did not contain as many cellulose aggregates as that without CMC. However,
when NaOH concentration reached 6wt%, the extensive aggregation occurred even in presence
of CMC. This indicates that the NaOH concentration is a more contributing factor to the
aggregation than whether CMC is added or not. Consequently, 2wt% NaOH concentration with
CMC seems the best condition to produce cellulose nanofibrils that has the same extent of
fibrillation as standard CNF and H-CMC-CNF have.
3.2.2.2. Scanning electron microscopy (FE-SEM) and Scanning
transmission electron microscopy (STEM)
Figure 4.8 represents the FE-SEM images of the fibrillated samples after neutralization.
As expected, nano-scale cellulose fibers were produced when NaOH concentration was 2wt%;
whereas, the samples with 4wt% and 6wt% NaOH solutions contained a number of large
cellulose aggregates. SEM imaging also showed that the presence of CMC prevented the
aggregation of cellulose fibers and improved the fibrillation degree of the resultant fibers. When
NaOH centration was 2wt%, cellulose fibers prepared with CMC were uniformly fibrillated into
nano-scale fibers; whereas, parts of cellulose fibers were clustered together when CMC was not
used. This explains why the sample with 2wt% NaOH without CMC began to settle down within
10 minutes after standing as seen in section 3.2.1. In case of the samples with 4wt% NaOH
solution, not only cellulose aggregates but also cellulose fibers with nano-scale widths were
observed with CMC added; in contrast, only large aggregates of cellulose fibers were observed

108
when CMC was not added. Diameters of the fibers were measured on the fibrillated sample
pretreated with 2wt% NaOH solution containing CMC, and those of standard CNF and H-CMC-
CNF were also measure for comparison. Among these three samples, the fibrillated sample had
the smallest average diameter of 89.8 nm with a standard deviation of 67.7 nm. The average
diameter was 134 nm and 97.1 nm with a standard of 80.4 nm and 73.1 nm for standard CNF and
H-CMC-CNF, respectively. Figure 4.9 exhibits the diameter distribution of these three samples.
Except standard CNF, fiber diameters generally ranged from several tens of nanometer to 200
nm, and more than 70% of cellulose fibers had a diameter below 100 nm. It is worth mentioning
that the sample with 2wt% NaOH together with CMC had the largest fraction of cellulose fibers
with a diameter below 50 nm (17.5%); whereas, in case of other samples, less than 4% of
cellulose fibers had a diameter of smaller than 50 nm. This indicates that the alkaline treatment
facilitates the delamination of cellulose fibers into nano-scale fibers by swelling. In addition, the
STEM images provided the morphological information of these three samples without sputtered
metal coating (Figure 4.10). The fibrillation degree of the sample obtained in this study (Figure
4.10-a) was comparable to that of standard CNF (Figure 4.10-b) and H-CMC-CNF (Figure 4.10-
c). All samples consisted of nanofibers although there existed large fibers with a diameter of
several hundred nanometers.
3.2.3. Specific surface area study
Specific surface area (SSA) was measured on the fibrillated cellulose prepared with
2wt% NaOH solution together with CMC using the Congo red adsorption method and compared
to those of starting material and two control CNF materials (standard CNF and H-CMC-CNF).
As can be seen in Figure 4.11, the fibrillated cellulose obtained in this study and two control
CNFs had a higher SSA than cellulose powder (122.07 m2g-1), indicating the surface area of

109
cellulose increased as fibrillation progressed. SSA was 248.05 m2g-1, 210.62 m2g-1, and 232.52
m2g-1 for the fibrillated cellulose sample, standard CNF, and H-CMC-CNF respectively, which is
a little higher than the value reported in literature (up to 202 m2g-1, Spence et al. 2010). Thus, it
can be concluded that the fibrillation degree of the fibrillated cellulose would be comparable to
that of other standard CNF materials.
3.2.4. X-ray diffraction analysis (XRD)
X-ray diffraction patterns of the fibrillated cellulose samples are shown in Figure 4.12.
Figure 4.12-(1) and Figure 4.12-(2) represent XRD patterns of the samples prepared without or
with CMC, respectively. Figure 4.12-(3) shows XRD patterns of cellulose powder (case g),
standard CNF (case h) and H-CMC-CNF (case i). NaOH concentration strongly affected the
cellulose crystalline structure. NaOH concentration of 2wt% was not sufficient to transform the
cellulose crystal structure. The samples (case a and d) had peaks at 2θ angles of approximately
14.6° (11�0), 16.5° (110) and 22.5° (200), which were characteristic of cellulose I structure as the
case g, h and I had. The alkaline treatment with 4wt% or higher NaOH concentrations converted
the cellulose crystal structure. The peaks were shifted to 12.2° (11�0), 20.0° (110) and 22.0°
(200), indicating the formation of cellulose II structure. This result gives the reason for the
extensive aggregation in the samples prepared with 4wt% and 6wt% NaOH solutions. Cellulose
II chains of the opposite polarities are able to attract each other and form large cellulose
aggregates. The influence of CMC on the conversion of cellulose crystal structure was not strong
as that of NaOH concentration. However, it is likely to inhibit the conversion of cellulose crystal
form as seen in case e, which shows the signature peaks of both cellulose I and cellulose II. CMC
could increase the mobility of cellulose chains by giving a gap between cellulose fibers and
possible cellulose chains inside the fibers. Therefore, cellulose chains could preserve their
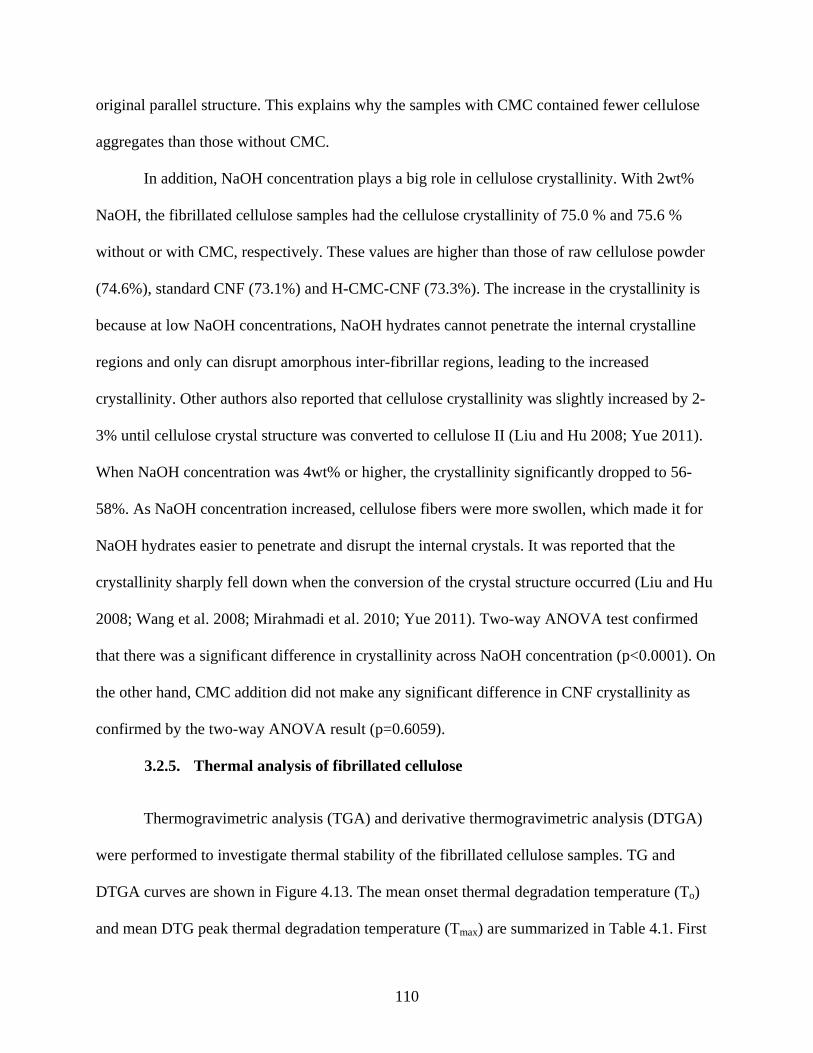
110
original parallel structure. This explains why the samples with CMC contained fewer cellulose
aggregates than those without CMC.
In addition, NaOH concentration plays a big role in cellulose crystallinity. With 2wt%
NaOH, the fibrillated cellulose samples had the cellulose crystallinity of 75.0 % and 75.6 %
without or with CMC, respectively. These values are higher than those of raw cellulose powder
(74.6%), standard CNF (73.1%) and H-CMC-CNF (73.3%). The increase in the crystallinity is
because at low NaOH concentrations, NaOH hydrates cannot penetrate the internal crystalline
regions and only can disrupt amorphous inter-fibrillar regions, leading to the increased
crystallinity. Other authors also reported that cellulose crystallinity was slightly increased by 2-
3% until cellulose crystal structure was converted to cellulose II (Liu and Hu 2008; Yue 2011).
When NaOH concentration was 4wt% or higher, the crystallinity significantly dropped to 56-
58%. As NaOH concentration increased, cellulose fibers were more swollen, which made it for
NaOH hydrates easier to penetrate and disrupt the internal crystals. It was reported that the
crystallinity sharply fell down when the conversion of the crystal structure occurred (Liu and Hu
2008; Wang et al. 2008; Mirahmadi et al. 2010; Yue 2011). Two-way ANOVA test confirmed
that there was a significant difference in crystallinity across NaOH concentration (p<0.0001). On
the other hand, CMC addition did not make any significant difference in CNF crystallinity as
confirmed by the two-way ANOVA result (p=0.6059).
3.2.5. Thermal analysis of fibrillated cellulose
Thermogravimetric analysis (TGA) and derivative thermogravimetric analysis (DTGA)
were performed to investigate thermal stability of the fibrillated cellulose samples. TG and
DTGA curves are shown in Figure 4.13. The mean onset thermal degradation temperature (To)
and mean DTG peak thermal degradation temperature (Tmax) are summarized in Table 4.1. First

111
of all, it should be noted that the alkaline treatment with 2wt% NaOH solution has a potential to
improve the thermal stability of cellulose. Among the fibrillated cellulose samples, the sample
treated in 2wt% NaOH solution without CMC showed the best thermal stability with To and Tmax
of 320.05 ℃ and 353 ℃, respectively. Such relative high thermal stability can be explained by
the increased crystallinity of this sample compared with other samples. It was reported that
thermal stability of cellulose was closely associated with its crystallinity, and the cellulose
sample with higher crystallinity exhibited better thermal stability (Liu and Hu 2008; Yue 2011).
It is worth mentioning that this sample had a comparable thermal stability to original cellulose
powder although it was reported that thermal stability of cellulose decreased as fibrillation
proceeded (Sharma et al. 2015). Moreover, this sample presented a much higher onset thermal
decomposition temperature (304.83 ℃) than the sample prepared only with CMC (H-CMC-CNF,
286.51 ℃). The Tukey test results also showed that there is a significant difference in thermal
stability between these two samples (p=0.0003). These results support that 2wt% NaOH
treatment potentially improves thermal stability of cellulose. One possible reason for this is that
2wt% NaOH treatment might reduce the carboxyl content of CMC adsorbed onto cellulose.
Fukuzumi et al. (2010) reported that the repeated alkaline treatments with 1M NaOH removed
approximately 86% of the carboxyl groups present in TEMPO-oxidized cellulose, resulting in
the increase in the thermal stability.
Besides, the thermal stability of the fibrillated cellulose samples gradually decreased with
increasing NaOH concentrations even though the increase in NaOH concentration led to the
conversion of native cellulose I to cellulose II. In case of the samples without CMC, To was
decreased from 320.05 ℃ to 314.98 ℃; likewise, Tmax was decreased from 353 ℃ to 344.33 ℃ as
NaOH concentration increased from 2wt% to 6wt%. This trend was also observed in the samples

112
prepared with CMC. Two-way ANOVA test also provided a strong evidence that NaOH
concentration significantly affected the thermal stability of the samples (p<0.0001). Such
decrease with increasing NaOH concentration is due to the low thermal stability of
dissolved/regenerated cellulose as described earlier. It has been reported that the onset and
maximum thermal decomposition temperatures of regenerated cellulose is 20-50 ℃ lower than
those of pure cellulose (Swatloski et al. 2002; Wu et al. 2009). The percent of dissolved cellulose
was increased with increasing NaOH concentrations as shown in Figure 4.2; therefore, the
cellulose fibers treated with a higher NaOH concentration contained a higher fraction of
regenerated cellulose fibers, resulting in the reduction in thermal stability. Another explanation is
the reduced crystallinity with higher NaOH concentration. Lower crystallinity indicates that
cellulose is less organized and therefore more vulnerable by heating process.
Regarding the effects of CMC, CMC addition significantly reduced thermal stability of the
resultant cellulose samples. This is attributed to the carboxymethyl groups of CMC. Other
authors also reported that the cellulose containing charged groups was decomposed at lower
temperature than pure cellulose due to decarbonation (Britto and Assis 2009; Fukuzumi et al.
2010). Two-way ANOVA test supported that the addition of CMC made a significant difference
in cellulose thermal stability (p<.0001 for the onset thermal degradation temperature and
p=0.0097 for the maximum thermal degradation temperature).
Conclusions 4.
Cellulose nanofibrils was successfully produced by treating cellulose fibers with low-
concentration NaOH solution (2wt.%) containing CMC at low temperature, followed by
homogenization using a French cell press with only ten passes. Its characteristics were
comparable to standard CNF produced at pilot scale. It had an average diameter of 89.8 nm and a

113
specific surface area of 248.05 m2g-1 and showed a remarkable dispersion behavior in water. In
addition, it has a relatively high thermal stability with the mean onset thermal degradation
temperature of 305 ℃ and the mean DTG peak thermal degradation temperature of 343 ℃.
Therefore, it could be concluded that low-concentration NaOH treatment (2wt.%) was a
promising alternative way to produce thermally stable cellulose nanofibrils with reduced
homogenization cycles and water use for neutralization.
Acknowledgement
We thank Dr. Eric Freeman from College of Engineering, Dr. Yiping Zhao from
Department of Physics, Dr. Albin F. Turbak and Dr. Suraj Sharma from Department of textiles,
merchandising and interiors, UGA for providing technical assistance. We also thank Dr. Hari P.
Singh from Fort Valley State University for his financial support on electron microscopic studies.

114
References
Abe, K., Yano, H., 2009, Comparison of the characteristics of cellulose microfibril aggregates of
wood, rice straw and potato tuber, Cellulose, 16:1017–1023.
Abe, K., Yano, H., 2012, Cellulose nanofiber-based hydrogels with high mechanical strength,
Cellulose, 19:1907-1912.
Ankerfors, M., 2015, Microfibrillated cellulose: Energy-efficient preparation techniques and key
properties, PhD. Dissertation, KTH Royal Institute of Technology.
Arvidsson, R., Nguyen, D., Svanstrom M., 2015, Life cycle assessment of cellulose nanofibrils
production by mechanical treatment and two different pretreatment processes, Environ. Sci.
Technol., 49:6681-6890.
Bhattacharya, M., Malinen, M.M., Lauren, P., Lou, Y., Kuisma, S.W., Kanninen, L., Corlu, A.,
GuGuen-Guillouzo, C., Ikkala, O., Laukkanen, A., Urtti, A., Yliperttula, M., 2012, Nanofibrillar
cellulose hydrogel promotes three-dimensional liver cell culture, Journal of Controlled Release,
164(3):291-298.
Britto, D., and Assis, O.B.G., 2009, Thermal degradation of carboxymethylcellulose in different
salty forms, Thermochimica Acta, 494:115-122.
Cantiani, R., Knipper, M., Vaslin, S., 2002, Use of cellulose microfibrils in dry form in food
formulations, US Patent 6,485,767 B1.
Chen, W., Yu, H., Liu, Y., Chen, P., Zhang M., Hai, Y., 2011, Individualization of cellulose
nanofibers from wood using high-intensity ultrasonication combined with chemical
pretreatments, Carbohydrate Polymers, 83:1804-1811.
Cuissinat, C., Navard, P., 2006, Swelling and dissolution of cellulose part II: free floating cotton
and wood fibres in NaOH–water–additives Systems, Macromolecular Symposia, 244(1):19-30.

115
Dinand, E., Vignon, M., Chanzy, H., Heux, L., 2002, Mercerization of primary wall cellulose
and its implication for the conversion of cellulose I to cellulose II, Cellulose, 9:7-18.
Eyholzer, Ch., Bordeanu N., Lopez-Suevos, F., Rentsch D., Zimmermann T., Oksman, K., 2010,
Preparation and characterization of water-redispersible nanofibrillated cellulose in powder form,
Cellulose 17:19-30.
Fukuzumi, H., Saito, T., Iwata, T., Kumamoto, Y., Isogai, A., 2009, Transparent and high gas
barrier films of cellulose nanofibers prepared by TEMPO-mediated oxidation,
Biomacromolecules, 10:162-165.
Fukuzumi, H., Saito, T., Okita, Y., Isogai, A., 2010, Thermal stabilization of TEMPO-oxidized
cellulose, Polymer Degradation and Stability, 95:1502-1508.
Goodrich, J.D., Winter, W.T., 2007, α-Chitin Nanocrystals Prepared from Shrimp Shells and
Their Specific Surface Area Measurement, Biomacromolecules, 8:252-257.
Herrick, F.W., 1984, Redispersible microfibrillated cellulose, US patent 4,481,076.
Isogai, A., Atalla, R.H., 1998, Dissolution of cellulose in aqueous NaOH solutions, Cellulose, 5,
309-319.
Klemm, D., Kramer, F., Mortiz, S., Lindstrom, T., Ankerfors, M., Gray, D., Dorris, A., 2011,
Nanocelluloses: a new family of nature-based materials, Angew. Chem. Int. Ed., 50(24):5438-
5466.
Liu, Y., Hu, H., 2008, X-ray diffraction study of bamboo fibers treated with NaOH, Fibers and
Polymers, 9(6):735-739.
Mirahmadi, K., Kabir, M.M., Jeihanipour, A., Karimi, K., Taherzadeh, M.J., 2010, Alkaline
pretreatment of spruce and birch to improve bioethanol and biogas production, Bioresources,
5(2):928-938.

116
Nair, S.S., Zhu, J.Y., Deng, Y., Ragauskas, A.J., 2014, Characterization of cellulose
nanofibrillation by micro grinding, Journal of Nanoparticle Research, 16:2349.
Ougiya, H., Hioki, N., Watanabe, K., Morinaga, Y., Yoshinaga, F., Samejima, M., 1998,
Relationship between the physical properties and surface area of cellulose derived from
adsorbates of various molecular sizes, Bioscience. Biotechnology, and Biochemistry.,
62(10):1880-1884.
Saito, T., Hirota, M., Tamura, N., Kimura, S., Fukuzumi, H., Heuz, L., Isogai, A., 2009,
Individualization of nano-sized plant cellulose fibrils by direct surface carboxylation suing
TEMPO catalyst under neutral conditions, Biomacromolecules, 7:1687-1691.
Sharma, S. Nair, S.S., Zhang, Z., Ragauskas, A.J., Deng, Y., 2015, Characterization of micro
fibrillation process of cellulose and mercerized cellulose pulp, RSC Advances, 5:63111-63122.
Shibazaki, H., Kuga, S., Okano, T., 1997, Mercerization and acid hydrolysis of bacterial
cellulose, Cellulose, 4:75-87.
Simon, I., Glasser, L., Scheraga, H. A., Manley, R. S. J., 1998, Structure of cellulose. 2. low-
energy crystalline arrangements, Macromolecules, 21:990–998.
Sobue, H., Kiessig, H., Hess, K., 1939, The cellulose-sodium hydroxide-water system as a
function of the temperature, Z. Physik. Chem. B, 43:309–328.
Spence, K.L., Venditti, R.A., Rojas O.J., Habibi, Y., Pawlak, J.J., 2010, The effect of chemical
composition on microfibrillar cellulose films from wood pulps: water interactions and physical
properties for packaging applications, Cellulose, 17:835-848.
Swatloski, R.P., Spear, S.K., Holbrey, J.D., Rogers, R.D., 2002, Dissolution of Cellulose with
Ionic Liquids, Journal of American Chemical Society, 124:4974-4975.

117
Wang, H., Li, D., Yano, H., Abe, K., 2014, Preparation of tough cellulose II nanofibers with high
thermal stability from wood, Cellulose, 21:1505-1515.
Wang, Y., 2008, Cellulose fiber dissolution in sodium hydroxide solution at low temperature:
dissolution kinetics and solubility improvement, PhD dissertation, Georgia Institute of
Technology.
Wu, R.L., Wang, X., Li, F., Li, H., Wang, Y., 2009, Green composite films prepared from
cellulose, starch and lignin in room-temperature ionic liquid, Bioresource Technology,
100:2569–2574.
Yan, H. Lindstrom, T., Christiernin, M., 2006, Some ways to decrease fibre suspension
flocculation and improve sheet formation, Nordic Pulp & Paper Research Journal, 21(1):36-43.
Yano, H., Nakahara, S., 2004, Bio-composites produced from plant microfiber bundles with a
nanometer unit web-like network, Journal of Materials Science, 39:1635-1638.
Yue, Y., 2011, A comparative study of cellulose I and II fibers and nanocrystals, Master’s thesis,
Louisiana State University.

118
Table 4.1. Onset and DTG peak thermal degradation temperature of fibrillated cellulose fibers prepared with various NaOH solutions with or without CMC
Sample Crystallinity (%) Onset thermal degradation temperature (°C)
DTG peak thermal degradation temperature (°C)
f2NaOH 75.02 (1.86) 320.05 (3.93) 353.00 (2.41) f4NaOH 57.23 (1.58) 318.69 (2.69) 347.22 (2.34) f6NaOH 58.08 (9.52) 314.98 (1.57) 344.33 (4.67) fCMC2NaOH 75.64 (1.89) 304.83 (3.13) 342.78 (3.91) fCMC4NaOH N/A 305.73 (2.43) 345.67 (2.91) fCMC6NaOH 56.50 (4.85) 301.27 (0.53) 341.44 (1.02) Cellulose powder 74.57 (1.77) 327.60 (1.04) 360.11 (1.02) Standard CNF 73.12 (2.55) 316.78 (1.19) 348.56 (1.02) H-CMC-CNF 73.36 (0.36) 286.51 (0.28) 326.33 (0.00)
*Samples starting with “f” are fibrillated cellulose using a French cell press.
*Numbers enclosed in the parenthesis were standard deviations with n=3.
*N/A: Not available.

119
Figure 4.1. Summary of cellulose nanofibrils production procedure in this study
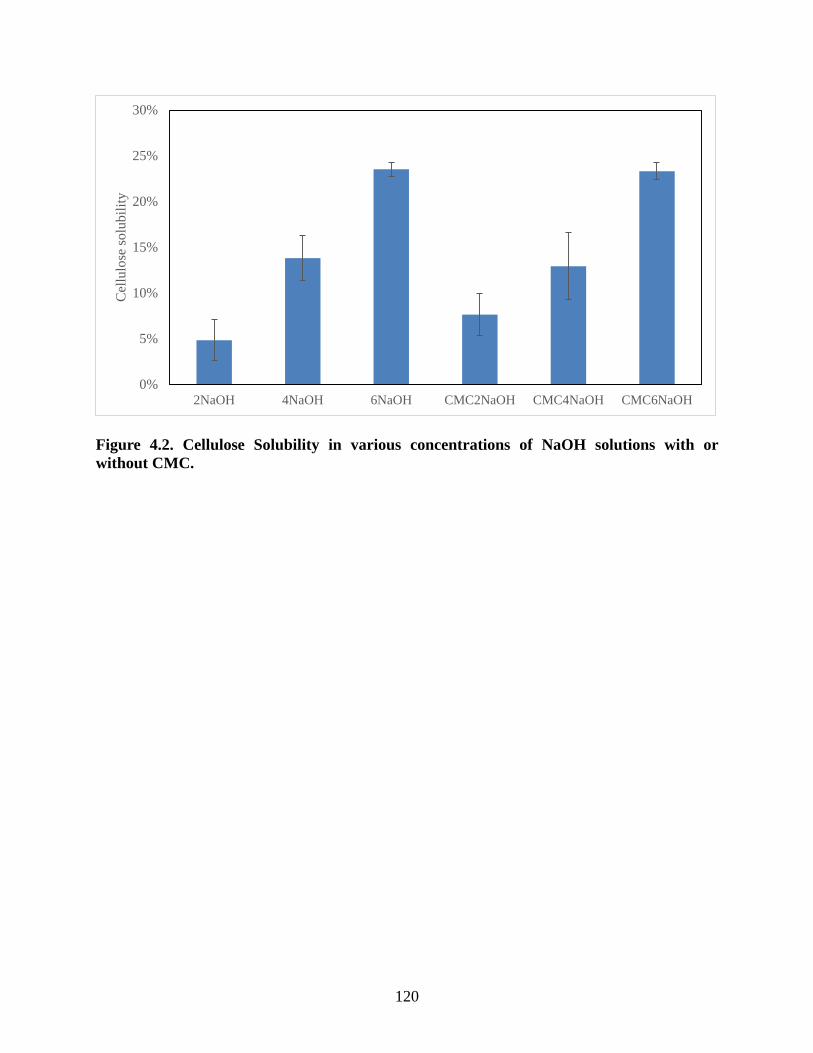
120
Figure 4.2. Cellulose Solubility in various concentrations of NaOH solutions with or without CMC.
0%
5%
10%
15%
20%
25%
30%
2NaOH 4NaOH 6NaOH CMC2NaOH CMC4NaOH CMC6NaOH
Cel
lulo
se so
lubi
lity
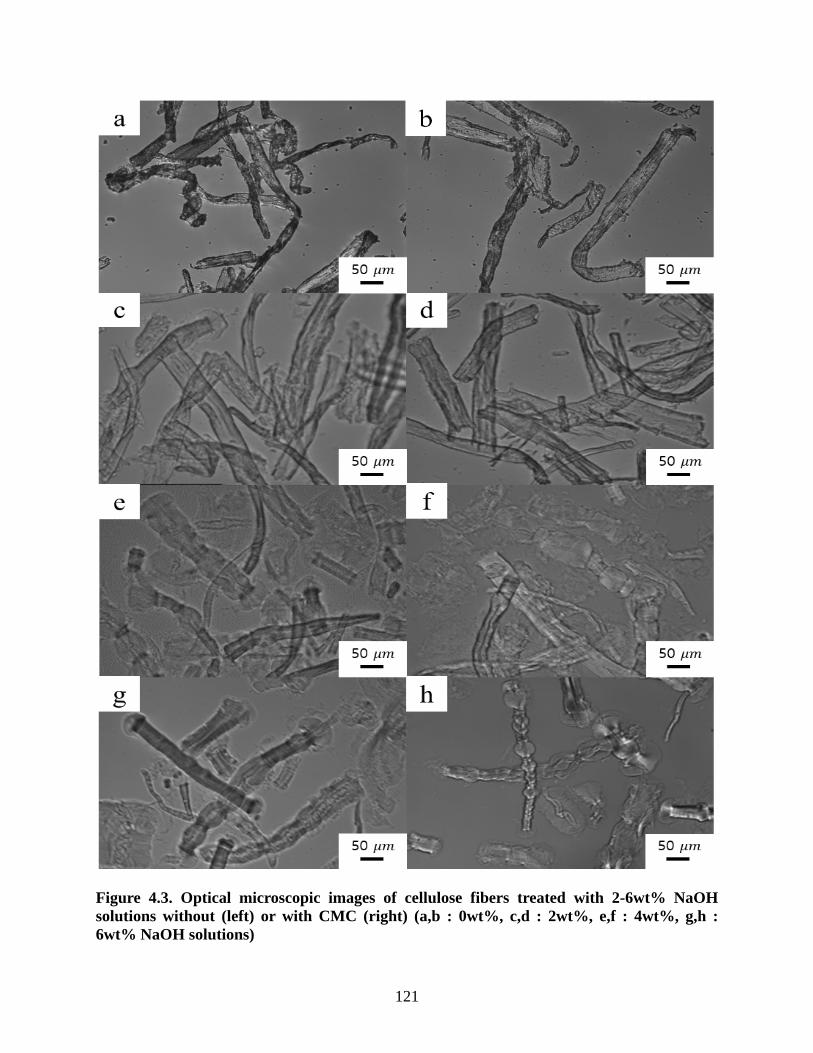
121
Figure 4.3. Optical microscopic images of cellulose fibers treated with 2-6wt% NaOH solutions without (left) or with CMC (right) (a,b : 0wt%, c,d : 2wt%, e,f : 4wt%, g,h : 6wt% NaOH solutions)
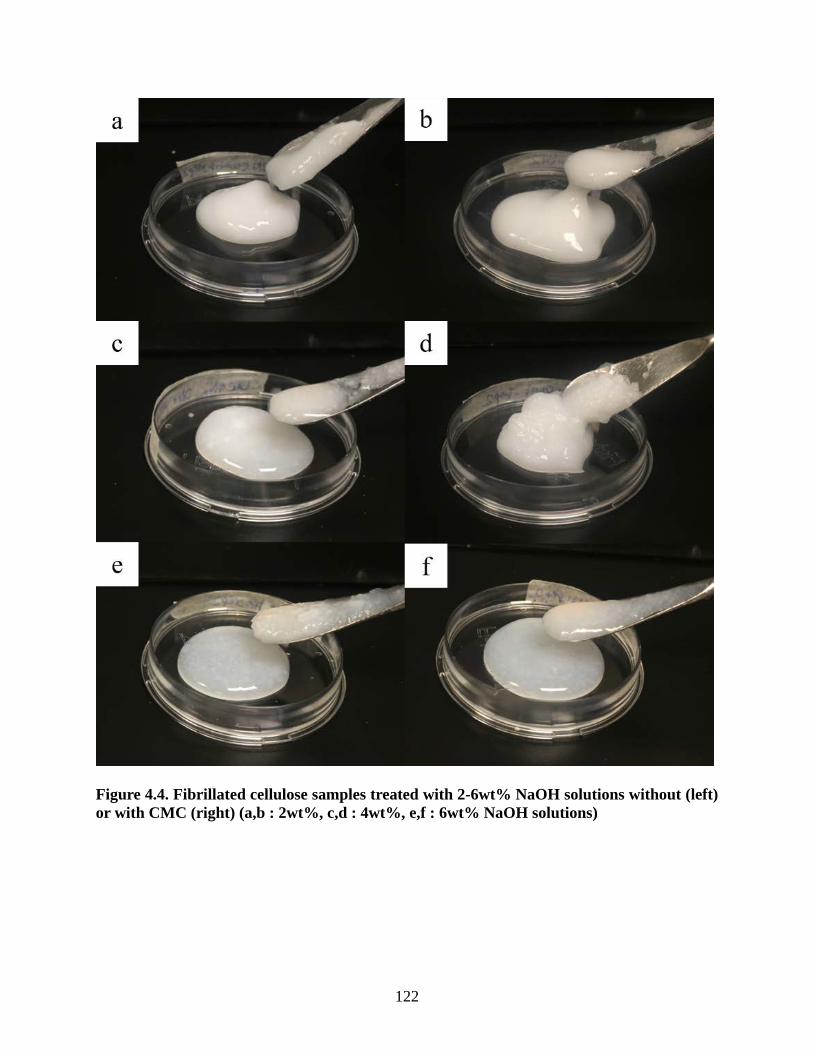
122
Figure 4.4. Fibrillated cellulose samples treated with 2-6wt% NaOH solutions without (left) or with CMC (right) (a,b : 2wt%, c,d : 4wt%, e,f : 6wt% NaOH solutions)

123
Figure 4.5. Dispersion states of the 0.1wt% fibrillated cellulose suspensions at 0, 10, 60 minutes and 24 hours (a: standard CNF, b: H-CMC-CNF, c: 2NaOH, d: CMC-2NaOH, e: 4NaOH, f: CMC-4NaOH, g: 6NaOH, and h: CMC-6NaOH)
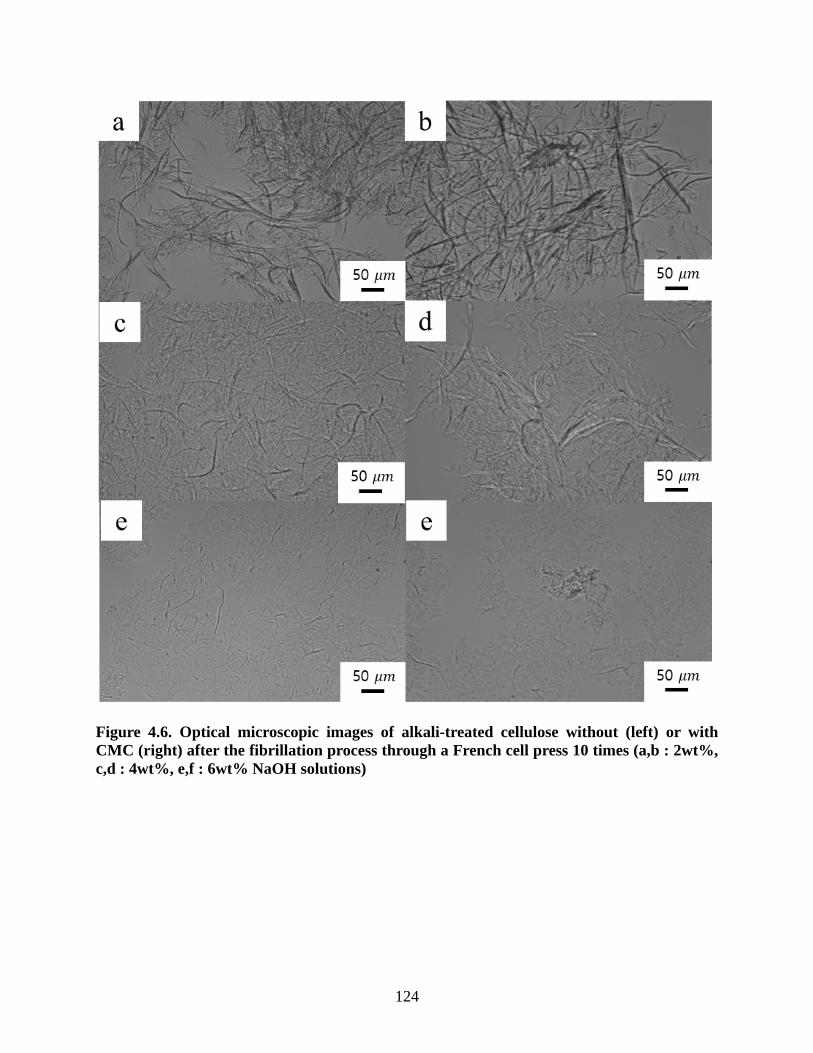
124
Figure 4.6. Optical microscopic images of alkali-treated cellulose without (left) or with CMC (right) after the fibrillation process through a French cell press 10 times (a,b : 2wt%, c,d : 4wt%, e,f : 6wt% NaOH solutions)

125
Figure 4.7. Optical microscopic images of fibrillated cellulose samples treated with 2-6wt% NaOH solutions without (left) or with CMC (right) (a,b : 2wt%, c,d : 4wt%, e,f : 6wt% NaOH solutions)
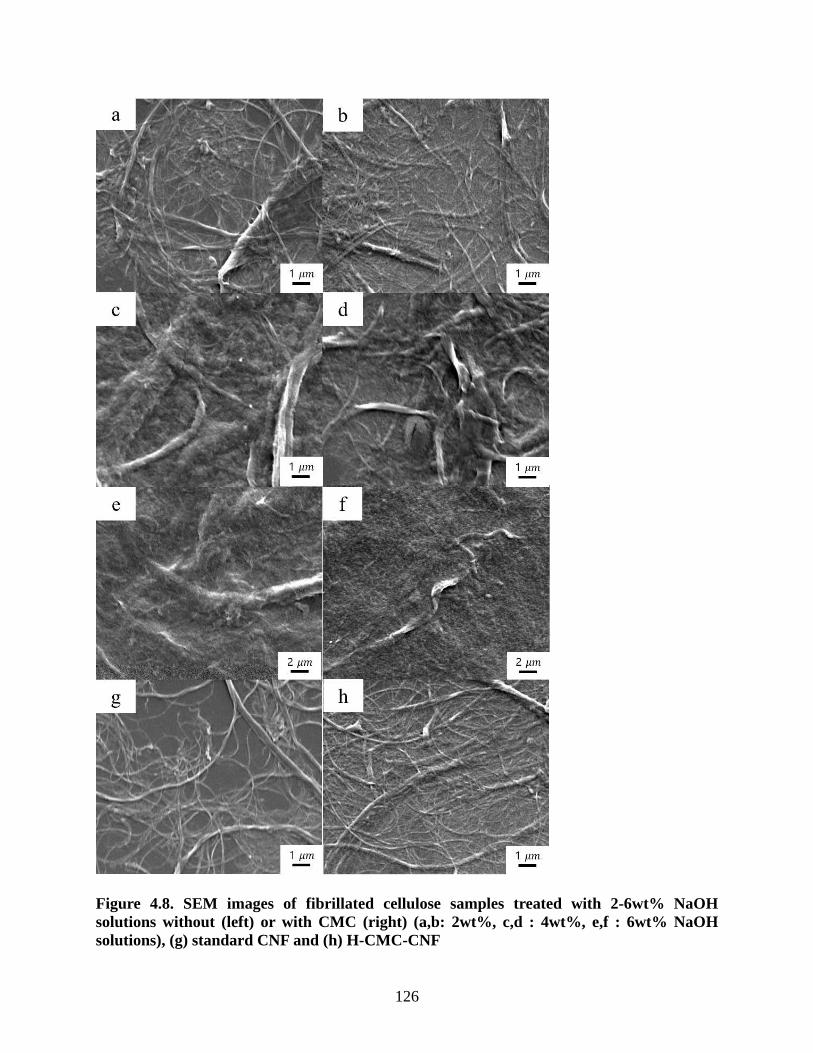
126
Figure 4.8. SEM images of fibrillated cellulose samples treated with 2-6wt% NaOH solutions without (left) or with CMC (right) (a,b: 2wt%, c,d : 4wt%, e,f : 6wt% NaOH solutions), (g) standard CNF and (h) H-CMC-CNF

127
Figure 4.9. Diameter distribution of (a) the fibrillated cellulose treated with 2wt% NaOH solution containing CMC, (b) standard CNF and (c) H-CMC-CNF.
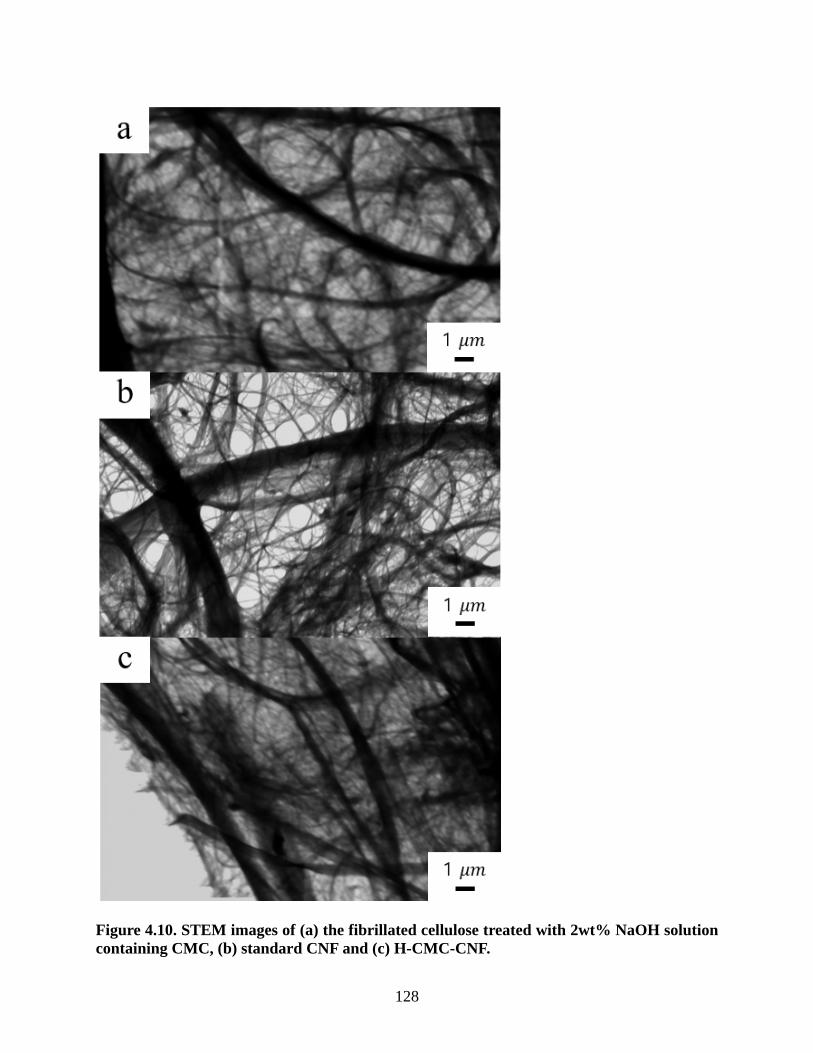
128
Figure 4.10. STEM images of (a) the fibrillated cellulose treated with 2wt% NaOH solution containing CMC, (b) standard CNF and (c) H-CMC-CNF.

129
Figure 4.11. Specific surface area of cellulose powder, the fibrillated cellulose treated with 2wt% NaOH solution containing CMC, standard CNF and H-CMC-CNF.
0
50
100
150
200
250
300
Celluose powder Fibrillated fiber(CMC2NaOH)
Standard CNF H-CMC-CNF
Spec
ific
Surf
ace
Are
a (m
2 /g)

130
Figure 4.12. XRD patterns of fibrillated cellulose treated with 2-6wt% NaOH solution (1) without or (2) with CMC (a,d :2wt%, b,e : 4wt%, c,f : 6wt% NaOH solution), (g) cellulose powder, (h) standard CNF, (i) H-CMC-CNF.

131
Figure 4.13. TG (top) and DTG (bottom) curves of fibrillated cellulose treated with 2-6wt% NaOH solution with or without CMC, standard CNF and H-CMC-CNF.
.
132
CHAPTER 5
LIFE CYCLE ASSESSMENT OF PRODUCING CELLULOSE NANOFIBRILS WITH
MECHANICAL AND ALKALINE PRETREATMENT
Lee, Hansol and Mani, Sudhagar
To be submitted to ACS Sustainable Chemistry & Engineering

133
Abstract
Cellulose nanofibrils (CNF) has received considerable attention due to its remarkable
mechanical properties and biodegradability. However, CNF production is still under
development owing to high energy consumption (as high as 70,000 kWh/ton). Therefore, it is
important to investigate life cycle energy use for producing CNF and its impacts on environment
and human. The objective of this study was to assess cradle-to-gate life cycle environmental
impacts of CNF produced from three different production routes: (1) the Valley beating route,
which includes mechanical pretreatment with a Valley beater, (2) the shear cutting route, which
includes mechanical pretreatment with a shear cutting mill and (3) alkaline pretreatment route,
which includes alkaline pretreatment using 2wt% NaOH solution. The results indicated that the
Valley beating route had the highest impact values relevant to energy input, such as global
warming potential and cumulative energy demand, followed by the shear cutting route and the
alkaline pretreatment route. On the other hand, the highest impact values relevant to water usage
were obtained from the alkaline pretreatment route due to high water input during neutralization.
When comparing the previous LCA results of CNF, all three routes had a relatively low
environmental impacts compared with the routes including chemical pretreatments and had
impacts of similar magnitude as the route without any pretreatment. In addition, a sensitive
analysis showed that the increase in CNF solid content was the most obvious way to reduce
environmental impacts of CNF production. Therefore, opportunities likely exist to reduce
environmental impacts for manufacturing CNF by using efficient methods to increase the solid
content of CNF.
Keyword: Life cycle assessment, Cellulose nanofibrils, Alkaline treatment, Valley beater, Shear
cutting mill, Homogenization, Environmental impacts.

134
Introduction 1.
Nanocellulose is an emerging bionanomaterial and has been increasingly produced in recent
years. The future global market size for nanocellulose is estimated to be 35 million tonnes/year
(Cowie et al. 2014). Cellulose nanofibrils (CNF) is one type of nanocellulose which typically has
a width of below 100 nm and a length of several micrometers. Due to its nano-scale dimensions,
it can form extensive network structures, and CNF film has a tensile strength of up to 310 MPa
with high transparency and low density of 0.8-1.5 gcm-3 (Yano and Nakahara 2004; Fukuzumi et
al. 2009; Saito et al. 2009; Abe and Yano, 2009). CNF can be used in various application fields,
such as food packaging, electronics, automotive, and biomedical applications. In addition, CNF
is renewable and biodegradable as forest biomass and energy grasses are abundantly renewable
feedstock and potential raw materials for manufacturing CNF.
The production process of cellulose nanofibrils involves pretreatment process and
mechanical disintegration process. Pretreatment process is where cellulose fibers become more
susceptible to be disintegrated using mechanical, chemical or/and enzymatic methods. In the
mechanical disintegration process, pretreated cellulose fibers are subjected to high impact and
shear forces and delaminated into individual nanofibrils. However, there are some challenges
that restrict CNF commercialization, such as high energy consumption (12,000-70,000 kwh/ton)
and clogging in the mechanical disintegration process (Klemm et al. 2011). Specifically, the high
energy requirement increases not only CNF manufacturing cost but also its environmental
impacts.
Life cycle assessment (LCA) is a reliable tool to evaluate environmental impacts of a
product on its entire life cycle, generally covering all relevant processes from raw material
extraction to final product disposal. LCA is used in new product research and development to

135
identify which step creates environmental impacts the most and what improvement can be made
against the benchmarking product. Three LCA studies related to cellulose nanofibrils have been
conducted (Hohenthal et al. 2012, Li et al. 2013; Arvidsson et al. 2015). Hohenthal et al. (2012)
assessed environmental impacts of CNF production from three different processing routes,
including 2,2,6,6,-tetramethylpiperidine-1-oxyl (TEMPO) oxidation or enzymatic pretreatment
with homogenization, and TEMPO oxidation with Cavitron dispersion. Unfortunately, this LCA
report did not clearly describe the source for quantitative inventory data. The LCA study
conducted by Li et al. (2013) investigated the environmental impacts of CNF production in the
United States using four different processing routes including two chemical pretreatment
processes (TEMPO oxidation and chloroacetic acid etherification) and two mechanical
disintegration processes (high pressure homogenization and sonication). The results showed that
the production route with TEMPO oxidation and homogenization had the lowest environmental
impacts; while the production route with etherification and sonication had the highest impacts.
Moreover, Arvidsson et al. (2015) assessed the life cycle environmental impacts of CNF
produced from three different production routes; (1) enzymatic pretreatment with
microfluidization, (2) carboxymethylation with microfluidization, and (3) high pressure
homogenization with no pretreatment. Carboxymethylation route had a comparatively high
impacts for all impact categories due to its high chemical consumption (30 kg of organic solvents
per one kg CNF). Although these three LCA study assessed the environmental impacts of
producing cellulose nanofibrils with various pretreatment techniques, the environmental impacts
of CNF production with a mechanical or an alkaline pretreatment process has been not studied.
Therefore, additional LCA study is needed to verify the environmental impacts of CNF
production using a mechanical or an alkaline pretreatment.
136
This LCA study assessed life cycle environmental impacts of CNF produced from three
different routes: (1) the Valley beating route, where a mechanical pretreatment in a Valley
beating and a mechanical disintegration are involved; (2) the shear cutting route, with a
mechanical pretreatment using a shear cutting mill and a mechanical disintegration process; and
(3) the alkaline pretreatment route, which includes a low-concentration NaOH treatment (2wt%)
and a mechanical disintegration process. The first production route is commonly used and
therefore is considered as a benchmarking process.
The ultimate goal of this LCA study is to assess the life cycle environmental impacts of
producing cellulose nanofibrils from the three different routes. This study also aims to
investigate the effects of mechanical pretreatment process on environmental impacts of CNF and
to find opportunities to reduce CNF environmental impacts by using alkaline pretreatment
instead of other chemical pretreatments.
LCA Scope and Functional unit definition 2.
The scope of this LCA study is defined as “cradle-to-gate”, including all processes from raw
material (bleached kraft pulp) production to CNF production as shown in Figure 5.1. This
boundary indicates that the use and disposal of CNF is not included since CNF has a wide range
of applications and its disposal would be different for every application. The inputs considered in
this study are bleached kraft pulp, direct processing energy (in the form of electricity), water and
chemicals, and the outputs include cellulose nanofibrils (final product), direct processing wastes
and emissions related to the production of raw materials and energy. The functional unit is
defined as one kg of cellulose nanofibrils on a dry basis, which is a common functional unit for
cradle-to-gate studies of nanomaterials (Figueirêdo et al. 2012; Kim and Fthenakis 2013;

137
Arvidsson et al. 2015). All input and output data were scaled up for producing one kg (dry
weight) of cellulose nanofibrils.
Process description 3.
3.1. Pulp production
Wood pulps are the most commonly-used feedstock for manufacturing CNF. In 2015, 19
out of 31 pilot or commercial-scale plants used wood pulps as a starting material (TAPPI Nano,
2015). Among various wood pulps, bleached kraft pulp is a dominating raw material for CNF
production. Data for manufacturing bleached kraft pulp is available in the US LCA database.
This data includes all input and output for all related processes to produce bleached kraft pulp
sheets from wood, such as forest operations, off-site chip production, on-site production of chips,
production of pulps, papermaking operations and transportation (AF&PA, 2010).
3.2. Valley beating route
A Valley beater is one of the common mechanical pretreatment methods for CNF
production where the pulps are looped around a well and refined between a rotor bar and loaded
bedplate (TAPPI T200 sp-01). Prior to the mechanical pretreatment process, bleached kraft pulp
sheets were assumed to be cut into small pieces and soaked in deionized water at least for four
hours. The mechanical pretreatment with a Valley beater is described by Spence et al. (2011).
The process was performed for three hours at the initial pulp consistency of 2%. Total energy
necessary for this process was calculated based on the report by Atic et al. (2005). The pretreated
cellulose pulp was assumed to be loaded into a high pressure homogenizer without drying and
passed through the homogenizer five times at operating pressure of 500-800 bar. Energy required
by the homogenizer was assumed to be 25,000 kWh/ton, which is considered as an average value
of energy required for the high pressure homogenization.

138
3.3. Shear cutting route
Shear cutting process is a proposed mechanical pretreatment in this study. The raw
material for this route was bleached kraft pulp sheets produced as described above. The pulp
sheet pieces were cut into small pieces and milled three times through a shear cutting mill,
known as a knife mill with a screen size of 0.25 mm. Energy required for shear cutting process
was measured using an energy data logger. Knife-milled cellulose powder was suspended and
heated with deionized water at a solid content of 2 wt.% together with carboxymethylcellulose
(CMC, 0.25wt% in water, average molecular weight: 250 kD). The cellulose suspension was
passed five times through a high pressure homogenizer at 500-800 bar. Energy for the high
pressure homogenization was assumed to be 25,000 kWh/ton as same as for the Valley beating
route. Other than energy, data for this processing route was obtained from experiments.
3.4. Alkaline pretreatment route
The alkaline pretreatment route started with bleached kraft pulp as other routes. Cellulose
powder was obtained using a shear cutting mill as described earlier. 2wt% NaOH solution was
prepared with carboxymethylcellulose (CMC, 0.25wt% in water, average molecular weight: 250
kD) and pre-cooled in a freezer. The frozen solid was broken into ice slush at room temperature.
Afterward, cellulose powder was added and mixed with the ice slush at the cellulose solid
content of 2wt.%, and then placed in an ice bath at least for 15 minutes. Cellulose/NaOH
aqueous slurry was left at room temperature to make sure all ice fragments were thawed. The
high pressure homogenization with three or four passes at 500-800 bar would be sufficient to
produce CNF from cellulose/NaOH suspension. Alkali-treated CNF was dialyzed against
deionized water until neutrality and filtrated to make a CNF gel at the solid content of 2wt%.
Data for this route was obtained from experiments.

139
3.5. Key assumptions
1. We assumed that high pressure homogenization in the Valley beating route and shear
cutting route is performed under the same operating conditions (e.g. the number of
processing cycles, operating pressure and cellulose solid content). Energy required
for this process is assumed to be 25,000 kWh/ton, which is considered as the average
value of energy for the high pressure homogenization.
2. Cellulose nanofibrils (CNF) was successfully prepared from alkali-treated cellulose
suspension after passing through a French cell press with 10 passes, while additional
5 passes were needed to obtain CNF from the cellulose aqueous suspension with
CMC. Thus, we can expect that alkali-treated cellulose nanofibrils would be
prepared using a high pressure homogenizer with the fewer number of processing
cycles than untreated cellulose nanofibrils was prepared. We assumed that the
mechanical disintegration process in the alkaline pretreatment route required two-
thirds of the energy required by the mechanical disintegration process in the shear
cutting route.
3. We assumed that cellulose nanofibrils was produced at the same plant where the raw
material (bleached kraft pulp) was produced. Therefore, transportation from the pulp
mill to the CNF plant was excluded in this study. Transportation for chemicals
(sodium hydroxide and carboxymethylcellulose) was not included as the production
routes with chemicals used are still at laboratory stage and the location of the
production units have not been determined. In addition, process equipment
manufacturing was also excluded since its contributions are considered negligible
over the life of the equipment.

140
4. Regarding the percent loss in mass during processing, it was basically assumed to be
3%. However, the mass lose percent was higher than 3% in some processes. In case
of the shear cutting process, the sample weight was measured before and after every
cycle, and approximately 5% of pulp in mass was lost after each cycle; thus, the total
mass loss percent after shear cutting with three cycles is estimated to be 15%. With
respect to the alkaline pretreatment route, total mass loss was measured and
determined to be 10% during homogenization, rinsing, and filtration.
5. For calculating the energy to freeze 2wt% NaOH solution, we assumed that heat
capacity and crystallization energy of 2wt% NaOH solution were the same as those
of water (4.18 kJ/kg ℃ and 333kJ/kg, respectively) for simplicity. Detailed
information is provided in the supporting information (SI) in Appendix C.
6. We assumed that 20% of energy used is released as heat to atmosphere during all
processes.
Life cycle inventory analysis (LCI) 4.
This LCA study was performed using the method as described by the ISO standard (ISO
14040, 2006). All input and output data used in this study were obtained from bench scale
experimental data, the LCI databases within Simapro version 8 (Ecoinvent v 3 and USLCI
v.1.6.0), and literature sources (Atic et al. 2005; AF&PA 2010; Spence 2011). USLCI database
was used to extract data for chemicals and materials used in this study. For some chemicals that
are not available from USLCI database, the European database was selected as similar
technologies are used to manufacture those selected chemicals. Electricity mix used in this study
was assumed to be a low-voltage average for the US grid (approximately 57% coal, 22% nuclear,
17% natural gas and 4% others) obtained from the USLCI database.

141
Table 5.1 summarizes the inputs for manufacturing one kg of cellulose nanofibrils using
three different production routes. Detailed input and output data is provided in the SI. The yield
of cellulose nanofibrils depended on the production route used. The mass yield of the final
product was 94%, 83% and 77% in the Valley beating route, shear cutting route and alkaline
pretreatment route, respectively (1.06 kg, 1.20 kg and 1.30 kg of the bleached kraft pulp was
used to prepare one kg of CNF, respectively). The difference between the Valley beating and
shear cutting routes is mainly attributed to that the shear cutting process was repeated three times
with 5% mass loss per every cycle. Thus, total 15% of pulp was lost after three-cycle shear
cutting process as mentioned earlier. The further decrease in the yield of alkali-treated CNF is
because the alkaline pretreatment route required additional neutralization and filtration process.
Major air emissions for producing one kg of cellulose nanofibrils in all three production
routes were described in Table 5.2. Fossil CO2 eq. emission was much higher than other air
emissions and ranged from 23.7 to 27.3 kg per kg of CNF. It was mainly generated from the
fossil fuels burned to produce electricity; therefore, the more energy-consuming route, the more
fossil CO2 was generated. If the electricity is generated from renewable sources, total CO2 eq.
emission would be greatly reduced by 60%. Biogenic CO2 came from hog fuel or natural gas
combusted for pulp production. As the alkaline pretreatment route required the highest amount of
bleached kraft pulp to produce CNF, this route had the largest biogenic CO2 eq. emission.
Life cycle impact assessment (LCIA) 5.
Life cycle impact assessment was performed using the impact assessment methods in the
Simapro package (TRACI v 4, BEES v 4.02 and CED v 1.08). Total eleven different impact
categories were evaluated. TRACI allowed us to analyze nine environmental impacts: global
warming, acidification, carcinogenics, non- carcinogenics, respiratory effects, eutrophication,

142
ecotoxicity, smog, and ozone depletion. Water intake and fossil energy consumption were
calculated by using BEES and CED method, respectively. Table 5.3 shows the cradle-to-gate life
cycle impacts of producing one kg of CNF from three different production routes, and Figure 5.2
presents the comparative life cycle impact assessment of these three routes. The Valley beating
route had the highest impacts for five impact categories: global warming, smog, acidification,
respiratory effects and fossil energy consumption since its total required energy was higher
compared with that of other two routes. The alkaline pretreatment route showed the lowest
impact values for these five categories as this route was the least energy-demanding route; while
it had the highest impact values for other six categories due to the high water consumption
during neutralization. In case of the shear cutting route, this route had the impact values in the
middle of the values of other two routes. The most investigated impact categories for
nanocellulose production, such as fossil energy consumption, global warming potential, water
intake, and eutrophication potential were further discussed in the following sections, see the SI
for the detailed results.
5.1. Fossil energy consumption
Fossil energy consumption is an important impact category since high energy use in the
mechanical disintegration process has been a main challenge in CNF production. The life cycle
assessment result showed that 95-99% of total energy for producing CNF was generated from
fossil-based resources. 403.73 MJ, 371.46 MJ and 350.96 MJ of fossil energy was required to
produce one kg of CNF from the Valley beating route, shear cutting route, and alkaline
pretreatment route, respectively. As expected, most of fossil energy (70%, 87%, and 58% for
each route) was consumed to generate electricity used for the mechanical disintegration process.
The Valley beating route consumed a higher amount of fossil energy than the shear cutting route

143
because the Valley beater is more energy-intensive compared with the shear cutting mill.
Besides, the alkaline pretreatment route had a lower fossil energy consumption than the shear
cutting route although it included additional steps for alkaline pretreatment. This is because the
alkaline pretreatment helps cellulose fibers to be delaminated, reducing the number of cycles and
thus energy requirement for the disintegration process. The effect of energy required for the
mechanical disintegration process on fossil energy consumption is further studied in the sensitive
analysis.
5.2. Global warming potential (GWP)
Global warming impact is calculated based on the global warming potentials due to
different greenhouse gases (GHG) produced during the life cycle of products manufactured,
mainly CO2, CH4 and N2O. The total global warming potential for the Valley beating route was
28.84 kg CO2 eq. as compared with 26.49 kg CO2 eq. and 25.07 kg O2 eq. for the shear cutting
route and the alkaline pretreatment route, respectively. The electricity usage for the mechanical
disintegration process was the main contributor to the global warming, producing 70%, 87%, and
58% of total greenhouse gases in the Valley beating route, shear cutting route, and alkaline
pretreatment route, respectively. In the first route, the electricity required for mechanical
pretreatment also contributed to the increase in GWP, generating 25% of total GHG emissions.
This indicated that replacing a Valley beater to a shear cutting mill could reduce total GHG
emissions of cellulose nanofibrils production. It is worth noting that the alkaline pretreatment
route had a less significant impact on global warming than the shear cutting route. This is
because using alkaline pretreatment reduced energy required for the mechanical disintegration
process as mentioned previously. Consequently, reducing the energy for the mechanical

144
disintegration process is the key to reduce total GWP of CNF production. This is further studied
in the sensitive analysis.
5.3. Water intake
The cradle-to-gate water intake of one kg of cellulose nanofibrils was 2,121 L, 4,319 L,
and 14,933 L for the Valley beating route, shear cutting route and the alkaline pretreatment route,
respectively. For the first route, the pulp production was the main process responsible for water
use, requiring 1,630 L of water. More specifically, 72% of total water (1,521 L) was needed to
produce sodium chlorate used for pulp bleaching. The shear cutting route requires a higher
amount of water than the Valley beating route due to the use of carboxymethylcellulose (CMC),
A total of 1,998 L water was used for CMC production. In addition, high water intake for the
alkaline pretreatment route was attributed to the neutralization process where 69% of the total
water required in this route was used. The total volume of water needed for neutralization was
approximately 20 times larger than the volume of alkali-treated cellulose nanofibrils as the nano-
scale structure of CNF would make difficulties in removing ions. If the water in this process is
recycled, the total water usage in the alkaline pretreatment route would be significantly reduced.
The effects of water recovery are further discussed in the sensitive analysis.
5.4. Eutrophication potential
Eutrophication potential is calculated based on the total amount of the substances that
contain available nitrogen or phosphorus. The eutrophication potential for the Valley beating
route was 6.40 g N eq. as compared with 8.45 g N eq. and 14.1 g N eq. for the shear cutting route
and the alkaline pretreatment route, respectively. The main process responsible for
eutrophication was different for each route. For the first route, the pulp production was the major
contributing factor to eutrophication. 43% of total N eq. emissions was generated from the pulp

145
production, mostly derived from the production of sodium chlorate used for pulp bleaching. The
shear cutting route had a higher eutrophication potential than the Valley beating route although
the energy required by a shear cutting mill was lower than by a Valley beater. This is mainly
because this route needed carboxymethylcellulose (CMC) of which production contributed to the
eutrophication. Specifically, 61% of total N eq. emissions (4.9 g N eq.) was released from the
mechanical disintegration process; 33% (2.8 g N eq.) from the electricity production and 25%
(2.1 g N eq.) from the CMC production. The highest eutrophication potential of the alkaline
pretreatment route was because this route included the neutralization process where a vast
amount of deionized water was consumed. Deionized water production generated approximately
5.5 g N eq. emission. As mentioned earlier, the reduced water use during neutralization would be
critical to reduce the impacts of the third cycle on eutrophication.
Sensitive analysis 6.
A sensitive analysis was conducted to investigate the uncertainties in the production routes
as the CNF production system is still under development (Figure 5.3). Four factors were
discussed in the sensitive analysis; (1) energy use for the mechanical pretreatment process (MP
energy) (2) energy use for the mechanical disintegration process (MD energy), (3) the final solid
content of cellulose nanofibrils, and (4) water use for neutralizing alkali-treated cellulose
nanofibrils. Firstly, we found the deviation in energy demand for both mechanical pretreatment
process and mechanical disintegration process. For instance, energy necessary for shear cutting
of bleached kraft pulp ranged from 1,096 kWh/ton to 1,727 kWh/ton. It was reported that energy
for high pressure homogenization reached as high as 70,000 kWh/ton (Eriksen et al. 2008). Thus,
the sensitivity of the energy required for the mechanical pretreatment process and mechanical
disintegration process was conducted using 20% deviation. Besides, cellulose nanofibrils is

146
usually produced at solid contents of 0.5-5%, mostly 2-3% using a high pressure homogenizer
(Turbak et al. 1983; Pääkkö et al. 2007; Kekäläinen et al. 2015). The increase in the solid content
could reduce specific energy consumption for producing CNF, leading to the reduction in the
environmental impacts. To analyze the effect of CNF solid content on the environmental impacts
of CNF, the sensitive analysis was performed with increased solid content of 5%. Lastly, the
high water use for neutralization is a major obstacle in the alkaline pretreatment route. As
mentioned earlier, if the water recycling system is introduced during the neutralization process,
the water consumption in this route would be significantly reduced; thus, the corresponding
environmental impacts would be also reduced. To investigate the sensitivity of water required for
neutralizing alkali-treated CNF, it is designed as the total water volume for the neutralization
process would be reduced by 80% if the water is efficiently recovered during the process.
6.1. Fossil energy consumption
Among the four factors, the change in CNF solid content made the remarkable change in
fossil energy consumption. With CNF solid content of 5%, fossil energy consumption was
reduced by 43%, 54%, and 53% for the Valley beating route, shear cutting route and alkaline
pretreatment route, respectively, since the increased CNF solid content led to the reduction in
specific energy for the mechanical disintegration process. Fossil energy consumption was also
sensitive to energy required for the mechanical disintegration process. When the energy for the
disintegration process was reduced by 20%, the total fossil energy consumption was reduced by
between 12% and 15%. Other two factors did not have a significant influence on fossil energy
consumption. Therefore, the considerable reduction in fossil energy use could be achieved by
increasing solid content of CNF and reducing energy use in the mechanical disintegration
process.
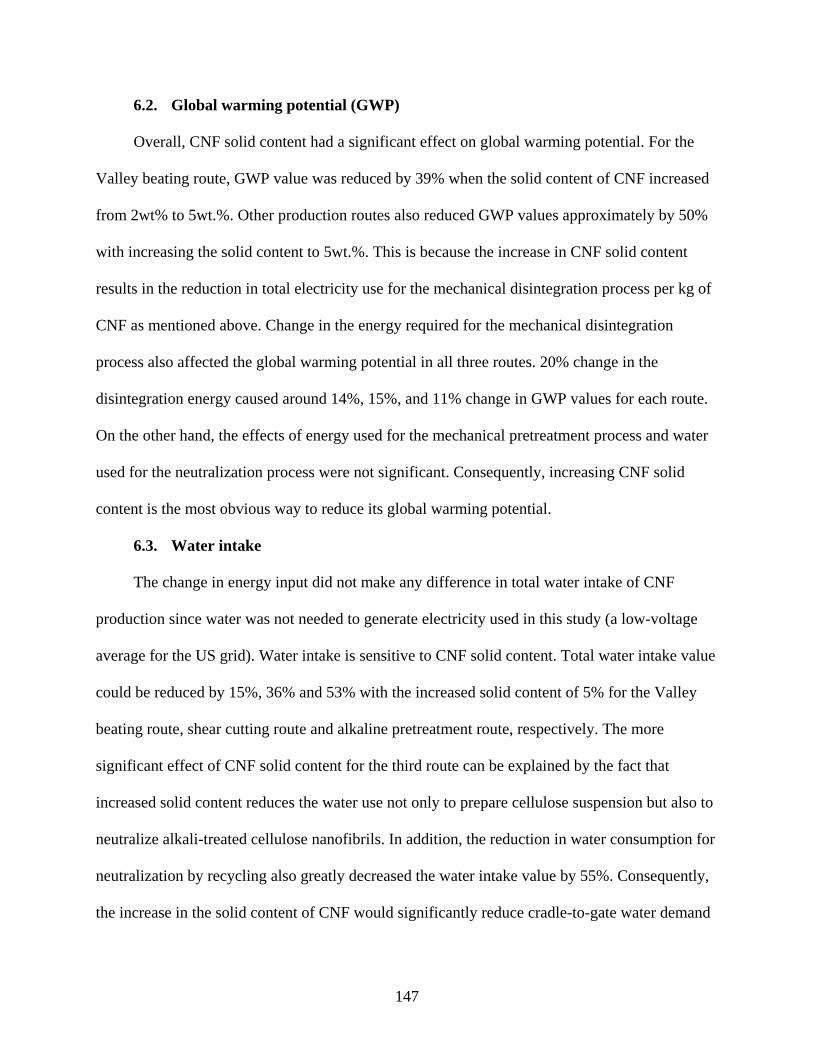
147
6.2. Global warming potential (GWP)
Overall, CNF solid content had a significant effect on global warming potential. For the
Valley beating route, GWP value was reduced by 39% when the solid content of CNF increased
from 2wt% to 5wt.%. Other production routes also reduced GWP values approximately by 50%
with increasing the solid content to 5wt.%. This is because the increase in CNF solid content
results in the reduction in total electricity use for the mechanical disintegration process per kg of
CNF as mentioned above. Change in the energy required for the mechanical disintegration
process also affected the global warming potential in all three routes. 20% change in the
disintegration energy caused around 14%, 15%, and 11% change in GWP values for each route.
On the other hand, the effects of energy used for the mechanical pretreatment process and water
used for the neutralization process were not significant. Consequently, increasing CNF solid
content is the most obvious way to reduce its global warming potential.
6.3. Water intake
The change in energy input did not make any difference in total water intake of CNF
production since water was not needed to generate electricity used in this study (a low-voltage
average for the US grid). Water intake is sensitive to CNF solid content. Total water intake value
could be reduced by 15%, 36% and 53% with the increased solid content of 5% for the Valley
beating route, shear cutting route and alkaline pretreatment route, respectively. The more
significant effect of CNF solid content for the third route can be explained by the fact that
increased solid content reduces the water use not only to prepare cellulose suspension but also to
neutralize alkali-treated cellulose nanofibrils. In addition, the reduction in water consumption for
neutralization by recycling also greatly decreased the water intake value by 55%. Consequently,
the increase in the solid content of CNF would significantly reduce cradle-to-gate water demand

148
for producing CNF. For the alkaline pretreatment route, the water recovery during neutralization
would be an additional way to reduce water intake.
6.4. Eutrophication potential
Eutrophication potential was sensitive to the solid content of cellulose nanofibrils as other
impacts. When CNF solid content was increased to 5wt% from 2wt%, eutrophication potential
was reduced by 26%, 37%, and 46% for Valley beating route, shear cutting route, and alkaline
pretreatment route, respectively. This is because the increased CNF solid content reduced
specific energy consumption as well as the total required amount of chemicals, such as
carboxymethylcellulose and sodium hydroxide. The introduction of water recovery system
during neutralization also notably reduced eutrophication potential for the alkaline pretreatment
route by 31%. In addition, 20% change in energy for the mechanical disintegration process
caused 8%, 9%, and 3% change in eutrophication for each route, while the change in energy for
mechanical pretreatment process did not significantly affect the eutrophication potential.
Consequently, all three routes could reduce their eutrophication potential by increasing CNF
solid content. The alkaline pretreatment route could further reduce by introducing the water
recovery system during neutralization.
7. Comparison to other carbon nanomaterials
The LCA results obtained in this study were compared with the previous LCA results of
producing carbon nanomaterials, such as cellulose nanofibrils (Li et al. 2013; Arvidsson et al.
2015); cellulose nanocrystals (Figueirêdo et al. 2012; Gu et al. 2015); and carbon nanotubes
(Gavankar et al. 2014).
The LCA study by Li et al. (2013) showed that GWP of lab-scale CNF production ranged
from 190 kg CO2 eq./kg to 1,160 kg CO2 eq./kg. The lowest value was obtained from TEMPO

149
oxidation and homogenization (TOHO) route, and the highest value was from chloroacetic acid
etherification and sonication (CESO) route. The cumulative energy demand (CED) value of
TOHO and CESO routes was 3,500 MJ/kg and 17,600 MJ/kg, respectively. Such high GWP and
CED values of CESO route are attributed to a high input of organic solvents (70 kg of ethanol
and isopropanol per kg CNF) and the absence of solvent recovery system. Arvidsson et al.
(2015) also demonstrated the CNF fabrication with chemical pretreatment by
carboxymethylation had the high impacts on GWP and CED. The carboxymethylation route
caused 100 kg CO2 eq./kg for GWP and 1,800 MJ/kg for CED. These values are much lower
than those reported by Li et al. since this route required a relatively low chemical input (30 kg
per kg CNF) and included solvent recovery. In this LCA study, CNF production route without
any pretreatment was also investigated. The results obtained were 1.2-23 kg CO2 eq./kg for GWP
and 240-320 MJ/kg for CED. The environmental impacts of CNF from the no pretreatment route
strongly depended on the electricity mix used since the electricity use for the mechanical
disintegration process is the main contributor to the CNF environmental impacts. The lowest
values were obtained with Swedish electricity mix, which has approximately half hydro and half
nuclear, and the highest values were obtained with a coal-dominated electricity mix which has
>90% coal.
Regarding the LCA results of cellulose nanocrystals (CNC) production, Figueirêdo et al.
(2012) reported that CNC production required a high amount of energy and water. 1,800-16,000
MJ of energy and 131-138 m3 of water were required, while 120-1,100 kg CO2 eq. emissions
was generated to produce one kg of CNC. Gu et al. (2015) assessed the life cycle impacts of
pilot-scale CNC production. The result obtained were 1,000 MJ for energy use, 29.6 kg CO2 eq.
for global warming potential and 50 g N eq. for eutrophication potential.

150
In addition, Gavankar et al. (2014) reviewed the energy use for CNT production. The
required energy for manufacturing one kg of CNT ranged from 480 MJ to 630,000 MJ. They also
reported the impacts of CNT production on global warming and eutrophication. The results
showed that direct and indirect CO2 eq. emission was 64,400 kg and 754,000 kg, respectively,
and total N eq. emission was 356 kg to manufacture one kg of single wall carbon nanotubes
(SWCNT). When comparing these previous LCA results for carbon nanomaterials, cellulose
nanofibrils produced from the three production routes in this study has low environmental
impacts compared with CNF produced with the chemical pretreatment and other carbon
nanomaterials, such as cellulose nanocrystals and carbon nanotubes. Its environmental impacts
were comparable to those of CNF produced without any pretreatment.
8. Conclusions
The present LCA study assessed the cradle-to-gate life cycle environmental impacts for
bench-scale cellulose nanofibrils production from three different production routes: (1) Valley
beating route, (2) Shear cutting route, and (3) Alkaline pretreatment route. The results of this
study showed that the alkaline pretreatment route had the highest values for water-related impact
categories, such as eutrophication and water intake, due to high water use during neutralization.
In contrast, this route had the lowest values for the energy-related impact categories, such as
global warming and fossil energy consumption. This is because that integration of mechanical
pretreatment with a shear cutting mill and alkaline pretreatment facilitates the mechanical
disintegration process easily, reducing the energy required for this process. Moreover, the
sensitive analysis results indicated that the increase in CNF solid content caused the most
significant reductions in environmental impacts of CNF produced from all three production

151
routes. Thus, opportunities exist to reduce environmental impacts of producing CNF by using
efficient disintegration methods which can increase CNF solid content.

152
References
Abe, K., Yano, H., 2009, Comparison of the characteristics of cellulose microfibril aggregates of
wood, rice straw and potato tuber, Cellulose, 16:1017–1023.
AF&PA, 2010, Printing & Writing Papers Life-Cycle Assessment Summary Report, American
Forest & Paper Association, Washington, DC, United States.
Arvidsson, R., Nguyen, D., Svanstrom M., 2015, Life cycle assessment of cellulose nanofibrils
production by mechanical treatment and two different pretreatment processes, Environ. Sci.
Technol., 49:6681-6890.
Atic, C., Immamoglu, S., Valchev, I., 2005, Determination of specific beating energy-applied on
certain pulps in a valley beater, J. Univ. Chem. Technol. Met., 40(3):199–204.
Cowie, J., Bilek, E.M., Wegner, T.H., Shatkin, J., 2014, Market projections of cellulose
nanomaterial-enabled Products-Part 2: Volume estimates, Tappi Journal, 13(6):57-67.
Figueirêdo, M.C.B., Rosa, M.F., Ugata, C.N.L., Filho M.S.M.S., Braid A.C.C.S., Melo, L.F.L.,
2012, Life cycle assessment of cellulose nanowhiskers, Journal of Cleaner Production, 35:130-
139.
Fukuzumi, H., Saito, T., Iwata, T., Kumamoto, Y., Isogai, A., 2009, Transparent and high gas
barrier films of cellulose nanofibers prepared by TEMPO-mediated oxidation,
Biomacromolecules, 10:162-165.
Gavankar, S., Suh, S., Keller, A.A., 2014, The role of scale and technology maturity in life cycle
assessment of emerging technologies, Journal of Industrial Ecology, 19(1):51-60.
Gu, H., Reiner, R., Bergman, R., Rudie, A., 2015, LCA study for pilot scale production of
cellulose nano crystals (CNC) from wood pulp, In:Proceedings from the LCA XV Conference –
A bright green future, Vancouver, British Columbia, Canada, 33-42.

153
Hohenthal, C., Ovasakainen, M., Bussini, D., Sadocco, P., Pajula, T., Hannele, L., Kautto, J.,
Salmenkivi, K., 2012, Final assessment of nanoenhanced new products, VTT Technical Research
Centre of Finland.
ISO 14040, 2006, Environmental Management – Life Cycle Assessment – Principle and
framework, International Organization for Standardization, Geneva, Switzerland.
Kekäläinen, K., Liimantainen, H., Biale, F., Niinimäki, J., 2015, Nanofibrillation of TEMPO-
oxidized bleached hardwood kraft cellulose at high solids content, Holzforschung, 69(9):1077-
1088.
Kim, H.C., Fthenakis, V., 2013, Life cycle energy and climate change implications of
nanotechnologies, Journal of Ind. Ecol., 17(4):528-541.
Klemm, D., Kramer, F., Mortiz, S., Lindstrom, T., Ankerfors, M., Gray, D., Dorris, A., 2011,
Nanocelluloses: a new family of nature-based materials, Angew. Chem. Int. Ed., 50(24):5438-
5466.
Li, Q., McGinnis, S., Sydnor, C., Wong, A., Renneckar, S., 2013, Nanocellulose life cycle
assessment, ACS Sustainable Chem.Eng., 1:919-928.
Pääkkö, M., Ankerfors, M., Kosonen, H., Nykänen, A., Ahola, S., Österberg, M., Ruokolainen,
J., Laine, J., Larsson, P., Ikkala, O., Lindström, T., 2007, Enzymatic hydrolysis combined with
mechanical shearing and high-pressure homogenization for nanoscale cellulose fibrils and strong
gels, Biomacromolecules, 8:1934–1941.
Saito, T., Hirota, M., Tamura, N., Kimura, S., Fukuzumi, H., Heuz, L., Isogai, A., 2009,
Individualization of nano-sized plant cellulose fibrils by direct surface carboxylation suing
TEMPO catalyst under neutral conditions, Biomacromolecules 7:1687-1691.
154
Spence, K.L., Benditti, R.A., Rojas, O.J., Habibi, Y., Pawlak, J.J., 2011, A comparative study of
energy consumption and physical properties of microfibrillated cellulose produced by different
processing methods, Cellulose, 18:1097-1111.
TAPPI, 2001, T200 sp-01, Laboratory beating of pulp (Valley beater method), Technical
Association of the Pulp and Paper Industry, Norcross, GA.
TAPPI NANO, 2015, Summary of International Activates on Cellulosic Nanomaterials,
Technical Association of the Pulp and Paper Industry, Norcross, GA, Available from:
http://www.tappinano.org/media/1096/tc6-world-cnm-activities-summary-july-29-2015.pdf, Last
assessed on 06/04/16.
Turbak, A.F., Snyder, F.W., Sandberg, K.R., 1983, Microfibrillated cellulose, a new cellulose
product: properties, uses, and commercial potential, J. Appl. Polym. Sci., 37: 815–827.
Yano, H., Nakahara, S., 2004, Bio-composites produced from plant microfiber bundles with a
nanometer unit web-like network, Journal of Materials Science, 39:1635-1638.

155
Table 5.1. Input inventory for producing 1kg of cellulose nanofibrils with three different
processing routes.
Production Route Input Unit Quantity Valley Beating Route
Mechanical Pretreatment Bleached kraft pulp kg 1.06 Deionized water L 52.03 Electricity kWh 9.54 Mechanical Disintegration Electricity kWh 25.75
Shear Cutting Route
Mechanical Pretreatment Bleached kraft pulp kg 1.2 Electricity kWh 1.79 Mechanical Disintegration Deionized water L 50.47 Carboxymethylcellulose kg 0.13 Electricity kWh 29.57
Alkaline Pretreatment Route
Mechanical Pretreatment Bleached kraft pulp kg 1.3 Electricity kWh 1.929634 Alkaline Pretreatment Deionized water L 53.36 Sodium hydroxide kg 1.09 Carboxymethylcellulose kg 0.14 Electricity kWh 6.3 Mechanical Disintegration Electricity kWh 18.52 Neutralization Deionized water L 1088.89 Electricity kWh 0.0022

156
Table 5.2. Emissions to air per kg cellulose nanofibrils from three production routes.
Substance Unit Valley beating route
Shear cutting route
Alkaline pretreatment route
Carbon dioxide, fossil kg 27.2690 25.0398 23.6769 Carbon dioxide, biogenic kg 1.2273 1.4074 1.7347 Sulfur dioxide kg 0.1808 0.1633 0.1513 Nitrogen oxides kg 0.0733 0.0670 0.0625 Methane kg 0.0564 0.0507 0.0467 Particulates, unspecified kg 0.0177 0.0161 0.0147 Carbon monoxide, fossil kg 0.0158 0.0151 0.0154 Isoprene kg 0.0122 0.0109 0.0097 Sulfur oxides kg 0.0082 0.0075 0.0068 Carbon dioxide kg 0.0049 0.0055 0.0060 Methane, fossil kg 0.0046 0.0054 0.0068 Particulates, > 10 um kg 0.0002 0.1704 0.1843

157
Table 5.3. Life cycle impact assessment of producing one kg of cellulose nanofibrils with
three different processing routes.
Impact category Unit Valley beating route
Shear cutting route
Alkaline pretreatment route
Ozone depletion kg CFC-11 eq. 1.57.E-07 2.95.E-07 8.81.E-07 Global warming kg CO2 eq. 28.84 26.49 25.07 Smog kg O3 eq. 1.95 1.79 1.67 Acidification mol H+ eq. 12.88 11.68 10.82 Eutrophication kg N eq. 6.40.E-03 8.45.E-03 1.41.E-02 Carcinogenics CTUh 2.88.E-07 3.41.E-07 4.71.E-07 Non carcinogenics CTUh 1.12.E-06 1.16.E-06 1.75.E-06 Respiratory effects kg PM10 eq. 3.54.E-02 3.27.E-02 3.13.E-02 Ecotoxicity CTUe 13.90 13.67 15.10 Water intake (BEES) liters 2120.80 4319.14 14933.48 Fossil energy consumption (CED) MJ 403.73 371.46 350.96

158
Figure 5.1. A flowchart of CNF production with three different production routes: (1) the
Valley beating route (to the left), (2) the shear cutting route (in the middle), and (3) the
alkaline pretreatment route (to the right).

159
Figure 5.2. Comparative life cycle impact assessments of three different routes; Valley
beating route, shear cutting route and alkaline pretreatment route (left to right in each
impact category).
0%
10%
20%
30%
40%
50%
60%
70%
80%
90%
100%O
zone
dep
letio
n
Glo
bal w
arm
ing
Smog
Aci
dific
atio
n
Eutro
phic
atio
n
Car
cino
geni
cs
Non
car
cino
geni
cs
Res
pira
tory
eff
ects
Ecot
oxic
ity
Wat
er in
take
(BEE
S)
Foss
il en
ergy
con
sum
ptio
n (C
ED)
Pulp production Mechanical pretreatment Alkali pretreatmentMechanical disintegration Neutralization

160
Figure 5.3. Sensitive analysis of four different factors on fossil energy consumption, global
warming potential, water intake and eutrophication potential.
161
CHAPTER 6
CONCLUSIONS AND RECOMMENDATIONS
Cellulose nanofibrils (CNF) is a promising biomaterial for manufacturing of
biodegradable composites, flexible electronics and biomedical scaffolds, but the commercial
production of CNF is still at an early stage due to high energy consumption and standardization
of CNF for specific applications. Several pretreatment methods have been developed to make
consistent grade CNF. In this study, cellulose nanofibrils was prepared from fluff cellulose pulp
with two alternative pretreatments: mechanical pretreatment using a shear cutting mill and
alkaline treatment with low-concentration NaOH (2wt.%). Firstly, shear cutting of fluff pulp
with three cycles produced very fine cellulose powder, which can be used as a precursor for CNF
production. The three-cycle cellulose powder had a geometric mean diameter of 70 𝜇m and the
bulk and tapped densities of 112 kg m-3 and 203 kg m-3, respectively and was successfully
disintegrated into cellulose nanofibrils using a French cell press without clogging issues. The
specific energy required by the shear cutting mill was relatively low (894 kWh/ton) compared
with that of other mechanical pretreatment methods. In addition, the shear cutting method
produces CNF precursors in the form of dry powder, which can be easily handled and stored.
Consequently, the shear cutting method is a potentially effective and economically favorable
mechanical pretreatment method for CNF production over other wet milling methods.
Cellulose nanofibrils with improved thermal stability was successfully produced by
processing cellulose powder with low-concentration NaOH solution (2wt.%) containing
carboxymethylcellulose (CMC) at low temperature, followed by mechanical disintegration

162
through a French cell press. Its characteristics were comparable with those of standard CNF
manufactured at pilot scale. It had an average diameter of 90 nm and a specific surface area of
248 m2g-1 and also presented an excellent dispersion behavior in water. It also exhibited a
relatively high thermal stability with the mean onset thermal degradation temperature of 305 ℃
and the mean DTG peak thermal degradation temperature of 343 ℃. In addition, low-
concentration NaOH had several advantages over conventional NaOH treatment (17-20 wt.%). It
used a lower amount of NaOH and therefore required a lower amount of water during
neutralization. CNF produced with low-concentration NaOH was obtained with a lower number
of homogenization cycles than that of CNF with high-concentration NaOH.
A cradle-to-gate life cycle assessment (LCA) for the production of CNF using three
different routes was conducted to evaluate energy and environmental impacts. The production
routes include conventional pretreatment using Valley beating, mechanical pretreatment using
shear cutting and a combination of shear cutting and low-concentration alkaline pretreatment.
The LCA results showed that the alkaline pretreatment route, which included mechanical
pretreatment with a shear cutting mill and alkaline pretreatment, had the lowest environmental
impacts on global warming and fossil energy consumption as the electricity energy required for
the mechanical disintegration was relatively low. However, the water usage during the
neutralization was a shortcoming in this route, leading to increased water intake and
eutrophication impacts. Sensitive analysis study showed that opportunities exist to reduce the
environmental impacts of CNF production by increasing CNF solid content and introducing
water recovery system during alkaline pretreatment.
An integration of pretreatment techniques with shear cutting and low-concentration
treatment is a promising approach to produce cellulose nanofibrils with low energy consumption,

163
improved thermal stability and overall reduction in environmental impacts. Nevertheless, the
proposed approach requires further research to validate at pilot-scale production and to evaluate
the economic feasibility of producing CNF at commercial scale. Future work can be focused on
optimizing the operating parameters and pilot scale testing of this approach to determine its
commercial potential.

164
APPENDIX A
Statistical analysis for Chapter 3:
“Mechanical pretreatment of fluff pulp to produce cellulose nanofibrils (CNF) precursors”
Summary
This appendix includes statistical analysis to determine the effects of grinding amount on the
grinding energy and rate, and the properties of the ground samples (Fines percentage, bulk
density and tapped density).

165
Criteria
Null hypothesis: There is no significant difference across the number of the grinding cycles (one
to three; zero to three for fines percentage).
One-way ANOVA test was performed with multiple comparisons by Tukey test.
F statistic is smaller than the critical value (p-value is smaller than 0.05), then we fail to reject
the null.
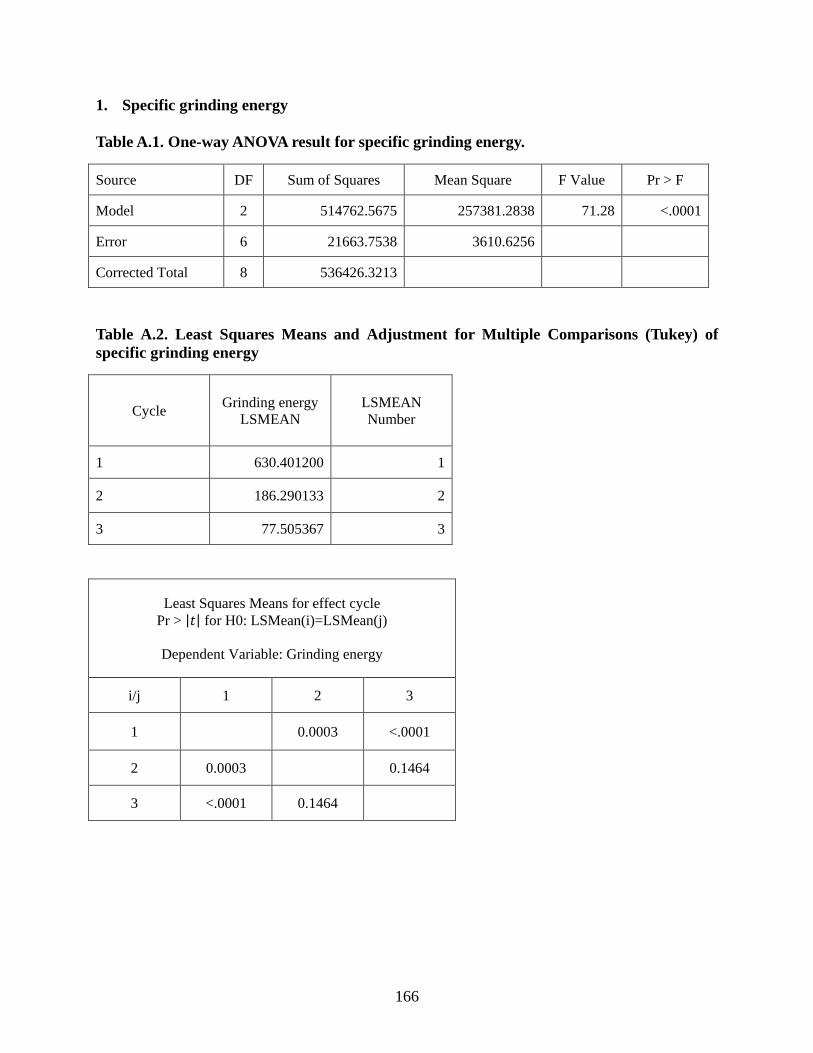
166
Specific grinding energy 1.
Table A.1. One-way ANOVA result for specific grinding energy.
Source DF Sum of Squares Mean Square F Value Pr > F
Model 2 514762.5675 257381.2838 71.28 <.0001
Error 6 21663.7538 3610.6256
Corrected Total 8 536426.3213
Table A.2. Least Squares Means and Adjustment for Multiple Comparisons (Tukey) of specific grinding energy
Cycle Grinding energy LSMEAN
LSMEAN Number
1 630.401200 1
2 186.290133 2
3 77.505367 3
Least Squares Means for effect cycle Pr > |𝑡| for H0: LSMean(i)=LSMean(j)
Dependent Variable: Grinding energy
i/j 1 2 3
1 0.0003 <.0001
2 0.0003 0.1464
3 <.0001 0.1464

167
Grinding rate 2.
Table A.3. One-way ANOVA result for grinding rate.
Source DF Sum of Squares Mean Square F Value Pr > F
Model 2 1126.913360 563.456680 44.39 0.0003
Error 6 76.153372 12.692229
Corrected Total 8 1203.066732
Table A.4. Least Squares Means and Adjustment for Multiple Comparisons (Tukey) of grinding rate.
Cycle Grinding rate LSMEAN
LSMEAN Number
1 7.4191667 1
2 23.0713333 2
3 34.7315000 3
Least Squares Means for effect cycle Pr > |𝑡| for H0: LSMean(i)=LSMean(j)
Dependent Variable: Grinding rate
i/j 1 2 3
1 0.0041 0.0002
2 0.0041 0.0166
3 0.0002 0.0166
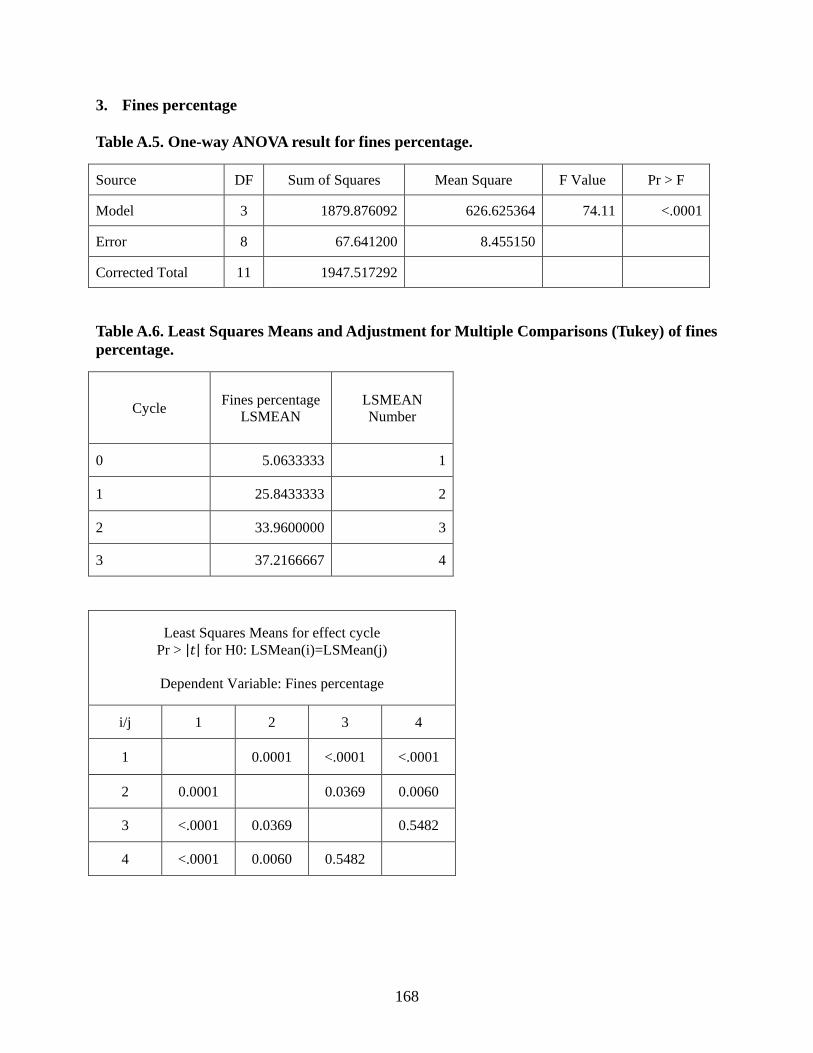
168
Fines percentage 3.
Table A.5. One-way ANOVA result for fines percentage.
Source DF Sum of Squares Mean Square F Value Pr > F
Model 3 1879.876092 626.625364 74.11 <.0001
Error 8 67.641200 8.455150
Corrected Total 11 1947.517292
Table A.6. Least Squares Means and Adjustment for Multiple Comparisons (Tukey) of fines percentage.
Cycle Fines percentage LSMEAN
LSMEAN Number
0 5.0633333 1
1 25.8433333 2
2 33.9600000 3
3 37.2166667 4
Least Squares Means for effect cycle Pr > |𝑡| for H0: LSMean(i)=LSMean(j)
Dependent Variable: Fines percentage
i/j 1 2 3 4
1 0.0001 <.0001 <.0001
2 0.0001 0.0369 0.0060
3 <.0001 0.0369 0.5482
4 <.0001 0.0060 0.5482

169
Bulk density 4.
Table A.7. One-way ANOVA result for bulk density.
Source DF Sum of Squares Mean Square F Value Pr > F
Model 2 858.8527281 429.4263640 70.74 <.0001
Error 12 72.8438954 6.0703246
Corrected Total 14 931.6966235
Table A.8. Least Squares Means and Adjustment for Multiple Comparisons (Tukey) of bulk density.
Cycle Bulk density LSMEAN
LSMEAN Number
1 94.106360 1
2 96.692620 2
3 111.294120 3
Least Squares Means for effect cycle Pr > |𝑡| for H0: LSMean(i)=LSMean(j)
Dependent Variable: Bulk density
i/j 1 2 3
1 0.2599 <.0001
2 0.2599 <.0001
3 <.0001 <.0001

170
Tapped density 5.
Table A.9. One-way ANOVA result for tapped density.
Source DF Sum of Squares Mean Square F Value Pr > F
Model 2 3215.056105 1607.528052 369.86 <.0001
Error 12 52.155509 4.346292
Corrected Total 14 3267.211613
Table A.10. Least Squares Means and Adjustment for Multiple Comparisons (Tukey) of tapped density.
Cycle Tapped density LSMEAN
LSMEAN Number
1 169.403040 1
2 176.268400 2
3 203.317960 3
Least Squares Means for effect cycle Pr > |𝑡| for H0: LSMean(i)=LSMean(j)
Dependent Variable: Tapped density
i/j 1 2 3
1 0.0006 <.0001
2 0.0006 <.0001
3 <.0001 <.0001
171
APPENDIX B
Statistical analysis for Chapter 4:
“Development of thermally stable cellulose nanofibrils using low-concentration alkaline
treatment”
Summary
This appendix includes statistical analysis to determine the effects of NaOH concentrations and
CMC addition on cellulose solubility and the properties of the fibrillated cellulose samples
(crystallinity, and onset and DTG peak thermal degradation temperate).

172
Criteria
Null hypothesis: There is no significant difference across the NaOH concentration (0, 2, 4, and 6
wt.%) and whether CMC is added or not.
Two-way ANOVA test was performed with multiple comparisons by Tukey test.
F statistic is smaller than the critical value (p-value is smaller than 0.05), then we fail to reject
the null.
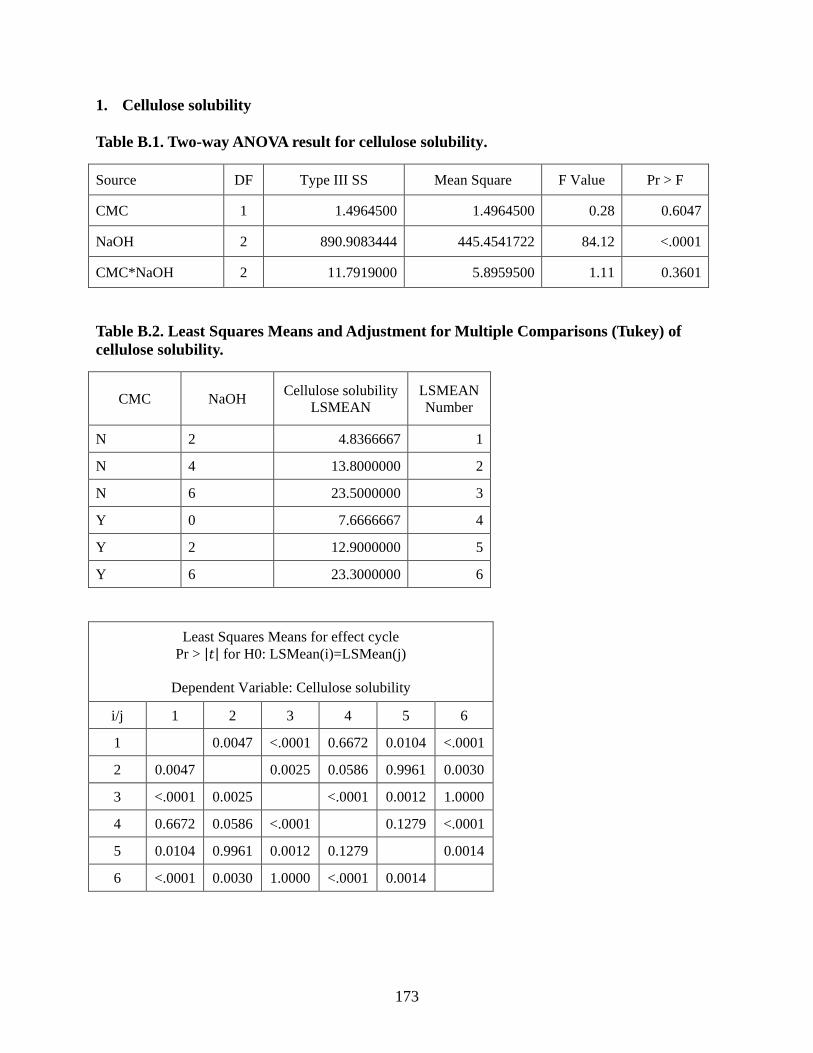
173
Cellulose solubility 1.
Table B.1. Two-way ANOVA result for cellulose solubility.
Source DF Type III SS Mean Square F Value Pr > F
CMC 1 1.4964500 1.4964500 0.28 0.6047
NaOH 2 890.9083444 445.4541722 84.12 <.0001
CMC*NaOH 2 11.7919000 5.8959500 1.11 0.3601
Table B.2. Least Squares Means and Adjustment for Multiple Comparisons (Tukey) of cellulose solubility.
CMC NaOH Cellulose solubility LSMEAN
LSMEAN Number
N 2 4.8366667 1
N 4 13.8000000 2
N 6 23.5000000 3
Y 0 7.6666667 4
Y 2 12.9000000 5
Y 6 23.3000000 6
Least Squares Means for effect cycle Pr > |𝑡| for H0: LSMean(i)=LSMean(j)
Dependent Variable: Cellulose solubility
i/j 1 2 3 4 5 6
1 0.0047 <.0001 0.6672 0.0104 <.0001
2 0.0047 0.0025 0.0586 0.9961 0.0030
3 <.0001 0.0025 <.0001 0.0012 1.0000
4 0.6672 0.0586 <.0001 0.1279 <.0001
5 0.0104 0.9961 0.0012 0.1279 0.0014
6 <.0001 0.0030 1.0000 <.0001 0.0014

174
Cellulose crystallinity 2.
Table B.3. Two-way ANOVA result for cellulose crystallinity.
Source DF Type III SS Mean Square F Value Pr > F
CMC 1 5.736296 5.736296 0.28 0.6059
NaOH 3 1215.046897 405.015632 19.92 <.0001
CMC*NaOH 1 11.760000 11.760000 0.58 0.4629
Table B.4. Least Squares Means and Adjustment for Multiple Comparisons (Tukey) of cellulose crystallinity
CMC NaOH Cellulose
crystallinity LSMEAN
LSMEAN Number
N 2 75.0333333 1
N 4 57.2000000 2
N 6 58.0666667 3
Y 0 73.3666667 4
Y 2 75.6666667 5
Y 6 54.5000000 6
Least Squares Means for effect cycle Pr > |𝑡| for H0: LSMean(i)=LSMean(j)
Dependent Variable: Cellulose crystallinity
i/j 1 2 3 4 5 6
1 0.0052 0.0074 0.9969 1.0000 0.0041
2 0.0052 0.9999 0.0104 0.0040 0.9835
3 0.0074 0.9999 0.0151 0.0057 0.9471
4 0.9969 0.0104 0.0151 0.9866 0.0077
5 1.0000 0.0040 0.0057 0.9866 0.0033
6 0.0041 0.9835 0.9471 0.0077 0.0033

175
Onset thermal degradation temperature 3.
Table B.5. Two-way ANOVA result for onset thermal degradation temperature.
Source DF Type III SS Mean Square F Value Pr > F
CMC 1 754.9203857 754.9203857 110.42 <.0001
NaOH 3 712.8935092 237.6311697 34.76 <.0001
CMC*NaOH 2 3.8123744 1.9061872 0.28 0.7614
Table B.6. Least Squares Means and Adjustment for Multiple Comparisons (Tukey) of onset thermal degradation temperature.
CMC NaOH Onset thermal
degradation temp. LSMEAN
LSMEAN Number
N 2 320.046667 1
N 4 318.686667 2
N 6 314.980000 3
Y 0 286.510000 4
Y 2 304.833333 5
Y 4 305.850000 6
Y 6 301.060000 7
Least Squares Means for effect cycle Pr > |𝑡| for H0: LSMean(i)=LSMean(j)
Dependent Variable: Onset thermal degradation temp.
i/j 1 2 3 4 5 6 7
1 0.9939 0.2872 <.0001 0.0002 0.0010 <.0001
2 0.9939 0.6076 <.0001 0.0004 0.0023 0.0001
3 0.2872 0.6076 <.0001 0.0063 0.0291 0.0012
4 <.0001 <.0001 <.0001 <.0001 <.0001 0.0008
5 0.0002 0.0004 0.0063 <.0001 0.9993 0.6959
6 0.0010 0.0023 0.0291 <.0001 0.9993 0.5531
7 <.0001 0.0001 0.0012 0.0008 0.6959 0.5531

176
DTG peak thermal degradation temperature 4.
Table B.7. Two-way ANOVA result for DTG peak thermal degradation temperature.
Source DF Type III SS Mean Square F Value Pr > F
CMC 1 85.3856679 85.3856679 9.45 0.0097
NaOH 3 716.4207021 238.8069007 26.42 <.0001
CMC*NaOH 2 67.8668423 33.9334212 3.75 0.0542
Table B.8. Least Squares Means and Adjustment for Multiple Comparisons (Tukey) of DTG peak thermal degradation temperature.
CMC NaOH DTG Peak thermal degradation temp.
LSMEAN
LSMEAN Number
N 2 353.000000 1
N 4 347.223333 2
N 6 344.333333 3
Y 0 326.330000 4
Y 2 342.776667 5
Y 4 346.665000 6
Y 6 341.000000 7
Least Squares Means for effect cycle Pr > |𝑡| for H0: LSMean(i)=LSMean(j)
Dependent Variable: DTG Peak thermal degradation temp
i/j 1 2 3 4 5 6 7
1 0.2952 0.0475 <.0001 0.0166 0.3137 0.0117
2 0.2952 0.8900 <.0001 0.5648 1.0000 0.3311
3 0.0475 0.8900 0.0001 0.9940 0.9739 0.8758
4 <.0001 <.0001 0.0001 0.0003 0.0001 0.0024
5 0.0166 0.5648 0.9940 0.0003 0.7839 0.9934
6 0.3137 1.0000 0.9739 0.0001 0.7839 0.5238
7 0.0117 0.3311 0.8758 0.0024 0.9934 0.5238
177
APPENDIX C
Supporting Information for Chapter 5:
“Life cycle assessment of producing cellulose nanofibrils with mechanical and alkaline
pretreatment”
Summary
This appendix contains the calculation for freezing energy needed to freeze the alkali solutions
(Section 1), the inventory data for producing cellulose nanofibrils from three different production
routes (Section 2 and Tables C1-C3) and the detailed results of the life cycle impact assessment
(Section 3 and Table C4) and the sensitive analysis (Section 4 and Table C5).
178
Energy calculation for freezing alkali solutions 1.
In the alkaline pretreatment route, 2wt% NaOH solution was prepared and frozen before
cellulose powder was added. The energy required for freezing the NaOH solution was calculated
with the assumption that heat capacity and crystallization energy of the NaOH solution are the
same as those of water. First, the energy needed to cool it down from room temperature (20 ℃)
to 0 ℃ was calculated using the following equation:
E = 𝑐 × m × ∆T
where E is the required energy for the temperature change, c is the heat capacity of the solvent,
m is the mass of the solvent, and ∆T is the temperature change.
In this case, the heat capacity of the solvent is assumed to be the same as that of water
(4.18kJ/kg ℃), and the weight of the NaOH solution required for producing 1kg of cellulose
nanofibrils is 54.44 kg. Therefore, the required energy for the temperature change is estimated to
be 4,552 kJ per 1kg of CNF.
Moreover, the energy for changing from liquid to solid is also needed. It takes 333 kJ to
crystallize 1kg of water, thus, 18,130 kJ of energy would be required to crystallize 54.44kg of
NaOH solution for manufacturing 1kg of CNF. Consequently, the total energy necessary for
freezing the NaOH solution is calculated as 22,682 kJ for producing 1kg of CNF.
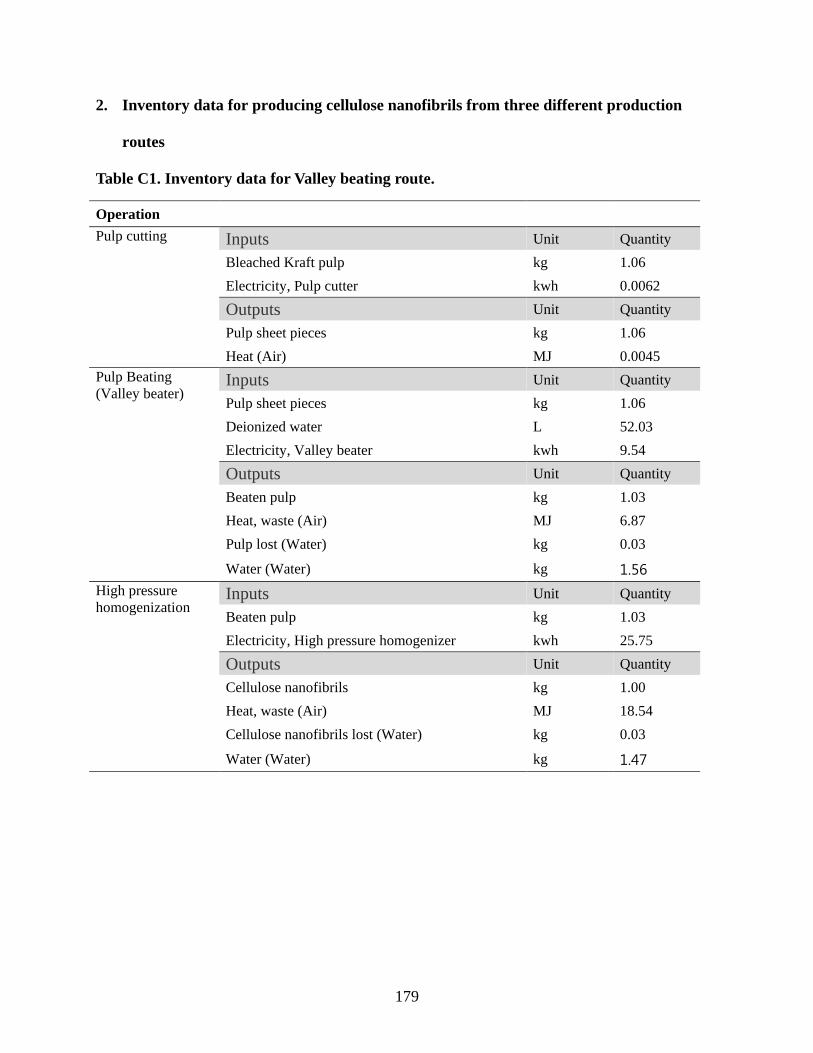
179
Inventory data for producing cellulose nanofibrils from three different production 2.
routes
Table C1. Inventory data for Valley beating route.
Operation Pulp cutting Inputs Unit Quantity
Bleached Kraft pulp kg 1.06 Electricity, Pulp cutter kwh 0.0062
Outputs Unit Quantity Pulp sheet pieces kg 1.06 Heat (Air) MJ 0.0045
Pulp Beating (Valley beater)
Inputs Unit Quantity Pulp sheet pieces kg 1.06 Deionized water L 52.03 Electricity, Valley beater kwh 9.54
Outputs Unit Quantity Beaten pulp kg 1.03 Heat, waste (Air) MJ 6.87 Pulp lost (Water) kg 0.03
Water (Water) kg 1.56 High pressure homogenization
Inputs Unit Quantity Beaten pulp kg 1.03 Electricity, High pressure homogenizer kwh 25.75
Outputs Unit Quantity Cellulose nanofibrils kg 1.00 Heat, waste (Air) MJ 18.54 Cellulose nanofibrils lost (Water) kg 0.03
Water (Water) kg 1.47
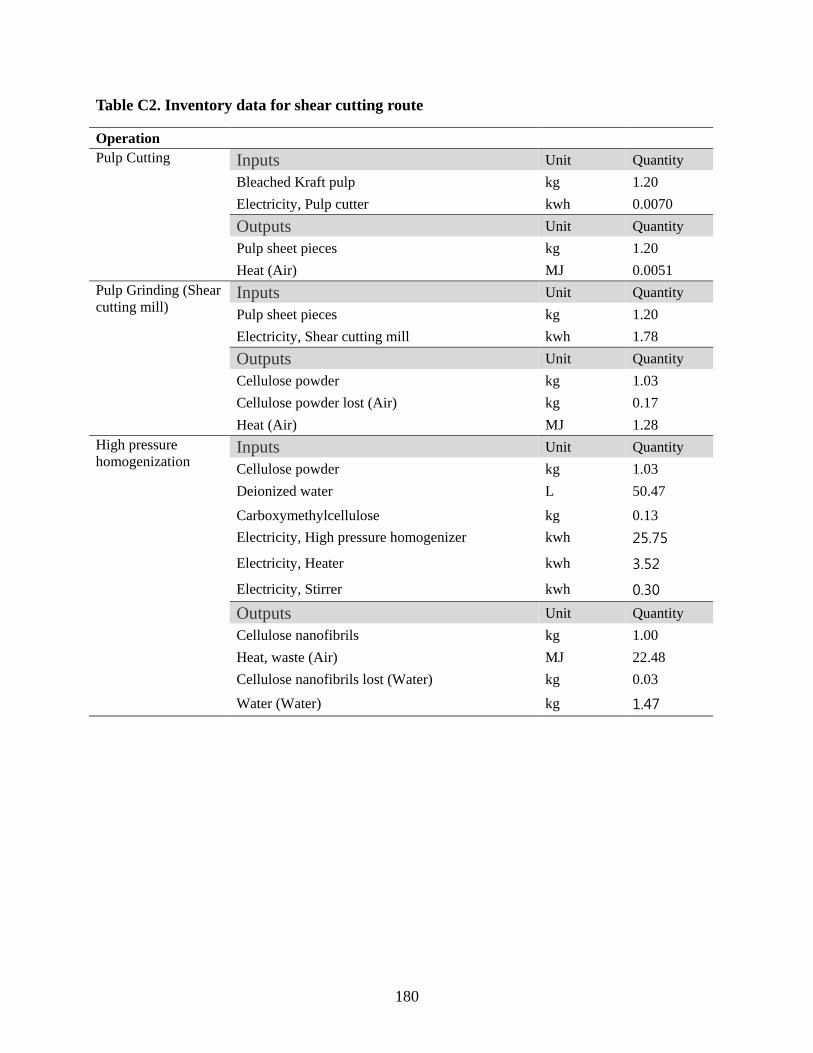
180
Table C2. Inventory data for shear cutting route
Operation Pulp Cutting Inputs Unit Quantity
Bleached Kraft pulp kg 1.20 Electricity, Pulp cutter kwh 0.0070 Outputs Unit Quantity Pulp sheet pieces kg 1.20 Heat (Air) MJ 0.0051
Pulp Grinding (Shear cutting mill)
Inputs Unit Quantity Pulp sheet pieces kg 1.20 Electricity, Shear cutting mill kwh 1.78 Outputs Unit Quantity Cellulose powder kg 1.03 Cellulose powder lost (Air) kg 0.17 Heat (Air) MJ 1.28
High pressure homogenization
Inputs Unit Quantity Cellulose powder kg 1.03 Deionized water L 50.47
Carboxymethylcellulose kg 0.13 Electricity, High pressure homogenizer kwh 25.75
Electricity, Heater kwh 3.52
Electricity, Stirrer kwh 0.30
Outputs Unit Quantity Cellulose nanofibrils kg 1.00 Heat, waste (Air) MJ 22.48 Cellulose nanofibrils lost (Water) kg 0.03
Water (Water) kg 1.47

181
Table C3. Inventory data for alkaline pretreatment route
Operation Pulp cutting Inputs Unit Quantity
Bleached Kraft pulp kg 1.30
Electricity, Pulp cutter kwh 0.0076
Outputs Unit Quantity
Pulp sheet pieces kg 1.30
Heat (Air) MJ 0.0055 Pulp Grinding (Shear cutting mill)
Inputs Unit Quantity
Pulp sheet pieces kg 1.30
Electricity, Shear cutting mill kwh 1.92
Outputs Unit Quantity
Cellulose powder kg 1.11
Cellulose powder lost (Air) kg 0.18
Heat (Air) MJ 1.38 Alkaline pretreatment
Inputs Unit Quantity Cellulose powder kg 1.11 Deionized water L 53.36 Sodium hydroxide kg 1.09 Carboxymethylcellulose kg 0.14 Electricity, Freezer kwh 6.30
Outputs Unit Quantity Alkali-treated cellulose (Intermediate product) kg 1.11
High pressure homogenization
Inputs Unit Quantity
Alkali-treated cellulose kg 1.11
Electricity, High pressure homogenizer kwh 18.52
Outputs Unit Quantity
Alkali-treated cellulose nanofibrils (Intermediate product) kg 1.03
Heat, waste (Air) MJ 13.33 Neutralization Inputs Unit Quantity
Alkali-treated cellulose nanofibrils kg 1.03
Deionized water L 1088.89
Electricity, Peristaltic pump kwh 0.022
Outputs Unit Quantity
Cellulose nanofibrils kg 1.00
Heat, waste (Air) MJ 0.02
Waste water (Water) L 1094.33
Cellulose nanofibrils lost (Water) kg 0.11
Na+ (Water) kg 0.63

182
Detailed results for the life cycle impact assessment 3.
Table C4. Results for the life cycle impact assessment of producing cellulose nanofibrils from three different production routes.
Unit process Valley beating route
Shear cutting route
Alkaline pretreatment route
Fossil energy consumption (MJ/kg CNF) Pulp production 18.2590 20.6706 22.3931 Mechanical pretreatment 104.6183 19.4911 21.0054 Alkaline pretreatment 0.0000 0.0000 94.9101 Mechanical disintegration 280.8562 331.2942 201.9983 Neutralization 0.0000 0.0000 10.6523 Sum 403.7334 371.4558 350.9592 Global warming potential (kg CO2 eq./kg CNF) Pulp production 1.3101 1.4832 1.6068 Mechanical pretreatment 7.4746 1.3915 1.4996 Alkaline pretreatment 0.0000 0.0000 6.6696 Mechanical disintegration 20.0512 23.6118 14.4213 Neutralization 0.0000 0.0000 0.8763 Sum 28.8359 26.4865 25.0736 Water intake (Liters/kg CNF) Pulp production 1629.6159 1844.8482 1998.5855 Mechanical pretreatment 491.1880 0.0000 0.0000 Alkaline pretreatment 0.0000 0.0000 2655.2505 Mechanical disintegration 0.0000 2474.2885 0.0000 Neutralization 0.0000 0.0000 10279.6413 Sum 2120.8039 4319.1366 14933.4773 Eutrophication potential (g N eq./kg CNF) Pulp production 2.7822 3.1497 3.4121 Mechanical pretreatment 1.1720 0.1698 0.1830 Alkaline pretreatment 0.0000 0.0000 3.2318 Mechanical disintegration 2.4463 5.1328 1.7595 Neutralization 0.0000 0.0000 5.5495 Sum 6.4005 8.4523 14.1359

183
Detailed results for the sensitive analysis 4.
Table C5. Results for the sensitive analysis
Sensitive Analysis Factor Valley beating route
Shear cutting route
Alkaline pretreatment route
Fossil energy consumption (MJ/kg CNF) Baseline 403.7334 371.4558 350.9592 Low mechanical pretreatment energy (-20%) 382.9010 367.6384 346.8453 high mechanical pretreatment energy (+20%) 424.5659 375.3824 355.1907 Low mechanical disintegration energy (-20%) 347.5622 315.2846 310.4941 High mechanical disintegration energy (+20%) 459.9047 427.6271 391.3152 CNF solid content (5%) 231.8700 171.9586 164.9966 Water recovery for neutralization (+80%) N/A N/A 342.8148 Global warming potential (kg CO2 eq./kg CNF) Baseline 28.8359 26.4865 25.0736 Low mechanical pretreatment energy (-20%) 27.3486 26.2140 24.7799 high mechanical pretreatment energy (+20%) 30.3232 26.7668 25.3757 Low mechanical disintegration energy (-20%) 24.8257 22.4763 22.1847 High mechanical disintegration energy (+20%) 32.8461 30.4968 27.9547 CNF solid content (5%) 16.5625 12.2690 11.7919 Water recovery for neutralization (+80%) N/A N/A 24.3995 Water intake (Liters/kg CNF) Baseline 2120.8039 4319.1366 14933.4773 Low mechanical pretreatment energy (-20%) 2120.8039 4319.1366 14933.4773 high mechanical pretreatment energy (+20%) 2120.8039 4319.1366 14933.4773 Low mechanical disintegration energy (-20%) 2120.8039 4319.1366 14933.4773 High mechanical disintegration energy (+20%) 2120.8039 4319.1366 14933.4773 CNF solid content (5%) 1805.7648 2782.6256 6994.3662 Water recovery for neutralization (+80%) N/A N/A 6709.7832 Eutrophication potential (g N eq./kg CNF) Baseline 6.4005 8.4523 14.1359 Low mechanical pretreatment energy (-20%) 6.2191 8.4190 14.1001 high mechanical pretreatment energy (+20%) 6.5820 8.4865 14.1728 Low mechanical disintegration energy (-20%) 5.9113 7.9630 13.7834 High mechanical disintegration energy (+20%) 6.8898 8.9415 14.4874 CNF solid content (5%) 4.7363 5.3172 7.6830 Water recovery for neutralization (+80%) N/A N/A 9.6996