Embed Size (px)
Citation preview
PREPARATION AND EVALUATION OF TABLETED MICROSPHERES OF
IBUPROFEN ENCAPSULATED IN BEESWAX
by
SWATI P. SHAH
(Under the Direction of A.C. CAPOMACCHIA)
ABSTRACT
Ibuprofen was encapsulated with beeswax by the hydrophobic congealable disperse phase
method. Incorporation of stearyl alcohol in the formulation decreased the average size of the
microspheres and led to a modified drug release. The microspheres showed a log-normal particle
size distribution and a high drug encapsulation efficiency of about 94%. The in vitro release of
ibuprofen from the microspheres could be modified according to the size distribution of the
microspheres. Higuchi spherical matrix dissolution kinetics was followed. The appropriate size
fraction of the microspheres was blended with microcrystalline cellulose and each formulation
was compressed at different pressures. The effect of the compression pressure on various tablet
properties was determined. Tableted microspheres appeared deformed but intact on the scanning
electron micrographs. Drug release from the tableted microspheres was slightly slower than that
from uncompressed microspheres. Increasing compression pressure led to a small decrease in
drug release rate from the tableted microspheres.
INDEX WORDS: Microspheres, Tablet, Compression pressure, Matrix microspheres,
Ibuprofen, Hydrophobic Congealable Disperse Phase, Beeswax,
Dissolution.
PREPARATION AND EVALUATION OF TABLETED MICROSPHERES OF
IBUPROFEN ENCAPSULATED IN BEESWAX
by
SWATI P. SHAH
B.Pharm., Bombay College of Pharmacy, India, 2002
A Thesis Submitted to the Graduate Faculty of The University of Georgia in Partial Fulfillment
of the Requirements for the Degree
MASTER OF SCIENCE
ATHENS, GEORGIA
2004
© 2004
Swati P. Shah
All Rights Reserved
PREPARATION AND EVALUATION OF TABLETED MICROSPHERES OF
IBUPROFEN ENCAPSULATED IN BEESWAX
by
SWATI SHAH
Major Professor: A. C. Capomacchia
Committee: James C. Price Michael Bartlett
Electronic Version Approved: Maureen Grasso Dean of the Graduate School The University of Georgia August, 2004
iv
To Mamma, Daddy, Tina and Kunal
v
ACKNOWLEDGEMENTS
I would like to express my thanks to my advisors Dr. James C. Price and Dr. A. C. Capomacchia
for their support, understanding and encouragement. I am indebted to them for their constant
help with my research and administrative help to make this study possible for me.
My thanks to Dr. Bartlett for serving on my advisory committee and for his classes that
improved my knowledge.
I thank God for the many blessings that He has given me in my life, and for each day
renewing my strength and my faith.
I thank my mother for her unconditional love, my father for his guidance and support,
and my sister for being there for me.
Finally, I thank Kunal for his love, and endurance and making everything worthwhile.
vi
TABLE OF CONTENTS
Page
ACKNOWLEDGEMENTS .............................................................................................................v
LIST OF TABLES ........................................................................................................................viii
LIST OF FIGURES ........................................................................................................................ix
INTRODUCTION ...........................................................................................................................1
OBJECTIVE ....................................................................................................................................2
LITERATURE REVIEW ................................................................................................................3
MATERIALS AND INSTRUMENTS ..........................................................................................18
METHODS ....................................................................................................................................20
PREPARATION OF MICROSPHERES ................................................................20
EVALUATION OF MICROSPHERES..................................................................23
PREPARATION OF TABLETED MICROSPHERES...........................................28
EVALUATION OF TABLETED MICROSPHERES……………………..……. .29
RESULTS AND DISCUSSION....................................................................................................30
PRELIMINARY STUDIES ....................................................................................30
PREPARATION OF MICROSPHERES ................................................................35
EVALUATION OF THE MICROSPHERES……………………….………….... 38
IN VITRO DISSOLUTION TESTING OF MICROSPHERES ..............................41
MICROSCOPIC EVALUATION OF MICROSPHERES......................................46
PREPARATION OF TABLETED MICROSPHERES...........................................50
EVALUATION OF TABLETED MICROSPHERES ............................................50
vii
IN VITRO DISSOLUTION TESTING OF TABLETED MICROSPHERES.........55
MICROSCOPIC EVALUATION OF TABLETED MICROSPHERES ................59
CONCLUSION .......................................................................................................60
REFERENCES ..............................................................................................................................61
viii
LIST OF TABLES
Page
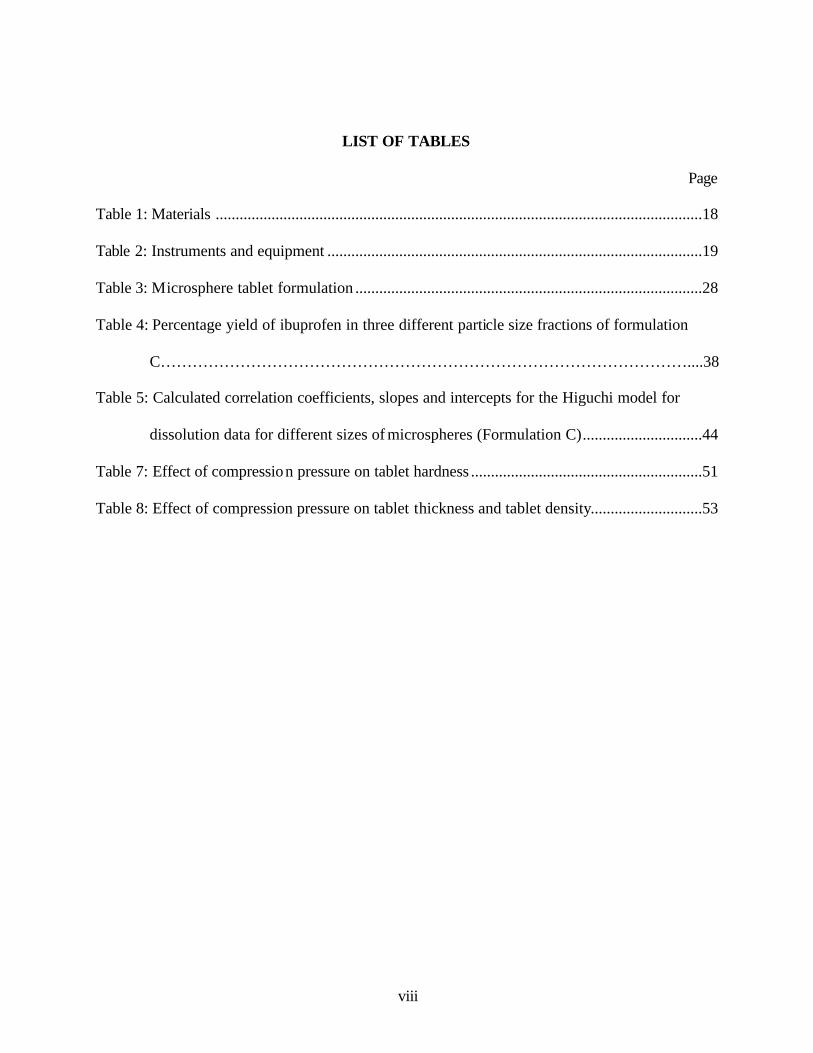
Table 1: Materials ..........................................................................................................................18
Table 2: Instruments and equipment ..............................................................................................19
Table 3: Microsphere tablet formulation .......................................................................................28
Table 4: Percentage yield of ibuprofen in three different particle size fractions of formulation
C………………………………………………………………………………………....38
Table 5: Calculated correlation coefficients, slopes and intercepts for the Higuchi model for
dissolution data for different sizes of microspheres (Formulation C)..............................44
Table 7: Effect of compression pressure on tablet hardness ..........................................................51
Table 8: Effect of compression pressure on tablet thickness and tablet density............................53
ix
LIST OF FIGURES
Page
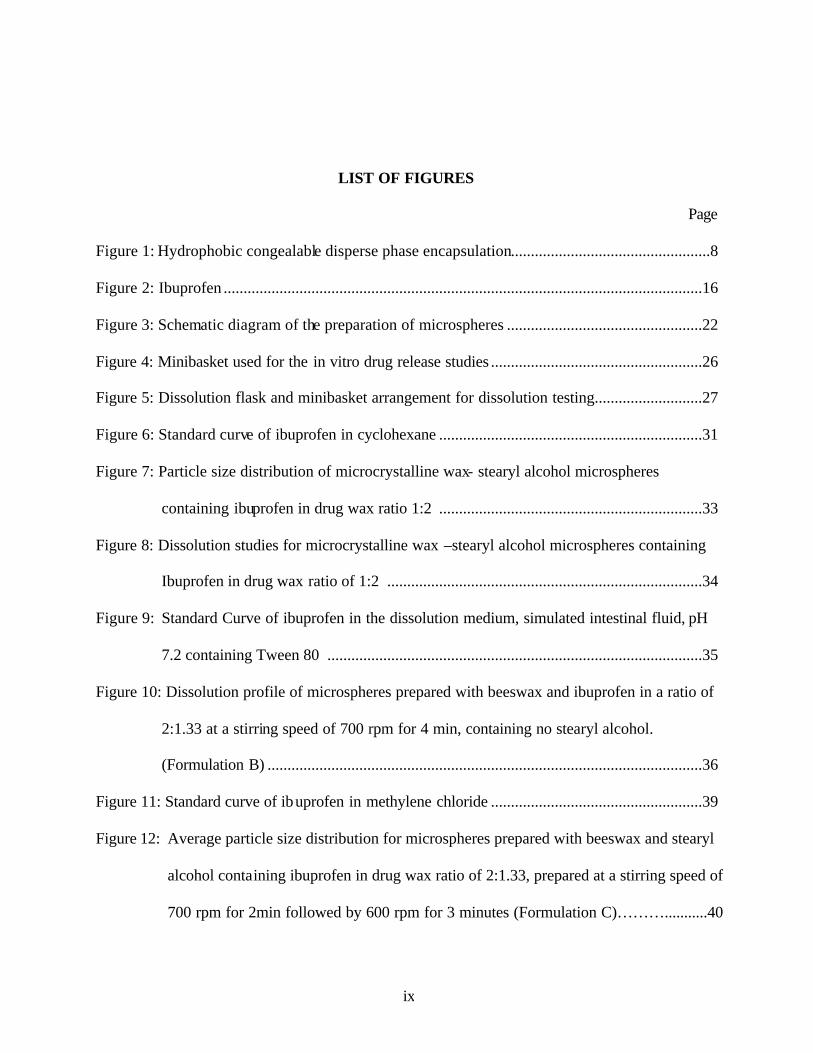
Figure 1: Hydrophobic congealable disperse phase encapsulation..................................................8
Figure 2: Ibuprofen ........................................................................................................................16
Figure 3: Schematic diagram of the preparation of microspheres .................................................22
Figure 4: Minibasket used for the in vitro drug release studies .....................................................26
Figure 5: Dissolution flask and minibasket arrangement for dissolution testing...........................27
Figure 6: Standard curve of ibuprofen in cyclohexane ..................................................................31
Figure 7: Particle size distribution of microcrystalline wax- stearyl alcohol microspheres
containing ibuprofen in drug wax ratio 1:2 ..................................................................33
Figure 8: Dissolution studies for microcrystalline wax –stearyl alcohol microspheres containing
Ibuprofen in drug wax ratio of 1:2 ...............................................................................34
Figure 9: Standard Curve of ibuprofen in the dissolution medium, simulated intestinal fluid, pH
7.2 containing Tween 80 ..............................................................................................35
Figure 10: Dissolution profile of microspheres prepared with beeswax and ibuprofen in a ratio of
2:1.33 at a stirring speed of 700 rpm for 4 min, containing no stearyl alcohol.
(Formulation B) .............................................................................................................36
Figure 11: Standard curve of ibuprofen in methylene chloride .....................................................39
Figure 12: Average particle size distribution for microspheres prepared with beeswax and stearyl
alcohol containing ibuprofen in drug wax ratio of 2:1.33, prepared at a stirring speed of
700 rpm for 2min followed by 600 rpm for 3 minutes (Formulation C)………...........40
x
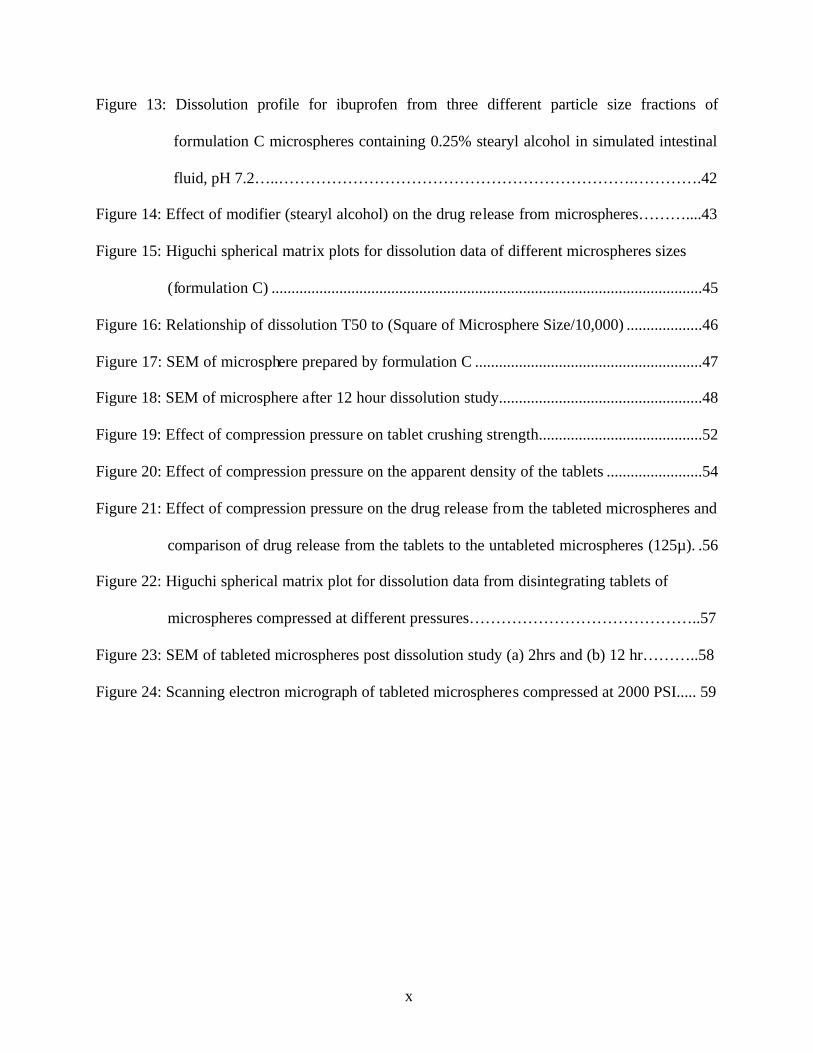
Figure 13: Dissolution profile for ibuprofen from three different particle size fractions of
formulation C microspheres containing 0.25% stearyl alcohol in simulated intestinal
fluid, pH 7.2…..………………………………………………………….………….42
Figure 14: Effect of modifier (stearyl alcohol) on the drug release from microspheres………....43
Figure 15: Higuchi spherical matrix plots for dissolution data of different microspheres sizes
(formulation C) ............................................................................................................45
Figure 16: Relationship of dissolution T50 to (Square of Microsphere Size/10,000) ...................46
Figure 17: SEM of microsphere prepared by formulation C .........................................................47
Figure 18: SEM of microsphere after 12 hour dissolution study...................................................48
Figure 19: Effect of compression pressure on tablet crushing strength.........................................52
Figure 20: Effect of compression pressure on the apparent density of the tablets ........................54
Figure 21: Effect of compression pressure on the drug release from the tableted microspheres and
comparison of drug release from the tablets to the untableted microspheres (125µ). .56
Figure 22: Higuchi spherical matrix plot for dissolution data from disintegrating tablets of
microspheres compressed at different pressures……………………………………..57
Figure 23: SEM of tableted microspheres post dissolution study (a) 2hrs and (b) 12 hr………..58
Figure 24: Scanning electron micrograph of tableted microspheres compressed at 2000 PSI..... 59
1
INTRODUCTION
Controlled release drug delivery systems are designed to achieve a prolonged therapeutic effect
by continuously releasing the active ingredient over an extended period of time after the
administration of a single dose. Most oral sustained release products have been formulated as
non-disintegrating tablets or encapsulated particles (5). Encapsulated controlled release dosage
forms have specific advantages over the core tablet design. Disintegrating compressed tablets
containing encapsulated drug particles can combine the advantages of tablet dosing as well as
controlled release particulate therapy if the controlled release particles can withstand
compression into tablets and still maintain controlled release properties. The disintegrating
tablets promote rapid break up of the tablet matrix into smaller subunits to allow access of the GI
fluid to the controlled release particles. The sustained release offered by this mechanism offers
several advantages over non-disintegrating tablet systems, such as ready distribution over a large
surface area, more reproducible drug release rate, less GI tract irritation and lower chance of
catastrophic failure of the drug release mechanism, that is, less chances of dose dumping.
Release from multiple unit products is also less dependent on the gastric transit time.
Microencapsulation is a means of encapsulation of small particles of solid s or droplets of liquids
and dispersions either by applying relatively thin coatings or the formation of small spherical
polymeric or waxy matrices containing drug. Several microencapsulation methods such as
coacervation phase separation, emulsion solvent evaporation, congealable disperse phase and
interfacial polymerization have been described in the literature. Considering the relative
insolubility of ibuprofen in water and solubility in excess of 5% in most organic solvents, the
hydrophobic congealable disperse phase procedure becomes the method of choice. Other
2
advantages of employing this method include its simplicity, economic advantage and avoiding
the use of organic solvents.
Microcapsules and matrix microspheres have been tableted to control the release of the drug and
to avoid gastric irritation (6). Tableted microspheres of ibuprofen have an advantage over tablets
in that the small particles help the drug moieties to be widely distributed throughout the
gastrointestinal tract, thus improving drug absorption. Considering the GI tract irritation of the
NSAID ibuprofen, a multiple unit dosage system in the form of wax matrix microspheres would
protect the gastric mucosa from the irritant effect of the drug and thus decrease the magnitude of
this side effect.
OBJECTIVE
The objectives of this study were:
1. To develop and evaluate controlled release microspheres of ibuprofen in wax by the
hydrophobic congealable disperse phase method.
2. To characterize the microparticulate drug delivery system using particle size analysis,
entrapment efficiency, in vitro drug release (dissolution testing) and scanning electron
microscopy (SEM).
3. To prepare tablets containing the microspheres and to study the effect of compression
pressure on the physical properties of the tablet and on the drug release from the tableted
microspheres.

3
LITERATURE REVIEW
An ideal dosage regimen in the drug therapy of any disease is the one, which immediately attains
the desired therapeutic concentration of the drug in the plasma (or at the site of action) and
maintains it constant for the entire duration of the treatment. This is possible through the
administration of a conventional dosage form in a multiple dose regimen at a particular
frequency. The frequency of administration or the dosing interval of any drug depends on its
half- life or mean residence time and its therapeutic index.
Conventional dosage form therapy has a number of limitations such as:
1. For a drug with a short half- life, frequent administration is necessary. This may result in
poor patient compliance with increased chances of missing a dose.
2. A typical peak-valley plasma concentration time profile is obtained and this makes
attainment of steady-state conditions difficult.
3. The fluctuating drug levels may lead to precipitation of adverse effects especially of a
drug with a small therapeutic index.
There are two ways to overcome such a situation:
1. Development of new, better and safer drugs with long half- lives and large therapeutic
indices.
2. Effective and safer use of existing drugs through concepts and techniques of controlled
and targeted delivery systems.
4
The second approach has the advantage of reducing the cost of discovering, testing and
commercializing new drug molecules. There is also a need to design effective delivery systems as
it presents an opportunity to utilize new technologies to make the drug dosing more convenient to
the patient, improve the patient compliance, and to introduce an element of novelty that will
extend the proprietary position of the final product.
The basic objective of dosage form design is to optimize the drug delivery so as to achieve a
measure of control with respect to the spatial placement and the temporal rate in the body. The
therapeutic amount of the drug must be delivered to the required site in the body to achieve
promptly and to maintain the desired drug concentration (1).
The potential advantages of a controlled delivery system include:
1. Reduction or elimination of fluctuations in the drug blood level allows better disease state
management.
2. Patient compliance is improved because of reduced dosing frequency
3. Less total drug is employed. This helps to minimize local or systemic side effects by
decreasing drug accumulation in chronic therapy
4. Improved bioavailability for some drugs (2).
5. Reductions in health care costs through improved drug therapy, shorter treatment period,
less frequent dosing and reduction in personnel time to dispense, administer and monitor
patients.
5
Oral Controlled Release Systems:
The oral route has been the most popular and successfully used route used for controlled delivery
of drugs. The reasons for its popularity include:
1. The administration of drugs by this route is easy and convenient.
2. There is great flexibility in dosage form design because of the versatility of the GI
anatomy and physiology
3. Ease of production and low cost of production compared to the production of dosage
forms that are formulated for injectable and topical use (3).
Microencapsulation involves the coating of particles ranging dimensionally from several tenths
of a micron to 5000 microns in size (6). When the encapsulated substance is present as a distinct
single core (droplet or a crystal that is not necessarily spherical) surrounded by a solid envelope,
the system is known as a reservoir microcapsule. Alternatively when the core material is
dispersed as many discrete core particles or droplets, or is dissolved within the polymer, it is
more accurately referred to as a matrix microsphere or matrix microparticle (7).
The process of microencapsulation has several advantages. Microspheres are a class of multiple-
unit dosage forms and offer the advantage of combining various types of subunits in a single
system and offer diversity in achieving dissolution profiles (8). The smallness of the particles
helps the drug moieties to be widely distributed throughout the gastrointestinal tract, thus
improving drug absorption. In addition, the microcapsules can spread over a wide area in the GI
tract and thus minimize GI toxicity of the NSAID drug. The uniqueness of microencapsulation is
6
the smallness of the coated particles and their subsequent use and adaptation to a wide variety of
dosage forms and product applications (6).
There are several methods for encapsulating the drug. These can be broadly classified into two
types, physical methods and chemical methods.
The chemical methods to encapsulate a drug core include:
1. Coacervation- Phase separation- In this process, the core is dispersed into a solution of
the coating polymer. The coating polymer is then converted from a solublized state to an
immiscible polymer in liquid state by the careful change in temperature or by the addition of a
salt or a non- solvent in the presence of insoluble core particles. The immiscible liquid polymer
is then deposited on the core by adsorption. The adsorbed polymer is then converted to a rigid
coating by thermal, cross-linking or desolvation techniques to form a microcapsule (6). Miller et
al. dispersed ethyl cellulose in cyclohexane to yield a polymer concentration of 2% by weight.
This mixture was heated to its boiling point to form a homogenous polymer solution.
Paracetamol was used as the core material and was dispersed in the polymer solution with
stirring. Allowing the mixture to cool with stirring effected the phase separation of the ethyl
cellulose and the microencapsulation of paracetamol. Allowing the mixture to cool further to
room temperature accomplished the solidification of the coating. The microcapsules were then
collected from cyclohexane by filtration, decantation or centrifugation techniques (9).
2. Interfacial polymerization: This technique involves the reaction of monomeric units of
two reactive polymers at the interface existing between the two immiscible phases to form a film
7
that encapsulates the dispersed core. One of the monomers is present in the aqueous disperse
phase containing a solution or dispersion of the core. The other polymer is present in the aqueous
external phase (11).
The physical methods used in microencapsulation include:
1. Spray drying
2. Centrifugal extrusion
3. Spinning disk or rotational suspension separation
4. Fluidized bed coating
5. Emulsion- Solvent Evaporation
6. Congealable Disperse Phase Emulsification
1. Emulsion-Solvent Evaporation: In this process, the microcapsule coating is dissolved in a
volatile solvent. The core is the dispersed into the coating polymer solution. The coating solution
is added with agitation to a liquid manufacturing vehicle in which the core, the coating polymer
and the volatile solvent are all immiscible. The mixture is then heated, if necessary, to evaporate
the solvent. This causes the coating polymer to shrink around the core. Once all the solvent is
evaporated the temperature of the liquid manufacturing phase is reduced to ambient temperature
with constant agitation. Perumal et al. prepared modified release microcapsules of ibuprofen
using this method (10).
2. Congealable disperse phase encapsulation: This is a relatively simple microencapsulation
procedure. It involves dispersing or dissolving the core at an elevated temperature in a
8
hydrophilic or hydrophobic vehicle that solidifies when cooled to normal ambient temperature
(11). The hydrophilic vehicles include gelatin, agar and starch solutions. Suitable hydrophobic
phases include waxes and hydrogenated castor oil. The core must be stable at the melting
temperature of the wax.
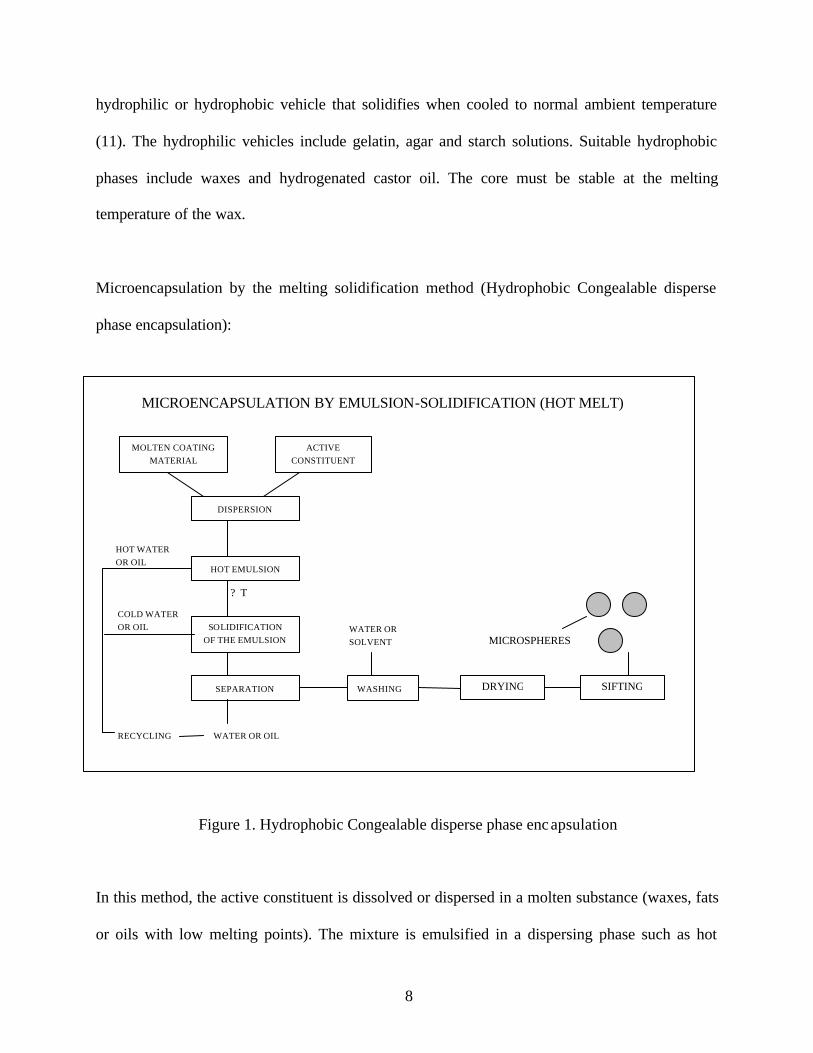
Microencapsulation by the melting solidification method (Hydrophobic Congealable disperse
phase encapsulation):
Figure 1. Hydrophobic Congealable disperse phase encapsulation
In this method, the active constituent is dissolved or dispersed in a molten substance (waxes, fats
or oils with low melting points). The mixture is emulsified in a dispersing phase such as hot
WASHING DRYING SIFTING SEPARATION
DISPERSION
HOT EMULSION
SOLIDIFICATION OF THE EMULSION
MOLTEN COATING MATERIAL
ACTIVE CONSTITUENT
WATER OR OIL RECYCLING
MICROSPHERES
COLD WATER OR OIL
HOT WATER OR OIL
WATER OR SOLVENT
? T
MICROENCAPSULATION BY EMULSION-SOLIDIFICATION (HOT MELT)
9
water, organic solvent, inorganic or vegetable oil, which dissolve neither the molten polymer
(wax) nor the active drug. Encapsulation is carried out when the molten polymer droplets
solidify coating the drug as a result of lowering the temperature. This process results in the
formation of matrix type microspheres. The choice of encapsulation materials has been directed
towards waxes and polymers with melting points preferably between 50° and 100°C and which
give low viscosity molten phases.
When the external phase is water, this process has the advantage of using no organic solvent.
The stabilization of the microdrops of molten wax can be obtained by adding a surfactant such as
sodium lauryl sulfate, in the case of waxes with low hydrophilicity. As in the case of the
emulsion solvent evaporation processes, water insoluble substances can be encapsulated using
direct emulsion (o/w), the active drug being dissolved or dispersed in the molten wax. In the case
of water-soluble substances, following emulsification of an aqueous solution of the active
constituent in the molten wax, the emulsion formed is redispersed in an external phase (w/o/w).
Microspheres measuring 20-500 microns are generally obtained. The process of preparing
microcapsules usually involves several variables and the development of an ideal formulation
procedure involves optimizing the levels of the variables involved. Experimental design models
are used to identify the most suitable combination of variables to optimize the microspheres for
properties such as drug loading, dissolution profiles, particle size distribution, and concentration
of the excepients used. The rate of release in the aqueous phase by diffusion of the active drug
depends on the particle size distribution (the size of the particles mainly being controlled by the
rate of stirring), the active constituent content and the degree of hydrophilicity of the wax.
Adeyeye and Price used the congealable disperse phase method to prepare sustained release
microspheres of the hydrophobic drug ibuprofen (12). The drug was dissolved in a molten
10
ceresin wax and a one-phase melt was obtained. A dispersant solution (5% PVP) at 5°C above
the melting point of the wax phase was added to the melt with constant stirring to form an o/w
emulsion. Hardening of the internal oily phase was accomplished by rapidly pouring the
emulsion volume of ice- cold water to generate the microspheres.
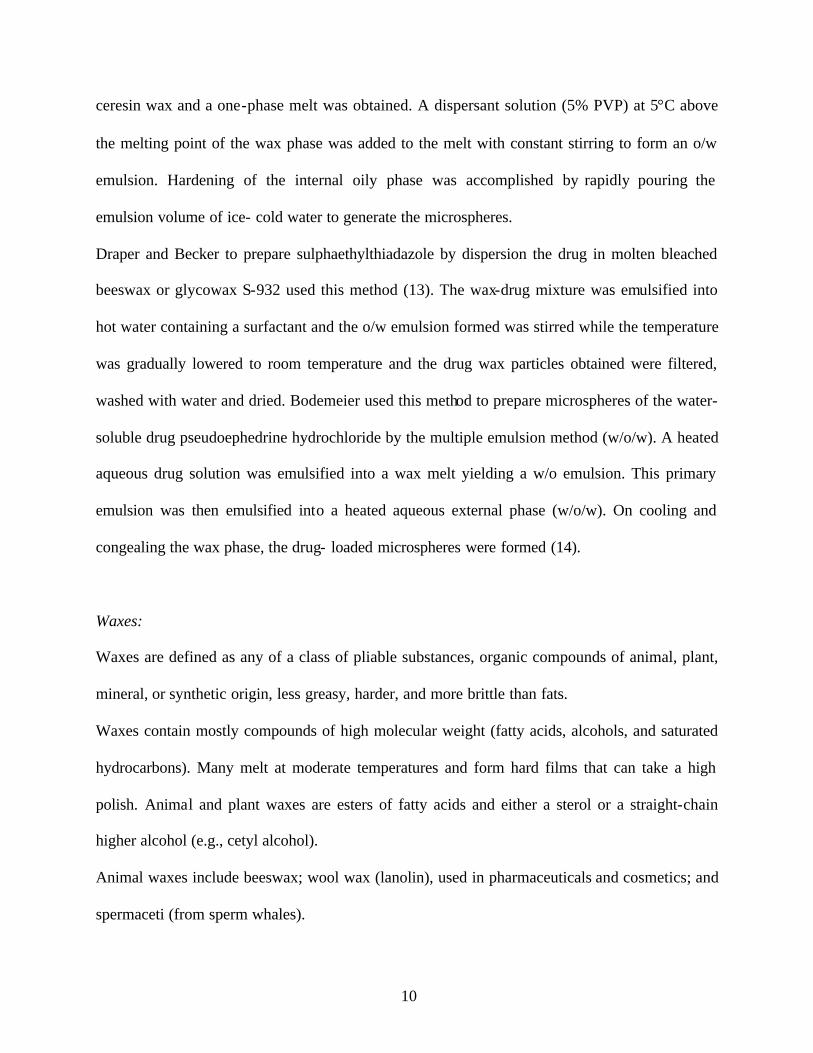
Draper and Becker to prepare sulphaethylthiadazole by dispersion the drug in molten bleached
beeswax or glycowax S-932 used this method (13). The wax-drug mixture was emulsified into
hot water containing a surfactant and the o/w emulsion formed was stirred while the temperature
was gradually lowered to room temperature and the drug wax particles obtained were filtered,
washed with water and dried. Bodemeier used this method to prepare microspheres of the water-
soluble drug pseudoephedrine hydrochloride by the multiple emulsion method (w/o/w). A heated
aqueous drug solution was emulsified into a wax melt yielding a w/o emulsion. This primary
emulsion was then emulsified into a heated aqueous external phase (w/o/w). On cooling and
congealing the wax phase, the drug- loaded microspheres were formed (14).
Waxes:
Waxes are defined as any of a class of pliable substances, organic compounds of animal, plant,
mineral, or synthetic origin, less greasy, harder, and more brittle than fats.
Waxes contain mostly compounds of high molecular weight (fatty acids, alcohols, and saturated
hydrocarbons). Many melt at moderate temperatures and form hard films that can take a high
polish. Animal and plant waxes are esters of fatty acids and either a sterol or a straight-chain
higher alcohol (e.g., cetyl alcohol).
Animal waxes include beeswax; wool wax (lanolin), used in pharmaceuticals and cosmetics; and
spermaceti (from sperm whales).
11
Plant waxes include carnauba wax, candelilla wax, and sugarcane wax, used in polishes.
About 90% of the waxes in commerce are recovered by dewaxing petroleum. There are three
main types: paraffin, microcrystalline wax and petrolatum. Earth wax includes ozokerite, the
origin of which is believed to be linked to that of petroleum. It is derived from the carbonization
and concomitant distillation of animal or vegetable remains, under the heat and great pressure
deep under the earth’s surface, during one of the middle periods in geological history.
Synthetic waxes (CARBOWAX), derived from ethylene glycol, are commonly blended with
petroleum waxes.
Microcrystalline wax and Beeswax were used in this study, and an account of these waxes is
given below.
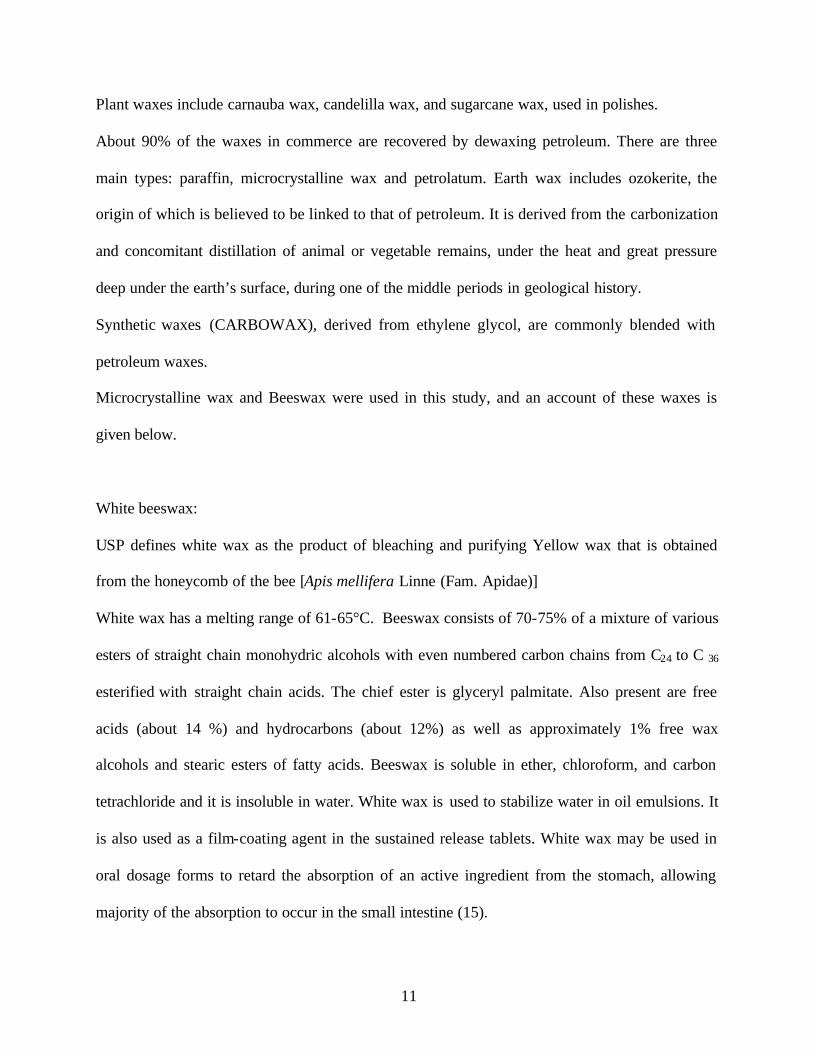
White beeswax:
USP defines white wax as the product of bleaching and purifying Yellow wax that is obtained
from the honeycomb of the bee [Apis mellifera Linne (Fam. Apidae)]
White wax has a melting range of 61-65°C. Beeswax consists of 70-75% of a mixture of various
esters of straight chain monohydric alcohols with even numbered carbon chains from C24 to C 36
esterified with straight chain acids. The chief ester is glyceryl palmitate. Also present are free
acids (about 14 %) and hydrocarbons (about 12%) as well as approximately 1% free wax
alcohols and stearic esters of fatty acids. Beeswax is soluble in ether, chloroform, and carbon
tetrachloride and it is insoluble in water. White wax is used to stabilize water in oil emulsions. It
is also used as a film-coating agent in the sustained release tablets. White wax may be used in
oral dosage forms to retard the absorption of an active ingredient from the stomach, allowing
majority of the absorption to occur in the small intestine (15).
12
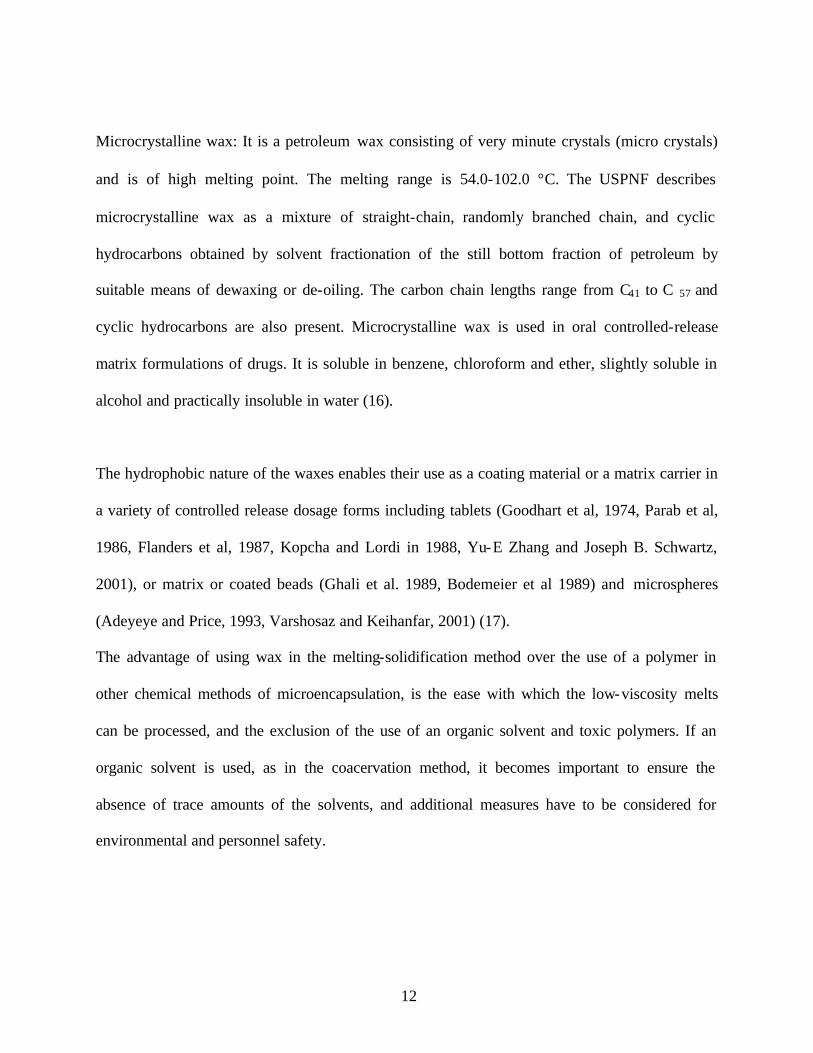
Microcrystalline wax: It is a petroleum wax consisting of very minute crystals (micro crystals)
and is of high melting point. The melting range is 54.0-102.0 °C. The USPNF describes
microcrystalline wax as a mixture of straight-chain, randomly branched chain, and cyclic
hydrocarbons obtained by solvent fractionation of the still bottom fraction of petroleum by
suitable means of dewaxing or de-oiling. The carbon chain lengths range from C41 to C 57 and
cyclic hydrocarbons are also present. Microcrystalline wax is used in oral controlled-release
matrix formulations of drugs. It is soluble in benzene, chloroform and ether, slightly soluble in
alcohol and practically insoluble in water (16).
The hydrophobic nature of the waxes enables their use as a coating material or a matrix carrier in
a variety of controlled release dosage forms including tablets (Goodhart et al, 1974, Parab et al,
1986, Flanders et al, 1987, Kopcha and Lordi in 1988, Yu-E Zhang and Joseph B. Schwartz,
2001), or matrix or coated beads (Ghali et al. 1989, Bodemeier et al 1989) and microspheres
(Adeyeye and Price, 1993, Varshosaz and Keihanfar, 2001) (17).
The advantage of using wax in the melting-solidification method over the use of a polymer in
other chemical methods of microencapsulation, is the ease with which the low-viscosity melts
can be processed, and the exclusion of the use of an organic solvent and toxic polymers. If an
organic solvent is used, as in the coacervation method, it becomes important to ensure the
absence of trace amounts of the solvents, and additional measures have to be considered for
environmental and personnel safety.
13
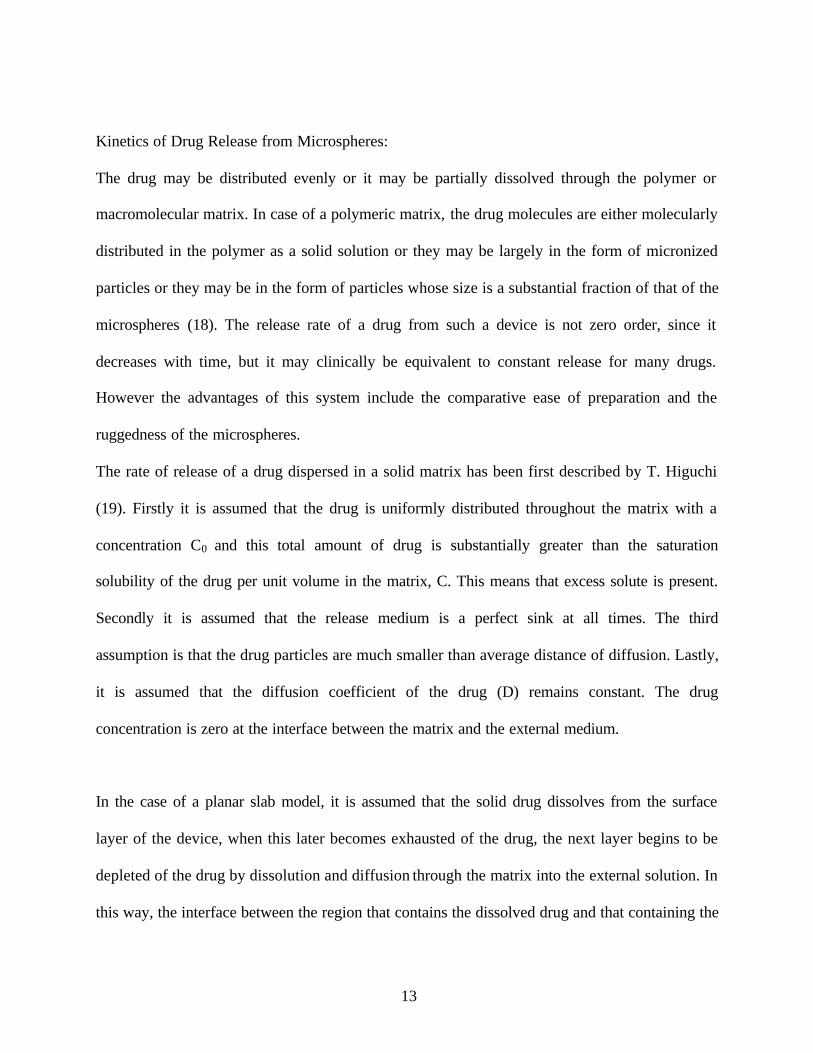
Kinetics of Drug Release from Microspheres:
The drug may be distributed evenly or it may be partially dissolved through the polymer or
macromolecular matrix. In case of a polymeric matrix, the drug molecules are either molecularly
distributed in the polymer as a solid solution or they may be largely in the form of micronized
particles or they may be in the form of particles whose size is a substantial fraction of that of the
microspheres (18). The release rate of a drug from such a device is not zero order, since it
decreases with time, but it may clinically be equivalent to constant release for many drugs.
However the advantages of this system include the comparative ease of preparation and the
ruggedness of the microspheres.
The rate of release of a drug dispersed in a solid matrix has been first described by T. Higuchi
(19). Firstly it is assumed that the drug is uniformly distributed throughout the matrix with a
concentration C0 and this total amount of drug is substantially greater than the saturation
solubility of the drug per unit volume in the matrix, C. This means that excess solute is present.
Secondly it is assumed that the release medium is a perfect sink at all times. The third
assumption is that the drug particles are much smaller than average distance of diffusion. Lastly,
it is assumed that the diffusion coefficient of the drug (D) remains constant. The drug
concentration is zero at the interface between the matrix and the external medium.
In the case of a planar slab model, it is assumed that the solid drug dissolves from the surface
layer of the device, when this later becomes exhausted of the drug, the next layer begins to be
depleted of the drug by dissolution and diffusion through the matrix into the external solution. In
this way, the interface between the region that contains the dissolved drug and that containing the
14
dispersed drug moves into the interior as a front. The drug released from a uniform matrix in a
planar slab model is given the equation, (2)
M = [Cs Dm (2C0 - Cs) t] ½
Where,
M is the total amount of drug in the matrix
Cs is the saturation solubility of the drug
C0 is the Concentration of the drug in the matrix at time t
Dm is the diffusion coefficient of the drug
t is time
Or simply as,
M = kt1/2
Where k is a constant. So, th e plot of amount of drug released versus the square root of time
should be linear if the drug released from the matrix is diffusion controlled.
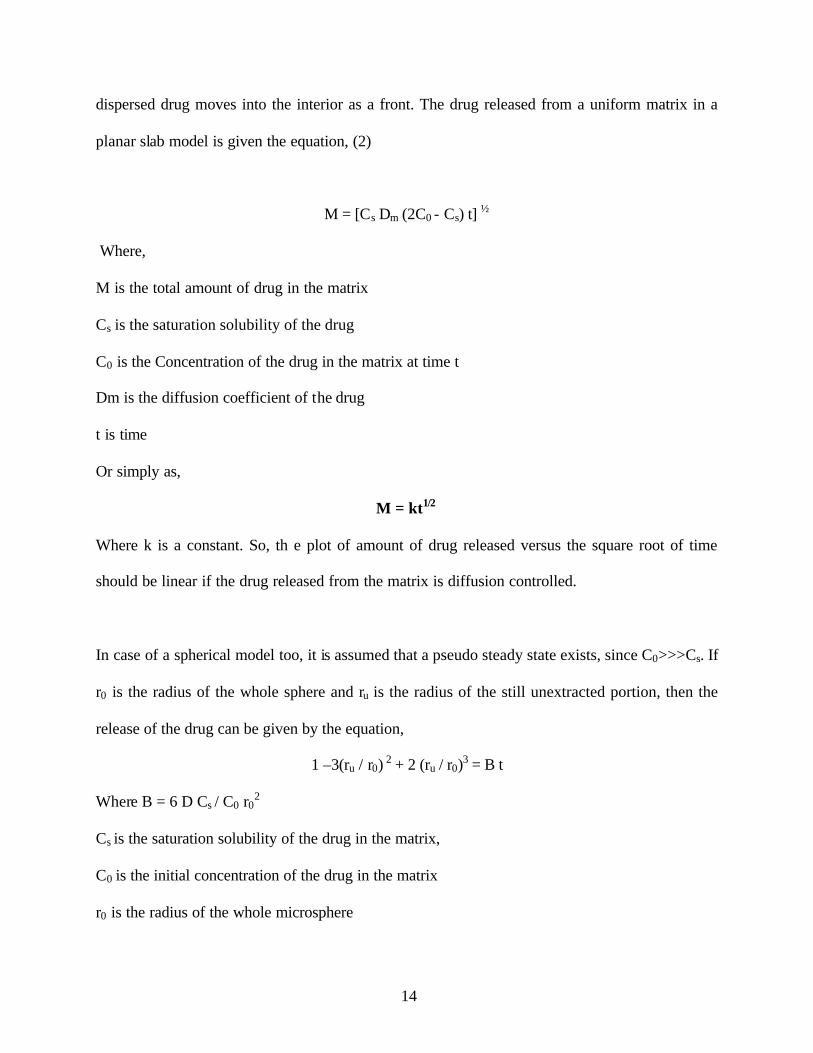
In case of a spherical model too, it is assumed that a pseudo steady state exists, since C0>>>Cs. If
r0 is the radius of the whole sphere and ru is the radius of the still unextracted portion, then the
release of the drug can be given by the equation,
1 –3(ru / r0) 2 + 2 (ru / r0)3 = B t
Where B = 6 D Cs / C0 r02
Cs is the saturation solubility of the drug in the matrix,
C0 is the initial concentration of the drug in the matrix
r0 is the radius of the whole microsphere
15
ru is the radius of the still unextracted portion
And (ru / r0) represents the fraction of the drug remaining, as a function of time, t.
For microspheres having a homogenous matrix, the equation is (18)
B = 6 D Cs/ C0 r02
For microspheres that have a granular (non-homogenous matrix), the equation is (18)
B = 6 D Cs Vsp / τ C0 r02
Where Vsp is the specified volume of the drug and τ is the porosity of the system
The drug release from a matrix system may be more difficult to model than a reservoir
membrane type of system, because of the additional number of variables to be accounted for
(18). The changing surface area considerations, drug loading and drug particle size may have
interacting effects on dissolution.
At a low drug loading, and where the drug release is a result of dissolution of the drug in the
polymeric matrix, followed by the diffusion of the drug through the matrix into the
environmental interface, a decrease in the particle size of the drug results in an increase in the
rate of drug release (18). This is because the smaller drug particles can diffuse across the
polymer barrier more rapidly resulting in a higher drug release rate. Also smaller are the drug
particles, more is the area exposed for dissolution into the polymer.
On the other hand, at high drug loadings, and where the solubility of the dug in the membrane is
unimportant, reduction of drug particle size may decrease the rate of drug release. This is
because at high drug loadings, particles come close together. As the particles dissolve they leave
channels in the microcapsule matrix, thus increasing the access to the dissolution environment
16
and consequently increasing the release rate. However very small particles dispersed in the
polymer are less likely to form continuous channels as they dissolve (18). The dissolution of
smaller insoluble particles results in a tortuous path for the dissolution medium and this leads to
a decrease in the release of the drug.
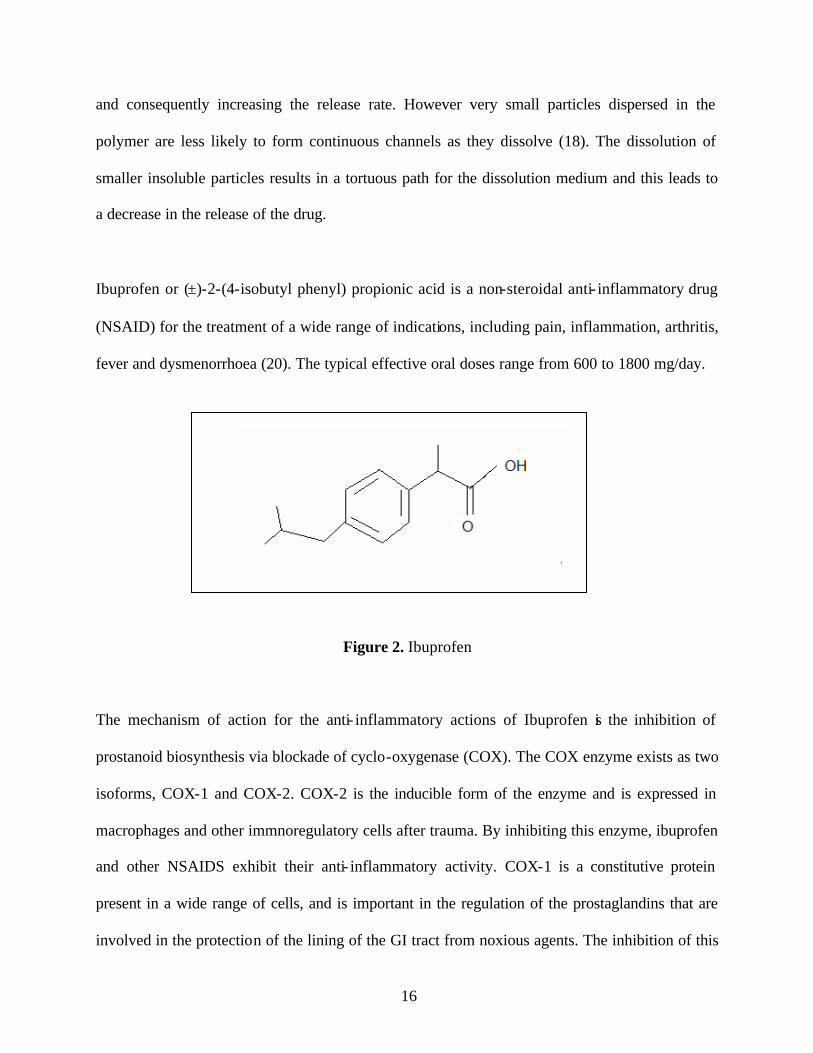
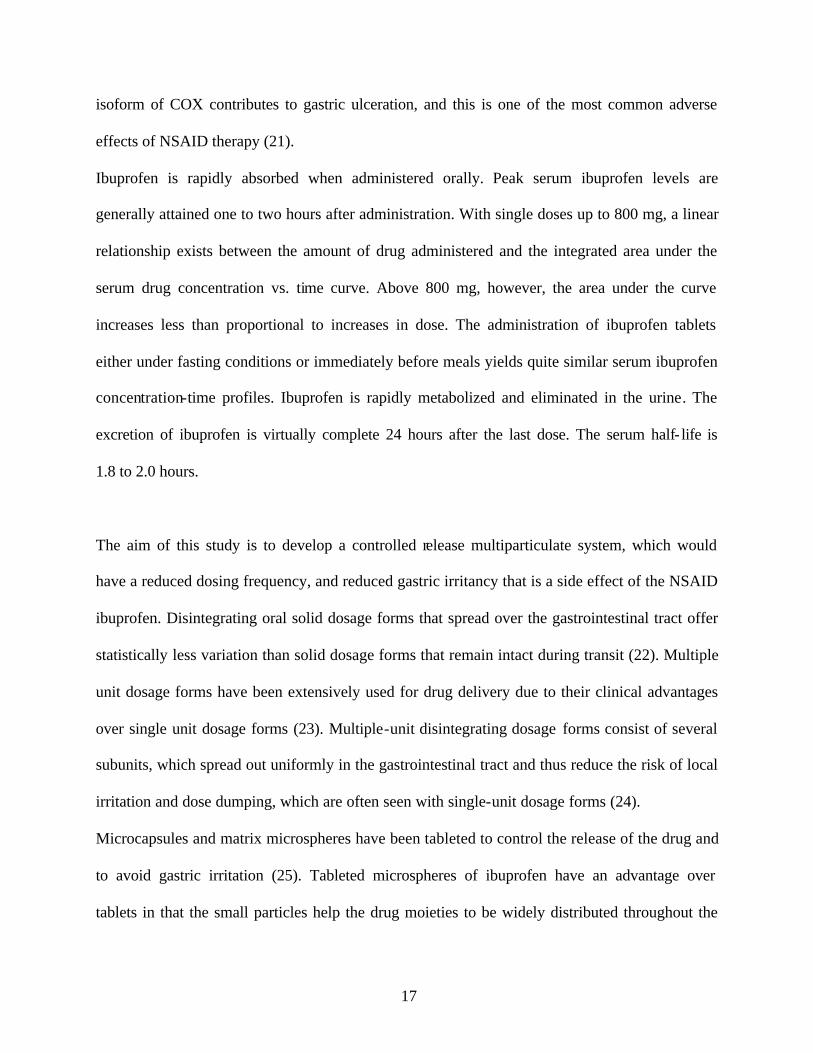
Ibuprofen or (±)-2-(4-isobutyl phenyl) propionic acid is a non-steroidal anti- inflammatory drug
(NSAID) for the treatment of a wide range of indications, including pain, inflammation, arthritis,
fever and dysmenorrhoea (20). The typical effective oral doses range from 600 to 1800 mg/day.
Figure 2. Ibuprofen
The mechanism of action for the anti- inflammatory actions of Ibuprofen is the inhibition of
prostanoid biosynthesis via blockade of cyclo-oxygenase (COX). The COX enzyme exists as two
isoforms, COX-1 and COX-2. COX-2 is the inducible form of the enzyme and is expressed in
macrophages and other immnoregulatory cells after trauma. By inhibiting this enzyme, ibuprofen
and other NSAIDS exhibit their anti- inflammatory activity. COX-1 is a constitutive protein
present in a wide range of cells, and is important in the regulation of the prostaglandins that are
involved in the protection of the lining of the GI tract from noxious agents. The inhibition of this
17
isoform of COX contributes to gastric ulceration, and this is one of the most common adverse
effects of NSAID therapy (21).
Ibuprofen is rapidly absorbed when administered orally. Peak serum ibuprofen levels are
generally attained one to two hours after administration. With single doses up to 800 mg, a linear
relationship exists between the amount of drug administered and the integrated area under the
serum drug concentration vs. time curve. Above 800 mg, however, the area under the curve
increases less than proportional to increases in dose. The administration of ibuprofen tablets
either under fasting conditions or immediately before meals yields quite similar serum ibuprofen
concentration-time profiles. Ibuprofen is rapidly metabolized and eliminated in the urine. The
excretion of ibuprofen is virtually complete 24 hours after the last dose. The serum half- life is
1.8 to 2.0 hours.
The aim of this study is to develop a controlled release multiparticulate system, which would
have a reduced dosing frequency, and reduced gastric irritancy that is a side effect of the NSAID
ibuprofen. Disintegrating oral solid dosage forms that spread over the gastrointestinal tract offer
statistically less variation than solid dosage forms that remain intact during transit (22). Multiple
unit dosage forms have been extensively used for drug delivery due to their clinical advantages
over single unit dosage forms (23). Multiple-unit disintegrating dosage forms consist of several
subunits, which spread out uniformly in the gastrointestinal tract and thus reduce the risk of local
irritation and dose dumping, which are often seen with single-unit dosage forms (24).
Microcapsules and matrix microspheres have been tableted to control the release of the drug and
to avoid gastric irritation (25). Tableted microspheres of ibuprofen have an advantage over
tablets in that the small particles help the drug moieties to be widely distributed throughout the
18
gastrointestinal tract, thus improving drug absorption. Considering the GI tract irritation of the
NSAID ibuprofen, a multiple unit dosage system in the form of wax matrix microspheres would
protect the gastric mucosa from the irritant effect of the drug and thus decrease the magnitude of
this side effect. Both microcapsules as well as matrix monolithic microspheres have been
tabletted in the past to control the release rate of the drug. However compression of the
microcapsules may lead to damage to the capsule wall, as reported by Nixon et al in 1980.
Damage to the microcapsule wall at higher compression pressures may lead to unpredictable
dissolution rates of the tableted microcapsules. However, in the study carried out by Dubernet et
al., in 1987, the in vitro release rate of nitrofurantoin from poly (e- caprolactone) microcapsules
decreased after tableting probably due to the formation of a non-disintegrating matrix at higher
compression pressures. Matrix monolithic microspheres are reported to be more robust and more
resistant to rupture on tableting compared to the thin wall microcapsules, which are more fragile
because of the relatively thin wall of encapsulating coating (26).
MATERIALS AND INSTRUMENTS
The materials are shown in Table 1 and the instruments and equipments are shown in Table 2.
Table 1: Materials
Materials Manufacturer Lot Number
White Wax, N.F. (Beeswax) Amend Drug and Chemical Co.
Irvington, NJ 0711 F15341A02
Ibuprofen USP
40 grade
Ablemarble Corporation
Baton Rouge, LA 29801 LPL6312
19
Microcrystalline Wax Frank B. Ross Co. Inc. 1135/15W
Stearyl Alcohol USP/NF Gallipot
St. Paul, MN 55122 9903112
Dodecyl Sodium Sulfate USP Matheson Coleman & Bell
East Rutherford, N.J. DX295
Potassium Phosphate
Monobasic Anhydrous
Sigma Aldrich Co.
St. Louis, MO 63178 63178
Sodium Hydroxide, 50%w/w
Solution
J. T. Baker
NJ 08865 3727-01
Microcrystalline Cellulose
Avicel® PH 101
FMC Corporation
Philadelphia, PA 19103 1449
Sodium Carboxymethyl Starch Eli Lilly and Co.
Indianapolis, IN 46285 BO8369
Methylene chloride J.T. Baker, NJ 08865 EO4621
Table 2: Instruments and Equipment
Equipment Sources
Optical Microscope
Model No.
Bausch and Lomb Inc.,
Rochester, NY 14602
Dissolution Apparatus Prolabo Dissolutest
Dissolution Apparatus,
20
75526, Paris, France
Stainless Steel Mini Basket
Instruments Workshop
University of Georgia,
Athens, GA 30602
Spectronic 2000
UV Spectrophotometer
Bausch and Lomb,
Rochester, NY 14625
Water Bath Shaker Precision Reciprocal Water Bath, Model # 25,
Precision Scientific, Winchester, VA.
Mechanical stirrer Lab Stirrer LR 400C
Fischer Scientific Co. Japan
Tablet Press Fred S. Carver Inc.,
Summit, NJ, USA
Hardness Tester Erweka Chemical and Pharmaceutical Co., NJ,
USA
Tablet Dimensions Measure Digital Caliper
METHODS
PREPRATION OF MICROSPHERES
The external phase was prepared as a 200 ml of a 0.25% w/v solution of sodium lauryl sulfate
(SLS) in de- ionized water. This aqueous phase was heated to about 80 °C (temperature higher
than the melting point of wax). It was simultaneously stirred at 1000 rpm using a three blade
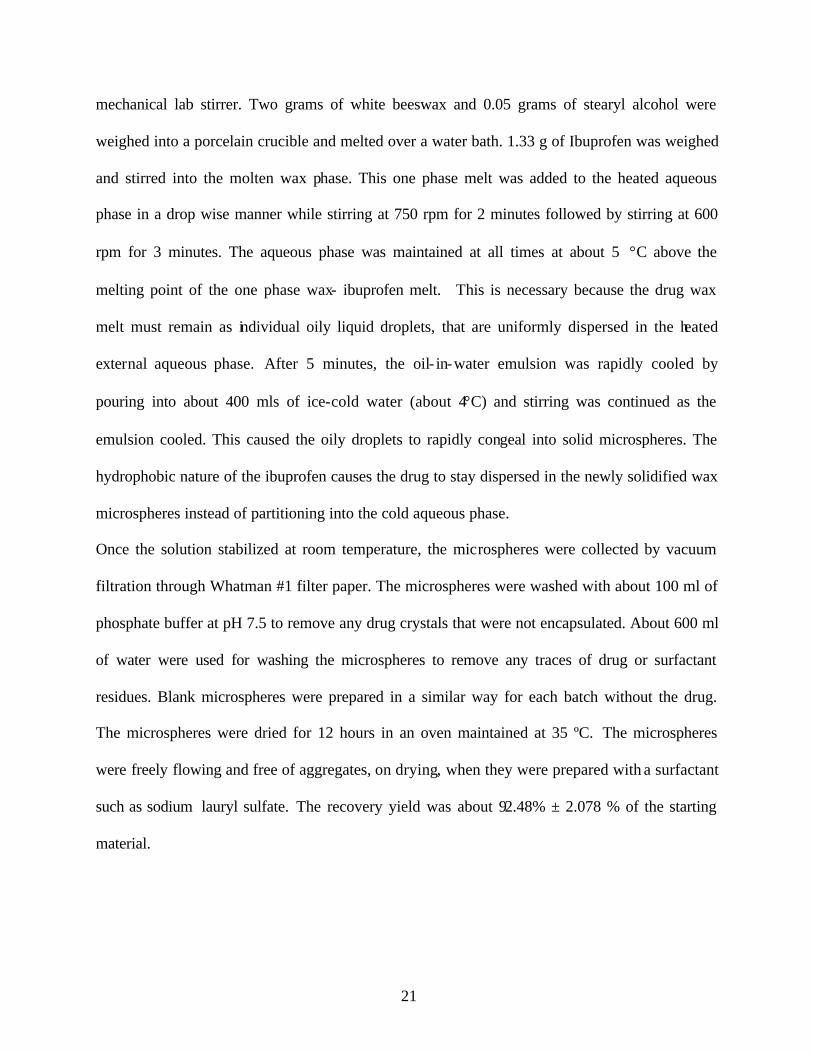
21
mechanical lab stirrer. Two grams of white beeswax and 0.05 grams of stearyl alcohol were
weighed into a porcelain crucible and melted over a water bath. 1.33 g of Ibuprofen was weighed
and stirred into the molten wax phase. This one phase melt was added to the heated aqueous
phase in a drop wise manner while stirring at 750 rpm for 2 minutes followed by stirring at 600
rpm for 3 minutes. The aqueous phase was maintained at all times at about 5 °C above the
melting point of the one phase wax- ibuprofen melt. This is necessary because the drug wax
melt must remain as individual oily liquid droplets, that are uniformly dispersed in the heated
external aqueous phase. After 5 minutes, the oil- in-water emulsion was rapidly cooled by
pouring into about 400 mls of ice-cold water (about 4°C) and stirring was continued as the
emulsion cooled. This caused the oily droplets to rapidly congeal into solid microspheres. The
hydrophobic nature of the ibuprofen causes the drug to stay dispersed in the newly solidified wax
microspheres instead of partitioning into the cold aqueous phase.
Once the solution stabilized at room temperature, the microspheres were collected by vacuum
filtration through Whatman #1 filter paper. The microspheres were washed with about 100 ml of
phosphate buffer at pH 7.5 to remove any drug crystals that were not encapsulated. About 600 ml
of water were used for washing the microspheres to remove any traces of drug or surfactant
residues. Blank microspheres were prepared in a similar way for each batch without the drug.
The microspheres were dried for 12 hours in an oven maintained at 35 ºC. The microspheres
were freely flowing and free of aggregates, on drying, when they were prepared with a surfactant
such as sodium lauryl sulfate. The recovery yield was about 92.48% ± 2.078 % of the starting
material.
22
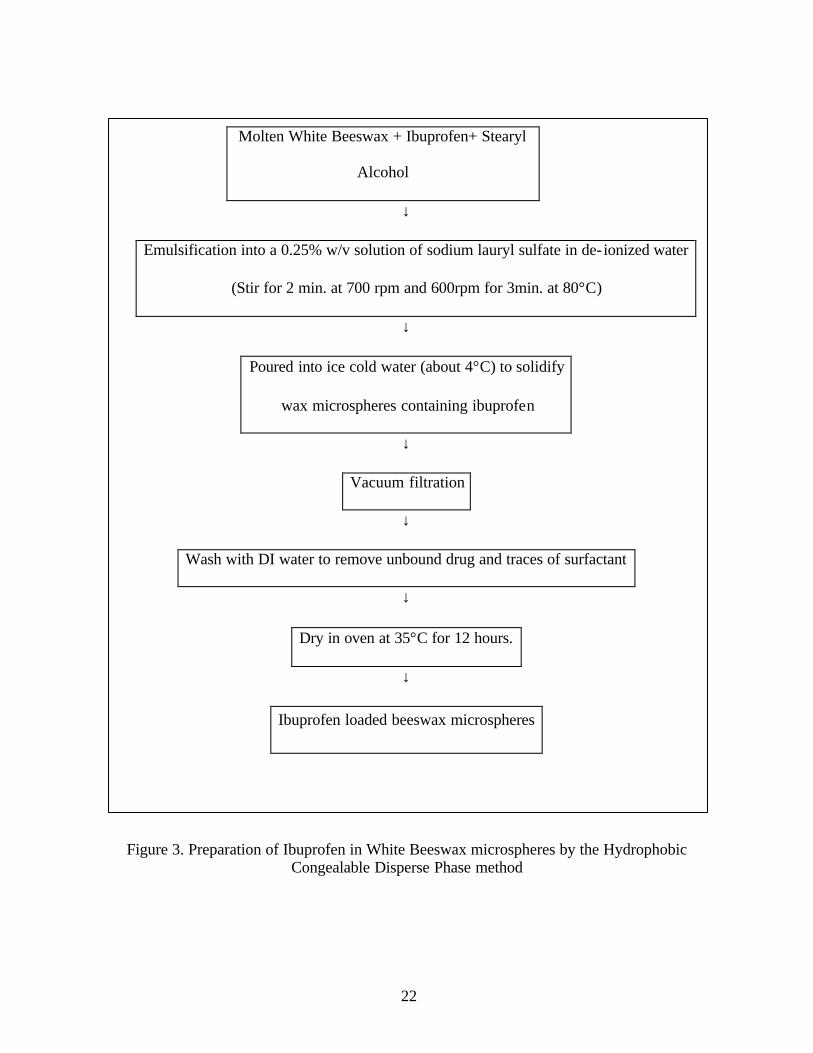
Molten White Beeswax + Ibuprofen+ Stearyl
Alcohol
↓
Emulsification into a 0.25% w/v solution of sodium lauryl sulfate in de- ionized water
(Stir for 2 min. at 700 rpm and 600rpm for 3min. at 80°C)
↓
Poured into ice cold water (about 4°C) to solidify
wax microspheres containing ibuprofen
↓
Vacuum filtration
↓
Wash with DI water to remove unbound drug and traces of surfactant
↓
Dry in oven at 35°C for 12 hours.
↓
Figure 3. Preparation of Ibuprofen in White Beeswax microspheres by the Hydrophobic Congealable Disperse Phase method
Ibuprofen loaded beeswax microspheres
23
EVALUATION OF MICROSPHERES:
Particle size distribution of the microspheres:
Size analysis of the microspheres was accomplished by sieving. The batch of microspheres was
placed on a nest of seven sieves in the range of 63µ to 710µ. The largest sieve (710µ) was placed
on top and the sieves were arranged in descending order of aperture size from top to bottom. The
sieves were manually tapped on a wooden surface from a height of about 1 inch for 5 min. The
microspheres retained on each sieve were lightly pressed with a rubber spatula to separate the
loosely aggregated particles. The microspheres were further shaken for 5 min and amount of the
microspheres retained on each sieve was weighed. The arithmetic mean of the size of the sieve
preceding and retaining sieves were assigned to the fraction of microspheres on the retaining
sieve.
Batches of microspheres prepared under the same conditions were reproducible with respect to
the mean size of the microsphere population.
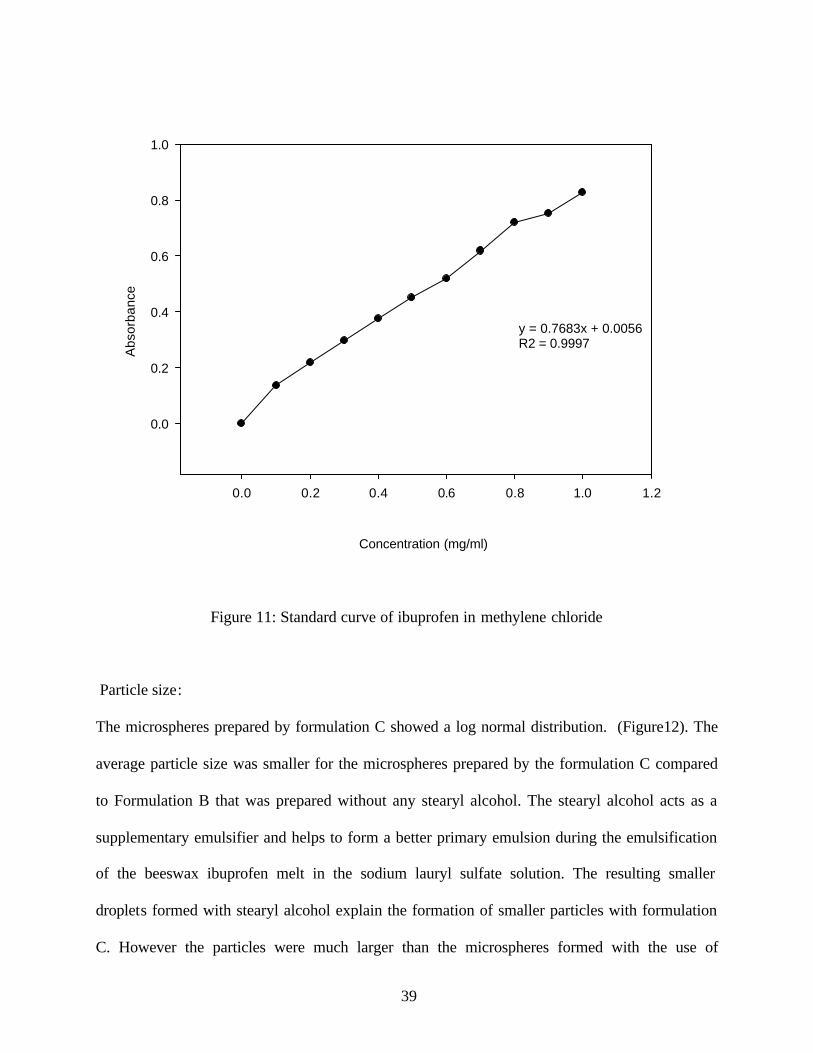
Standard curve of Ibuprofen in methylene chloride:
A stock solution of 1 mg/ml was prepared. 100 mg of ibuprofen was weighed into a 100 ml
volumetric flask. About 50 ml of methylene chloride was added to the volumetric flask and the
ibuprofen was dissolved in it. The volume was made up to 100 ml in the volumetric flask. From
this solution successive dilutions of 0.1 mg/ml, 0.2 mg/ml, 0.3 mg/ml and so on were prepared.
The absorbance of these solutions was recorded and a standard curve was prepared. Another
solution of 10 mg/ml was also prepared and from this solution successive dilutions were made of
24
1 mg/ml, 2 mg/ml, and 3 mg/ml and so on. The absorbance of these solutions was also recorded
and a standard curve was prepared that was linear from 0.1 mg/ml to 4 mg/ml.
Determination of microsphere drug content:
One hundred mg. of drug- loaded microspheres of each batch and size were randomly taken.
They were observed under the microscope for consistency. The microspheres were added to a
tared volumetric flask. Sufficient methylene chloride was added to the volumetric flask to
dissolve the microspheres. The wax was completely dissolved releasing the entire incorporated
drug. The volume was then made upto 100 mls. The solution was then filtered through a 0.45 µ
filter and absorbance was determined spectrophotometrically at 261.7 nm wavelength against a
blank prepared with microspheres containing no drug. The corresponding calculations were
calculated from a standard curve, which was linear from 0.1mg/ml to 4 mg/ml.
Determination of saturation solubility of the ibuprofen in the dissolution medium.
The dissolution medium used in this study was modified Simulated Intestinal Fluid (SIF) USP.
The SIF used in the study was prepared as recommended by the USPNF, except that no enzymes
were used, 0.02% Tween 80 was added to ensure wetting of the wax microspheres by the
medium and the pH of the medium was adjusted to 7.2 instead of 6.8 as recommended by the
USP. In order to determine the saturation solubility of ibuprofen in this medium, excess drug (1.5
g) of Ibuprofen was added to 20 ml of dissolution media. This suspension was shaken in water
bath at 37 °C for 48 hrs at 75 rpm.
At the end of 48 hrs, the solution was filtered at 37 °C. This solution was too concentrated to be
analyzed as such by the spectrophotometer. So, 1 ml of the filtrate was diluted to 100 ml in a
25
volumetric flask with dissolution medium at 37 °C. The absorbance of this solution was recorded
and the calculations were made to determine the saturation solubility of ibuprofen in the
dissolution medium used in the study.
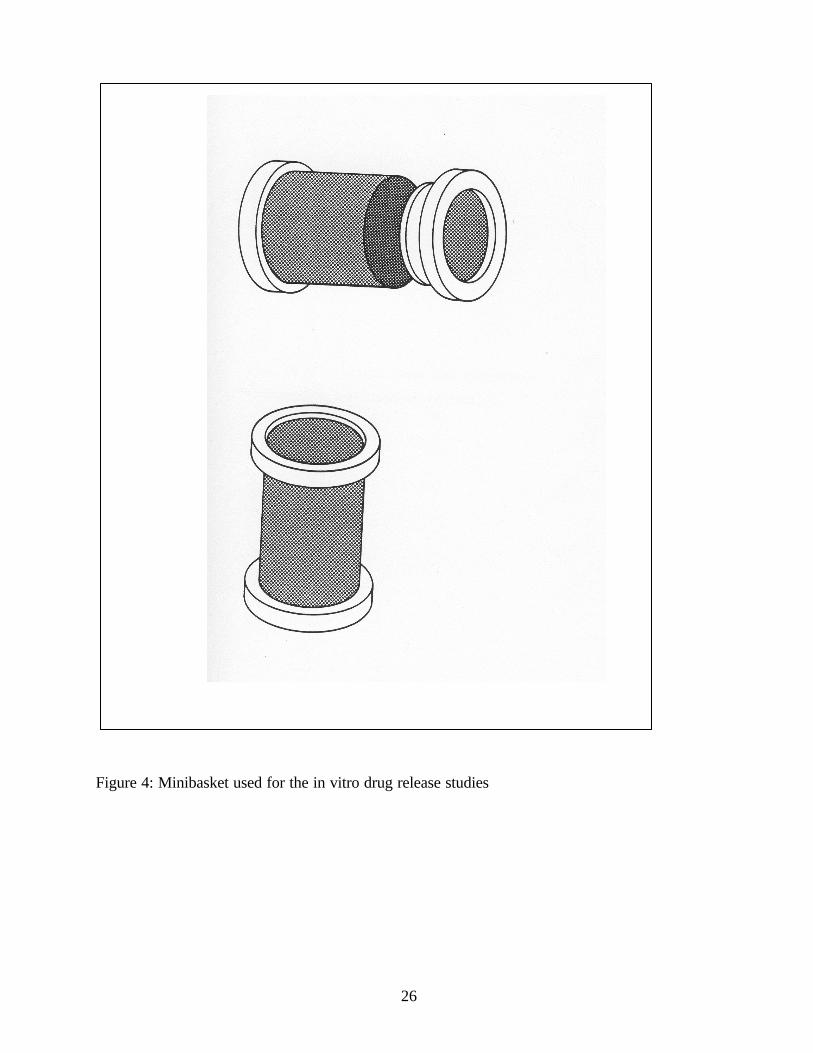
In vitro dissolution testing of microspheres:
The in vitro drug release of the drug from the microsphere formulations was determined by the
in-vitro dissolution tests. For these studies, pooled samples of each formulation type were used.
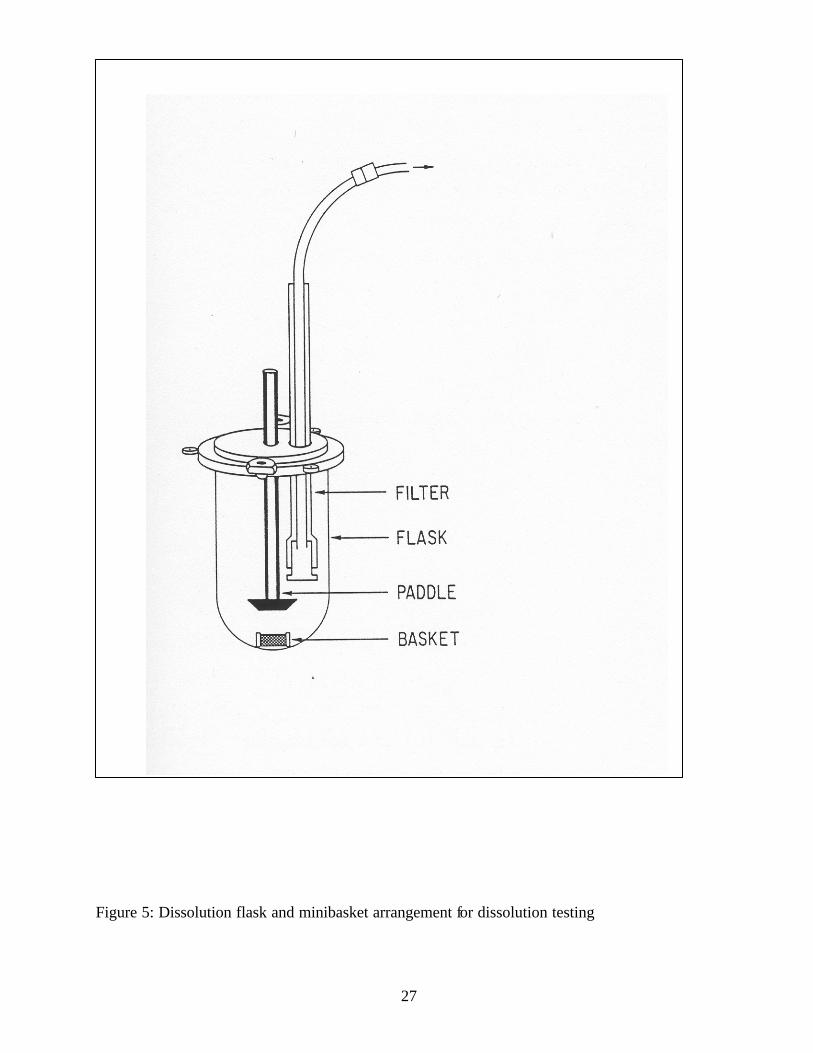
The USP Apparatus I (Paddle type) was used for dissolution testing. Since the wax microspheres
had a tendency to float in the dissolution medium, the USP paddle apparatus was modified. Six 3
x 2 cm-diameter stainless steel baskets with 100 mesh screens (Figure 3, 4) were constructed at
the machine shop at the University of Georgia. These mini baskets were used to hold the
microsphere sample at the bottom of the vessel. The minibaskets were stationary and the only
stirring elements were the paddles. The stirring speed used was 100 ± 1 rpm. The temperature
was maintained at 37 °C ±0.1 °C. Nine hundred ml of Simulated Intestinal Fluid (SIF) USPNF,
(no enzymes, 0.02 % w/v Tween 80, and pH 7.4) was used as the dissolution medium. (Figure 9)
Aliquots were withdrawn at the specific intervals and they were filtered through a 10µ Vankel
input filter. The same volume of fresh dissolution medium was replaced after withdrawing an
aliquot, so that the volume of the dissolution medium remained constant. The samples were
analyzed at 262.1 nm wavelength spectrophotometrically. The cumulative amount of drug
released at the end of 24 hours was plotted against time to find the release profile of the
microspheres. The results were reported as the mean of four dissolutions.
26
Figure 4: Minibasket used for the in vitro drug release studies
27
Figure 5: Dissolution flask and minibasket arrangement for dissolution testing
28
Microscopic evaluation of the microspheres:
A scanning electron microscope (LEO 982) was used to study the surface characteristics of the
microscopes before and after dissolution. Samples were attached to aluminum stubs with 12mm
diameter carbon adhesive tabs. Samples were coated for 90 sec with gold palladium in a sputter
coater (Structure Probe Inc) for a coating thickness of approximately 23.0 nm.
PREPARATION OF TABLETED MICROSPHERES:
Tableting process:
Appropriate amounts of microspheres (formulation 3) were blended with Avicel PH 101® and
Explotab®. (Table 3) The mixture was then compressed by direct compression in a Carver
hydraulic press (Fred S. Carver, Inc., NJ, USA) to a weight of 550 mg per tablet. A ½ inch
(12.70mm) diameter fat- face punch and die set was used to compress microsphere-excepient
mixtures into tablets at compression pressure from 600 PSI (pounds per square inch) to 4000
PSI. (3 different compression pressures were used). Each compression pressure was held at 40 s
followed by a quick release. Each tablet contained 81.83 mg of ibuprofen
Table 3: Microsphere tablet formulation
Ingredients %
Ibuprofen microspheres 42
Avicel PH 101® 55
Explotab® 3
29
The effect of the different compression pressures was studied by evaluating the tablets in terms
of their physical properties and their drug release.
EVALUATION OF TABLETED MICROSPHERES
Determination of tablet thickness and density:
Six tablets from each batch were weighed and their mean weights were calculated. The thickness
and diameter of each tablet was measured using a digital caliper and the average thicknesses as
well as diameters were calculated. The tablet densities were calculated from the mean volume
and the mean weight of the tablets. Variation in the size and weight of individual tablets was
determined.
Determination of tablet crushing strength (hardness):
The crushing strength of the tablets was measured using a hardness tester (Erweka Chemical and
Pharmaceutical Industry Co., NJ, USA). This applied compressional force diametrically to the
tablets. Six tablets were measured from each batch. The force required to crush the tablets was
recorded in kilograms.
In vitro dissolution studies
The in vitro dissolution was performed using the USP Type II apparatus (Prolabo Dissolutest
Dissolution Apparatus). Four replicates of tablets were placed in the dissolution medium. The
dissolution medium used in this case was 450 ml of SIF (Simulated Intestinal Fluid) pH 7.2
containing 0.02 % Tween 80. Samples of 5 ml were taken at the time intervals of 30minutes, 1h,
2h, 4h, 6h, 8h and 12h. The dissolution medium was maintained at 37 ºC ±0.5 ºC throughout the
30
study. The dissolution samples were filtered through 10µ inline filters. The samples were
analyzed by UV spectrophotometry at 262.1 nm against a blank tablet dissolution. (Figure9)
Microscopic evaluation:
The morphology of the broken diametrical surface of tablets was observed using a scanning
electron microscope (FE-SEM, LEO electron microscopy, Inc., Thornwood, NY). The broken
tablet surfaces were sputter coated with gold to a thickness of 50 nm to observe the surface
morphology of compressed microspheres.
RESULTS AND DISCUSSION:
PRELIMINARY STUDIES:
In the initial studies microcrystalline wax (MP: 92°C) was used as the wax to encapsulate the
ibuprofen using the melt congeal method. Dur ing these experiments about 25 % Stearyl alcohol
was used as the wax modifier because the wax droplets had a tendency to agglomerate on
cooling. On solidification the microspheres formed chains and aggregates. The concentration of
the surfactant used in the aqueous phase was 0.5% SLS. The microspheres obtained in this study
had a mean particle size of 90µ (Figure 4). However, the drug content of these microspheres was
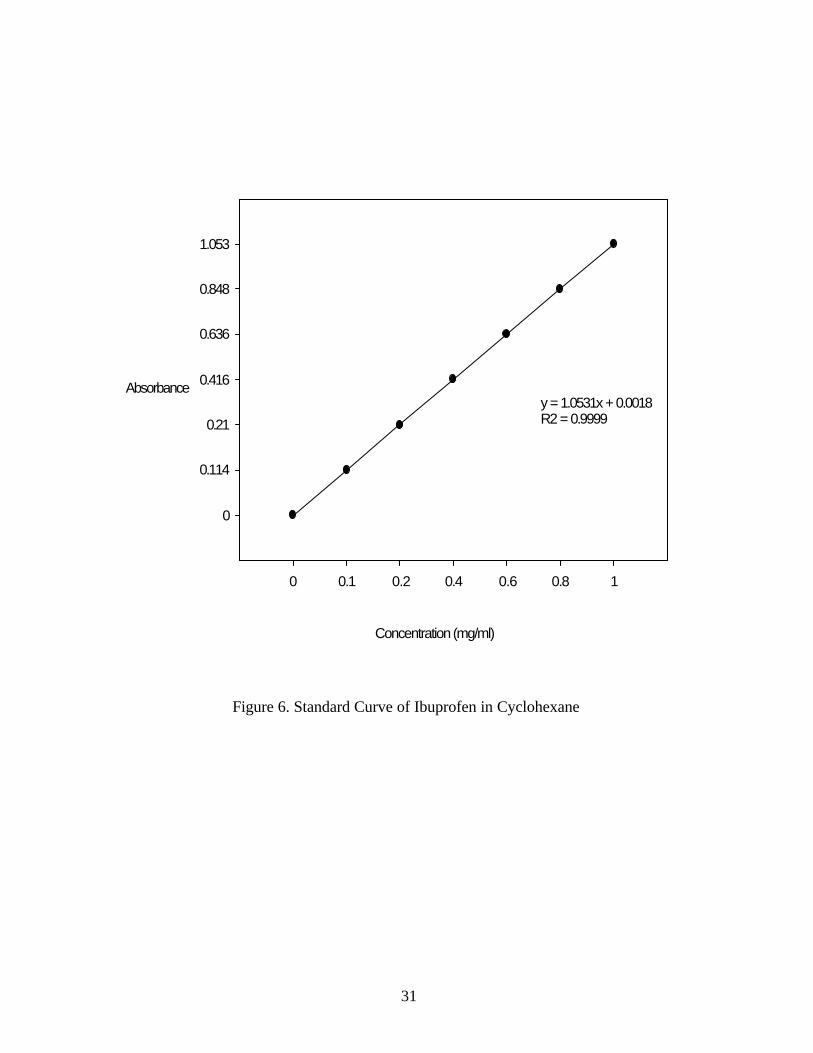
only 36.43%. The drug content of these microspheres was calculated from a standard curve of
ibuprofen in cyclohexane linear up to 1 mg/ml. (R2 =0.9999) (Figure 6.)
31
0 0.1 0.2 0.4 0.6 0.8 1
0
0.114
0.21
0.416
0.636
0.848
1.053
Absorbance
Concentration (mg/ml)
y = 1.0531x + 0.0018R2 = 0.9999
Figure 6. Standard Curve of Ibuprofen in Cyclohexane
32
Incorporation of ibuprofen into the microcrystalline wax microspheres required the use of a
surfactant in the aqueous phase. Sodium lauryl sulfate was used to decrease the interfacial
tension between the hydrophobic material and the external aqueous phase and to aid in wetting
of the oily droplets of the internal phase. The optimum surfactant concentration found was 0.5 %
w/v. At this concentration the microspheres produced did not aggregate. Microcrystalline wax
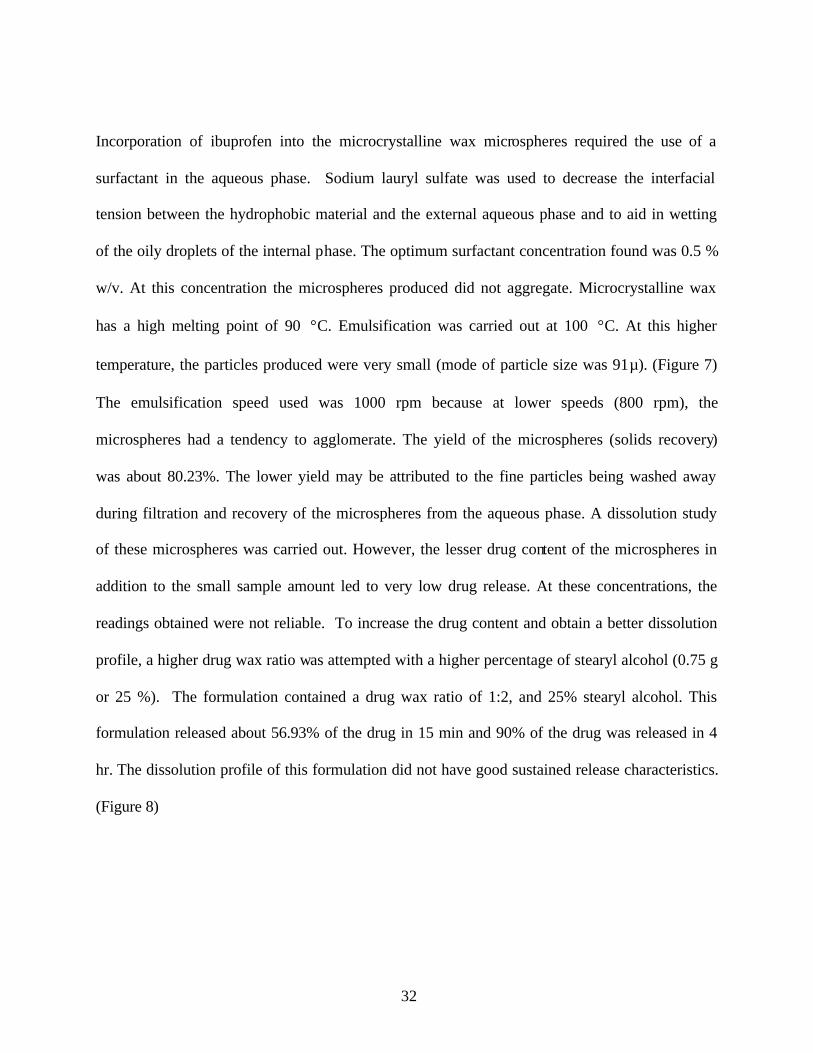
has a high melting point of 90 °C. Emulsification was carried out at 100 °C. At this higher
temperature, the particles produced were very small (mode of particle size was 91µ). (Figure 7)
The emulsification speed used was 1000 rpm because at lower speeds (800 rpm), the
microspheres had a tendency to agglomerate. The yield of the microspheres (solids recovery)
was about 80.23%. The lower yield may be attributed to the fine particles being washed away
during filtration and recovery of the microspheres from the aqueous phase. A dissolution study
of these microspheres was carried out. However, the lesser drug content of the microspheres in
addition to the small sample amount led to very low drug release. At these concentrations, the
readings obtained were not reliable. To increase the drug content and obtain a better dissolution
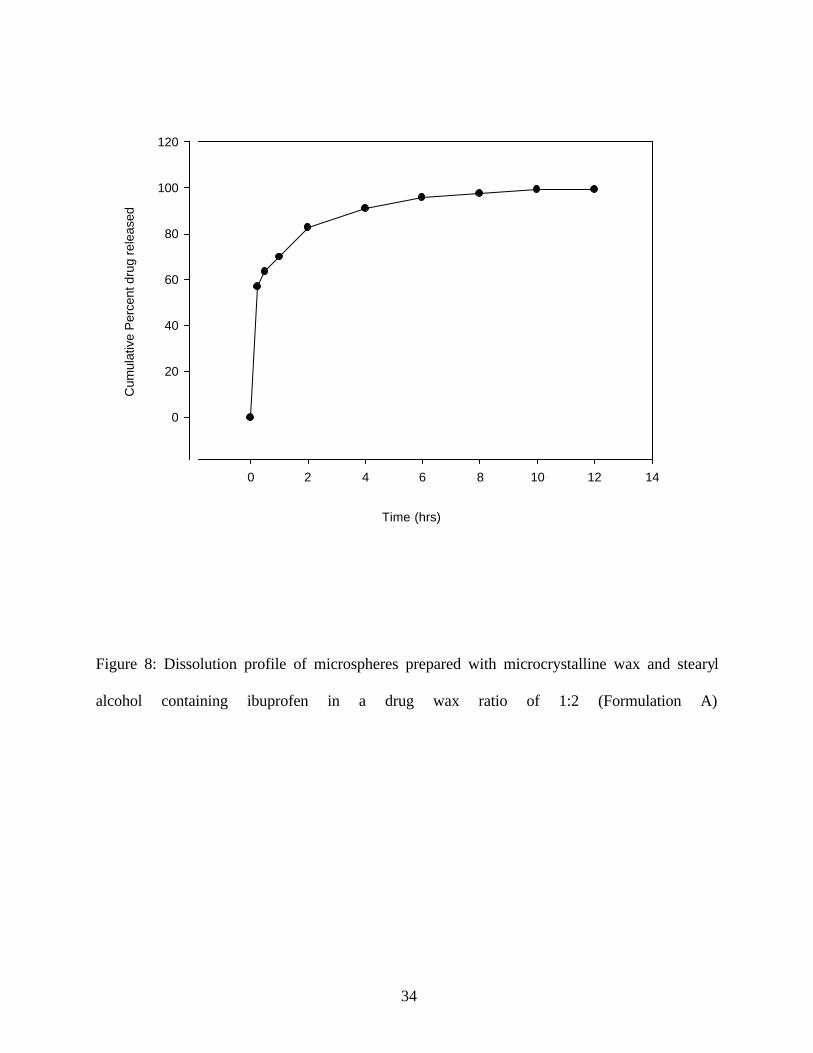
profile, a higher drug wax ratio was attempted with a higher percentage of stearyl alcohol (0.75 g
or 25 %). The formulation contained a drug wax ratio of 1:2, and 25% stearyl alcohol. This
formulation released about 56.93% of the drug in 15 min and 90% of the drug was released in 4
hr. The dissolution profile of this formulation did not have good sustained release characteristics.
(Figure 8)
33
-200 0 200 400 600 800 10000
10
20
30
40
Sieve Size (Microns)
% Retained on Sieve
Figure 7: Average particle size distribution for microspheres prepared with microcrystalline wax
and stearyl alcohol containing ibuprofen in drug wax ratio of 1:2 (Formulation A)
34
0 2 4 6 8 10 12 14
0
20
40
60
80
100
120C
umul
ativ
e P
erce
nt d
rug
rele
ased
Time (hrs)
Figure 8: Dissolution profile of microspheres prepared with microcrystalline wax and stearyl
alcohol containing ibuprofen in a drug wax ratio of 1:2 (Formulation A)
35
PREPARATION OF MICROSPHERES
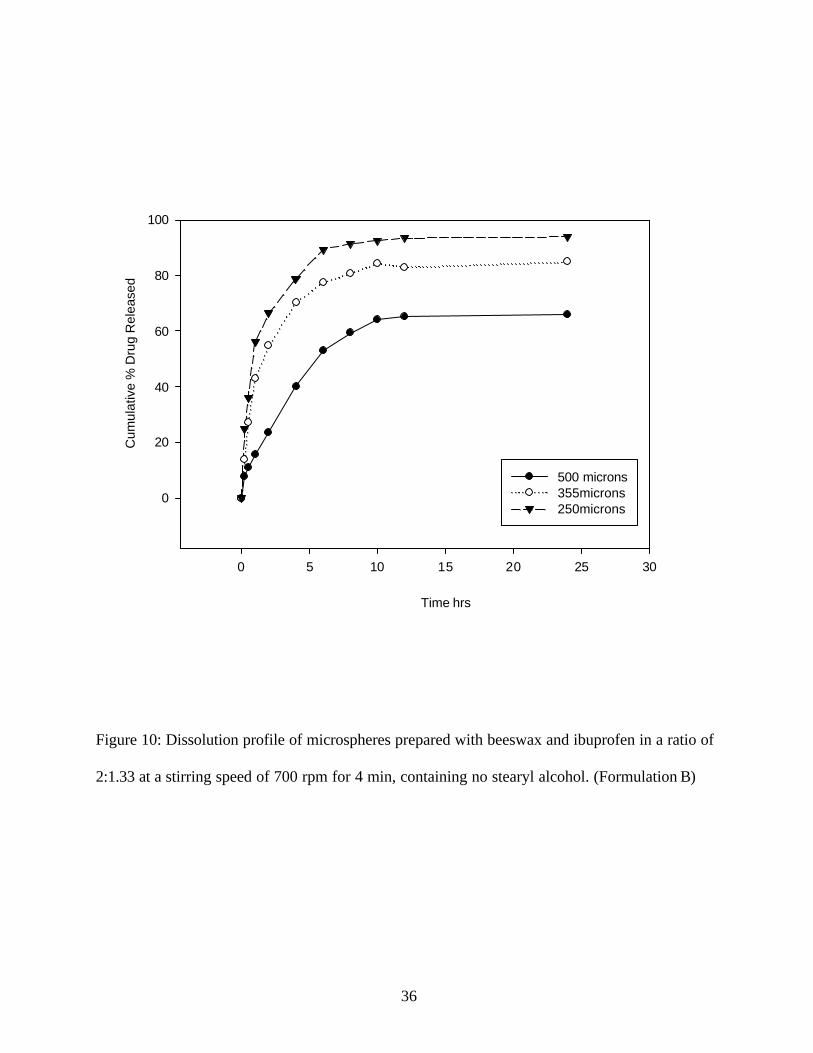
In order to improve the encapsulation efficiency and the yield of microspheres, and drug release
profile, beeswax was used instead of microcrystalline wax. The formulation was prepared in a
similar way as the microcrystalline wax microspheres. The drug: wax ratio used was 2:1.33 and
the stirring speed used was 700 rpm for 4 min. This formulation did not provide a sustained
release as 50% of the drug was released in 1 hr in the dissolution studies and 80% of the drug
was released in 6 hrs (for the particle size fraction of 250 micron). (Figure10)
0.0 0.2 0.4 0.6 0.8 1.0 1.2
0.0
0.2
0.4
0.6
0.8
1.0
Abs
orba
nce
Concentration (mg/ml)
y = 0.7683x + 0.0056R2 = 0.9997
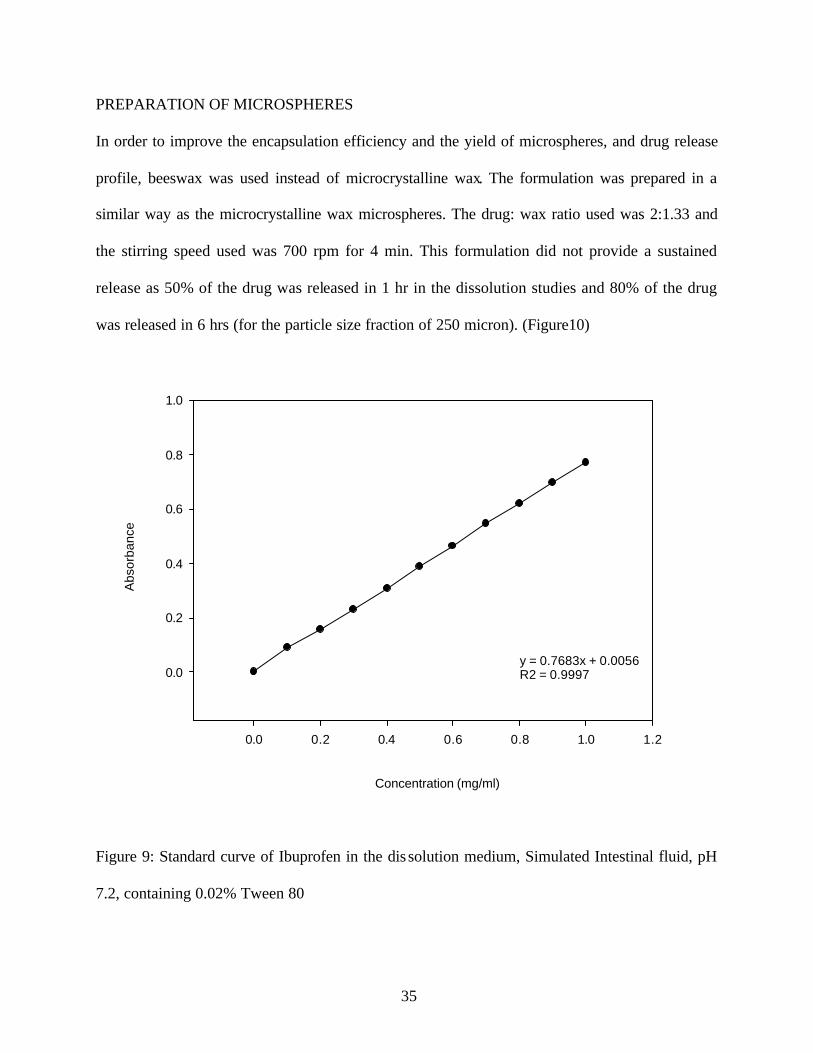
Figure 9: Standard curve of Ibuprofen in the dis solution medium, Simulated Intestinal fluid, pH
7.2, containing 0.02% Tween 80
36
0 5 10 15 20 25 30
0
20
40
60
80
100
500 microns355microns250microns
Time hrs
Cum
ulat
ive
% D
rug
Rel
ease
d
Figure 10: Dissolution profile of microspheres prepared with beeswax and ibuprofen in a ratio of
2:1.33 at a stirring speed of 700 rpm for 4 min, containing no stearyl alcohol. (Formulation B)
37
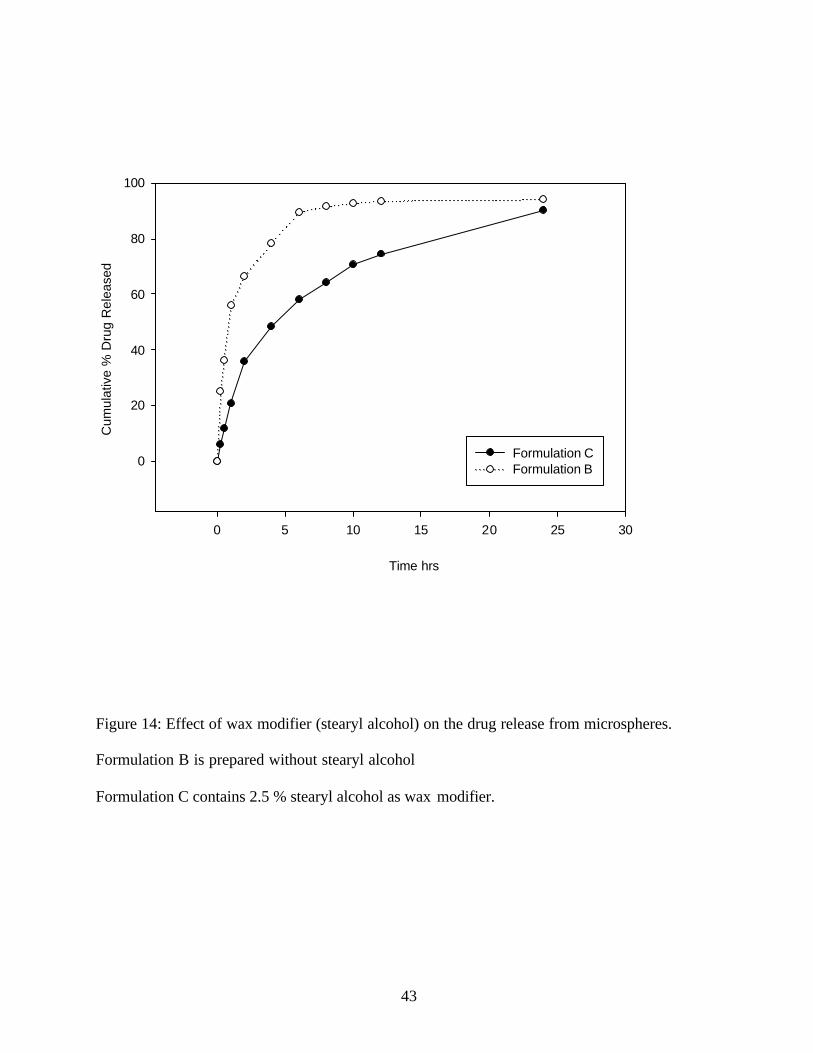
To improve the release pattern and to assure more completely release, stearyl alcohol was used
as a wax modifier. (Figure14) Stearyl alcohol used in a concentration of 20% as well as 10%
gave very fine particles, which could not be separated by vacuum filtration. Stearyl alcohol used
at 2.5 % gave satisfactory results when the stirring speed was dropped to 700rpm for 2 minutes
followed by 600rpm for another 3 minutes. (Formulation C)
The amount of SLS required to emulsify the one phase melt of ibuprofen and beeswax into water
was found to be only 0.25 % SLS in deionized water as the surfactant. The solids recovery was
found to be 92% w/w.
It has been reported by Giannola et al in 1995, that during the emulsification stage, the
entrapment of the acidic drug valproic acid was pH dependent (24). As the pH of the external
phase decreased, the solubility of valproic acid decreased and the encapsulated amount of the
drug increased. Hence, the pH of the 0.25 % SLS solution was reduced to pH 4.5 using 0.2 N
HCl and this was used as the external phase for the emulsification of beeswax and ibuprofen
melt. However no significant change in the drug entrapment was found in this study although
ibuprofen is an acidic drug. These results showed that the entrapment of ibuprofen was not pH
dependent over this pH range, therefore pH 7 was used for emulsification for the remainder of
the studies. The microspheres prepared with beeswax had some ibuprofen crystals outside the
microspheres. The microspheres were washed with about 100 ml of phosphate buffer pH 7.4 to
remove the unencapsulated ibuprofen crystals.
38
EVALUATION OF MICROSPHERES
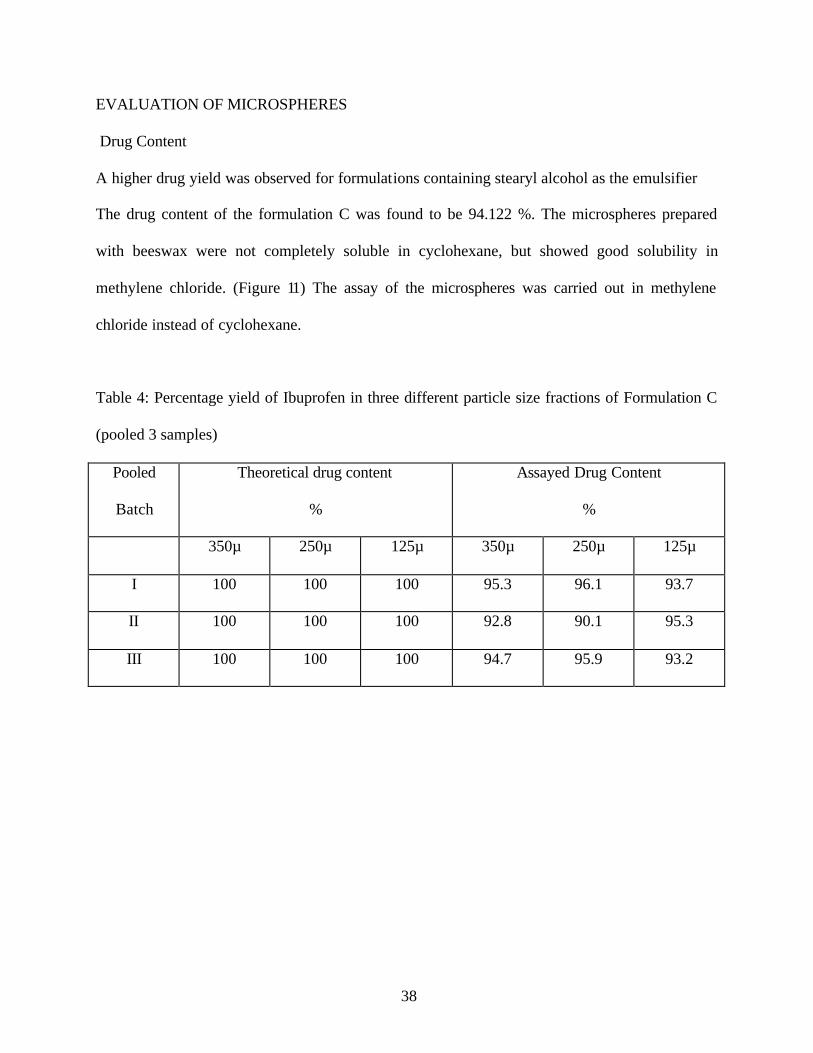
Drug Content
A higher drug yield was observed for formulations containing stearyl alcohol as the emulsifier
The drug content of the formulation C was found to be 94.122 %. The microspheres prepared
with beeswax were not completely soluble in cyclohexane, but showed good solubility in
methylene chloride. (Figure 11) The assay of the microspheres was carried out in methylene
chloride instead of cyclohexane.
Table 4: Percentage yield of Ibuprofen in three different particle size fractions of Formulation C
(pooled 3 samples)
Pooled
Batch
Theoretical drug content
%
Assayed Drug Content
%
350µ 250µ 125µ 350µ 250µ 125µ
I 100 100 100 95.3 96.1 93.7
II 100 100 100 92.8 90.1 95.3
III 100 100 100 94.7 95.9 93.2
39
0.0 0.2 0.4 0.6 0.8 1.0 1.2
0.0
0.2
0.4
0.6
0.8
1.0
Concentration (mg/ml)
Abs
orba
nce
y = 0.7683x + 0.0056R2 = 0.9997
Figure 11: Standard curve of ibuprofen in methylene chloride
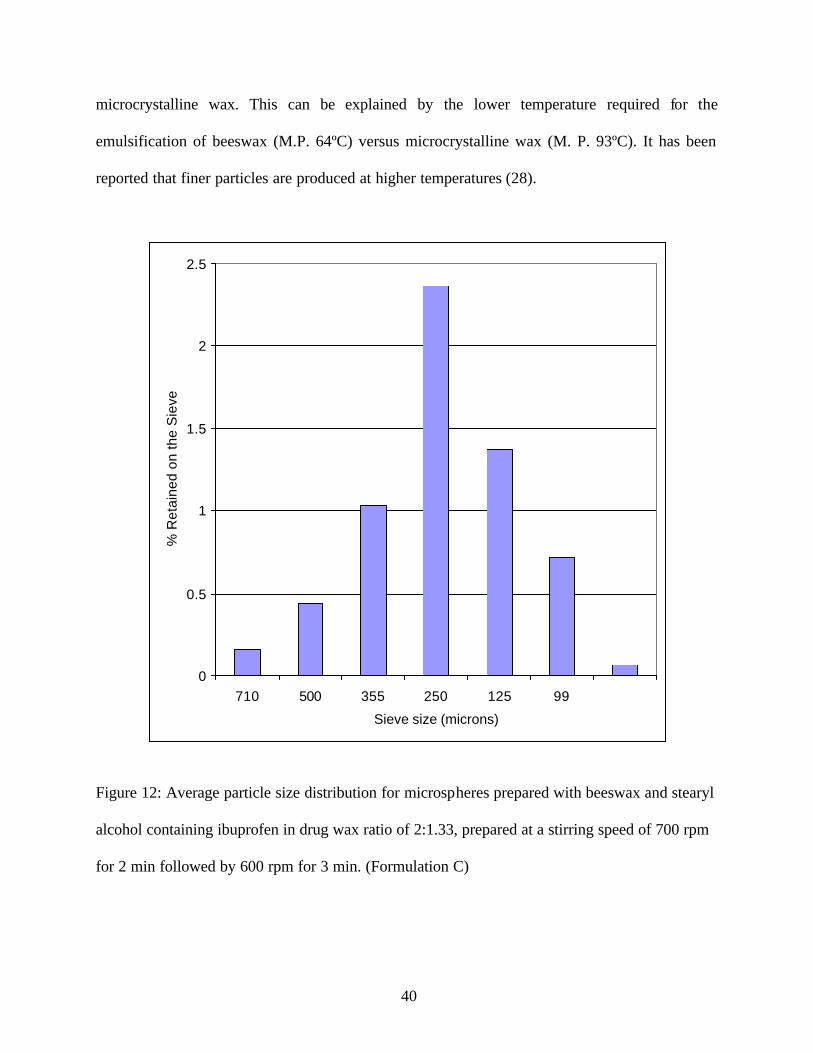
Particle size:
The microspheres prepared by formulation C showed a log normal distribution. (Figure12). The
average particle size was smaller for the microspheres prepared by the formulation C compared
to Formulation B that was prepared without any stearyl alcohol. The stearyl alcohol acts as a
supplementary emulsifier and helps to form a better primary emulsion during the emulsification
of the beeswax ibuprofen melt in the sodium lauryl sulfate solution. The resulting smaller
droplets formed with stearyl alcohol explain the formation of smaller particles with formulation
C. However the particles were much larger than the microspheres formed with the use of
40
microcrystalline wax. This can be explained by the lower temperature required for the
emulsification of beeswax (M.P. 64ºC) versus microcrystalline wax (M. P. 93ºC). It has been
reported that finer particles are produced at higher temperatures (28).
Figure 12: Average particle size distribution for microspheres prepared with beeswax and stearyl
alcohol containing ibuprofen in drug wax ratio of 2:1.33, prepared at a stirring speed of 700 rpm
for 2 min followed by 600 rpm for 3 min. (Formulation C)
0
0.5
1
1.5
2
2.5
710 500 355 250 125 99
Sieve size (microns)
% R
etai
ned
on th
e S
ieve
41
IN VITRO DISSOLUTION TESTING OF MICROSPHERES:
For the in vitro drug release studies, in order to maintain sink conditions, amount of drug
corresponding to 5% of the saturation solubility is recommended. The saturation solubility of
ibuprofen in the dissolution medium used in this test was found. The saturation solubility of
ibuprofen in enzyme less SIF at pH 7.2 containing 0.02% Tween 80 was found to be 27 mg/ml.
Five percent of this concentration is 1.35mg/ml. Considering the use of 900 mls of dissolution
medium, the maximum drug that can be used in sink conditions is 1215 mgs of ibuprofen.
In the dissolution studies with beeswax, 1000 mgs of microspheres were used. Each dissolution
vessel containing 900 mls of simulated intestinal fluid (SIF) as dissolution medium contained
about 389.66 mg of ibuprofen. This quantity of ibuprofen is much below the concentration of
drug required to achieve the sink conditions. (Figure 6)
The dissolution studies were carried out on three different particle size fractions of Formulation
C to study the effect of particle size on the drug release from the formulation. The pooled
samples from 4 different batches of microspheres retained on the 350µ, 250µ and 125µ sieves
were used for this study.
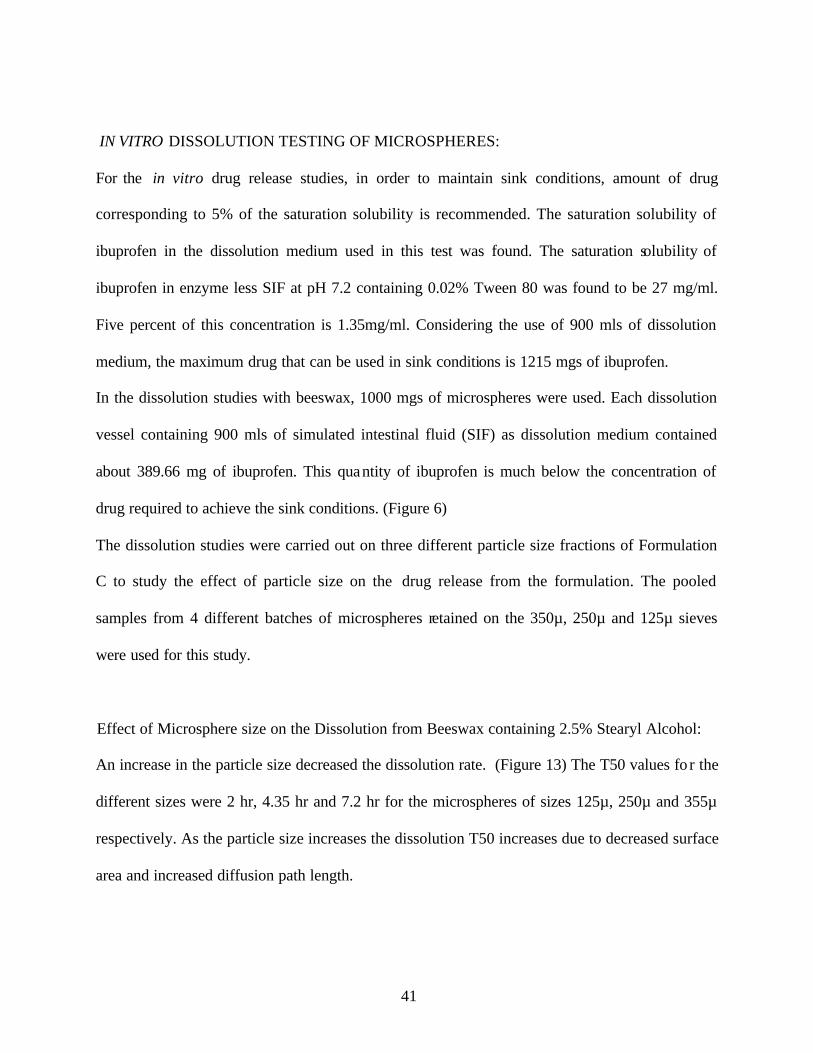
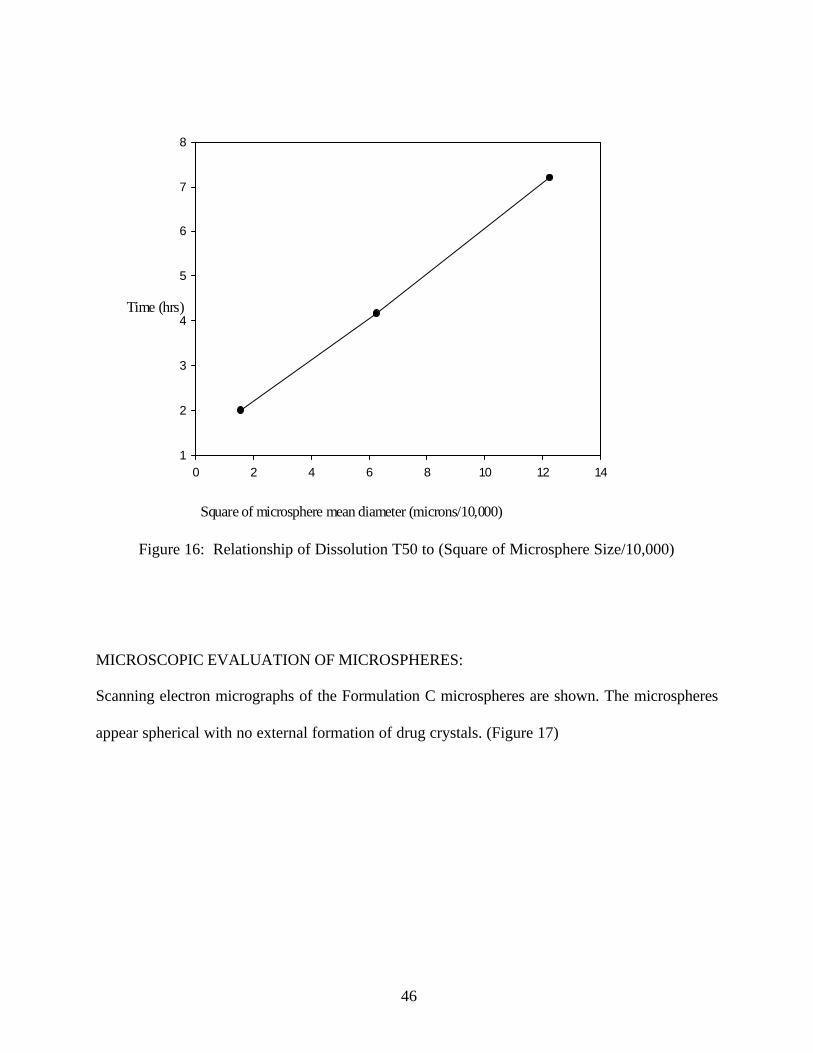
Effect of Microsphere size on the Dissolution from Beeswax containing 2.5% Stearyl Alcohol:
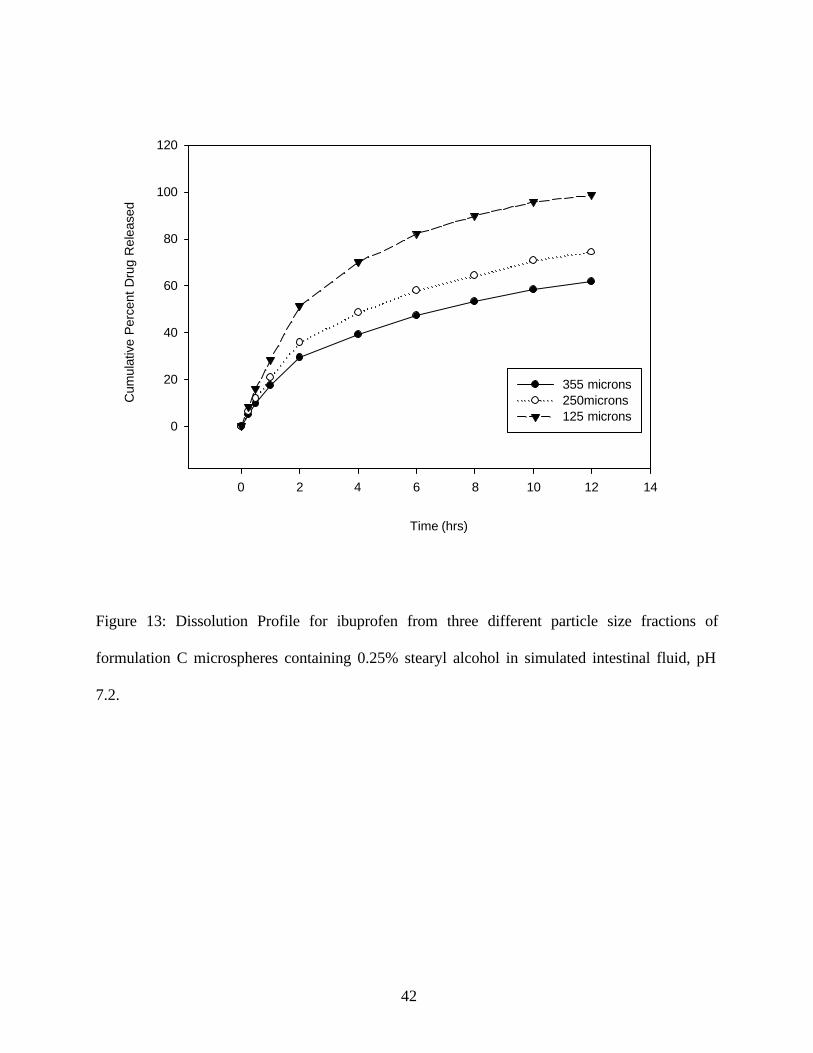
An increase in the particle size decreased the dissolution rate. (Figure 13) The T50 values fo r the
different sizes were 2 hr, 4.35 hr and 7.2 hr for the microspheres of sizes 125µ, 250µ and 355µ
respectively. As the particle size increases the dissolution T50 increases due to decreased surface
area and increased diffusion path length.
42
0 2 4 6 8 10 12 14
0
20
40
60
80
100
120
355 microns250microns125 microns
Time (hrs)
Cum
ulat
ive
Per
cent
Dru
g R
elea
sed
Figure 13: Dissolution Profile for ibuprofen from three different particle size fractions of
formulation C microspheres containing 0.25% stearyl alcohol in simulated intestinal fluid, pH
7.2.
43
0 5 10 15 20 25 30
0
20
40
60
80
100
Formulation CFormulation B
Time hrs
Cum
ulat
ive
% D
rug
Rel
ease
d
Figure 14: Effect of wax modifier (stearyl alcohol) on the drug release from microspheres.
Formulation B is prepared without stearyl alcohol
Formulation C contains 2.5 % stearyl alcohol as wax modifier.
44
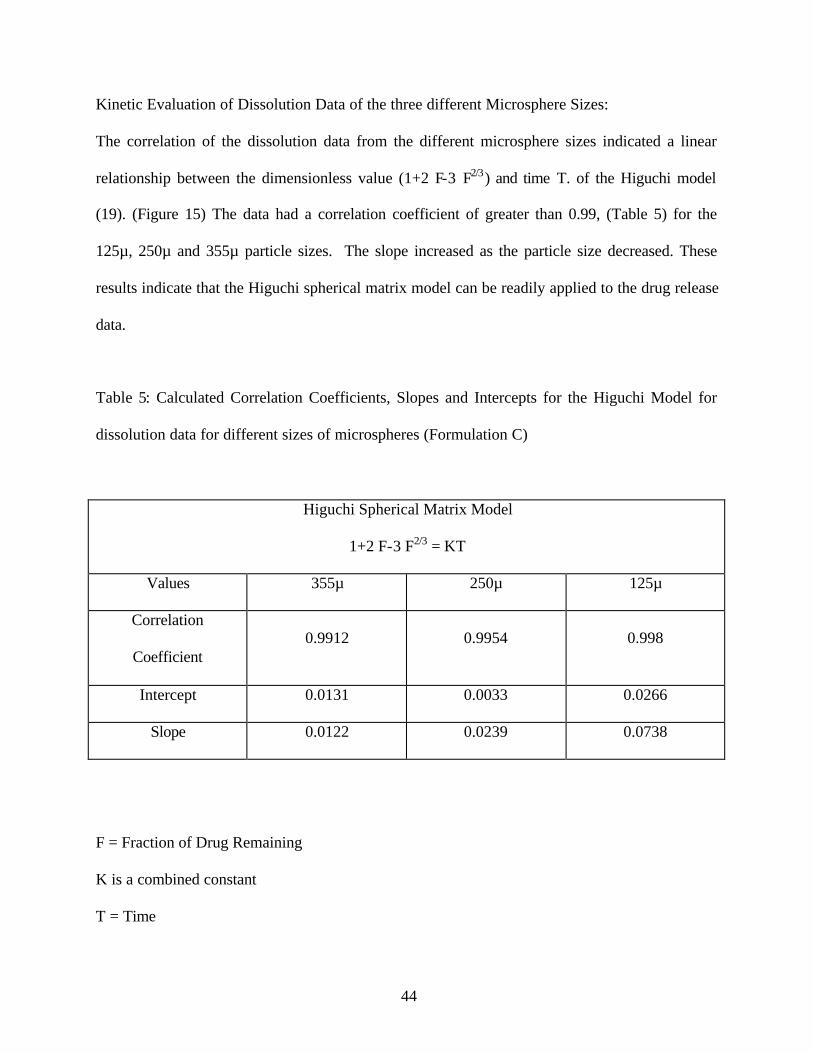
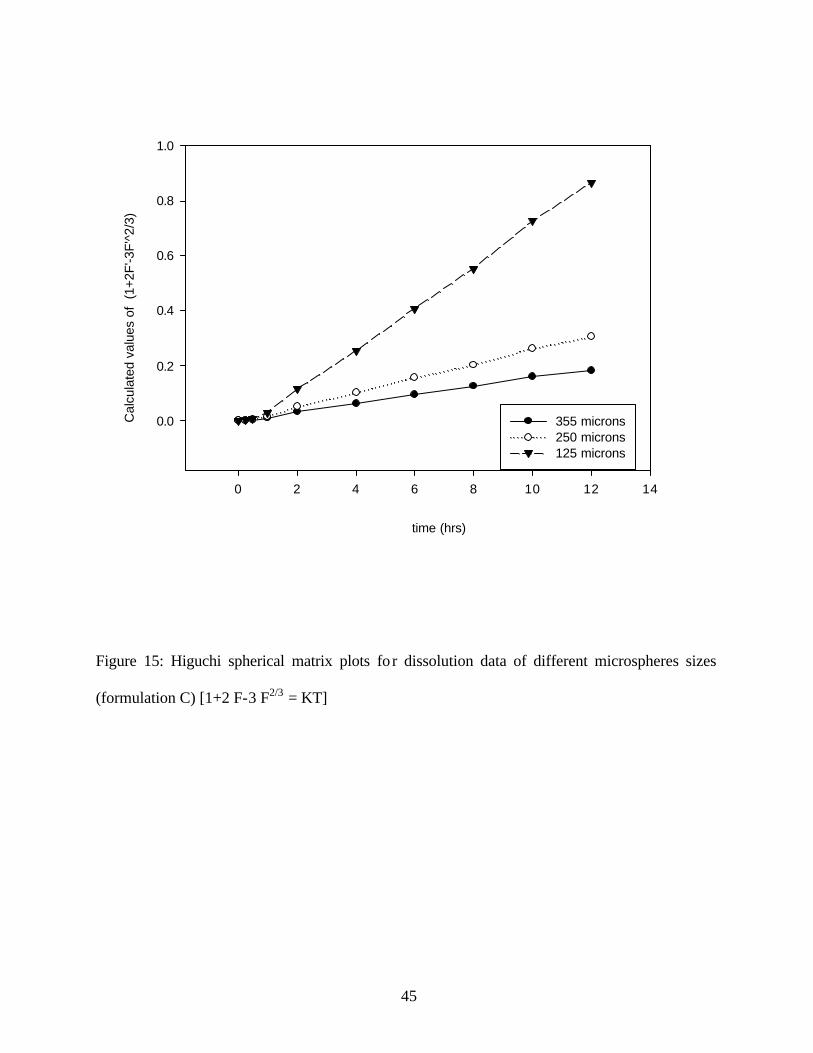
Kinetic Evaluation of Dissolution Data of the three different Microsphere Sizes:
The correlation of the dissolution data from the different microsphere sizes indicated a linear
relationship between the dimensionless value (1+2 F-3 F2/3) and time T. of the Higuchi model
(19). (Figure 15) The data had a correlation coefficient of greater than 0.99, (Table 5) for the
125µ, 250µ and 355µ particle sizes. The slope increased as the particle size decreased. These
results indicate that the Higuchi spherical matrix model can be readily applied to the drug release
data.
Table 5: Calculated Correlation Coefficients, Slopes and Intercepts for the Higuchi Model for
dissolution data for different sizes of microspheres (Formulation C)
Higuchi Spherical Matrix Model
1+2 F-3 F2/3 = KT
Values 355µ 250µ 125µ
Correlation
Coefficient 0.9912 0.9954 0.998
Intercept 0.0131 0.0033 0.0266
Slope 0.0122 0.0239 0.0738
F = Fraction of Drug Remaining
K is a combined constant
T = Time
45
0 2 4 6 8 10 12 14
0.0
0.2
0.4
0.6
0.8
1.0
355 microns250 microns125 microns
time (hrs)
Cal
cula
ted
valu
es o
f (1
+2F
'-3F
'^2/
3)
Figure 15: Higuchi spherical matrix plots fo r dissolution data of different microspheres sizes
(formulation C) [1+2 F-3 F2/3 = KT]
46
0 2 4 6 8 10 12 141
2
3
4
5
6
7
8
Time (hrs)
Square of microsphere mean diameter (microns/10,000)
Figure 16: Relationship of Dissolution T50 to (Square of Microsphere Size/10,000)
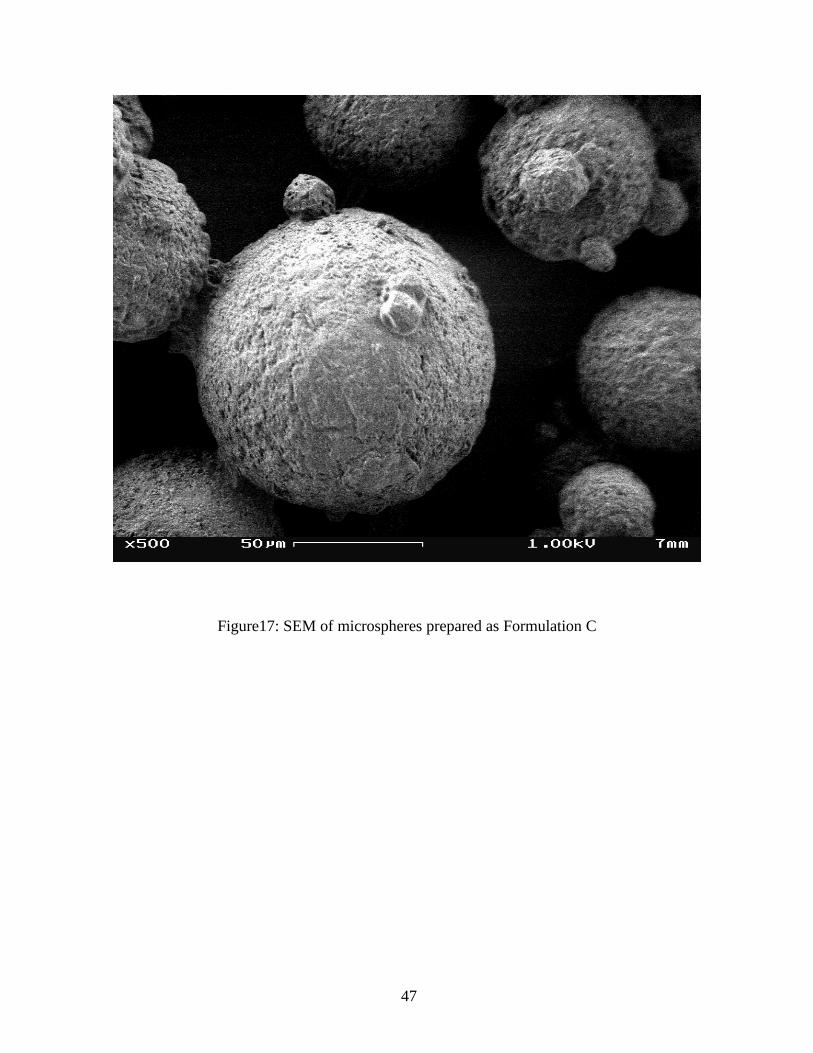
MICROSCOPIC EVALUATION OF MICROSPHERES:
Scanning electron micrographs of the Formulation C microspheres are shown. The microspheres
appear spherical with no external formation of drug crystals. (Figure 17)
47
Figure17: SEM of microspheres prepared as Formulation C
48
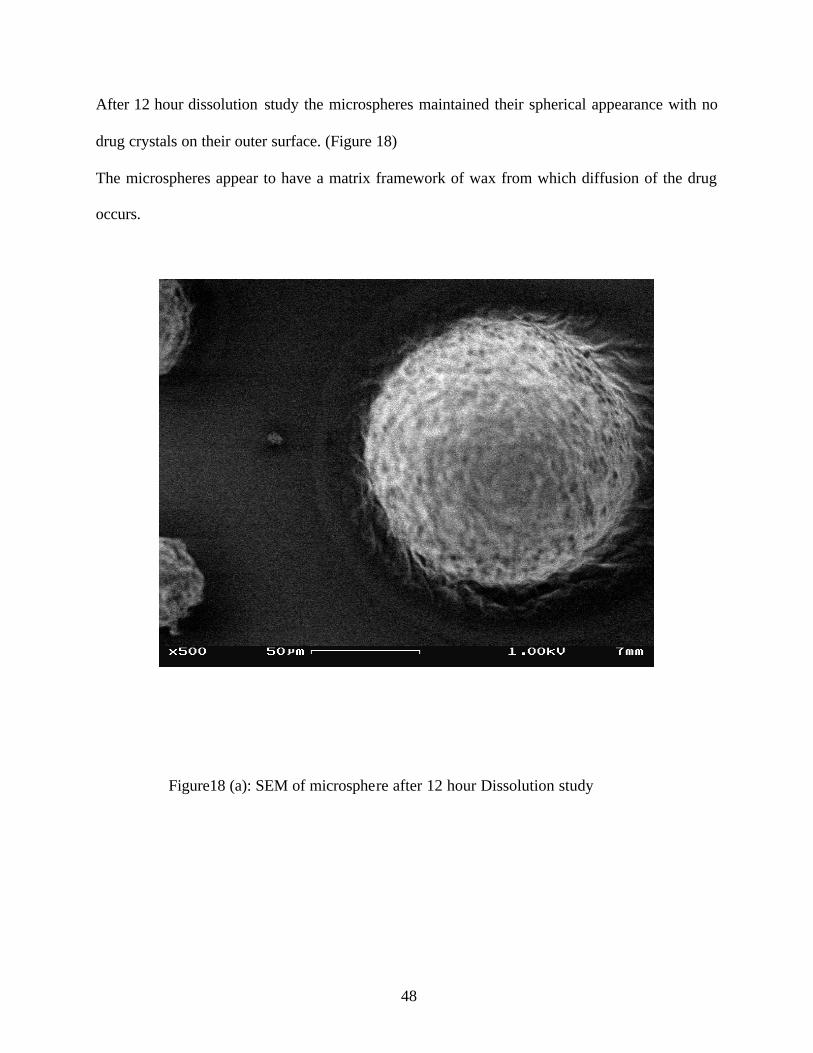
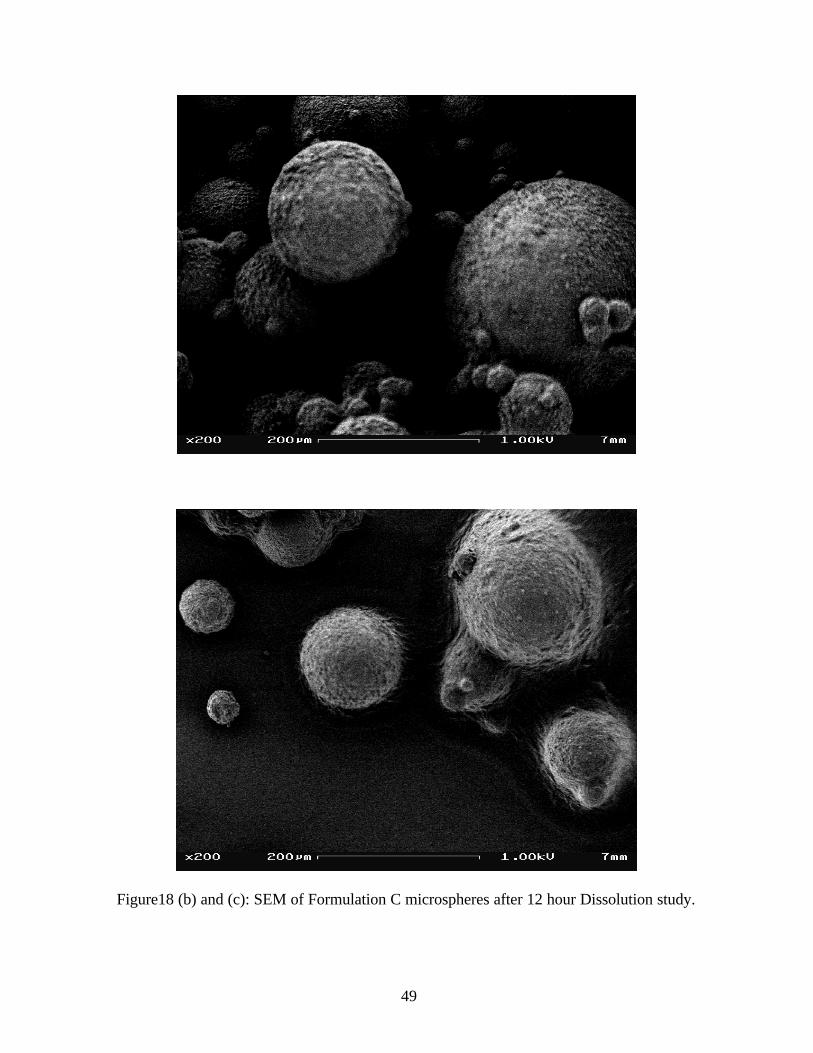
After 12 hour dissolution study the microspheres maintained their spherical appearance with no
drug crystals on their outer surface. (Figure 18)
The microspheres appear to have a matrix framework of wax from which diffusion of the drug
occurs.
Figure18 (a): SEM of microsphere after 12 hour Dissolution study
49
Figure18 (b) and (c): SEM of Formulation C microspheres after 12 hour Dissolution study.
50
PREPARATION OF TABLETED MICROSPHERES
The Formulation C microspheres were prepared with beeswax and ibuprofen in a ratio of 2:1.33
as previously described. The fraction of microspheres with a modal particle size of 250µ was
compressed with Avicel® PH 101 and Explotab®. The tablet formulation used was shown in
Table 3. Microcrystalline cellulose has been used as a diluent to assist in the compaction of the
microspheres and to prevent the rupture and damage of the microspheres. It has been reported in
literature that tablets containing Avicel® PH show fast disintegration (29), lower friability and
higher hardness compared to other excepients such as lactose and Encompress (5, 30).
Explotab® (sodium starch glycolate) is a modified starch and has been described as a
disintegrant whose disintegrating properties are independent of compression force (31). The
concentration of the diluent and the disintegrant was kept constant throughout the study.
EVALUATION OF TABLETED MICROSPHERES
Effect of Compression Pressure on Tablet Properties:
Tablet formulations containing 42% microspheres, 55% Avicel PH101®, 3% Explotab® were
compressed at pressures of 1000, 2000, and 4000 PSI (Pounds per Square Inch). The
compression pressure was maintained for 40 seconds and then rapidly released.
(a) Hardness: Tablet hardness has been defined as the force required to break the tablet in a
diametric compression test. To perform this test the tablet was placed between the two anvils of
the tester and the crushing force required to just break the tablet recorded. In the Erweka tester
the tablet is placed on its edge on the lower anvil and the anvil adjusted till the tablet just touches
51
the upper test anvil. A suspended weight, motor driven, moves along a rail that slowly transmits
pressure to the tablet. A pointer moving along a scale provides the breaking strength in
Kilograms. The hardness of a tablet is a function of the die fill and the compression pressure. At
a constant die fill, as the compression pressure increases, the hardness of the tablet usually
increases. This relationship holds up to a certain maximum value for hardness and a minimum
value for the thickness. With some formulations, further increases in the pressure cause the tablet
to laminate or cap, thus destroying the integrity of the tablet. At constant compression force, the
tablet hardness increases with increasing die fills because the testing force is applied over a
larger area of the tableted material.
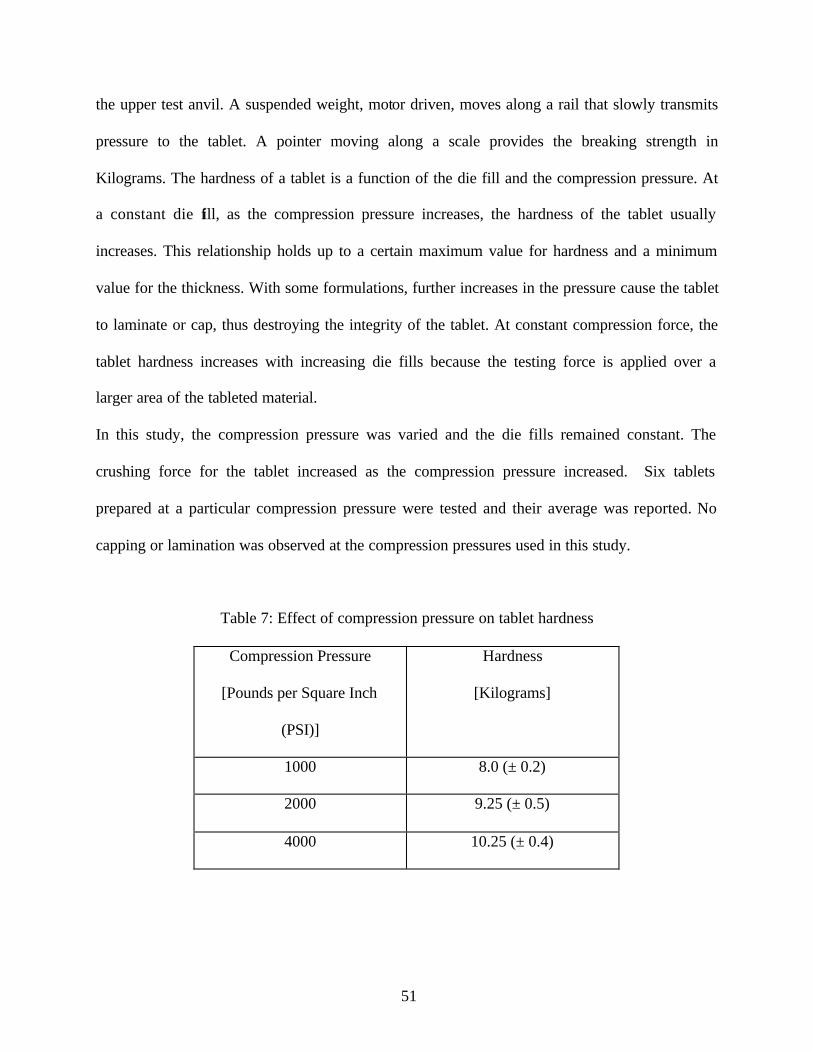
In this study, the compression pressure was varied and the die fills remained constant. The
crushing force for the tablet increased as the compression pressure increased. Six tablets
prepared at a particular compression pressure were tested and their average was reported. No
capping or lamination was observed at the compression pressures used in this study.
Table 7: Effect of compression pressure on tablet hardness
Compression Pressure
[Pounds per Square Inch
(PSI)]
Hardness
[Kilograms]
1000 8.0 (± 0.2)
2000 9.25 (± 0.5)
4000 10.25 (± 0.4)
52
Log [Applied compression pressure (PSI)]
2.9 3.0 3.1 3.2 3.3 3.4 3.5 3.6 3.7
Cru
shin
g S
tren
gth
(Kg)
7.5
8.0
8.5
9.0
9.5
10.0
10.5
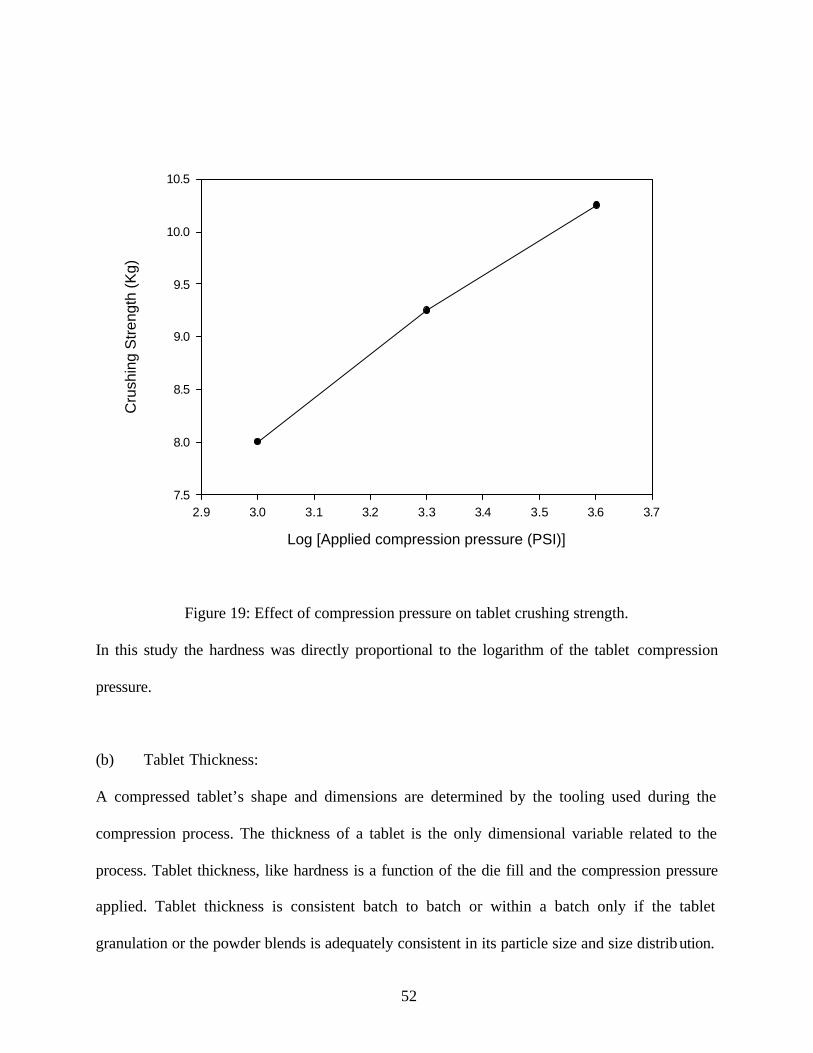
Figure 19: Effect of compression pressure on tablet crushing strength.
In this study the hardness was directly proportional to the logarithm of the tablet compression
pressure.
(b) Tablet Thickness:
A compressed tablet’s shape and dimensions are determined by the tooling used during the
compression process. The thickness of a tablet is the only dimensional variable related to the
process. Tablet thickness, like hardness is a function of the die fill and the compression pressure
applied. Tablet thickness is consistent batch to batch or within a batch only if the tablet
granulation or the powder blends is adequately consistent in its particle size and size distribution.
53
Six tablets from each batch were evaluated for their physical dimensions. The thicknesses of the
tablets were inversely proportional to the compression pressure. As the compression pressure
increased, the thickness of the tablets decreased.
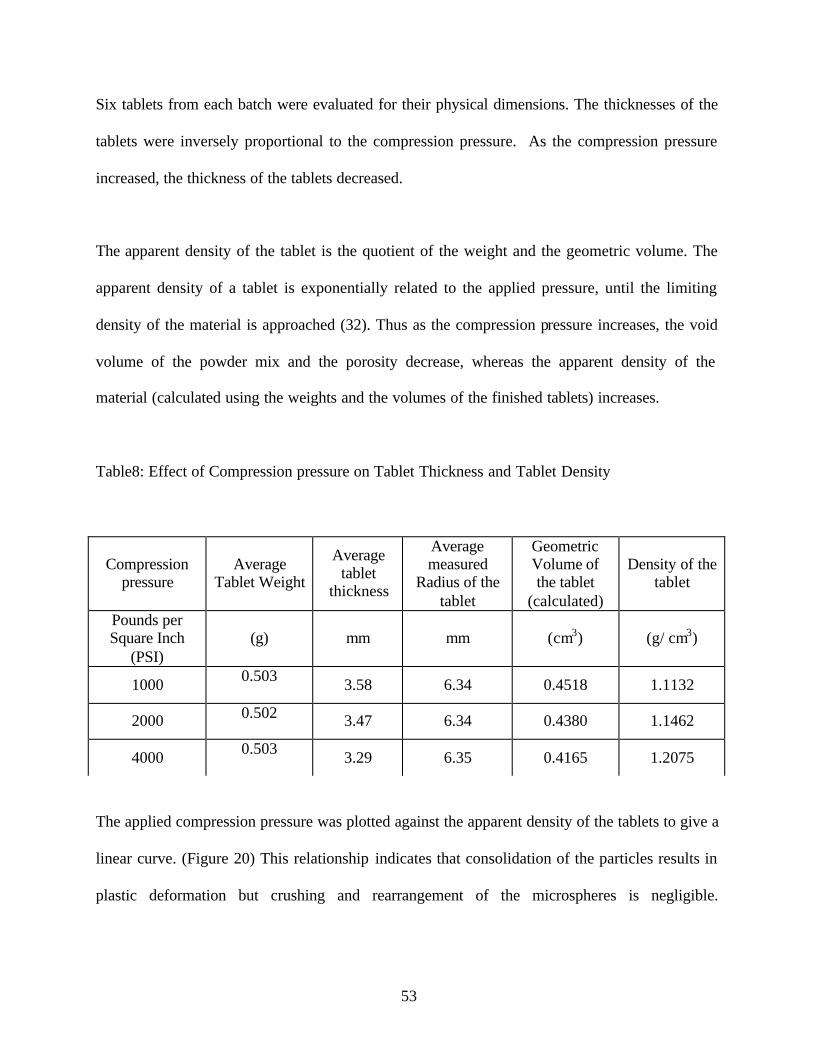
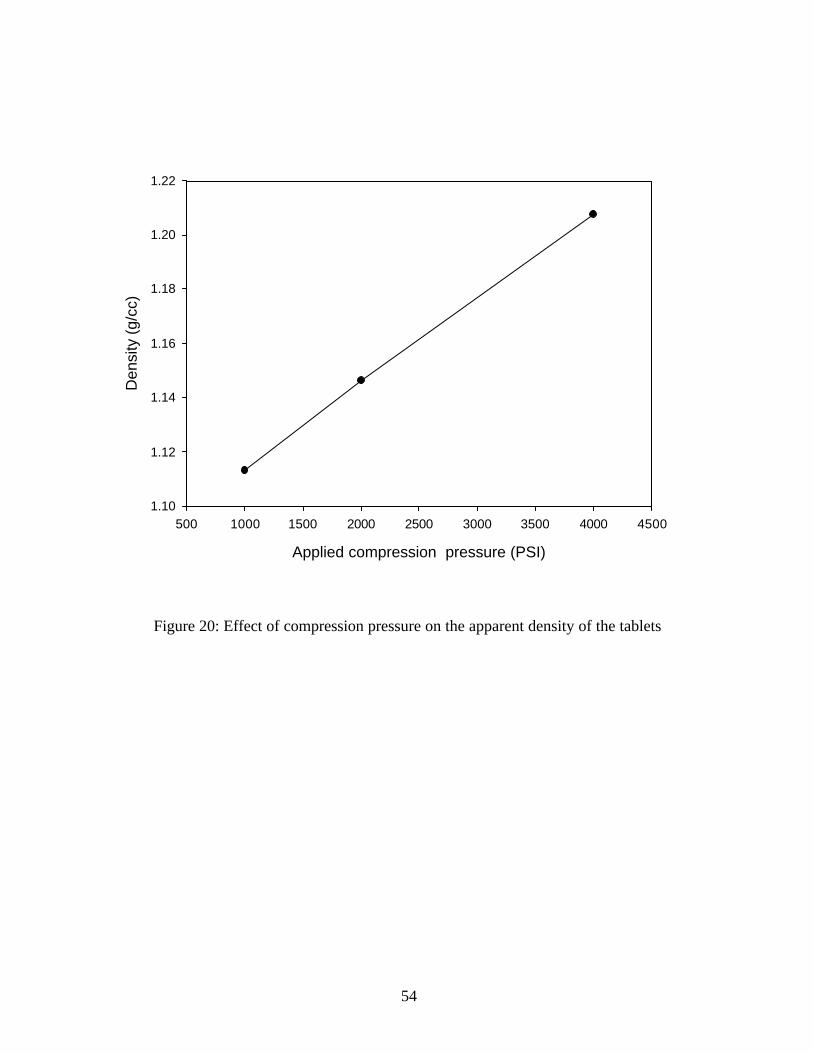
The apparent density of the tablet is the quotient of the weight and the geometric volume. The
apparent density of a tablet is exponentially related to the applied pressure, until the limiting
density of the material is approached (32). Thus as the compression pressure increases, the void
volume of the powder mix and the porosity decrease, whereas the apparent density of the
material (calculated using the weights and the volumes of the finished tablets) increases.
Table8: Effect of Compression pressure on Tablet Thickness and Tablet Density
The applied compression pressure was plotted against the apparent density of the tablets to give a
linear curve. (Figure 20) This relationship indicates that consolidation of the particles results in
plastic deformation but crushing and rearrangement of the microspheres is negligible.
Compression pressure
Average Tablet Weight
Average tablet
thickness
Average measured
Radius of the tablet
Geometric Volume of the tablet
(calculated)
Density of the tablet
Pounds per Square Inch
(PSI) (g) mm mm (cm3) (g/ cm3)
1000 0.503 3.58 6.34 0.4518 1.1132
2000 0.502 3.47 6.34 0.4380 1.1462
4000 0.503 3.29 6.35 0.4165 1.2075
54
Applied compression pressure (PSI)
500 1000 1500 2000 2500 3000 3500 4000 4500
Den
sity
(g/c
c)
1.10
1.12
1.14
1.16
1.18
1.20
1.22
Figure 20: Effect of compression pressure on the apparent density of the tablets
55
This may be attributed to the good compressional characteristics of Avicel PH 101® and also to
some extent to the pliable nature of the beeswax microspheres. Apparently on compression,
plastic deformation of the particles occurs but fracture of particles is limited.
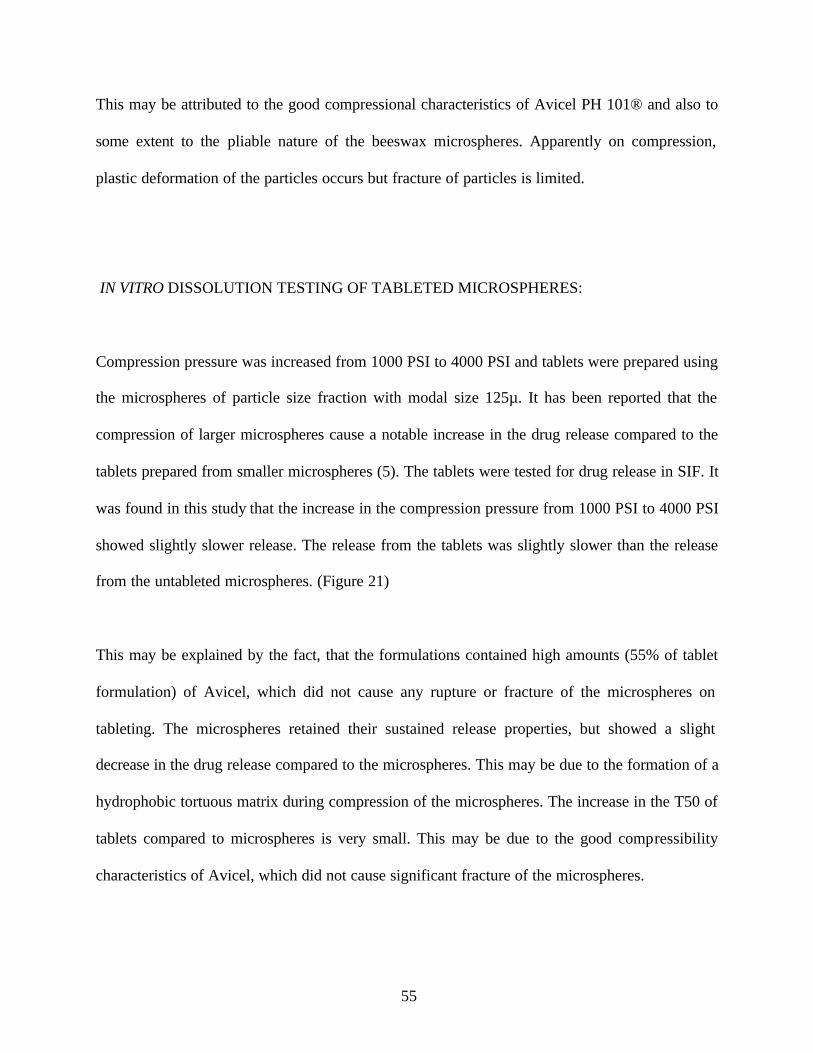
IN VITRO DISSOLUTION TESTING OF TABLETED MICROSPHERES:
Compression pressure was increased from 1000 PSI to 4000 PSI and tablets were prepared using
the microspheres of particle size fraction with modal size 125µ. It has been reported that the
compression of larger microspheres cause a notable increase in the drug release compared to the
tablets prepared from smaller microspheres (5). The tablets were tested for drug release in SIF. It
was found in this study that the increase in the compression pressure from 1000 PSI to 4000 PSI
showed slightly slower release. The release from the tablets was slightly slower than the release
from the untableted microspheres. (Figure 21)
This may be explained by the fact, that the formulations contained high amounts (55% of tablet
formulation) of Avicel, which did not cause any rupture or fracture of the microspheres on
tableting. The microspheres retained their sustained release properties, but showed a slight
decrease in the drug release compared to the microspheres. This may be due to the formation of a
hydrophobic tortuous matrix during compression of the microspheres. The increase in the T50 of
tablets compared to microspheres is very small. This may be due to the good compressibility
characteristics of Avicel, which did not cause significant fracture of the microspheres.
56
TIME (hrs)
0 2 4 6 8 10 12 14
CU
MU
LAT
IVE
PE
RC
EN
T R
ELE
AS
ED
0
20
40
60
80
100
120
1000 PSI2000 PSI4000 PSIUNTABLETED MICROSPHERES
Figure 21: Effect of compression pressure on the drug release from the tableted microspheres and
comparison of drug release from the tablets to the untableted microspheres (125µ).
Each tablet contains 42% microspheres (125µ, formulation C), 55% Avicel PH 101®, and 3%
Explotab®.
57
0 2 4 6 8 10 12 14
0.0
0.1
0.2
0.3
0.4
0.5
0.6
0.7
250 microns125 microns355 microns
Cal
cula
ted
valu
es o
f (1
+2F
'-3F
'^2/
3)
time (hrs)
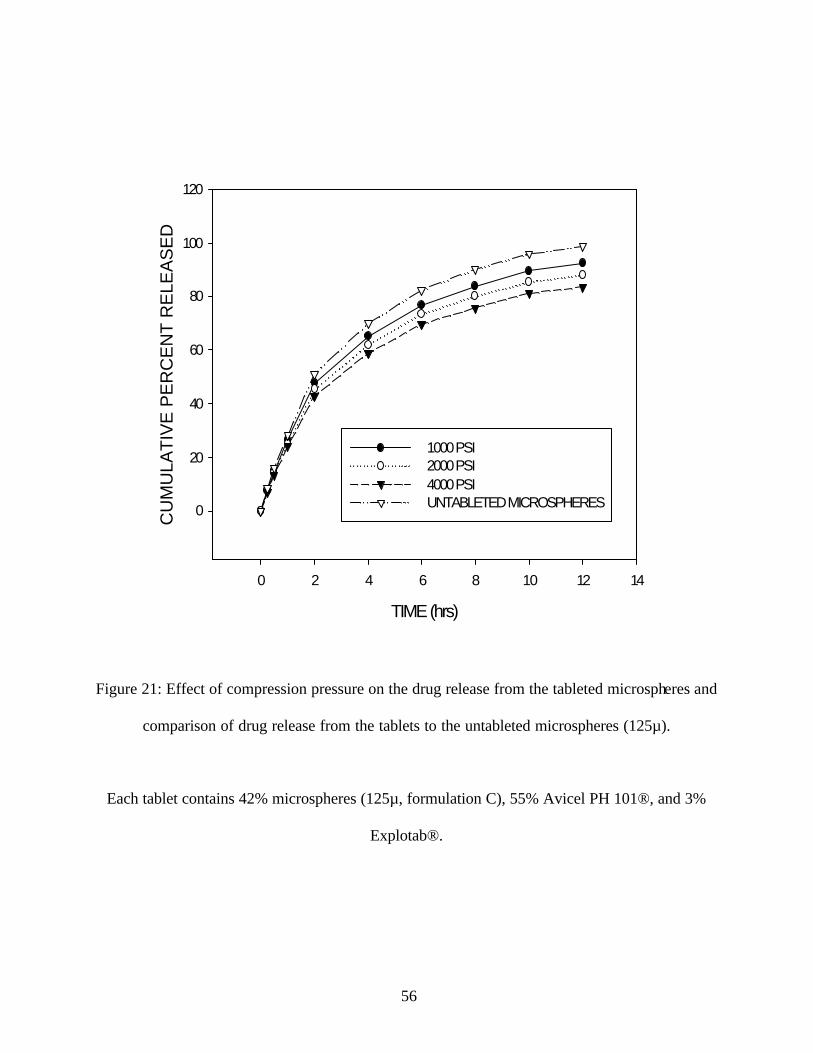
Figure 22: Higuchi spherical matrix plot for dissolution data from disintegrating tablets of
microspheres compressed at different pressures.
58
(a)
(b)
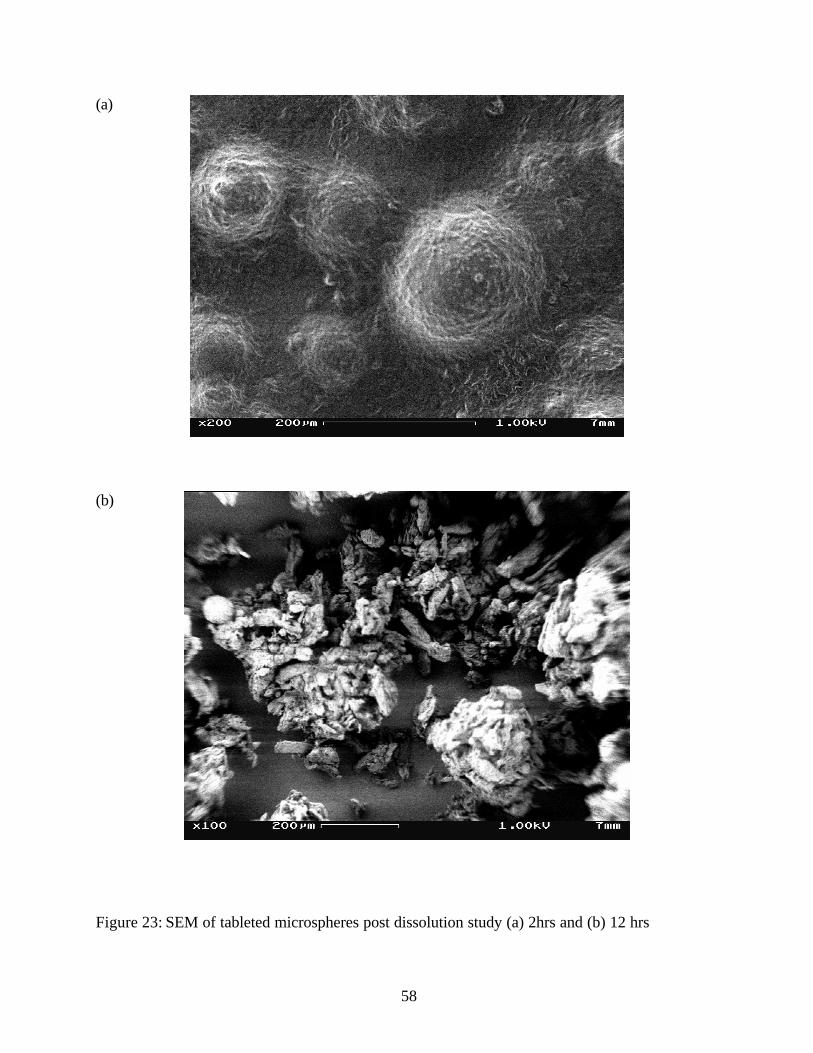
Figure 23: SEM of tableted microspheres post dissolution study (a) 2hrs and (b) 12 hrs
59
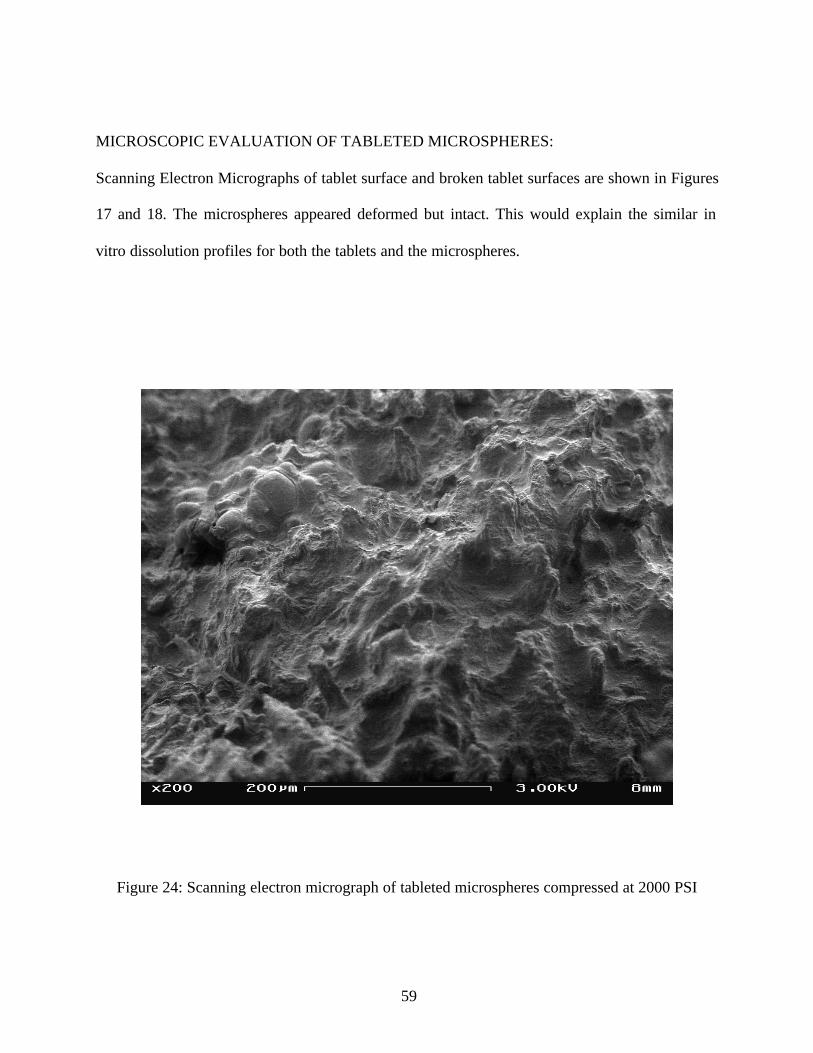
MICROSCOPIC EVALUATION OF TABLETED MICROSPHERES:
Scanning Electron Micrographs of tablet surface and broken tablet surfaces are shown in Figures
17 and 18. The microspheres appeared deformed but intact. This would explain the similar in
vitro dissolution profiles for both the tablets and the microspheres.
Figure 24: Scanning electron micrograph of tableted microspheres compressed at 2000 PSI
60
CONCLUSION:
Controlled release microspheres containing ibuprofen were prepared for ibuprofen using the
hydrophobic congealable disperse phase microencapsulation method. Microspheres prepared
with beeswax showed better encapsulation efficiency than with microcrsytalline wax.
Microspheres prepared without stearyl alcohol to modify release did not show acceptable
controlled release characteristics. The drug release from the microspheres was by diffusion of the
drug and the drug release profile was described by Higuchi spherical matrix model over a
substantial portion of the release. As particle size of the microspheres decreased, greater surface
area became available for diffusion and diffusion path was shorter, hence they showed faster
drug release. The optimized microsphere formulation was tableted at different compression
pressures. The smaller microspheres are least likely to rupture and cause changes in drug release
characteristics after compression. In this study it was found that as the compression pressure
increased, the drug release rate from the microspheres decreased. At greater compression
pressures, a small portion of the microspheres may be compressed together and did not
disintegrate as the tablet disintegrates. This would reduce the surface area of the microspheres
exposed to the dissolution medium. It was found that the compression at different pressures did
not affect the drug release to a great extent. This may be due to the cushioning effect of the
directly compressible diluent Avicel®. Due to the rapid disintegration of the microsphere tablet
into smaller particles, it behaves as a multiple unit dosage form. This dosage form has a clinical
advantage over the matrix controlled release or the conventional single dose tablets. The
disintegrating multiple unit tablet prepared in this study provides a controlled release of the drug
and could potentially have a more predictable gastric emptying and decrease the GI irritation
caused by the non-steroidal anti- inflammatory drug, ibuprofen.
61
REFERENCES
1. Lee, V. H. and Robinson, J.R., Methods to achieve sustained drug delivery, Sustained
and Controlled Release Drug Delivery Systems, Robinson, J. R. (ed.), Marcel Dekker,
New York, NY, 1978.
2. Ballard, B. E. and Nelson, E. Prolonged Action Pharmaceuticals, in Remington
Pharmaceutical Sciences by Hoover J. E. (ed), 15th edition, Mack, Easton, PA, 1681,
1975.
3. Brahmankar, D.M and Jaiswal, S.B., Controlled Release Medication, Biopharmaceutics
and Pharmacokinetics: A Treatise, Vallabh Prakashan 1999.
4. Lordi, N. G., Sustained Release Dosage Forms, in The Theory and Practice of Industrial
Pharmacy by Lachman, L., Lieberman H. A., Kanig, J.L. (ed.), third edition, Lea and
Feibger, USA, 1990.
5. Chiao, C. S. L. and Price J.C., Effect of compression pressure on the physical properties
and dissolution characteristics of disintegrating tablets of propranolol microspheres.
Journal of Microencapsulation, Vol. 11, No. 2, 161-170. 1994
6. Bakan J. A., Microencapsulation, in The Theory and Practice of Industrial Pharmacy by
Lachman, L., Lieberman H. A., Kanig, J.L. (ed.), third edition, Lea and Feibger, USA,
1990.
7. Follonier, N. and Doelker, E., Biopharmaceutical comparison of oral multiple-unit and
single unit sustained release dosage forms, S.T.P. Pharma Sci., 2(2), 141-158 1992.
62
8. Miller, R. E., Franger, G. O., and Mc Niff, R. G., Union of So. Africa Patent 4211-66,
1964.
9. Perumal, D., Dangor, C. M., Alcock, R. S., Hurbans, N. and Moopanar, K.R., Effect of
formulation variables on in vitro drug release and micromeretic properties of modified
release ibuprofen Microspheres. Journal of Microencapsulation. 16 (4), 475-487, 1999.
10. Deasy, P. B., Microencapsulation and Related Drug Processes, Marcel Dekker Inc., NY,
119, 1984.
11. Adeyeye, C. and Price, J.C., Development and Evaluation of Sustained Release Ibuprofen
Wax Microspheres. Ι. Effect of formulation Variables on Physical Characteristics,
Pharmaceutical Research, Vol. 8, No. 11, 1991.
12. Draper, E.B. and Becker, C.H., Journal of Pharmaceutical Sciences, 55, 376-380,1996
13. Bodemeier, R., Wang, J., and Bhagwatwar H., Process and Formulation variables in the
preparation of wax microparticles by a melt dispersion technique. Ι. Oil- in-water
technique for water- insoluble drugs, Journal of Microencapsulation, Vol. 9, No. 1, 89-98,
1992
14. Kibbe, A. H., Wax, Microcrystalline, Handbook of Pharmaceutical Additives, Edited by
Michael and Irene Ash, Second Edition, 683-684
15. Kibbe, A. H., Wax, White, Handbook of Pharmaceutical Additives, Edited by Michael
and Irene Ash, Second Edition, 687-688.
16. Varshosaz, J. and Keihanfar, M., Development and evaluation of sustained release
propranolol wax microspheres, Journal of Microencapsulation, Vol. 18, No. 3, 227-284.
2001
63
17. Price, J. C. Diffusion controlled systems: Polymeric microcapsules, Polymers for
Controlled drug delivery, 1991, Tarcha, P.J (ed), CRC Press, Boca Raton, Fl, 1-14
18. Higuchi, T., Mechanism of sustained-action medication: Theoretical Analysis of Rate of
Release of Solid Drugs Dispersed in Solid Matrices, Journal of Pharmaceutical Sciences,
52, 1145. 1965.
19. K. D. Rainsford, ed. Ibuprofen, Taylor and Francis Publishers, London, UK, 1999
20. John Higgins et al., Ibuprofen, Analytical Profiles of Drug Substances and Excepients,
Volume 27.
21. Lee, V. H. and Robinson, J.R., Methods to achieve sustained drug delivery, Sustained
and Controlled Release Drug Delivery Systems, Robinson, J. R. (ed.), Marcel Dekker,
New York, NY, 1978.
22. Beechgaard, F., and Neilsen, G.H., Controlled release multiple-unit and single unit doses.
A literature review. Drug Development and Industrial Pharmacy. 4, 53-67, 1978.
23. Soppimath, K.S., Kulkarni, A.R., and Aminabhavi, T.M, Encapsulation of
antihypertensive drugs in cellulose-based matrix microsphere: characterization and
release kinetics of microspheres and tableted microspheres. Journal of
Microencapsulation , 18 (3), 397-409, 2001.
24. Nixon, J.R and Hassan, M., Effect of tableting on the dissolution behavior of
thiabendazole microcapsules. Journal of pharmacy and pharmacology, 32, 857-859, 1980.
25. Sayed, H. A., Price J.C., Tablet properties and dissolution characteristics of compressed
cellulose acetate butyrate microcapsules containing succinyl sulfathiazole. Drug
Development and Industrial Pharmacy, 12, 577-587, 1986.
64
26. Giannola, L.I., De Caro, V., and Rizzo, M. C., Preparation of White Beeswax
Microspheres Loaded with Valproic Acid and Kinetic Study of Drug Release. Drug
Development and Industrial Pharmacy, 21(7), 793-807, 1995.
27. John, P. M. and Becker, C. H., Surfactant effects on Spray Congealed Formulations of
Sulfaethylthiadiazole-Wax, Journal of Pharmaceutical Sciences. 57, 584, 1968.
28. Gursoy, A, Turkoglu M., Senyucel, B., Kalkan, F., and Okar, I, Evaluation of tableted
microspheres of Dipyridamole, Drug Development and Industrial Pharmacy, 21 (4), 503-
507, 1995.
29. Kader, A., and Jalil R., Formulation Factors Affecting Drug Release from Poly (Lactic
Acid) (PLA) Microcapsule Tablets, Drug Development and Industrial Pharmacy, 25 (2),
141-151, 1999.
30. Peck, G. E., Bailey, G. J., McCurdy, V. E., and Banker, G. S., Tablet Formulation and
Design. In Pharmaceutical Dosage Forms: Tablets Vol. 1, H. A Lieberman, L. Lachman
and J. L. Kanig (ed.) (New York: Marcel Dekker), p 109.
31. Parrot, E. L., Compression, Pharmaceutical Dosage Forms: Tablets Volume2, Second
edition, H. A Lieberman, L. Lachman and J. L. Kanig (ed.) (New York: Marcel Dekker),
p 212.