Embed Size (px)
Citation preview

Int. J. Electrochem. Sci., 6 (2011) 3301 - 3315
International Journal of
ELECTROCHEMICAL SCIENCE
www.electrochemsci.org
Preparation of a Highly Porous Binderless Activated Carbon
Monolith from Rubber Wood Sawdust by a Multi-Step
Activation Process for Application in Supercapacitors
E. Taer1,2
, M. Deraman1,*
, I. A. Talib1, A. Awitdrus
1,2, S.A. Hashmi
3, A. A. Umar
4
1 School of Applied Physics, Faculty of Science and Technology,
Universiti Kebangsaan Malaysia, 43600 Bangi, Selangor, Malaysia 2
Department of Physics, University of Riau, 28293 Simpang Baru, Riau, Indonesia 3
Departement of Physics and Astrophysics, University of Delhi, Delhi-110007, India 4
Institute of Microengineering and Nanoelectronics, Universiti Kebangsaan Malaysia, 43600 Bangi,
Selangor, Malaysia *E-mail: [email protected]
Received: 15 June 2011 / Accepted: 12 July 2011 / Published: 1 August 2011
Binderless activated carbon monoliths (ACMs) with high porosity that were prepared from self-
adhesive pre-carbonized rubber wood sawdust were studied as electrodes for supercapacitors, focusing
on the influence of activation time on the physical and electrochemical properties of the ACMs. The
ACMs were activated under a flow of CO2 gas at a rate of 0.5 liters per minute and at a temperature of
900 oC. Activation time varied from 1 to 6 hours and with a multi-step heating profile. The ACM was
characterized physically (density, porosity, structure and surface morphology) and electrochemically
(specific capacitance, equivalent series resistance, energy and power density). This study found that
the combined effects from the length of activation time, binderless property and multi-step heating had
the greatest influence on the physical and electrochemical properties of the ACM. The optimum ACM
was activated for 5 hours and had a specific capacitance, equivalent series resistance, energy and
power density of 138 F g-1
, 0.49 Ohm, 2.63 Wh kg-1
and 291 W kg-1
, respectively.
Keywords: Activated carbon monolith; Supercapacitor; Mesoporous carbon
1. INTRODUCTION
Fossil- and organic-based carbonaceous materials are amongst the most widely used starting or
precursor materials for supercapacitor electrodes because they are relatively inexpensive and easy to
fabricate. These electrode materials also have large specific surface areas, good electrical conductivity
and excellent chemical stability [1, 2]. The carbonaceous materials extracted from biomass such as
cassava peel waste [3], coffee bean waste [4], coffee shells [5], cherry stone [6], bamboo [7], fir woods

Int. J. Electrochem. Sci., Vol. 6, 2011
3302
[8], banana fibers [9] and sugar cane bagasse [10] have been used as supercapacitor carbon electrodes;
however, carbons from these precursors in general have been prepared in powder form. Therefore, to
use them as electrodes in supercapacitors, they have to be formed into pellets or monolith structures.
This process typically requires the addition of a binder to shape the carbon particles into the desired
form. Several reports studying carbon electrodes without binders have been recently published [11-13].
These authors asserted that binderless electrodes have several advantages: (i) the binders occupy some
of the pores and reduce electrolyte accessibility [14]; (ii) binders are non-conducting and therefore
reduce the electrical conductivity of the electrodes [15]; and (iii) the use of binders adds both
additional steps to the processing of the electrodes and an extra cost. In light of these points, the
present study has chosen a pre-carbonized rubber wood sawdust (RWSD) as a precursor to produce
porous carbon electrodes for application in a supercapacitor cell. The pre-carbonized RWSD is self-
adhesive and can be shaped into green bodies in a monolithic form without adding any binder. The
carbon monolith was activated by CO2, and the porosity was optimized by varying the length of the
activation time. To avoid forming cracks on the activated carbon monolith (ACM), a multi-step
method of activation was introduced in which the total activation time was divided into several
segments.
In most cases, the physicochemical properties of the carbon electrode (i.e., structure, porosity)
were improved to meet the required specifications of each intended application through an activation
process. In general, there are two types of activation methods: chemical and physical. Chemical
activation consists of a single-step carbonization and activation by chemical agents (i.e., KOH, ZnCl2
or H3PO4) at 400 to 800 oC [16]. For physical activation, carbonization of the carbon precursor is first
carried out at ambient conditions and followed by activation at a higher temperature (i.e., 800-1000 oC)
by activation agents (i.e., CO2, air, steam or a mixture of these gases) [16]. In the present study, CO2
activation was performed at 900 oC, as previously reported [17], with the activation time varying from
1 to 6 hours.
The ACM was characterized by X-ray diffraction (XRD), N2-adsorption-desorption and field
emission scanning electron microscopy (FESEM) to observe the effect of varying activation time on
the physical properties of the ACM. These properties were used to interpret the electrochemical data of
the supercapacitor cells fabricated using the ACMs as electrodes. Galvanostatic charge-discharge,
cyclic voltammetry and electrochemical impedance spectroscopy (EIS) were used to evaluate
electrochemical performance.
2. EXPERIMENTAL
2.1 Electrode preparation and cell fabrication
ACMs were prepared from the RWSD using our previously reported method [18]. Briefly, the
RWSD was pre-carbonized at a low temperature (~280 oC), followed by a ball mill process for
approximately 36 hours. Finally, the material was sieved to obtain a powder of self-adhesive carbon
grain (SACG) with a particle size of less than 53 microns. Green monoliths (GM) of the SACG were
Int. J. Electrochem. Sci., Vol. 6, 2011
3303
prepared in a mold (20 mm diameter) using 8 metric tons of compression force, then carbonized at
~600 oC under a N2 atmosphere to produce the carbon monolith. The carbon monolith was activated by
CO2 at ~900 C with heating rate of 10 C per minute. Several lengths of activation times were
evaluated: 1, 2, 3, 4, 5 and 6 hours. The ACMs were identified as ACM1 to ACM6 in reference to
activation times of 1 to 6 hours, respectively. The ACMs were then polished to the desired thicknesses
and extensively washed with distilled water.
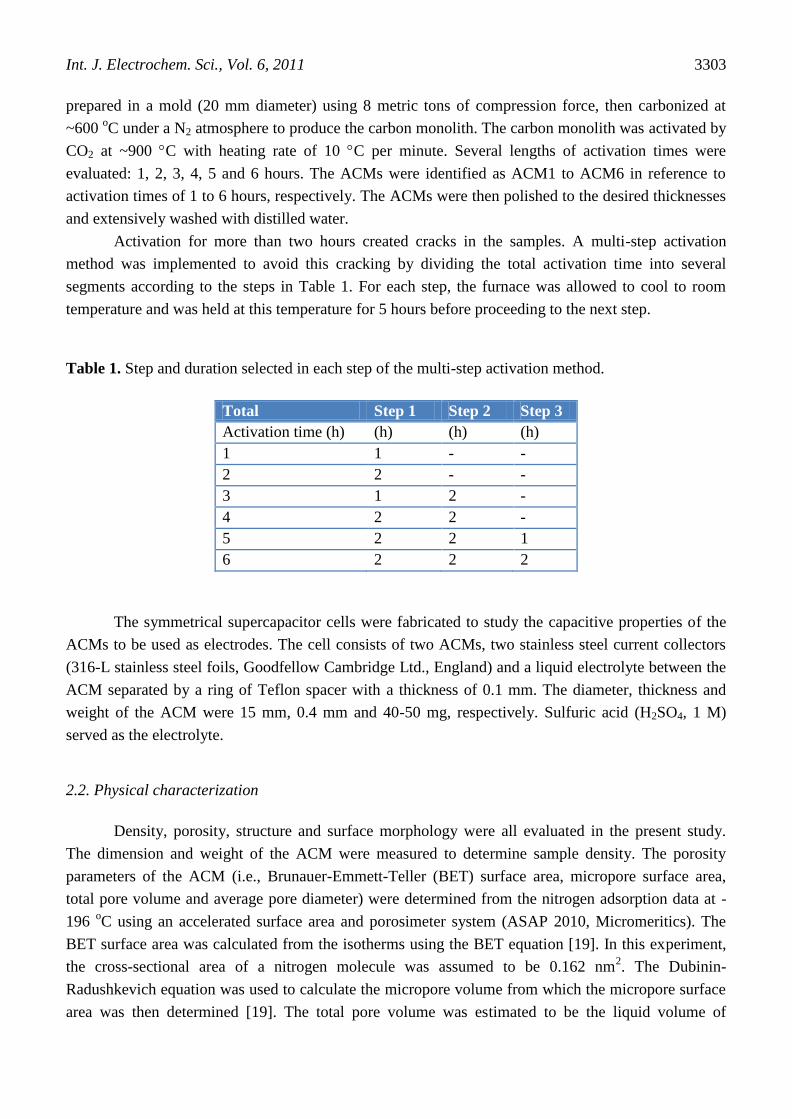
Activation for more than two hours created cracks in the samples. A multi-step activation
method was implemented to avoid this cracking by dividing the total activation time into several
segments according to the steps in Table 1. For each step, the furnace was allowed to cool to room
temperature and was held at this temperature for 5 hours before proceeding to the next step.
Table 1. Step and duration selected in each step of the multi-step activation method.
Total Step 1 Step 2 Step 3
Activation time (h) (h) (h) (h)
1 1 - -
2 2 - -
3 1 2 -
4 2 2 -
5 2 2 1
6 2 2 2
The symmetrical supercapacitor cells were fabricated to study the capacitive properties of the
ACMs to be used as electrodes. The cell consists of two ACMs, two stainless steel current collectors
(316-L stainless steel foils, Goodfellow Cambridge Ltd., England) and a liquid electrolyte between the
ACM separated by a ring of Teflon spacer with a thickness of 0.1 mm. The diameter, thickness and
weight of the ACM were 15 mm, 0.4 mm and 40-50 mg, respectively. Sulfuric acid (H2SO4, 1 M)
served as the electrolyte.
2.2. Physical characterization
Density, porosity, structure and surface morphology were all evaluated in the present study.
The dimension and weight of the ACM were measured to determine sample density. The porosity
parameters of the ACM (i.e., Brunauer-Emmett-Teller (BET) surface area, micropore surface area,
total pore volume and average pore diameter) were determined from the nitrogen adsorption data at -
196 oC using an accelerated surface area and porosimeter system (ASAP 2010, Micromeritics). The
BET surface area was calculated from the isotherms using the BET equation [19]. In this experiment,
the cross-sectional area of a nitrogen molecule was assumed to be 0.162 nm2. The Dubinin-
Radushkevich equation was used to calculate the micropore volume from which the micropore surface
area was then determined [19]. The total pore volume was estimated to be the liquid volume of

Int. J. Electrochem. Sci., Vol. 6, 2011
3304
adsorbate (N2) at a relative pressure of 0.995. The structure of the ACM was elucidated by XRD. XRD
patterns were obtained on a Bruker AXS D8 advance diffractometer that employed CuKα radiation
with a 2Ө range of 0 to 60°. The graphitic microcrystallite dimension (stack height = Lc, stack width =
La) can be calculated from the XRD diffraction pattern using the Debye-Scherrer equation: Lc =
0.90λ/βcos(Ө002) and La = 1.94λ/βcos(Ө100), where β is equal to peak width at half height [20]. The
morphological structures of the ACM were elucidated on a FESEM (Supra PV 55 model).
2.3 Electrochemical characterization
The performance of the supercapacitor cells was studied by a galvanostatic charge-discharge,
EIS and cyclic voltammetry using a Solatron 1286 electrochemical interface. The specific capacitance
was determined using the formula Csp = 2C/m, where C is the cell capacitance and m is the weight of
one of the electrodes [21]. The capacitance value of the cell for each measurement method was
determined using the following formulas: C = (I x Δt)/ΔV for galvanostatic charge-discharge, C = I/s
for cyclic voltammetry and C= (2πf Z”)-1
for EIS techniques [22]. I, Δt, ΔV, s, f and Z” represent the
constant current, discharge time, voltage, scan rate, frequency and imaginary impedance, respectively.
All the measurements were carried out at room temperature (25 oC).
3. RESULTS AND DISCUSSION
3.1 Physical properties
We successfully prepared several ACMs with highly porous characteristics by a multi-step
activation process.
Tabel 2. Weight (W), thickness (t), diameter (D) and density (ρ) of the ACMs with different
activation times.
Sample W t D ρ
(g) (mm) (mm) (g cm-3
)
ACM1 0.253 1.642 15.861 0.780
ACM2 0.203 1.657 15.725 0.699
ACM3 0.213 1.646 15.674 0.672
ACM4 0.192 1.599 15.503 0.637
ACM5 0.179 1.629 15.519 0.587
ACM6 0.192 1.599 15.503 0.636
The weight, thickness, diameter and density of the ACMs prepared with different activation
times are shown in Table 2. As seen in the table, the weight, diameter and density of the ACMs
decrease with increasing activation time. The decrease in the density occurred because the weight loss

Int. J. Electrochem. Sci., Vol. 6, 2011
3305
was greater than dimensional shrinkage of the samples with increasing activation time. In other words,
sample thickness did not decrease at the same rate as weight loss during activation, which may be due
to the stacking arrangement of the samples in a vertically positioned tube and their exposure to the
flow of CO2 gas, which comes from the upper side of the tube. Thus, the rounded side surface of the
ACMs was more likely to react with the CO2 gas, which can cause a greater reduction in diameter.
To test the effect of activation time on ACM porosity, the N2 adsorption-desorption isotherm of
ACM2 and ACM4 was observed and is shown in Figure 1. Based on IUPAC data classification, the
isotherm profiles for samples ACM2 and ACM4 exhibited a type-IV pattern [23], which represents a
combination of microporous and mesoporous characteristics. For ACM2, the volume of adsorbed
nitrogen was relatively low. The transition from the critical adsorption at a relatively low pressure to
the saturated stages shows a sharp knee, indicating that AMC2 had a narrow pore size distribution. In
contrast, ACM4, which was activated at a longer activation time, shows a different adsorption profile.
At the lower pressure, the profile had a more rounded knee, while at a higher pressure, there was a
gradual increase in adsorption with increasing pressure. These results suggest that samples with longer
activation times feature a much wider and more heterogeneous microporosity [24].
Figure 1. Nitrogen adsorption-desorption isotherms of ACM2 and ACM4 activated for 2 and 4 hours,
respectively.
The influence of the multi-step activation process on the improvement of porosity
characteristics is also seen in the BET specific surface area (SBET) of the samples listed in Table 3. It
can be clearly observed that an increase in activation time from 2 to 4 hours caused nearly a 100%
increase in sample surface area due to the development of pores in the samples during activation. With
these longer activation times, however, these pores are likely to be deformed [25] from the
enlargement of the micropores and the deterioration of the wall between adjacent pores. Hence, this
deformation of pores increases the average pore diameter of the carbon. Porosity deformation could

Int. J. Electrochem. Sci., Vol. 6, 2011
3306
also be a result of an external ablation of the carbon particles, which, in turn, widens the micropores.
Based on these results, it can be concluded that activation time plays a significant role in the
development of porous structures in the carbon monolith. In addition, ACM6 had a lower specific
capacitance compared to ACM4 and ACM5, which is likely due to the deformation of the micropores
in ACM6.
Tabel 3. BET surface area (SBET), micropore surface area (Smic), external surface area (Sex), micropore
volume (Vmic), total pore volume (Vt) and average pore diameter (a) of ACMs with 2 and 4
hours of activation time.
Sample SBET Smic Sex Vmic Vt a
(m2 g
-1) (m
2 g
-1) (m
2 g
-1) (cm
3g
-1) (cm
3g
-1) (nm)
ACM2 534 414 120 0.21 0.32 2.36
ACM4 913 630 283 0.33 0.61 2.68
Figure 2 shows the FESEM micrographs for the samples with two different lengths of
activation time, ACM2 and ACM4. These micrographs clearly show that ACM4 is more porous than
ACM2, which has evenly distributed pores with high density. This difference further supports the
hypothesis that activation time is instrumental in the formation of the pore network or porous matrix in
the ACM derived from RWSD.
Figure 2. FESEM micrographs of ACM2 and ACM4 activated for 2 (a) and 4 (b) hours, respectively.
Figure 3 shows the XRD patterns of the ACM2 and ACM4 electrodes. Broad peaks
corresponding to (002) and (100) planes of the carbon structure appear in both XRD patterns between
15 and 35o. The sharp peaks that appear on the broad peaks are due to the presence of SiO2 in the
electrode, which is commonly found in the biomass raw material. The increase in activation time from
2 to 4 hours resulted in the peaks corresponding to 2Ө at 23.981 and 44.597o for ACM2 shifting to

Int. J. Electrochem. Sci., Vol. 6, 2011
3307
24.423 and 45.520o for ACM4, respectively. This shift is due to the decrease in the interlayer spacing,
d002, from 0.371 to 0.364 nm and in d100 from 0.203 to 0.199 nm. The former spacing is in agreement
with a previously reported trend [26]. Furthermore, the values of Lc and La calculated from these peaks
also changed with the increase in activation time. The values of Lc and La were 1.147 and 2.286 nm for
ACM2 and 0.856 and 2.168 nm for ACM4, respectively, indicating a decrease in the dimension of the
graphitic crystallites. This trend is also consistent with that previously reported in the literature [26].
Figure 3. XRD patterns of ACM2 and ACM4 activated for 2 (a) and 4 (b) hours, respectively.
3.2 Electrochemical properties
3.2.1 Electrochemical impedance spectroscopy
EIS is a well-known technique used to study the frequency-dependent behavior of the
supercapacitive properties of carbon electrodes. We used the schematic impedance pattern (Nyquist
plot) to analyze our data, shown in Figure 4a [27]. In this figure, Rs represents the resistance of the
electrolyte and interfacial resistance between the current collector and electrodes. Rp is the intrinsic
resistance of the electrodes, and Rf is the equivalent series resistance of the distributed pore resistance
in the electrodes.
Figure 4b presents the EIS spectra in the form of Nyquist plots for all of the supercapacitor
cells comprising the ACM1 to ACM6 electrodes. Measurements of these spectra were taken at
frequencies ranging from 50 kHz to 10 mHz at open circuit potential with an AC perturbation of 10
mV. The values of Rs of the cells with ACM1 to ACM6, estimated from Figure 4b, are listed in Table
4. The values of Rs were almost the same for all of the samples, approximately 0.5 Ohm. This result
was expected because all of the cells employed the same electrolyte (H2SO4) and they were subjected
to the same fabrication method.

Int. J. Electrochem. Sci., Vol. 6, 2011
3308
From the magnified EIS spectra of the cells (Figure 4b-inset), it can be seen that all show a
semicircular pattern in the higher frequency region. The diameters of these semicircles, listed in Table
3, increase with the activation time and indicate the increase in internal resistance of the porous
electrode. This change is related to the decrease in density of the porous electrodes during the
activation process, which lowers the conductivity of the electrode material. With an increased
activation time, the porous matrix would be better developed [28] in the electrode material, which in
turn increases its supercapacitive behavior.
Tabel 4. Electrolyte and contact resistance (Rs), intrinsic resistance (Rp) and equivalent series
resistance (Rf) of the ACMs with different activation times.
Symmetrical Rs Rp Rf
capacitor cells with : (Ohm) (Ohm) (Ohm)
ACM1 0.55 0.75 0.19
ACM2 0.53 0.67 0.13
ACM3 0.54 0.66 0.11
ACM4 0.49 0.80 0.30
ACM5 0.48 0.98 0.49
ACM6 0.52 1.38 0.85
The plots in Figure 4b also show the presence of the Warburg line in the middle frequency
range with a slope of approximately 45o. This is an evidence of good diffusion of ions into the bulk of
the electrodes porous matrix [27]. At the lower frequency range (i.e., the end of the Warburg line), a
line appears (imaginary impedance) with a slope approaching vertical, which represents a capacitive
behavior in the electrode materials. This behavior differs for different electrodes with different
activation times. The ACM4 and ACM5 cells seem to offer better capacitive behavior compared to the
other cells because their imaginary lines lean more toward the imaginary axis.
We can write the following equations for the capacitance, C(ω), and its real (C’) and imaginary
(C”) parts [29]:
C(ω) = C’(ω) – jC” (ω) (1)
C’(ω) and C”( ω) are related to the impedance data (Z(ω)) by the following:
C’(ω) = - Z’(ω)/ ω |Z(ω)|2 (2)
C” = Z’’ (ω)/ ω |Z(ω)|
2 (3)
where

Int. J. Electrochem. Sci., Vol. 6, 2011
3309
Z(ω) = 1/jC(ω) (4)
Figure 4c presents the variation in the real part of the capacitance (C’) with frequency for the
ACM1 to ACM6 cells calculated using equation (2).
Figure 4. (a) Schematic Nyquist plot, (b) Nyquist plots from 50 kHz to 10 mHz for ACM electrodes
of different activation times (inset Nyquis plots from 50 to 1 kHz). Evolution of the real part (c)
and the imaginary part (d) of the capacitance versus frequency curve with activation time. (e)
The time constant versus activation time.

Int. J. Electrochem. Sci., Vol. 6, 2011
3310
The C’ values for ACM1 and ACM2 are significantly lower in the low frequency region and
exhibit a weak frequency dependence compared to the ACM3 to ACM6 cells. In the higher frequency
region, the C’ values show less frequency dependence and gradually overlap, exhibiting a pure
resistive behavior for all the capacitor cells. This result clearly indicates that the optimum activation
time lies between 3 and 6 hours. Within this duration, the porous structure of the electrode displays
good supercapacitor behavior.
The imaginary part of the capacitance (C”) calculated using equation (3) for all of the cells are
plotted in Figure 4d as a function of frequency. As in the case of C’ (Figure 4c), the values of C” are
small and exhibit a weak frequency dependence in the low frequency region for ACM1 and ACM2,
whereas the C” values are higher for ACM3 to ACM6 and exhibit a strong frequency dependence with
sharp peaks appearing at f = fp. These peaks clearly show that the fp for ACM6 is slightly lower than
those of ACM3 to ACM5, whose fp values are similar. From these fp values, one can estimate the
relaxation time constant, τo = 1/fp. This constant defines the frontier between the capacitive and
resistive behaviors of the supercapacitor. The calculated τo values for all of the cells are plotted against
activation time in Figure 4e. It is well known that lower τo values correspond to higher power delivery
[30]. In the present studies, the comparative τo values suggest that the ACM3 electrodes are the
optimum material for higher power delivery. The 3 hours activation time is enough to develop the
porous matrix in the electrode, which exhibited excellent supercapacitive behavior in the low
frequency range.
3.2.2 Galvanostatic charge-discharge studies
The constant current charge-discharge studies of the supercapacitor cell were performed
between cell voltages of 0.01 and 1.0 V at two different discharge current densities of 10 and 30 mA
cm-2
, as shown in Figure 5a and 5b, respectively.
Figure 5. Potential-time curves of ACM electrodes with different activation times obtained at current
densities of (a) 10 mA/cm2 and (b) 30 mA/cm
2.

Int. J. Electrochem. Sci., Vol. 6, 2011
3311
All the charge-discharge curves had a similar shape, which is a typical pattern for carbon
electrode-based cells with capacitive behavior [31]. The supercapacitors based on ACM1 and ACM2
had shorter discharge times than the ACM3- to ACM6-based cells. The ACM5 cell had the longest
discharge time. Additionally, there was a sudden potential drop during the initial discharge for each
cell. Such potential drops were relatively small, indicating that the supercapacitor cells had a low series
resistance value that is attributable to the good conductivity and mesoporous nature of these CO2-
activated carbon electrodes.
3.2.3 Cyclic voltammetry
The cyclic voltammograms of the supercapacitor cells based on the carbon electrodes ACM1 to
ACM6 are shown in Figure 6 for the potential window from 0 to 1 V with a scan rate of 1 mV s-1
. All
cells had similar rectangular-like shapes without any redox current peaks on both the positive and
negative sweeps in the potential range of investigation. The voltammetric charges on the positive and
negative sweeps were approximately equal for all curves, which demonstrates that the charge-
discharge behavior of these ACMs in H2SO4 was highly reversible, further indicating that the
electrodes have good capacitive behavior [32]. An increase in activation time led to an increase in the
current values of the voltammograms. This is a consequence of the increase both in surface area with
increasing activation time and in the accessibility of electrolytes to the porous matrix of electrodes.
Potential (V)
0,0 0,2 0,4 0,6 0,8 1,0 1,2
Curr
ent density (
A c
m-2
)
-0,004
-0,002
0,000
0,002
0,004
0,006
ACM1
ACM2
ACM3
ACM4
ACM5
Figure 6. Cyclic voltammograms of ACM electrodes with different activation times obtained at a scan
rate of 1 mV s-1
.
3.3 Comparison of specific capacitance
Comparative values of specific capacitance from all three methods (galvanostatic charge-
discharge, cyclic voltammetry and EIS) for all the electrodes are listed in Table 5. From each method

Int. J. Electrochem. Sci., Vol. 6, 2011
3312
of measurement, a general trend of increasing specific capacitance with increasing activation time was
observed, with the maximum value for ACM5 (5-hour activation time). Increasing the activation time
past 5 hours decreased the specific capacitance (Table 5). These results demonstrate that the specific
capacitance obtained from the three different independent techniques are in good agreement and
exhibit a similar trend of change with changing activation time. Similar agreement has also been
reported for resorcinol-formaldehyde-based porous carbon electrodes [33].
Tabel 5. Specific capacitance obtained from constant current charge-discharge (GC), EIS and cyclic
voltammetry methods.
Symmetrical Csp (GC 0.01 A cm-2
) Csp (GC 0.03 A cm-2
) Csp (EIS) Csp CV
capacitors cell : (F g-1
) (F g-1
) (F g-1
) (F g-1
)
ACM1 7.86 7.64 9.02 13.33
ACM2 51.00 21.30 28.37 54.31
ACM3 90.10 79.94 85.84 73.32
ACM4 107.64 95.33 92.17 105.36
ACM5 138.71 121.58 105.49 121.42
ACM6 101.41 96.23 96.23 -
There are many reports in the literature describing supercapacitors fabricated with carbon
electrodes prepared from different biomass precursors [3-10, 34]. A comparative list of specific
capacitance values from these different electrodes, including the present study, is summarized in Table
6 along with their BET specific surface areas. These comparative data show that our results are within
the typical range reported by other researchers, indicating that the method of carbon electrode
preparation proposed in the present study is satisfactory.
Tabel 6. Electrodes of supercapacitors from biomass precursors.
Biomass Precursor Specific Capacitance BET Surface Area Reference
(F g-1
) (m2 g
-1)
Cassava peel 153 1352 [3]
Coffee beans waste 368 1029 [4]
Coffee shells 150 842 [5]
Cherry stones 232 1292 [6]
Bamboo 68 1251 [7]
Fir wood 197 2821 [8]
Banana fiber 74 1079 [9]
Sugar cane bagasse 300 1452 [10]
Bamboo 60 1025 [34]
RWSD 138 912 Present Study

Int. J. Electrochem. Sci., Vol. 6, 2011
3313
3.4 Specific energy and specific powers
The Ragone plots (i.e., specific power versus specific energy) for the supercapacitor cells with
ACM1 to ACM6 electrodes are shown in Figure 7 The energy and power relationship of this plot was
calculated by applying the formulas E = Vit/m and P = Vi/m, respectively where i is discharge current,
V is voltage excluding the iR drop occuring at the beginning of the discharge, t is time in hour and m
is the mass [35] from the charge and discharge curves at a current density of 30 mA (Figure 5b). A
gradual decrease in specific power was observed with increasing specific energy for the cells
employing the ACM3 to ACM6 electrodes. The ACM1 and ACM2 cells offer a fast decrease in
specific power versus specific energy. The maximum energy density was produced by the ACM5 cell
with a value of 2.63 Wh kg-1 at a power density of 291 W kg-1. These results fall within the typical
range of specific energy and specific power density for supercapacitors [36].
Specific Energy (Wh kg-1
)
0,0 0,5 1,0 1,5 2,0 2,5 3,0
Sp
ecific
Po
wer
(W k
g-1
)
100
200
300
400
500
600
700ACM1
ACM2
ACM3
ACM4
ACM5
ACM6
Figure 7. Specific power versus specific energy for ACM electrodes of different activation times.
4. CONCLUSIONS
Binderless porous ACMs for use as supercapacitor electrodes were prepared from the self-
adhesive carbon grains of RWSD. A multi-step CO2 activation process was used for their preparation
with different activation times (i.e., 1, 2, 3, 4, 5 and 6 hours) to optimize their porosity. The absence of
binder is advantageous because it lowers equivalent series resistance. Multi-step activation is necessary
to ensure that the monoliths are free of cracks. A longer activation time (approximately 5 hours)
produced lower density, smaller graphitic microcrystallite dimensions and a porous electrode structure
with micro- and mesoporosity. These results show how an improved pore network and higher surface
area were obtained, which enhances supercapacitive behavior. The optimum activation time was found

Int. J. Electrochem. Sci., Vol. 6, 2011
3314
to be 5 hours, yielding a specific capacitance of 138 F g-1
, a specific energy of 2.63 Wh kg-1
and a
specific power of 291 W kg-1
. Thus, the combined roles of multi-step activation and optimum
activation time produced a good quality binderless ACMs from RWSD for supercapacitor electrodes.
ACKNOWLEDGMENTS
The University Kebangsaan Malaysia (UKM) grant (UKM-GUP-NBT-08-27-107), Ministry oh Higher
Education (MOHE) grant (UKM-ST-07-FRGS0030-2009), and UKM grant (UKM-OUP-NBT-29-
145/2011) for this project are acknowledged.
References
1. R. Kotz, M. Carlen, Electrochim Acta. 45 (2000) 2483.
2. E. Frackowiak, F. Beguin, Carbon. 39 (2001) 937.
3. A.E. Ismanto, S.Wang, F.E. Soetaredjo, S. Ismadji, Bioresource Technol. 101 (2010) 3534.
4. T.E. Rufford, D. Hulicova-Jurcakova, Z. Zhu, G.Q. Lu, Electrochem Comm. 10 (2008) 1594.
5. M.R. Jisha, Y.J. Hwang, J.S. Shin, K.S. Nahm, T.P. Kumar, K. Karthikeyan, N.Dhanikaivelu,
D.Kalpana, N.G. Reganathan, A.M. Stephan, Mater Chem and Phys. 115 (2009) 33.
6. M. Olivares-Marin, J.A. Fernandez, M.J. Lazaro, C. Fernandez-Gonzalez, A. Marcias-Garcia, V.
Gomez-Serrano, et al, Mater Chem and Phys. 114 (2009) 323.
7. Y.J. Kim, B-J. Lee, H. Suezaki, T. Chino, Y. Abe, T. Yanagiura, K. C. Park, M. Endo, Carbon. 44
(2006) 1581.
8. F-C.Wu, R-L.Tseng, C-C.Hu, C-C.Wang, J Power Sources. 159 (2006) 1532.
9. V.Subramaniam, C.Luo, A.M. Stephan, K.S. Nahm, S.Thomas, B.Wei, J. Phys. Chem. C. 111
(2007) 7527.
10. T.E. Rufford, D.Hulicova-Jurcakova, K. Khosla, Z. Zhu, G.Q. Lu, J Powers Sources. 193 (2010)
912.
11. V. Ruiz, C. Blanco, R. Santamaria, J.M. Ramos-Fernandez, M. Martinez-Escandell, Sepulveda-
Escribano A, F. Rodriquez-Reinoso, Carbon. 47 (2009) 195.
12. A.Garcia-Gomez, P. Miles, T.A. Centeno, J.M. Rojo, Electrochim Acta. 55 (2010) 8539.
13. J.M.V. Nabais, J.G. Teixeira, I. Almeida, Bioresource Technol. 102 (2011) 2781.
14. V. Ruiz, C. Blanco, M. Granda, R. Menendez, J Appl Electrochem. 37 (2007) 717.
15. T.C. Weng, H. Teng, J Electrochem Soc. 148 (2001) 368.
16. A.R. Mohamed, M. Mohammadi, G.N. Darzi, J Renew Sustain Energy Rev. 14 (2010) 1591.
17. E. Taer, M. Deraman, I.A. Talib, A.A. Umar, M. Oyama, R.M. Yunus, Cur Appl Phys. 10 (2010)
1071.
18. M. Deraman, R. Omar, S. Zakari, I.R. Mustapa, M. Talib, N. Alias, J Mater Sci. 37 (2002) 3329.
19. P.A. Webb, Orr C. Analytical methods in fine particle technology. Norcross: Georgia, USA,
Micromeritiecs Instrument Corp (1997).
20. P.J.M. Carrott, J.M.V. Nabais, M.M.L. Ribeiro Carrott, J.A, Carbon. 39 (2001) 1543.
21. C. Portet, P.L. Taberna, P. Simon, E. Flahaut, C. Laberty-Robert, Electrochim Acta. 50 (2005)
4174.
22. Y. Zhu, H. Hu, W. Li, X. Zhang, Carbon. 45 (2007) 160.
23. K.S.W. Sing, D.H. Everret, R.A.W. Haul, L. Moscou, R.A. Pierotti, J. Rouquerol, T.
Siemieniewska, Pure Appl. Chem. 57 (1985) 603.
24. S. Guo, J. Peng, W. Li, K. Yang, L. Zhang, S. Zhang, at al, Appl Surface Sci. 255 (2009) 8443.
25. P.J.M. Carrott, Carbon. 29 (1991) 499.
26. X. He, J. Lei, Y. Geng, X. Zhang, M. Wu, M. Zheng, J Phys and Chem of Solids. 70 (2009) 738.

Int. J. Electrochem. Sci., Vol. 6, 2011
3315
27. X-M. Liu, R. Zhang, L. Zhan, D-H. Long, W-M. Qiao, J-H. Yang, L.-C. Ling, New Carbon Mater.
22 (2007) 153.
28. J. Gambia, P.L. Taberna, P. Simon, J.F. Fauvarque, M. Chesneau, J Power Sources. 101 (2001)
109.
29. J. Chimiola, G. Yushin, R. Dash, Y.Gogotsi, J Power Sources. 158 (2006) 765.
30. D. Pech, M. Brunet, H. Duron, P. Huang, V. Mochalin, Y. Gogotsi, P.-L. Taberna, P. Simon,
Nature Nanotech. 162 (2010) 651.
31. M.S. Michael, S.R.S. Prabaharan, J Power Sources. 136 (2004) 250.
32. S-I. Lee, S. Mitani, C.W. Park, S-H. Yoon, Y. Korai, I. Mochida, J Power Sources. 139 (2005)
379.
33. Y. Zhu, H. Hu, W. Li, X. Zhang, Carbon. 45 (2007) 160.
34. C. Kim, J-W. Lee, J-H. Kim, K-S. Yang, Korean J Chem Eng. 23 (2006) 592.
35. S.R.S. Prabahan, R. Vimala, Z. Zainal, J Power Sources. 161 (2006) 730.
36. P. Simon, Y. Gogotsi, Nature Mater. 7 (2008) 845.
© 2011 by ESG (www.electrochemsci.org)