Embed Size (px)
Citation preview

PREPARATION OF POLYPYRROLE
NANOCOMPOSITES FOR HIGH-PERFORMANCE
SUPERCAPACITOR ELECTRODES
JOHN KEVIN GAN ZI YI
THESIS SUBMITTED IN FULFILLMENT OF THE
REQUIREMENTS FOR THE DEGREE OF
DOCTOR OF PHILOSOPHY
FACULTY OF SCIENCE
UNIVERSITY OF MALAYA
KUALA LUMPUR
2016
ii
UNIVERSITI MALAYA
ORIGINAL LITERARY WORK DECLARATION
Name of Candidate: JOHN KEVIN GAN ZI YI (I.C/Passport No: 871129-43-5499)
Registration/Matric No: SHC 120098
Name of Degree: DOCTOR OF PHILOSOPHY
Title of Project Paper/Research Report/Dissertation/Thesis (“this Work”):
PREPARATION OF POLYPYRROLE NANOCOMPOSITES FOR HIGH-
PERFORMANCE SUPERCAPACITOR ELECTRODES
Field of Study: EXPERIMENTAL PHYSICS
I do solemnly and sincerely declare that:
(1) I am the sole author/writer of this Work;
(2) This Work is original;
(3) Any use of any work in which copyright exists was done by way of fair dealing
and for permitted purposes and any excerpt or extract from, or reference to or
reproduction of any copyright work has been disclosed expressly and
sufficiently and the title of the Work and its authorship have been acknowledged
in this Work;
(4) I do not have any actual knowledge nor do I ought reasonably to know that the
making of this work constitutes an infringement of any copyright work;
(5) I hereby assign all and every rights in the copyright to this Work to the
University of Malaya (“UM”), who henceforth shall be owner of the copyright
in this Work and that any reproduction or use in any form or by any means
whatsoever is prohibited without the written consent of UM having been first
had and obtained;
(6) I am fully aware that if in the course of making this Work I have infringed any
copyright whether intentionally or otherwise, I may be subject to legal action or
any other action as may be determined by UM.
Candidate’s Signature: Date:
Subscribed and solemnly declared before,
Witness’s Signature: Date:
Name: Dr. Huang Nay Ming
Designation: Senior Lecturer

iii
ABSTRACT
Electrode material is of great importance for the realization of high-performance
supercapacitors. Hence, improving the electrochemical aspects of the electroactive
materials will inevitably enhance the performance of supercapacitors. This work aims to
harness the properties of interest of polypyrrole (PPy) through the synthesis of PPy-
based nanocomposites. This research work was divided into four stages. The first study
involves the synthesis and evaluation of the capacitance performance of
polypyrrole/manganese oxide (PPy/MnO2) nanocomposites. PPy/MnO2 nanocomposites
with compact sheet, fibrous-porous and granular morphologies were synthesized by
simply tuning the pH of the solution. The optimum pH condition was found to be 4.0,
producing highly porous PPy/MnO2 nanocomposite that enabled the rapid
intercalation/deintercalation of the electrolyte. As a result, a specific capacitance of up
to 306 F g−1
was obtained for the porous PPy/MnO2 nanocomposite. The second part of
this work was to improve the electrode wettability of the PPy electrode by the
integration of chitosan biopolymer. The newly obtained hydrophilic properties of the
polypyrrole/chitosan (PPy/CS) nanocomposites elicited an improvement in its specific
capacitance. Hence, the nanocomposite PPy/CS displayed a specific capacitance of 403
F g−1
as opposed to 273 F g−1
for the pure PPy electrode calculated at 0.2 A g−1
. Contact
angle measurement indicated an improvement in the hydrophilicity of PPy/CS
nanocomposites. The increased surface wettability of the nanocomposite electrode
effectively increased the ion-accessible surface and facilitated the electrolyte infiltration
throughout the internal volume of the electrode. The third part of this work was to
enhance the electronic conductivity of PPy with the incorporation of silver (Ag)
particles. A hybrid silver nanoparticle/nanocluster-decorated polypyrrole demonstrated
an enhanced specific capacitance of 414 F g−1
. The enhanced specific capacitance was
mainly attributed to the unique architecture and hybrid nanostructures of Ag. The Ag

iv
nanoparticles enhanced the electron hopping system of the PPy, effectively increasing
the supercapacitive properties of the PPy. On the other hand, the Ag nanoclusters acted
as spacers to prevent the restacking of PPy films, further extending the active sites for
redox reactions, leading to improved specific capacitance. The final part of this study
sought to combine the merits of the hydrophilic chitosan and highly conducting Ag with
PPy. Experimental results showed that the ternary nanocomposite (Ag@PPy/CS) has a
specific capacitance of 513 F g−1
at 0.2 A g−1
. The improved transportation of
electrolyte ions and electrons by the incorporation of chitosan and Ag led to a
pronounced enhancement in the supercapacitive property of PPy.

v
ABSTRAK
Bahan elektrod adalah amat mustahak untuk merealisasikan superkapasitor berprestasi
tinggi. Justeru itu, peninkatan dalam aspek elektrokimia bagi bahan elektroaktif secara
langsung akan meningkatkan prestasi superkapasitor. Kajian ini bertujuan untuk
menggunakan ciri-ciri menarik polypyrrole (PPy) melalui penyediaan nanokomposit
berasaskan PPy. Penyelidikan ini dibahagikan kepada empat peringkat. Kajian pertama
melibatkan sintesis dan penilaian prestasi kapasitan daripada nanokomposit
polypyrrole/mangan oksida (PPy/MnO2). Nanokomposit PPy/MnO2 dengan morfologi
yang padat, berliang dan bergranul telah disintesiskan dengan pengubahsuaian nilai pH
larutan. Didapati nilai pH 4.0 adalah pH yang optima, dimana ia dapat menghasilkan
PPy/MnO2 nanokomposit yang berliang tinggi, membolehkan interkalasi/deinterkalasi
elektrolit yang pesat. Sedemikian itu, kapasitan tentu sehingga 306 F g−1
telah
diperolehi bagi nanokomposit PPy/MnO2 yang berliang tinggi. Bahagian kedua kajian
ini adalah untuk meningkatkan ciri hidrofilik elektrod PPy dengan pengintegrasian
biopolimer kitosan. Sifat hidrofilik baru polypyrrole/kitosan (PPy/CS) ini menyebabkan
peningkatan kepada kapasitan tentu. Justeru itu, nanokomposit PPy/CS memaparkan
kapasitan tentu sebanyak 403 F g−1
berbanding dengan 273 F g−1
untuk elektrod PPy
pada 0.2 A g−1
. Penilaian sudut sentuh menunjukkan peningkatan sifat hidrofilik
nanokomposit PPy/CS. Peningkatan sifat hidrofilik menyebabkan permukaan
nanokomposit elektrod lebih mudah untuk diakses ion dan mempermudahkan
penyusupan elektrolit ke dalam elektrod. Bahagian ketiga kajian ini adalah untuk
meningkatkan kekonduksian elektronik PPy dengan penambahan zarah Argentum (Ag).
PPy yang dihiasi dengan kacukan nanozarah/nanokelompok Ag telah menunjukkan
kapasitan tentu yang bernilai 414 F g−1
. Peningkatan kapasitan tentu adalah disebabkan
oleh keunikan seni bina dan kacukan nanostruktur Ag. Nanozarah Ag menambahbaikan
sistem pelompatan elektron dalam PPy, inin mengakibatkan peningkatan sifat kapasitan

vi
PPy. Selain daripada itu, nanokelompok Ag bertindak sebagai peruang untuk mencegah
pertindihan semula filem PPy, seterusnya memperluaskan lagi tapak aktif untuk tindak
balas redoks, membawakan kepada peningkatan kapasitan tentu. Bahagian akhir kajian
ini bertujuan untuk menggabungkan kelebihan kitosan yang berhidrofilik dan Ag yang
berkonduksian tinggi dengan PPy. Keputusan eksperimen menunjukkan bahawa
nanokomposit (Ag@PPy/CS) ini memiliki kapasitan tentu setinggi 513 F g−1
pada 0.2 A
g−1
. Peningkatan dalam segi pengangkutan ion elektrolit dan elektron terhasil dari
gabungan kitosan dan Ag yang membawa kepada peningkatan ketara kepada kapasitan
tentu PPy.

vii
ACKNOWLEDGMENTS
First and foremost, praises and thanks to the God, for His showers of blessings
and strength given unto me.
I would like to express my sincere appreciation to my supervisor, Dr. Huang
Nay Ming, who not only supervised but also encouraged and guided me throughout the
whole duration of my research with much patience and kindness.
My special thanks are also extended to Dr. Pandikumar and Dr. Lim Yee Seng
for their valuable assistance, kind advice and sharing of invaluable hands-on skills in
the laboratory. Also, I would like to thank my colleagues, for creating a wonderful
working environment and their selfless assistance.
To my beloved family, I cannot express enough thanks for their endless support,
boundless love, encouragement and understanding throughout my PhD studies.

viii
TABLE OF CONTENTS
Original Literary Work Declaration .................................................................................. ii
Abstract ............................................................................................................................ iii
Abstrak .............................................................................................................................. v
Acknowledgments ........................................................................................................... vii
Table of Contents ........................................................................................................... viii
List of Figures ................................................................................................................ xiii
List of Tables................................................................................................................ xviii
List of Abbreviations...................................................................................................... xix
List of Symbols ............................................................................................................... xx
CHAPTER 1: INTRODUCTION .................................................................................. 1
1.1 Research Background............................................................................................. 1
1.2 Energy Storage Devices ......................................................................................... 2
1.3 Scope of Research .................................................................................................. 3
1.4 Research Objectives ............................................................................................... 4
1.5 Outline of Thesis .................................................................................................... 4
CHAPTER 2: LITERATURE REVIEW ...................................................................... 7
2.1 Historical Overview of Capacitors ......................................................................... 7
2.2 Working Principle of Supercapacitors ................................................................... 8
2.2.1 The charge storage mechanism of EDLC ....................................................... 9
2.2.2 The charge storage mechanism of Pseudocapacitors .................................... 12
2.3 Principles and Methods of Experimental Evaluation ........................................... 13
2.3.1 Cyclic Voltammetry (CV) ............................................................................ 15
2.3.2 Galvanostatic charge/discharge (GCD) ........................................................ 17
2.3.3 Electrochemical Impedance Spectroscopy (EIS) .......................................... 19

ix
2.4 Electrode Materials for Supercapacitors .............................................................. 20
2.4.1 Carbon-based Materials as EDLC ................................................................ 21
2.4.2 Transition Metal Oxides ............................................................................... 25
2.4.2.1 Ruthenium oxide ................................................................................... 25
2.4.2.2 Manganese oxides ........................................................................................ 26
2.4.3 Electrically Conducting Polymers ................................................................ 30
2.4.3.1 Polypyrrole (PPy) .................................................................................. 32
2.4.3.2 PPy and PPy/carbon-based composites for supercapacitors ................. 33
2.4.3.3 PPy/MnO2 composites for supercapacitors ........................................... 35
2.4.3.4 PPy/Chitosan composites ...................................................................... 40
2.5 Modifications of Electrode Material .................................................................... 41
2.6 Electrolytes for Supercapacitors .......................................................................... 43
2.6.1 Aqueous Electrolyte ...................................................................................... 43
2.6.2 Organic Electrolyte ....................................................................................... 44
2.6.3 Ionic Liquid Electrolyte ................................................................................ 45
2.7 Applications for Supercapacitors ......................................................................... 46
2.7.1 Transportation ............................................................................................... 46
2.7.2 Stationary Electrical Energy Storage ............................................................ 47
2.7.3 Portable Power Systems................................................................................ 48
CHAPTER 3: MATERIALS AND METHODOLOGY ............................................ 49
3.1 Materials ............................................................................................................... 49
3.2 Synthesis method ................................................................................................. 50
3.2.1 Synthesis of PPy/MnO2 nanocomposites ...................................................... 50
3.2.2 Synthesis of PPy/CS composite electrodes ................................................... 50
3.2.3 Synthesis of Ag@PPy nanocomposites ........................................................ 51
3.2.4 Synthesis of Ag@PPy/CS composite electrode ............................................ 51
x
3.3 Characterization techniques ................................................................................. 52
3.3.1 X-ray diffraction (XRD) ............................................................................... 52
3.3.2 Fourier transform infrared spectroscopy (FT-IR) ......................................... 52
3.3.3 Raman spectroscopy ..................................................................................... 53
3.3.4 X-ray photoelectron spectroscopy ................................................................ 53
3.3.5 Surface area analysis ..................................................................................... 54
3.3.6 Contact Angle Measurement ........................................................................ 54
3.3.7 Electron Microscopy ..................................................................................... 55
3.4 Evaluation of Electrochemical Properties ............................................................ 55
3.4.1 Cyclic Voltammetry (CV) ............................................................................ 56
3.4.2 Galvanostatic charge/discharge .................................................................... 56
3.4.3 Electrochemical impedance spectroscopy .................................................... 56
CHAPTER 4: EFFECT OF pH ON MORPHOLOGY AND SUPERCAPACITIVE
PROPERTIES OF POLYPYRROLE/MANGANESE OXIDE
NANOCOMPOSITE .................................................................................................... 57
4.1 Introduction .......................................................................................................... 57
4.2 Results and Discussion ......................................................................................... 59
4.2.1 FTIR and Raman analysis ............................................................................. 59
4.2.2 X-ray diffraction analysis ............................................................................. 61
4.2.3 Morphological studies................................................................................... 62
4.2.4 Surface area analysis ..................................................................................... 64
4.2.5 XPS analysis ................................................................................................. 65
4.2.6 Electrochemical characterization of PPy/MnO2 nanocomposite ................. 66
4.2.7 Supercapacitor device performance of porous PPy/MnO2 nanocomposite . 70
4.3 Conclusion ........................................................................................................... 74

xi
CHAPTER 5: EXCEPTIONAL ELECTROCHEMICAL PERFORMANCE OF
HYDROPHILIC POLYPYRROLE/CHITOSAN NANOCOMPOSITE
ELECTRODE FOR SUPERCAPACITORS .............................................................. 76
5.1 Introduction .......................................................................................................... 76
5.2 Results and Discussion ......................................................................................... 79
5.2.1 Synthesis and formation mechanism ............................................................ 79
5.2.2 FTIR analysis ................................................................................................ 81
5.2.3 Morphological studies of PPy/CS nanocomposite electrodes ...................... 82
5.2.4 Surface wettability studies of PPy/CS nanocomposite electrodes ................ 83
5.2.5 Electrochemical characterization of PPy/CS nanocomposite electrodes ...... 85
5.2.6 Supercapacitor device performance of PPy/CS nanocomposite electrode ... 87
5.3 Conclusion ........................................................................................................... 93
CHAPTER 6: HYBRID SILVER NANOPARTICLE/NANOCLUSTER-
DECORATED POLYPYRROLE FOR HIGH-PERFORMANCE
SUPERCAPACITORS ................................................................................................. 94
6.1 Introduction .......................................................................................................... 94
6.2 Results and Discussion ......................................................................................... 97
6.2.1 Synthesis and formation mechanism ............................................................ 97
6.2.2 FTIR and Raman analysis ............................................................................. 98
6.2.3 Morphological studies of Ag@PPy nanocomposite ..................................... 99
6.2.4 XPS analysis of hybrid Ag@PPy nanocomposite ...................................... 103
6.2.5 Electrochemical characterizations of Ag@PPy nanocomposite ................. 104
6.2.6 Supercapacitor device performance of hybrid Ag@PPy nanocomposite ... 108
6.3 Conclusion ......................................................................................................... 111

xii
CHAPTER 7: BOOSTING THE SUPERCAPACITIVE PROPERTIES OF
POLYPYRROLE WITH CHITOSAN AND HYBRID SILVER
NANOPARTICLE/NANOCLUSTER....................................................................... 113
7.1 Introduction ........................................................................................................ 113
7.2 Results and Discussion ....................................................................................... 115
7.2.1 Synthesis and formation mechanism .......................................................... 115
7.2.2 FTIR and XPS analysis ............................................................................... 116
7.2.3 X-ray diffraction analysis ........................................................................... 118
7.2.4 Morphological studies................................................................................. 119
7.2.5 Surface wettability studies .......................................................................... 124
7.2.6 Electrochemical characterization ................................................................ 125
7.2.7 Supercapacitor device performance ............................................................ 128
7.3 Conclusion ......................................................................................................... 132
CHAPTER 8: CONCLUSION AND FUTURE WORK
RECOMMENDATIONS .………………………………………………………...133
8.1 Conclusion .................................................................................................. 133
8.2 Future work recommendations ................................................................... 135
References ..................................................................................................................... 137
List of Publications and Papers Presented .................................................................... 153
xiii
LIST OF FIGURES
Figure 1.1: Ragone plot of specific energy and power of various energy storage devices
(G. Yu et al., 2013)............................................................................................................ 3
Figure 2.1: Models of electrical double layer at a positively charged surface: (a) the
Helmholtz model, (b) the Gouy-Chapman model, and (c) the Stern model showing the
IHP and OHP. d is the double layer distance described by Helmholtz model. ψ0 and ψ
are the potentials at the electrode surface and the electrode /electrolyte interface,
respectively (Zhang & Zhao, 2009). ............................................................................... 10
Figure 2.2: (a) Two-electrode configuration (Stoller & Ruoff, 2010) and (b) three-
electrode configuration.................................................................................................... 14
Figure 2.3: Cyclic voltammetry of PANI/MWCNT using (a) three-electrode (b) two-
electrode configuration (Khomenko et al., 2005) ........................................................... 15
Figure 2.4: CV of (a) MC30HT and (b) MC60HT at various scan rates (Wang et al.,
2012a). ............................................................................................................................. 17
Figure 2.5: GCD curve of an electrode. ......................................................................... 18
Figure 2.6: Nyquist plot of EIS of an electrode ............................................................. 20
Figure 2.7: Evolution of 2D carbon (graphene) into different building blocks of
materials; buckyball, CNTs and graphite (Geim & Novoselov, 2007). .......................... 24
Figure 2.8: Schematic illustration of the dip coating process for the synthesis of
sponge@RGO@MnO2 (Ge et al., 2013). ........................................................................ 29
Figure 2.9: Chemical structures of some most common ECPs in their neutral states. (a)
PANi, (b) PPy, (c) PTh, and (d) PEDOT ........................................................................ 31

xiv
Figure 2.10: (a) Schematic illustration of the formation and (b) schematic charge
storage advantage of the PPy/MnO2 coaxial nanotubes (Yao et al., 2013)..................... 36
Figure 2.11: Mechanism of regenerative brake system employed in Mazda®
(http://www.mazda.com/). .............................................................................................. 47
Figure 4.1: (a) FTIR and (b) Raman spectra of PPy/MnO2 nanocomposite. ................. 60
Figure 4.2: X-ray diffraction patterns of PPy/MnO2 nanocomposite and sample holder.
......................................................................................................................................... 61
Figure 4.3: FESEM images of PPy/MnO2 nanocomposites synthesized at various pH
values of (a) 1.0, (b) 2.0, (c) 4.0, (d) 5.0, and (e) 7.8, and (f) elemental mapping of
PPy/MnO2 nanocomposite at pH 4.0. ............................................................................. 63
Figure 4.4: (a) N2 adsorption/desorption isotherm and (b) pore size distribution curve of
the PPy/MnO2 nanocomposite prepared at pH 1.0, 4.0 and 7.8. ..................................... 65
Figure 4.5: XPS spectra of MnO2/PPy nanocomposite at (a) Mn 2p and (b) O 1s core
level spectra. .................................................................................................................... 66
Figure 4.6: (a) CV curves at 10 mV s−1
obtained for PPy/MnO2 nanocomposites
prepared under different pH conditions and (b) specific capacitance values for different
pH conditions calculated at current density of 0.2 A g−1
. ............................................... 68
Figure 4.7: CV curves at various scan rates and (b) GCD curves at various current
densities for porous PPy/MnO2 nanocomposite (pH 4.0). .............................................. 69
Figure 4.8: Nyquist plots of EIS for PPy/MnO2 nanocomposites prepared at pH 1.0
(compact sheet), 4.0 (porous), and 7.8 (granular). Inset is a magnified portion of the
high-frequency region. .................................................................................................... 70
Figure 4.9: (a) CV curves at various scan rates, (b) galvanostatic charge/discharge
curves at various current densities, and (c) Ragone plot of the symmetric supercapacitor
device. ............................................................................................................................. 71

xv
Figure 4.10: Dependence of specific capacitance values on current density for the
symmetric supercapacitor device. ................................................................................... 73
Figure 4.11: Cycling stability of the fabricated symmetric supercapacitor device. ....... 74
Figure 5.1: Mechanism for the formation of PPy/CS nanocomposite electrode. .......... 80
Figure 5.2: FTIR of CS, PPy and PPy/CS. .................................................................... 82
Figure 5.3: FESEM images of (a) pure PPy; PPy/CS nanocomposite electrodes with CS
contents of (b) 0.5, (c) 0.75, (d) 1.0 wt%, and (e) elemental mapping of the PPy/CS-0.75
nanocomposite electrode. ................................................................................................ 83
Figure 5.4: Digital images of water droplets on the surfaces of the as-prepared
electrodes......................................................................................................................... 84
Figure 5.5: (a) CV curves at 25 mV s−1
, (b) GCD curves at 0.2 A g−1
, (c) dependence of
specific capacitance on current density for PPy and PPy/CS nanocomposite electrode,
and (d) CV curves of PPy/CS nanocomposite electrode as a function of scan rate. ....... 86
Figure 5.6: Specific capacitance values for different CS content calculated at current
density of 0.2 A g−1
. ........................................................................................................ 87
Figure 5.7: Nyquist plots of EIS for the as-fabricated symmetric supercapacitors of PPy
and PPy/CS nanocomposite electrodes at 0.50, 0.75 and 1.0 wt% chitosan. .................. 89
Figure 5.8: (a) CV curves at various scan rates, (b) GCD curves at various current
densities of the PPy/CS symmetric supercapacitor, and (c) comparison of the
dependence of specific capacitance on current density of the PPy and PPy/CS
symmetric supercapacitor................................................................................................ 91
Figure 5.9: (a) Ragone plots, and (b) cycling stability plots for the symmetric
supercapacitors of PPy and PPy/CS. ............................................................................... 92
Figure 6.1: Physical appearance of the reaction mixture after stirring for 5 min prior to
electrodeposition. ............................................................................................................ 98
Figure 6.2: (a) FTIR and (b) Raman spectra of PPy and Ag@PPy. .............................. 99

xvi
Figure 6.3: FESEM images of (a) pure PPy, inset showing PPy at lower magnification;
Ag@PPy nanocomposites with AgNO3 concentrations of (b) 0.01 M, (c) 0.05 M, (d)
0.10 M, and (e) elemental mapping of the 0.05M-Ag@PPy nanocomposite. .............. 101
Figure 6.4: Schematic reperesentation of the evolution of different Ag@PPy
nanocomposites. ............................................................................................................ 102
Figure 6.5: HRTEM images of (a) Ag nanoclusters and (b) Ag nanoparticles. .......... 102
Figure 6.6: XPS spectra of Ag@PPy nanocomposite at (a) N 1s and (b) Ag 3d core
level spectra. .................................................................................................................. 103
Figure 6.7: CV curves at 10 mV s−1
, (b) GCD curves at 0.2 A g−1
, and (c) dependence
of specific capacitance on current density for PPy and hybrid Ag@PPy nanocomposite
electrode. ....................................................................................................................... 106
Figure 6.8: CV curves at various scan rates for (a) PPy, and (b) hybrid Ag@PPy
nanocomposite electrode. .............................................................................................. 107
Figure 6.9: Specific capacitance values for different AgNO3 concentrations calculated
at current density of 0.2 A g−1
. ...................................................................................... 108
Figure 6.10: (a) CV at various scan rates and (b) GCD at various current densities of
the as-fabricated symmetric supercapacitor of Ag@PPy nanocomposite. ................... 109
Figure 6.11: Nyquist plots of EIS for the symmetric supercapacitors of PPy and hybrid
Ag@PPy nanocomposites. Inset is a magnified portion of the high-frequency region.110
Figure 6.12: (a) Ragone plot, and (b) cycling stability of the symmetric supercapacitors
of PPy and hybrid Ag@PPy nanocomposite. ............................................................... 111
Figure 7.1: Physical appearance of the reaction mixture after stirring for 5 min prior to
electrodeposition. .......................................................................................................... 118
Figure 7.2: (a) FTIR of CS, PPy, Ag@PPy, PPy/CS and Ag@PPy/CS (b) XPS spectra
of Ag@PPy and Ag@PPy/CS nanocomposite electrodes at Ag 3d core level spectra. 121

xvii
Figure 7.3: FESEM images of (a) PPy, (b) PPy/CS, (c) Ag@PPy, (d) Ag@PPy/CS
nanocomposite electrodes, and (e) elemental mapping of the Ag@PPy/CS
nanocomposite electrode. Insets of (c) and (d) show the lower magnification images of
the respective nanocomposites. ..................................................................................... 121
Figure 7.4: HRTEM images of (a) Ag nanoclusters, (b) Ag nanoparticles from
Ag@PPy and (c) Ag nanoclusters and (d) Ag nanoparticles from Ag@PPy/CS. ........ 123
Figure 7.5: Digital images of water droplets on the surfaces of the as-prepared
electrodes....................................................................................................................... 125
Figure 7.6: (a) CV curves at 10 mV s−1
and (b) GCD curves at 0.2 A g−1
of the as-
synthesized electrodes. .................................................................................................. 127
Figure 7.7: (a) CV curves at 10 mV s−1
, (b) CV curves of Ag@PPy/CS symmetric
supercapacitor at various scan rates, (c) GCD curves at 0.2 A g−1
, and (d) comparison of
the dependence of specific capacitance on the current density of the symmetric
supercapacitors. ............................................................................................................. 129
Figure 7.8: Nyquist plots of EIS for the as-fabricated symmetric supercapacitors. .... 130
Figure 7.9: (a) Ragone plots, and (b) cycling stability plots for the symmetric
supercapacitors. ............................................................................................................. 132
xviii
LIST OF TABLES
Table 2.1: Summary of a selection of PPy and PPy/carbon-based composites for
supercapacitors. Specific capacitance values are reported from three-electrode
configuration unless otherwise stated. ............................................................................ 33
Table 2.2: Specific capacitance of a selection of PPy/MnO2 composites reported in the
literature. Specific capacitance values are reported from three-electrode configuration
unless otherwise stated. ................................................................................................... 39
Table 3.1 Materials and chemicals used in this thesis .................................................... 49
Table 4.1: BET specific surface areas (SBET), total pore volumes, and average pore sizes
of PPy/MnO2 nanocomposites. ....................................................................................... 65
Table 5.1: The ESR and Rct values of the symmetric supercapacitors of PPy and
PPy/CS nanocomposites obtained from Nyquist plot. .................................................... 89
Table 7.1: Electrochemical data for Ag@PPy and Ag@PPy/CS nanocomposite
electrodes....................................................................................................................... 127
Table 7.2: The ESR and Rct values of the symmetric supercapacitors extracted from the
Nyquist plots. ................................................................................................................ 131

xix
LIST OF ABBREVIATIONS
AC Activated carbon
Ag Silver
AgNO3 Silver nitrate
Ag@PPy Silver/polypyrrole
Ag@PPy/CS Silver/polypyrrole/chitosan
BET Brunauer–Emmett–Teller
BJH Barret-Joyner-Halenda
CNT Carbon nanotubes
CS Chitosan
CV Cyclic voltammetry
DI Deionized
ECP Electrically conducting polymer
EDLC Electrical double layer capacitance
EES Electrochemical energy storage
EIS Electrochemical impedance spectroscopy
ESR Equivalent series resistance
FeCl3 Iron (III) chloride
FESEM Field emission scanning electron microscopy
FTIR Fourier transform infrared spectroscopy
GCD Galvanostatic charge discharge
H2SO4 Sulfuric acid
HRTEM High resolution transmission electron microscopy
IHP Inner Helmholtz plane
KMnO4 Potassium permanganate (VII)
MnO2 Manganese (IV) oxide
Na2SO4 Sodium sulfate
NapTS Sodium p-toluenesulfonate
OHP Outer Helmholtz plane
PANi Polyaniline
PEDOT Poly(3,4-ethylenedioxythiophene)
PPy Polypyrrole
PPy/CS Polypyrrole/chitosan
PPy/MnO2 Polypyrrole/manganese oxide
PTh Polythiophene
RuO2 Ruthenium oxide
SCE Saturated calomel electrode
XPS X-ray photoelectron spectroscopy
XRD X-ray diffraction
xx
LIST OF SYMBOLS
C Capacitance
Cdiff Diffuse region double layer capacitance
Cdl Double layer capacitance
CH Helmholtz type inner region capacitance
I Current
m Mass
Q Charge
Rct Charge transfer resistance
SBET Specific surface area
T Time
V Voltage
ν Scan rate
wt% Weight percentage
Z’ Real impedance
Z” Imaginary impedance

1
CHAPTER 1
INTRODUCTION
1.1 Research Background
According to The World Energy Outlook 2014, global energy demands will
grow by 37% by 2040 (World Energy Outlook, 2014). However, nearly 80% of today’s
world energy is supplied by fossil fuels, including oil, gas and coal. These non-
renewable fossil fuels produce exhaust in the form of CO2 and are projected to rise to 45
billion metric tons in 2040, contributing largely to global warming (Energy Information
Administration, 2013).
Limited resources of fossil fuels and the destructive climate change have been
driving the world towards clean and renewable energy development. The utilization of
natural energy sources such as wind, hydro and solar energy has become increasingly
important to reduce the dependence on fossil fuels for global energy demands. However,
the lack of continuous availability is a major drawback for these renewable sources, as
most renewable energy resources depend on the climate (Baños et al., 2011). Solar
energy devices are unable to generate electricity during the night but may generate
surplus amounts of energy during the day. A rational approach is to develop energy
storage devices that can store large amount of the harvested energy. The fast-growing
development for clean and sustainable energy has to be in unison with the development
of energy storage devices. Therefore, there has been an increasing and urgent demand
for a variety of environmental friendly and reliable energy storage devices for a wide
range of applications.

2
1.2 Energy Storage Devices
Efficient electrochemical energy storage (EES) systems are critically needed
with the increased usage of transportation industry, consumable electronic devices, and
industrial electronic devices. EES are vital to promote the reliability and the effective
use of the entire power system (generation, transmission and distribution) by releasing
energy when in high demand and storing energy when in excess. EES systems to meet
these needs requirements include batteries, fuel cells, supercapacitors and conventional
capacitors.
The performance of energy storage devices based on the power and energy
density can be expressed by Ragone plot as shown in Figure 1.1. As seen from the
Ragone plot, supercapacitors are considered high power systems whilst batteries and
fuel cells are considered to be high energy systems. It can be noted that no single energy
device can match all power and energy region.
Supercapacitors, also known as electrochemical capacitors or ultracapacitors,
have attracted great attention due to their superior fast charging and discharging process,
long cycle life, and environmental friendliness. Supercapacitors are excellent candidate
to meet the ever increasing power demands of energy storage systems in the twenty-first
century. They bridge the performance gap between conventional capacitors and
batteries; offering higher energy density as compared to conventional capacitors and
higher power density than batteries. One of the main challenges in the development of
supercapacitors continues to be the enhancement of their energy densities, as they are
still relatively lower than batteries and fuel cells. Thus, tremendous amount of efforts
have been devoted to construct higher performance supercapacitors with higher energy
densities while maintaining its desirable high power densities.

3
Figure 1.1: Ragone plot of specific energy and power of various energy storage devices
(G. Yu et al., 2013)
1.3 Scope of Research
As the title of this thesis suggests, the aim of this thesis is on designing and
preparing novel polypyrrole-based materials with enhanced electrochemical
performance as well as good cycling stability. The motivation behind this doctoral work
is to prepare polypyrrole nanocomposite electrodes through simple and cost-effective
methodologies. This doctoral work also focuses on the integration of polypyrrole with
materials that are not commonly used in supercapacitors applications such as silver and
chitosan, giving rise to novel materials with interesting features for high-performance
supercapacitor applications. There is also an effort to understand the relationship
between the as-prepared materials and their enhanced supercapacitor performance,
which could provide guidelines for supercapacitor designs in the future.

4
1.4 Research Objectives
1) To develop a facile and cost-effective method for the preparation of polypyrrole-
based nanocomposite materials consisting of polypyrrole for high-performance
supercapacitor electrodes.
2) To investigate and evaluate the supercapacitive properties of the as-prepared
polypyrrole nanocomposites.
3) Optimizing the synthesis parameters that affect the electrochemical properties.
4) Understanding the relationship between the new polypyrrole-based nanocomposites
and their supercapacitance performances.
5) Laboratory scale fabrication of symmetric supercapacitors using the developed PPy-
based electrodes in order to access the potential performance in a real device.
1.5 Outline of Thesis
The structure of this thesis can be summarized as follows.
Chapter 1 begins with a brief discussion on the world energy crisis and the
rational of developing energy storage systems. Then, the motivation and research
objectives of this study using polypyrrole based nanocomposite materials were
discussed.

5
Chapter 2 serves to provide a comprehensive literature review on the energy
storage principles of supercapacitors and the commonly used techniques for evaluating
the electrochemical properties of supercapacitors. The latter part of chapter 2 is devoted
to discuss the electrode materials used for supercapacitors followed by current
applications of supercapacitors.
Chapter 3 presents the synthesis of PPy based nanocomposite via different
methods and their characterization techniques. Instrumental analyses, including Fourier
transform infrared spectroscopy (FTIR), Raman spectroscopy, X-ray diffraction (XRD),
X-ray photoelectron spectroscopy (XPS), field-emission scanning electron microscopy
(FESEM), high resolution transmission electron microscopy (HRTEM) and surface area
analysis.
Chapter 4 discusses the synthesis and characterization of polypyrrole/manganese
oxide (PPy/MnO2) nanocomposite with emphasis on the effect of pH on the
morphology and electrochemical performance of the nanocomposite.
Chapter 5 focuses on the experimental setup of the preparation and
characterization of hydrophilic polypyrrole/chitosan (PPy/CS) nanocomposite
electrodes via a one-step electrodeposition. The addition of chitosan successfully
increased the surface wettability of the electrode. Also, the specific capacitances of the
PPy/CS electrodes are optimized based on the amount of chitosan used in the synthesis.
Chapter 6 describes a novel method to synthesize silver-decorated polypyrrole
(Ag@PPy). The formation of silver nanoparticles and nanoclusters with respect to the
concentration of silver nitrate was investigated. The plausible mechanism of silver
nanoclusters and nanoparticles on the PPy film was postulated.

6
Chapter 7 presents the fabrication of a new ternary nanocomposite consisting of
PPy, chitosan and silver (Ag@PPy/CS) as a promising electrode for supercapacitor. The
merits of silver and chitosan in the nanocomposite were investigated. The benefits of
both silver and chitosan brought about enhanced supercapacitive properties of PPy.
Chapter 8 concludes the thesis with major findings in terms of improving the
specific capacitance of PPy-based supercapacitors and also the formation of new PPy
nanocomposites. Possible future research recommended for the enhancement of
supercapacitor performances are proposed at the end of this chapter.

7
CHAPTER 2
LITERATURE REVIEW
2.1 Historical Overview of Capacitors
The discovery of electrical charge storage on surfaces was attributed to the
rubbing of amber in ancient times. Leyden jar was the first instrument to make usage of
such charge storage, invented independently by Pieter van Musschenbroek of Kamin
and Dean Kliest at Leyden in the mid-eighteenth century (Conway, 1999).
A typical design of the Leyden jar consisted of a glass vial, containing acidic
electrolyte as a conductor and which was contacted by an immersed metal electrode.
The glass medium is used as a dielectric between the conducting metal coating on the
inner and outer surfaces. The outer and inner surfaces store equal but opposite charge
and this double layer charging occurs due to the presence of the acidic electrolyte.
Charging of the Leyden jars were usually carried out using electrostatic generators such
as the Hawkesbee machine.
In the early twentieth century, an improved version of the Leyden jar called the
electrophorus was invented by Volta. An ebonite (a hard plastic) is used as the dielectric
material instead of glass and sandwiched between two metal electrodes. The first
patented electrochemical capacitor based on carbon material in an aqueous electrolyte
that utilized the interfacial double-layer effect to store electrical energy, was attributed
to Becker and his employer General Electric in 1957 (Becker, 1957). In 1966,
supercapacitors became available on the market sold by SOHIO Corporation using
double layer capacitance of high surface area carbon materials and tetraalkylammonium
salt as a non-aqueous electrolyte to provide higher operating voltage (3.4 – 4.0 V) and
larger specific energy storage (Donald, 1970).

8
Conway and co-workers developed a different type of capacitor based on
pseudocapacitance in 1975 through the efforts at the Continental Group and the Hooker
Corporation based on transition metal oxides such as RuO2. These pseudocapacitors
relied on an electrochemical reaction for charge storage similar to batteries; however,
they were able to mimic the response behavior of traditional capacitors with high degree
of reversibility (Conway, 1999). The major types of supercapacitors and their charge
storage mechanisms are presented later in this chapter.
2.2 Working Principle of Supercapacitors
Supercapacitors can be classified into two categories based on their capacitive
behavior: the electric double layer capacitors (EDLC) and pseudocapacitors. EDLC
store their charges by non-Faradaic charge accumulation at the electrode/electrolyte
interface while pseudocapacitors rely on the fast and reversible surface redox processes
that take place between the electrode and electrolyte. Depending on the nature of the
electrode material, supercapacitors can sometimes store energy using both mechanisms,
simultaneously. However, the charge storage mechanisms of EDLC and
pseudocapacitors will be discussed separately in this chapter, in order to give a better
and clearer understanding.
9
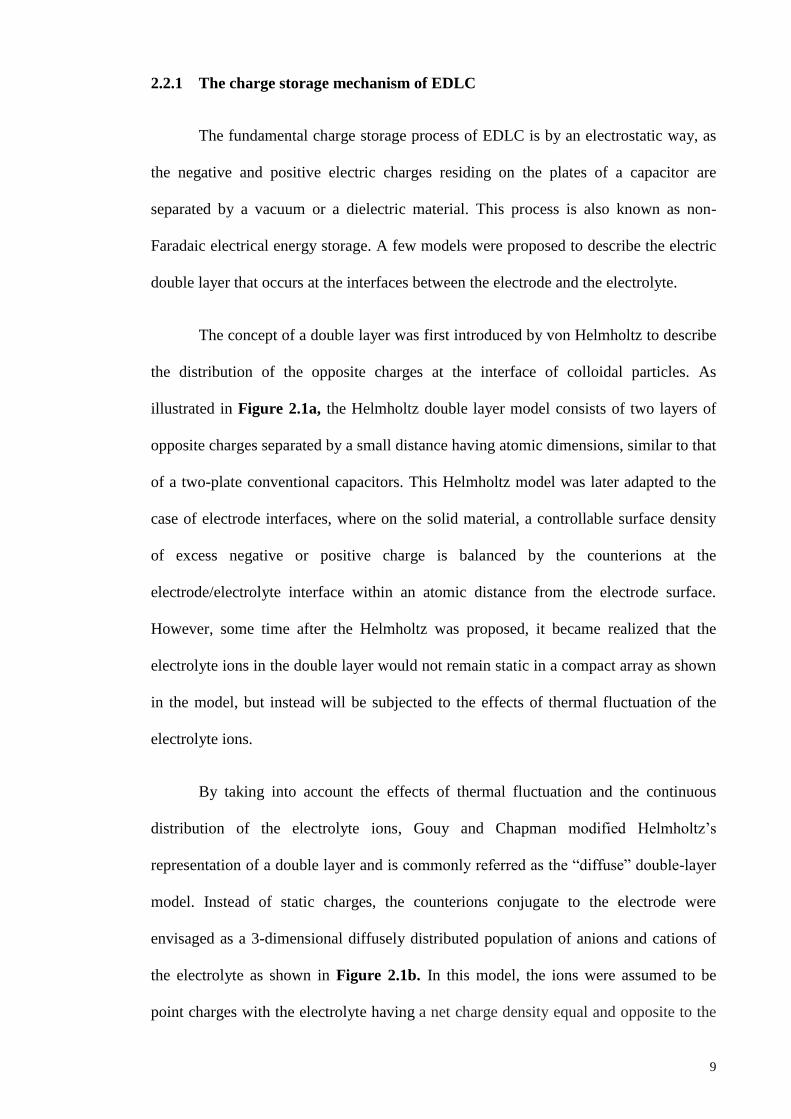
2.2.1 The charge storage mechanism of EDLC
The fundamental charge storage process of EDLC is by an electrostatic way, as
the negative and positive electric charges residing on the plates of a capacitor are
separated by a vacuum or a dielectric material. This process is also known as non-
Faradaic electrical energy storage. A few models were proposed to describe the electric
double layer that occurs at the interfaces between the electrode and the electrolyte.
The concept of a double layer was first introduced by von Helmholtz to describe
the distribution of the opposite charges at the interface of colloidal particles. As
illustrated in Figure 2.1a, the Helmholtz double layer model consists of two layers of
opposite charges separated by a small distance having atomic dimensions, similar to that
of a two-plate conventional capacitors. This Helmholtz model was later adapted to the
case of electrode interfaces, where on the solid material, a controllable surface density
of excess negative or positive charge is balanced by the counterions at the
electrode/electrolyte interface within an atomic distance from the electrode surface.
However, some time after the Helmholtz was proposed, it became realized that the
electrolyte ions in the double layer would not remain static in a compact array as shown
in the model, but instead will be subjected to the effects of thermal fluctuation of the
electrolyte ions.
By taking into account the effects of thermal fluctuation and the continuous
distribution of the electrolyte ions, Gouy and Chapman modified Helmholtz’s
representation of a double layer and is commonly referred as the “diffuse” double-layer
model. Instead of static charges, the counterions conjugate to the electrode were
envisaged as a 3-dimensional diffusely distributed population of anions and cations of
the electrolyte as shown in Figure 2.1b. In this model, the ions were assumed to be
point charges with the electrolyte having a net charge density equal and opposite to the

10
electrode surface. However, the Gouy-Chapman model leads to overestimation of the
double layer capacitance since the capacitance of two separated arrays of charges
increases inversely with their separation distance.
Figure 2.1: Models of electrical double layer at a positively charged surface: (a) the
Helmholtz model, (b) the Gouy-Chapman model, and (c) the Stern model showing the
IHP and OHP. d is the double layer distance described by Helmholtz model. ψ0 and ψ are the potentials at the electrode surface and the electrode /electrolyte interface,
respectively (Zhang & Zhao, 2009).
In 1924, Stern (Conway, 1999) overcame the overestimation of the double layer
capacitance of the diffuse layer model. Stern combined the Helmholtz model with
Gouy-Chapman model that take into account the two regions of ion distribution – the
inner region called the compact layer or Stern layer and the layer beyond the inner layer
called the diffuse layer. The stern layer is analogous to the adsorption process according
to Langmuir’s adsorption isotherm, where the ions are strongly adsorbed by the
electrode, thus the name compact layer. The inner Helmholtz plane (IHP) located in the
stern layer refers to the distance of the closest approach of specifically adsorbed ions
(ions that are in direct contact to the electrode). The outer Helmholtz plane (OHP)

11
marks the end of the inner region and beginning of the diffuse layer as shown in Figure
2.1c. The OHP refers to the non-specifically adsorbed ions is also what the Gouy and
Chapman model defines.
In this model, the ions were recognized as having finite sizes, including the
annular thickness of the hydration shell. Hence, the geometrical limit to the compact
region of the adsorption layer at the electrode can be determined easily. The overall
capacitance in the electric double layer (Cdl) can be represented as the combination of
the capacitances from the two regions, the inner region resembles to a Helmholtz type
of compact double layer capacitance (CH) and the diffuse region capacitance (Cdiff).
Thus Cdl can be expressed by the following equation:
1
𝐶𝑑𝑙=
1
𝐶𝐻 +
1
𝐶𝑑𝑖𝑓𝑓 Equation 2.1
The capacitance of two separated layers of charges increases inversely as their
separation distance as presented by the Gouy-Chapman model. This leads to large
capacitance values since the limit of infinitesimally small ions closely approaches the
electrode surface. This overestimation of the double layer capacitance is automatically
avoided by the introduction of a distance of closest approach of finite-sized ions and
thus geometrically defining a compact Helmholtz inner region. The Stern model of
double layer remained as a good basis for general interpretation of the
electrode/electrolyte interface phenomena until the detailed work of Grahame in the
1947 on the double layer capacitance.

12
2.2.2 The charge storage mechanism of Pseudocapacitors
Apart from the EDL capacitance in which the charges are stored electrostatically
(i.e., non-Faradaically), complement to this type of capacitance is the so-called
“pseudocapacitance”. The term “pseudocapacitance” is used to describe the behavior of
electrode materials that have the electrochemical signature of a capacitive electrode but
in which the charge storage originates from a completely different reaction mechanism
(Brousse et al., 2015).
Pseudocapacitance involves the passage of charge across the double layer that is
Faradaic in origin whilst capacitance of EDL comes from the charge separation in the
double layer formed at the interface between the solid electrode material and the liquid
electrolyte. Pseudocapacitance arises for thermodynamic reasons between the extent of
charge acceptance (∆q) and the change of potential (∆V) (Conway, 1999). The
following derivative is equivalent to the capacitance.
𝐶 = 𝑑(∆𝑞)
𝑑(∆𝑉) Equation 2.2
Generally, there are two types of electrochemical processes that contribute to
pseudocapacitance which include the redox reaction at the transition metal oxide’s
surface with ions from the electrolyte, and the doping and dedoping of active
conducting polymer material in the electrode. The former process is based primarily on
surface mechanism and hence it is highly dependent on the surface area of the electrode
material. The latter process involving the conducting polymer material is more of a bulk
process and much less dependent on its surface area although a relatively high surface
area is useful in the distribution of electrolyte ions to and from the electrodes in a cell
(Burke, 2000). In all cases, the electrodes must have high electronic conductivity to
distribute and collect the electron current.

13
It is now known that the about 1-5% of the capacitance of carbon-based double
layer capacitors is contributed by pseudocapacitance due to the Faradaic reactions of the
oxygen-functionalities on the surface (depending on the conditions of preparation of the
carbon material). On the other hand, pseudocapacitors will always exhibit some
electrostatic double layer capacitance component of about 5-10%, in some case even
higher, depending on the surface area of the pseudocapacitor electrode. This non-
Faradaic contribution is proportional to their electrochemically accessible interfacial
surface area (Conway, 1999).
2.3 Principles and Methods of Experimental Evaluation
During the course of development, the design of supercapacitors and
measurement of their capacitances are essential to evaluate the performance and
applicability and suitability of electrode materials. Currently, two types of electrode
configuration are generally employed to evaluate the supercapacitive properties of an
electrode material, namely, two-electrode configuration and three-electrode
configuration.
A typical two-electrode cell assembly is displayed in Figure 2.2a. The
electrodes are isolated from electrical contact by a porous separator. The separator and
electrodes are impregnated with an electrolyte, which allows ionic current to flow
between the electrodes while preventing electronic current from discharging the cell.
The drawback of this simple experiment setup is that it does not provide the
characterization of the material over a given operating potential, and rather it describes
the overall behavior of a cell. Hence, two-electrode cells are recommended for the
evaluation of cell performance approaching to the actual supercapacitors (Inagaki et al.,
2010).

14
Figure 2.2: (a) Two-electrode configuration (Stoller & Ruoff, 2010) and (b) three-
electrode configuration
A three-electrode configuration composed of a working electrode, a reference
electrode and a counter electrode as shown in Figure 2.2b. The working electrode
contains the active material being analyzed and the applied voltage potential is
referenced to a standard reference electrode. The counter electrode, also called an
auxiliary electrode, is usually a platinum wire. Commonly used reference electrodes are
silver/silver chloride (Ag/AgCl) and saturated calomel electrode (SCE). This type of
configuration is valuable for the investigation of the material’s intrinsic
electrochemistry properties such as Faradaic reactions and diffusion. Many of these vital
electrochemical properties can only be seen when the electrode material is being tested
using the three-electrode configuration. As shown in Figure 2.3, the CV of a three-
electrode cell using PANI/MWCNT as the electrode material clearly indicated the
oxidation and reduction peaks at certain potentials, however this is not observed when
the same electrode material was assembled in a two-electrode configuration (symmetric
capacitor). This isolation allows assessment of the electroactive behavior of a single

15
electrode material over many different potential windows to properly ascertain its
applicable usage. This is especially useful for evaluating the performance of a novel
supercapacitor electrode.
Electrochemical techniques such as cyclic voltammetry (CV), galvanostatic
charge/discharge (GCD) and electrochemical impedance spectroscopy (EIS) is used to
characterize and evaluate the electrochemical performance of electrode materials.
Figure 2.3: Cyclic voltammetry of PANI/MWCNT using (a) three-electrode (b) two-
electrode configuration (Khomenko et al., 2005)
2.3.1 Cyclic Voltammetry (CV)
Cyclic voltammetry is a type of potentiodynamic electrochemical measurement
and it can be used as a diagnostic tool in analyzing the potential of an electrode material.
As the name suggest, the potential is cycled between two pre-determined voltages
linearly versus time (i.e., scan rate). After the set potential is reached in a CV
experiment, the working electrode’s potential is swept in the reverse direction to return
to the initial potential. These forward and reverse sweeps may be repeated as many
times as desired. A cyclic voltammogram is displayed when the response current of
working electrode is plotted versus the applied potential.

16
The specific capacitance can be estimated using the voltammetric charge
integrated from the CV curve according to the following equation (Patil et al., 2013;
Wang & Zhitomirsky, 2011):
𝐶 = 𝑄
2𝑚∆𝑉=
1
2𝑚∆𝑉𝜈 ∫ 𝑖(𝑉) 𝑑𝑉 Equation 2.3
C is the specific capacitance in F g−1
, m is the mass of the active material in the
electrode, ∆V is the potential window and Q is the total charge that can be obtained by
the dividing the integrated area of a CV curve with the scan rate, ν.
The CV of most supercapacitors will show some deviations from the rectangular
shape. The rectangular shapes of the CV becomes more distorted at higher scan rates
due to the lesser charge mobilization per unit time of the electrolyte into the interior
surfaces of the active material, resulting in less utilization of the electrode material
compare to low scan rates. Furthermore, when an electrode material has poor electrical
conductivity, the rectangular CV curve will be distorted even more dramatically (Zhang
& Zhao, 2012). Figure 2.4 compares the degree of distortion at high scan rates. This
indicates MC30HT has better capacitive behavior and rate capability than MC60HT
(Wang et al., 2012a). The degree of distortion may provide valuable information about
the intrinsic resistance and the applicability of an electrode material.

17
Figure 2.4: CV of (a) MC30HT and (b) MC60HT at various scan rates (Wang et al.,
2012a).
2.3.2 Galvanostatic charge/discharge (GCD)
GCD, also known as chronopotentiometry, is used to measure the rate of change
of potential at an electrode measured at a constant current in which the electrode is
charged to a set potential and subsequently discharging. This experimental procedure
has been proven extremely useful as the specific capacitance, energy and power density
can be accurately calculated.
The specific capacitance of the electrode (C) can be calculated from the
discharge portion of the GCD curve by employing the equation (Long et al., 2015):
𝐶 = 𝐼∆𝑡
𝑚∆𝑉 Equation 2.4
in which I is the discharge current, ∆t is the discharge time, m is the mass of the active
material in the electrode and ∆V is the voltage after IR drop. The IR drop is a drop in
the voltage at the initial portion of the discharge curve that exhibits a sudden drop due
to the internal resistance of the electrode as shown in Figure 2.5.

18
Figure 2.5: GCD curve of an electrode.
Energy density and power density are two crucial parameters to evaluate the
capacitive performance of an electrode. The energy density reflects the amount of
energy stored to perform work, whereas the power density exhibits how quickly the
energy can be supplied. The energy density, E (W h kg−1
), and power density, P (W
kg−1
), can also be calculated from the discharge curve by the following equations (Yan
et al., 2012):
𝐸 = 1
2𝐶∆𝑉2 Equation 2.5
𝑃 = 𝐸
∆𝑡 Equation 2.6

19
2.3.3 Electrochemical Impedance Spectroscopy (EIS)
Electrochemical impedance spectroscopy is a powerful tool to evaluate the
electrochemical system of a supercapacitor and it’s useful for research and development
of new electrode materials. It can accurately measure error-free kinetic and mechanistic
information using a variety of techniques and output formats. During an impedance
measurement, a frequency response analyzer is used to impose a small amplitude of
potential in a range of fixed frequency (generally from 100 kHz to 10 mHz). The used
of the small amplitude is to ensure minimal perturbation of the electrochemical test
system, reducing errors caused by the measurement technique.
This method is especially valuable because it enables the equivalent series
resistance (ESR) of the electrode materials and the charge transfer resistance (Rct) of the
system to be separately evaluated. The Nyquist plot is used as to evaluate the phase
relation between the imaginary phase (Z”) and the real phase (Z’) of the impedances as
shown in Figure 2.6.
The first intercept of the semicircle at the real axis in the high frequency region
represents the ESR, which is attributed to the resistance of the electrolyte; the contact
resistance between the electrolyte, current collector, and active material; and the
intrinsic resistance of the active material itself (Ju et al., 2008). The Rct can be estimated
from the diameter of the semicircle. The charge transfer resistance is the resistance
between the electrode and the aqueous electrolyte, i.e., the electrode/electrolyte
interface. The key benefit of Nyquist plot is the convenience of observing the effects of
the ohmic resistance of an electrode material. The slope in the lower frequency region
relates to the capacitive behavior and the ionic diffusion of an electrode. A steeper slope
that is nearly perpendicular to the real axis (Z’) indicates good capacitive behavior and
ionic diffusion, all of which are ideal characteristics of a good electrode for
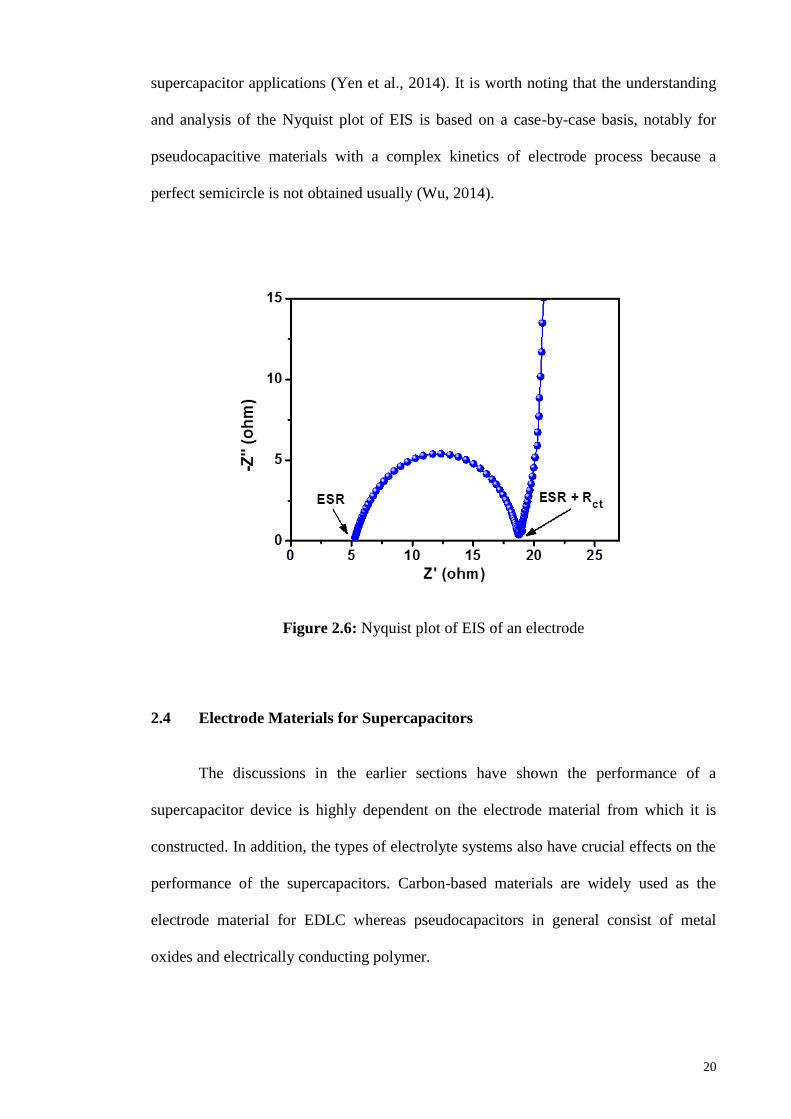
20
supercapacitor applications (Yen et al., 2014). It is worth noting that the understanding
and analysis of the Nyquist plot of EIS is based on a case-by-case basis, notably for
pseudocapacitive materials with a complex kinetics of electrode process because a
perfect semicircle is not obtained usually (Wu, 2014).
Figure 2.6: Nyquist plot of EIS of an electrode
2.4 Electrode Materials for Supercapacitors
The discussions in the earlier sections have shown the performance of a
supercapacitor device is highly dependent on the electrode material from which it is
constructed. In addition, the types of electrolyte systems also have crucial effects on the
performance of the supercapacitors. Carbon-based materials are widely used as the
electrode material for EDLC whereas pseudocapacitors in general consist of metal
oxides and electrically conducting polymer.

21
The common materials used as EDLC and the use of different electrolyte
systems will be discussed briefly in the following section. On the other hand,
pseudocapacitor materials will be introduced afterwards in a more detailed manner,
considering their relevance to the current work.
2.4.1 Carbon-based Materials as EDLC
Early researches on supercapacitors mainly involved carbon-based materials that
exhibited electrical double layer type of capacitance. The reasons for the popularity of
carbon-based materials as supercapacitors electrodes include low cost, its availability,
high temperature stability, good corrosion resistance, and established electrode
production technologies (Frackowiak, 2007; Inagaki et al., 2010).
Carbon-based materials are the most widely used commercial electrode material
for supercapacitors and they come in various forms such as activated carbon (AC),
mesoporous carbon, carbon aerogel, carbon nanotubes and graphene. These materials
exhibited high double layer capacitance by storing charges electrostatically due to their
high specific surface area (Frackowiak, 2007).
Activated carbon (AC) can be easily obtained through the pyrolysis of various
carbonaceous source such as coal (Lozano-Castelló et al., 2003), soy beans (Long et al.,
2015), watermelons (Wu et al., 2013), durian shells (Ong et al., 2012), coconut shells
(Mi et al., 2012), oil palm kernel shells (Misnon et al., 2015) and also from synthetic
polymers such as polyacrylonitrile (Ra et al., 2009), polyaniline (Yan et al., 2010) and
polypyrrole (Wei et al., 2012). The pore size of these carbon materials can be more or
less controllable depending on the type of precursor and activation processes such as
temperature, time and type of activating agent may significantly affect the

22
microporosity of the resultant carbons (Frackowiak, 2007). Two types of activation
process are generally employed to make ACs. Physical activation refers to the treatment
of a carbon precursor under high temperature (up to 1200 oC) in the presence of
oxidizing gasses such as steam, CO2 and air. Chemical activation involves an activating
agent like potassium hydroxide (Yan et al., 2010), phosphoric acid (Kim, 2004) and
zinc chloride (Ozdemir et al., 2014) to create the highly porous structure.
ACs are characterized by extremely large surface areas which range from 500 –
3000 m2 g
−1 which can positively contribute to the charge storage of an EDLC.
However, disproportion between the specific capacitance of the AC and specific surface
area is also commonly observed due to the various types of pore sizes produced by the
activation process that are namely, micropores (< 2 nm), mesopores (2 ‒ 50 nm) and
macropores (< 50 nm). For instance, an AC with a surface area of about 3000 m2 g
−1
displayed a relatively small specific capacitance of less than 10 μF cm−2
, which is
smaller than the theoretical EDL capacitance (15 – 25 μF cm−2
) (Conway, 1999). The
reason behind the disproportion is due to the fact that not all pores are electrochemically
accessible to electrolyte ions and therefore are not effective in charge accumulation
(Kierzek et al., 2004).
Micropores less than 2 nm which contributed to high specific surface area may
not be accessible to electrolyte within a short time frame as they posed increased length
for ion diffusion, limiting the ability to form a double layer. However, these micropores
can become accessible to electrolyte if a low current loading is applied as more time is
given for the electrolyte to travel into the smaller pores. On the other hand, the surface
area arising from mesopores within the size range of 3 nm to tens of nanometers allow
faster and more efficient charging/discharging as compared to micropores, hence, are
more suitable for high power supercapacitor applications because the charges can be
stored and removed faster, giving rise to higher power, although less energy can be

23
stored (Zhang et al., 2009). These imply that specific surface area is not the sole
parameter for evaluating the performance of EDLCs, other aspects of the electrode such
as pore size distribution, pore size and connectivity, electrical conductivity and surface
functionalities may significantly influence an electrode’s electrochemical performance.
Other different forms of carbon worth mentioning are carbon nanotubes (CNTs) and
graphene. Both materials have been widely studied as electrode material for
supercapacitors.
Carbon nanotubes (CNTs) can be conceptualized as seamless hollow tubes
rolled up from two-dimensional (2D) graphene sheets with diameters in the nanometer
range and lengths usually on the micron scale. They have proven themselves promising
electrode materials in energy storage due to their unique properties, such as structure
(one-dimensional geometry), high surface area, high electrical conductivity, as well as
light weight (Bordjiba et al., 2008; Zhang et al., 2008). The advantages of using CNTs
is that they form a more open porous structure due to the central hollow canal that
enables easy access of ions from electrolyte. However, because the pristine CNTs
mainly possess electric double-layer capacitance and they usually have lower surface
area (< 500 m2 g
−1) in comparison to ACs (Zhang & Zhao, 2009), their specific
capacitance is only up to 80 F g−1
(Meng et al., 2009). So they are usually modified
before use as electrode (Cherusseri & Kar, 2015; Li et al., 2004).
Graphene, another allotrope of carbon, is a single layer of carbon atoms
arranged into a 2D honeycomb lattice. Graphene has attracted the interest of researchers
because of its fascinating properties that includes: high theoretical surface area that
reaches up to 2630 m2 g
−1 for a single graphene sheet, exceptional high thermal
conductivity, superior mechanical strength, high electron mobility at room temperature
(2.5 x 105 cm
2 V
−1 s
−1), as well as its high electrical conductivity (10
6 S cm
−1) making it
an attractive candidate for use as EDLC (Allen et al., 2010; Chang & Wu, 2013; Stoller

24
et al., 2008). Graphene is a 2D building material for carbon materials of all other
dimensionalities. It can be wrapped up into 0D buckyballs, rolled into 1D carbon
nanotubes or stacked into 3D graphite as shown in Figure 2.7.
In summary, carbon-based materials with high surface area and suitable porous
structure are good candidates as electrode materials for double layer supercapacitors,
however, these materials generally have lower specific capacitance values compared to
pseudocapacitor electrode materials (Li et al., 2011). Therefore, other than being used
directly as electrode material, carbon-based materials are widely used to form composite
with pseudocapacitors to improve the electrochemical properties of the electrode.
Figure 2.7: Evolution of 2D carbon (graphene) into different building blocks of
materials; buckyball, CNTs and graphite (Geim & Novoselov, 2007).

25
2.4.2 Transition Metal Oxides
A number of transition metal oxides with various oxidation states represent a
type of attractive materials for supercapacitors owing to the outstanding structural
flexibility and the high specific capacitance. The energy storage of transition metal
oxides are predominantly based on the reversible Faradaic reaction on the surface of the
oxides in addition to some electric double-layer storage. Ruthenium oxide, manganese
oxides, nickel oxide and cobalt oxide have been investigated as electrode material for
supercapacitor applications.
2.4.2.1 Ruthenium oxide
Ruthenium oxide (RuO2) is one of the promising materials for pseudocapacitors.
It can achieve a high specific capacitance (> 700 F g−1
) in acidic electrolyte due to its
intrinsic high electrical conductivity, low ESR, fast and reversible electron transfer (Hu
et al., 2007; Pusawale et al., 2013). The electro-adsorption of protons on the surface of
RuO2 according to the Equation 2.7, where Ru oxidation states can change from (II) up
to (IV):
RuO2 + xH+ + xe
− RuO2−x(OH)x Equation 2.7
RuO2 has a broad potential window of about 1.2 V that is achieved through the
continuous proton insertion or de-insertions (Simon & Gogotsi, 2008). However, the
drawback of RuO2 is it’s high production cost expensive, toxic in nature, and requires a
strongly acidic electrolyte (Chang et al., 2008). These drawbacks have caused
researchers to search for cheaper and “greener” alternatives electrode materials.

26
2.4.2.2 Manganese oxides
Manganese oxides (MnOx) has drawn the attention of researchers because of its
great abundance in nature, low cost, high theoretical specific capacitance,
environmental friendliness, and satisfactory capacitance performance in mild
electrolytes, which have made it a promising electrode material for pseudocapacitors
(Wei et al., 2011; Zhang & Chen, 2009). The pioneering work on the pseudocapacitive
behavior of manganese oxides were reported in 1999 by Lee and Goodenough. The
manganese oxide was prepared by a co-precipitation method using potassium
permanganate and manganese acetate (Lee & Goodenough, 1999). The synthesized
manganese oxide was found to have a surface area of 303 m2 g
−1 and displayed a
specific capacitance of about 200 F g−1
. This study paves the way to use manganese
oxides as electrode materials for supercapacitor applications and received much
attention since then. The Faradaic reactions of manganese oxide can occur on the
surface and in the bulk of the electrode. The surface redox reaction involves the surface
adsorption of electrolyte cations (C+ = H
+, Li
+, Na
+, and K
+) on the manganese oxide
(Toupin et al., 2004):
(MnO2)surface + C+
+ e−
(MnOOC)surface Equation 2.8
On the other hand, Faradaic reactions the takes place in the bulk of the electrode rely on
intercalation and deintercalation of electrolyte cations (Bahloul et al., 2013):
(MnO2) + C+
+ e−
(MnOOC) Equation 2.9
As a transition metal, manganese can have various oxidation states and has a
variety of stable oxides (MnO, Mn3O4, Mn2O3, MnO2) (Wei et al., 2011). Structural
parameters such as morphology, porosity and textures, defect chemistry and particle
size play a crucial role in determining and optimizing the electrochemical performances

27
of manganese oxides. Therefore, a variety of preparation methods have been developed
to synthesize manganese oxides as supercapacitor electrodes.
Various morphologies of have been explored through a variety of synthesis
methods to improve the specific capacitance of MnO2. Microwave-assisted reflux
synthesis was used to synthesis MnO2 nanoparticles and MnO2 urchin-like
nanostructures (Zhang et al., 2013). MnO2 nanoparticles were obtained when
synthesized in neutral conditions, but when the experimental was carried out in acidic
conditions, MnO2 urchin-like nanostructures with a diameter of 1-2 μm were obtained
instead. The specific capacitances for MnO2 nanoparticles and urchin-like
nanostructures were 311 and 163 F g−1
, respectively. Cactus-like porous MnO2 have
been prepared by Dai et al. by using sodium dodecyl sulfate (SDS) as surfactant in the
hydrothermal process (Dai et al., 2015). The SDS acted as a morphology controlling
agent to produce porous MnO2 with cactus-like structure, producing a surface area of
321.9 m2 g
−1 and specific capacitance of 188 F g
−1. The porous morphologies are able to
enhance the electrochemical performance of MnO2 by providing high surface area and
providing shorter ions paths and faster charge transfer kinetics.
The main challenge posed by using MnO2 as the electrode material for
supercapacitors is the MnO2 loading, due to poor electrical conductivity of MnO2. As a
result, the specific capacitance decreases when thicker films or higher loading of MnO2
are prepared. For example, thin films of MnO2 were prepared by sol-gel method (Pang
et al., 2000). The film thickness and calcination temperature affect the specific
capacitances of the thin films. The specific capacitances of the thin films dropped from
700 to 200 F g−1
when the film thickness increased from tens of nanometers to several
micrometers, indicating only a thin layer of MnO2 was involved in the capacitive
reaction process. Zhi et al. showed that when the manganese oxide loading is low,
higher specific capacitance can be achieved (Zhi et al., 2012). The calculated specific

28
capacitance of MnO2 shell on the carbon nanofiber substrate reached 900 F g−1
at 39%
of oxide loading but when the entire mass of electrode is considered together, the
specific capacitance at the same oxide loading was only ~225 F g−1
. This was due to the
fact that when the oxide coating is too thick, it will cause part of the material to be
electrochemically inactive, jeopardizing the charge transport. Wang et al. also showed
similar findings about the relationship between mass loading and specific capacitance.
When the MnO2 loading was increased from 0.33 to 3.41 mg cm−2
, the specific
capacitance decreased linearly from 539 to 188 F g−1
(Wang et al., 2011).
The enhancement of the electrical conductivity and charge storage capability of
MnO2 have also been extensively studied. CNTs are widely used to form composites
with MnO2 due to its high surface area, high electrical conductivity and open porous
structure for enhanced electrolyte accessibility. MnO2/CNT was formed when the CNT
film electrode is immersed in ethanol (as a reducing agent) while KMnO4 solution was
added dropwise to form a thin layer of MnO2 (Li & Wei, 2012). The hybrid electrode
delivered a specific capacitance of 150 F g−1
. KMnO4 can also be reduced to MnO2 on
CNT under acidic solution, without the use of any reducing agent as showed by Wang
et al. This facile synthesis method to prepare MnO2/CNT showed a specific capacitance
of 162 F g−1
and excellent charge/discharge property with 90% capacitance retention
after 2000 cycles (Wang et al., 2011).
Similarly, graphene is also commonly used for making MnO2 composites due to
its high surface area and conductivity. For example, graphene decorated with flower-
like MnO2 nanostructures showed remarkable chemical stability and electrical
conductivity. The MnO2 nanoflowers were coated onto the graphene electrodes via
electrodeposition and gave a specific capacitance of 328 F g−1
(Cheng et al., 2011). Ge
et al. fabricated MnO2/graphene nanostructured sponges by a series of dip coating steps
(Ge et al., 2013). The sponges were firstly dipped into the graphene oxide solution and

29
then immersed into hydroiodic acid to reduce the graphene oxide. Then MnO2 were
deposited onto the sponges by dipping into a solution of manganese acetate followed by
KMnO4 solution as shown in Figure 2.8. The sponge@RGO@MnO2 composite
achieved a high specific capacitance of 450 F g−1
due the synergetic combination of
EDLC and pseudocapacitive MnO2 combined with the porous sponge framework.
Figure 2.8: Schematic illustration of the dip coating process for the synthesis of
sponge@RGO@MnO2 (Ge et al., 2013).
In short, MnO2 are attractive candidates for supercapacitors applications.
However, the high specific capacitance values (> 400 F g−1
) are mostly based on
extremely thin films and/or low oxide loading of MnO2, which can easily lead to an
overstatement of a material’s performance (Wang et al., 2011). When very minute
amounts of materials are used, the overall capacitances contributed by other cell
components such as the electrode support surface, collector and other conducting
surface might become significant and overshadow the capacitance contributed by the
active material (Stoller & Ruoff, 2010).

30
2.4.3 Electrically Conducting Polymers
The discovery of “metal-like” electrically conducting polymers (ECPs) has gave
rise to the field of electrochemical polymer science and they appear as a potent choice
as electrode material for pseudocapacitance. The energy density and capacitance of
ECPs is higher than that of EDLC composed of carbon materials because conducting
polymers can store charge not just in the electrical double layer but predominantly
through the fast Faradaic redox reactions. ECPs have several advantages over transition
metal oxides; which also come from a family of pseudocapacitors. ECPs offer fast
charge-discharge kinetics, relatively low cost compared to metal oxides and have good
intrinsic electrical conductivity (Patil et al., 2013; Ryu et al., 2002). Due to their unique
and interesting properties, a large number of recent publications have reported on the
synthesis and electrochemical properties of ECPs and their derivatives. However the
main drawback of ECPs is their poor stability during cycling when used as bulk
materials, and therefore limited cycle life. The conducting polymers films undergo
swelling, shrinking, cracking or breaking during the doping/dedoping process of
continuous charge-discharge processes and as a consequence, gradually aggravate their
conducting properties. (Frackowiak et al., 2006; Simon & Gogotsi, 2008)
The ECPs that are commonly used as pseudocapacitors are polyaniline (PANi),
polypyrrole (PPy) and polythiophene (PTh) and poly(3,4-ethylenedioxythiophene)
(PEDOT). The general structure of all ECPs consist of a regularly alternating single (C-
C) and double (C=C) bonds, forming a region of overlapping p-orbitals, bridging the
adjacent single bonds. This will allow a delocalization of π-electrons across all the
adjacent aligned p-orbitals, giving rise to a π-conjugated backbone throughout the
polymer chains. The π-conjugated backbone is responsible for the generation and
propagation of charge carriers, making the polymers intrinsically conducting. Figure
2.9 shows the chemical structures of the above mentioned ECPs.

31
Figure 2.9: Chemical structures of some most common ECPs in their neutral states. (a)
PANi, (b) PPy, (c) PTh, and (d) PEDOT

32
2.4.3.1 Polypyrrole (PPy)
Among the available ECPs, PPy is one of the most promising materials for
pseudocapacitors due to its greater degree of flexibility in preparation processes, light
weight, low cost and high electrical conductivity than most other commercially
available ECPs (Hepowit et al., 2012). Moreover, the oxidation potential is lower for
pyrrole (0.8V) than other heterocylic monomers. In fact, PPy is one of the few ECPs
that can be synthesized in aqueous solutions. The preparation of PANi requires acidic
aqueous media while PTh must be grown from organic solvents. These made PPy stood
out from the rest of the other ECPs (Ansari, 2006).
There are two commonly used polymerization techniques, chemical
polymerization and electrochemical polymerization. The main advantage of chemical
synthesis of PPy is the ease of mass production, but the PPy product is always present in
powder form. The powdered sample requires the use of insulating binder in the
fabrication of electrode that would disrupt the electron transport of the electrode and
subsequently affecting the overall performance of the electrode (Ghosh et al., 2011;
Wang et al., 2011). Electrochemical polymerization is generally preferred because it
gives cleaner polymers unlike chemical polymerization where unreacted reactants and
residues are often mixed together with the polymer. Furthermore, electrochemical
polymerization provides a better control of film thickness and morphology. The films
formed from electrochemical polymerization are generally deposited onto a supporting
electrode surface by anodic oxidation of the corresponding monomer in the presence of
an electrolyte solution. This method is also a useful technique to eliminate the use of
binders where the PPy can be directly grown on the freestanding substrate. Three
electrochemical polymerization techniques are generally employed including
potentiostatic (constant potential), galvanostatic (constant current) and potentiodynamic
(cyclic voltammetry) methods (Sadki et al., 2000).

33
2.4.3.2 PPy and PPy/carbon-based composites for supercapacitors
To increase the electrochemical performance of PPy, different morphologies of
PPy have been synthesized using either chemical or electrochemical synthesize methods.
Morphologies such as PPy clusters, nanobricks and porous films have been made with
various chemical and electrochemical methods.
Besides employing solely PPy as the electrode material for supercapacitors,
many literatures also reported on compositing PPy with carbon materials that may
synergistically enhance the performance of the PPy. Carbon materials such as carbon
fibers, carbon aerogel, CNT, and graphene have proven to increase the specific
capacitance by increasing the surface area and stability of the composite. The
performance of PPy and PPy/carbon composites are summarized in Table 2.1.
Table 2.1: Summary of a selection of PPy and PPy/carbon-based composites for
supercapacitors. Specific capacitance values are reported from three-electrode
configuration unless otherwise stated.
Material Description Specific
capacitance (F g−1
)
PPy
nanobricks
(Dubal et al.,
2011)
PPy nanobricks were synthesized by
potentiostatic electrodeposition at 0.9 V with
aqueous bath containing pyrrole and KNO3.
476
(CV at 5 mV s−1
,
electrolyte: 0.5 M
H2SO4,)
PPy films
(Muthulaksh
mi et al.,
2006)
PPy films were fabricated by galvanostatic
electrodeposition with current density of 0.36
mA cm−2
for 300 s.
354
(CV at 1 mV s−1
,
electrolyte: 1 M
KCl)

34
PPy clusters
(Dubal et al.,
2012)
Porous clusters of PPy were prepared under
potentiodynamic electrodeposition from 0 to
1.2 V under different scan rate to give different
porous morphologies. Nanobelts, nanobricks
and nanosheets have been synthesized under
scan rates of 50, 100 and 200 5 mV s−1
,
respectively.
586
(CV at 2 mV s−1
,
electrolyte: 0.5 M
H2SO4)
PPy films
(Du et al.,
2013)
Highly stable PPy films fabricated by unipolar
pulse electropolymerization method. The short
on-time pulse and low temperature showed
PPy films with reduced chain defects.
406
(CV at 5 mV s−1
,
electrolyte: 1 M
KCl)
PPy/vapor
grown
carbon fibers
(Kim et al.,
2006)
PPy layers were deposited on vapor grown
carbon fibers. The thickness of the deposited
PPy layers is controlled by the concentrations
of pyrrole used.
588
(CV at 30 mV s−1
,
electrolyte: 6 M
KOH)
PPy/carbon
aerogel
(An et al.,
2010)
PPy/carbon aerogel composite was prepared by
chemical oxidation polymerization through
ultrasound irradiation using sodium dodecyl
sulfate as the surfactant.
433
(CV at 1 mV s−1
,
electrolyte: 6 M
KOH)
PPy/CNT
(Li &
Zhitomirsky,
2013)
Pyrocatechol violet dye was used as an anionic
dopant and to increase the adhesion of
PPy/CNT films on Ni substrates.
390
(CV at 2 mV s−1
,
electrolyte: 0.5 M
Na2SO4)

35
PPy/
graphene
(Lim et al.,
2013)
One-step electrochemical for the synthesis of
PPy/graphene composite from electrolyte
solution containing pyrrole, graphene oxide
and sodium p-toluenesulfonate. The synergistic
effect between PPy and graphene enhanced the
electrochemical performance of the
nanocomposite.
300
(CV at 10 mV s−1
,
electrolyte: 1 M
Na2SO4)
2.4.3.3 PPy/MnO2 composites for supercapacitors
Another common option to increase the performance of PPy is by the
incorporation of transition metal oxides. As discussed earlier, MnO2 is transition metal
oxide that can also exhibit pseudocapacitance; hence, the composites of PPy and MnO2
are expected to have higher capacitances values than its constituents PPy and MnO2
alone as proven in many studies. PPy/MnO2 composites will be discussed more in detail
in the following review compared to previously discussed PPy/carbon composites given
their relevance to this thesis.
PPy/MnO2 composites for supercapacitors electrodes have evoked great interest
of researchers worldwide. The combination of both classes of pseudocapacitors
certainly has their advantages. The composites take advantage of the high electrical
conductivity of PPy and the high energy storage capacity of MnO2. With the elegant
synergy between both materials, remarkable electrochemical performances can be
realized.

36
Core/shell structures of PPy/MnO2 have been synthesized by few researchers
without the use surfactant or additional oxidant (Wang et al., 2014; Yao et al., 2013).
The MnO2 nanotubes were firstly synthesized via hydrothermal method, followed by in
situ polymerization of pyrrole monomers. The MnO2 nanotubes acted as both template
and oxidant to initiate the polymerization of pyrrole monomers. The core/shell structure
consist of PPy as the shell and MnO2 nanotubes as the core as shown in Figure 2.10.
The PPy/MnO2 reported by Yao et al., exhibited a specific capacitance of 380 F g−1
and
good capacitance retention of 90% of its initial capacitance after 1000 charge/discharge
cycles while Wang et al. reported a maximum of specific capacitance of 337 F g−1
, and
retained 88.8% of its initial capacitance in 1000 charge/discharge cycles as well. In both
cases, the PPy/MnO2 coaxial composites showed an enhancement of specific
capacitance from the lone MnO2 nanotubes and PPy. The synergistic effect between
MnO2 and PPy could inhibit the dissolution of MnO2 and PPy, and consequently
improving the electrochemical reversibility and stability of the composite electrode.
Figure 2.10: (a) Schematic illustration of the formation and (b) schematic charge
storage advantage of the PPy/MnO2 coaxial nanotubes (Yao et al., 2013).

37
Li et al. also prepared core/shell structures of PPy/MnO2 but with PPy nanotubes
acting as the core, in contrast to the above studies where MnO2 nanotubes were
employed as the core. PPy nanotubes were synthesized using methyl orange/FeCl3
complex as a reactive self-degraded soft-template and oxidant. The embedment of
MnO2 nanoparticles onto the walls and pore channels of the PPy nanotubes forms the
shell. The MnO2 nanoparticles on the PPy nanotubes lead to more active sites that are
susceptible to redox reaction to give a high specific capacitance of 328 F g−1
at a current
density of 3 mA cm−2
.
PPy-covered MnO2 composites have also been explored, whereby MnO2
nanoparticles are wrapped with PPy. Bahloul et al. first synthesized MnO2 nanoparticles
by hydrothermal method. The as-synthesized MnO2 powders were pressed on a graphite
current collector and was used as the working electrode for the electropolymerization of
PPy (Bahloul et al., 2013). Specific capacitances of 74 and 142 F g−1
were obtained for
MnO2 and PPy/MnO2, respectively. However, this composite electrode only retained
about 51% of its capacitance value after 500 cycles of charging/discharging, the low
capacitance retention could be either due to the detachment of the electropolymerized
PPy away from the MnO2 or the weak adhesion of the PPy/MnO2 on the graphite
current collector. Zhang et al. also produced PPy/MnO2 from similar routes except that
the wrapping of PPy on MnO2 was carried by chemical polymerization method. The
MnO2 was dispersed into a solution of pyrrole monomer with the molar ration of 1:3
followed by the addition of FeCl3 (oxidant) to obtain the composites. The calculated
specific capacitance the PPy/MnO2 composite is 353 F g−1
and retained 91.2% of its
initial capacitance after 100 charging/discharging cycles (Zhang et al., 2013).
Up to now, the discussions of PPy/MnO2 composites still requires a two-step
process. Researchers are always opting for easier synthesis methods with fewer
procedures that offer excellent potential for large-scale material production. Zang & Li

38
have demonstrated a facile, one-step, and in situ co-precipitation approach to
synthesizing ultrafine β‒MnO2/PPy nanorod composite (Zang & Li, 2011). KMnO4
acted as an oxidizing agent to oxidize the pyrrole monomers to PPy; at the same time
the Mn7+
ions from KMnO4 was reduced to Mn4+
ions in the form of MnO2. Although
β‒MnO2 has been regarded as the undesirable candidate for supercapacitor applications,
the β‒MnO2/PPy nanocomposite still exhibited fairly high specific capacitance of 340 F
g−1
. The key is the size of the ultrafine β‒MnO2 particles (< 10 nm in diameter) that
behaves differently at the nanoscale level. The ultrafine β‒MnO2 particles were
achieved with the aid of PPy, which sheathed the β‒MnO2 crystal, effectively prevented
it from further growing.
Sharma et al. have also fabricated PPy/MnO2 nanocomposites via a one-step
electrodeposition under constant current (Sharma et al., 2008a). The nanocomposites
were formed from a deposition bath containing MnSO4, H2SO4 and pyrrole monomer.
The electrodeposition process involves the simultaneously process of the
electropolymerization of PPy and the anodic oxidative deposition of Mn2+
to Mn4+
(MnO2). The porous PPy matrix provides high surface area for the dispersion of MnO2
nanoparticles. On the other hand, the MnO2 nanoparticles nucleated over the polymer
chains enhanced the conductivity and stability of the nanocomposite material by
interlinking the PPy polymer chains. The PPy/MnO2 nanocomposite thin film electrodes
show significant improvement with specific capacitance of 620 F g−1
in comparison
with its constituents PPy (250 F g−1
) and MnO2 (255 F g−1
). The PPy/MnO2 was also
made into supercapacitor device (two-electrode configuration) and gave a specific
capacitance of 180 F g−1
and retained 90% of its initial capacitance after 5000
charging/discharging cycles.

39
Table 2.2: Specific capacitance of a selection of PPy/MnO2 composites reported in the
literature. Specific capacitance values are reported from three-electrode configuration
unless otherwise stated.
Reference Comments
Specific
capacitance
(F g−1
)
Electrolyte
(Yao et al.,
2013)
Coaxial nanotubes, MnO2 nanotubes
as core and PPy as shell. Surface
morphologies can be varied by altering
the concentrations of H2SO4.
380
(CV at
1 mV s−1
)
1 M
Na2SO4
(Wang et al.,
2014)
Coaxial nanotubes, MnO2 nanotubes
as core and PPy as shell.
337
(GCD at
0.5 A g−1
)
2 M KCl
(Li et al.,
2010)
Coaxial nanotubes, with PPy
nanotubes as core and MnO2
nanoparticles as shell. Methyl
orange/FeCl3 complex acted as a
reactive self-degraded soft-template
and oxidant.
328
(GCD at
3 mA cm−2
)
1 M KCl
(Bahloul et
al., 2013)
MnO2 nanoparticles wrapped with
PPy. PPy was electropolymerized at
0.9 V vs SCE.
142
(GCD at
2 mA cm−2
)
1 M
Na2SO4
(Zhang et al.,
2013)
MnO2 nanoparticles wrapped with
PPy. PPy was formed via chemical
polymerization using FeCl3 as oxidant.
353
(GCD at
8 mA cm−2
)
0.5 M
Na2SO4
(Zang & Li,
2011)
One-step, in situ synthesis of ultrafine
β‒MnO2/PPy nanorod composite. The
insoluble PPy hinder the further
340
(GCD at
0.2 A g−1
)
1 M
Na2SO4

40
crystal growth of β‒MnO2.
(Sharma et
al., 2008a)
One-step electrodeposition of
PPy/MnO2. PPy was used as support
for MnO2 to grow whilst MnO2
improved the chain structure and
stability of the PPy.
620
(CV at
5 mV s−1
)
180
(GCD at
2 mA cm−2
,
two-electrode
setup)
0.5 M
Na2SO4
2.4.3.4 PPy/Chitosan composites
At the moment, no previous works done on PPy/CS composite for
supercapacitor applications. The closest work to supercapacitor applications have been
conducted by Yalçınkaya et al. where they reported the electrochemical synthesis of
PPy/CS composite with improved thermal stability. Electrochemical measurements
including CV have shown that the PPy/CS composite is very stable and extremely
electroactive. However, this study was limited to the synthesis and characterization of
the PPy/CS composite without any application studies (Yalçınkaya et al., 2010).
There have been many reported works on PPy/CS for various applications which
worth mentioning. PPy/CS composite fibers were fabricated by Liu et al. through the
polymerization of pyrrole on CS fibers, in which CS fibers were pre-synthesized via wet
spinning method (Liu et al., 2015). An interesting work done by Qi et al. show that the
PPy/CS conductive composite supported cell adhesion, spreading, and significantly
enhanced the proliferation of olfactory ensheathing cells with or without electrical
stimulation. These findings highlight the possibility of enhancing nerve regeneration in

41
conductive scaffolds (Qi et al., 2013). Lee et al. have reported the formation of
suspensible PPy/CS membranes in diluted acetic acid solutions produced by the
chemical polymerization of pyrrole in CS solution using ammonium persulfate as the
oxidation. The antioxidant properties of these membranes were found renewable by
means of electrochemical cycling (Lee et al., 2013).
2.5 Modifications of Electrode Material
Increasing the electrical conductivity of electrode materials is often desirable to
boost the electrochemical performances. Combining pseudocapacitor materials with
carbon-based materials such as CNT and graphene can contribute to the double layer
capacitance and at the same time improves the electrical conductivity of the electrode
materials as discussed previously. Alternatively, silver (Ag) metal is also used to boost
the electrical conductivity of electrode materials. The introduction of highly conductive
Ag into various electrode materials does not only enhances the conductivity, but also
the thermal, optical, mechanical properties resulting in a new class of important
materials suitable for various applications (Dhibar & Das, 2014).
MnO2 nanowire/Ag nanocomposites were prepared Dao et al. The Ag
nanoparticles were acquired on the MnO2 nanowires by reducing Ag+ with sodium
borohydrate (Dai et al., 2014). The role of Ag nanoparticles improved the electrical
conductivity and also the structural stability of the nanocomposite. As a result, high
specific capacitance of 396 F g−1
was measured with 95.2% of capacitance retention
over 2000 charge/discharge cycles. Zhi et al. had synthesized a highly conductive
ordered mesoporous carbon (OMC) based electrode decorated by 3D graphene and 1D
Ag nanowire (Zhi et al., 2014). The novel architecture of Ag/Graphene/OMC exhibited
ultra high electrical conductivity up to 741 S cm−1
. The material was assembled into a

42
symmetric supercapacitor (two-electrode configuration) and yielded a specific
capacitance of 213 F g−1
, which is higher than that of graphene/OMC (139 F g−1
) and
pristine OMC (36 F g−1
). The exceptionally high electrical conductivity served as a
highway for electron transfer resulting in good electrochemical performance of the
material.
Ag nanoparticles-decorated PANi/CNT was fabricated via a typical in situ
chemical polymerization (Dhibar & Das, 2014). The nanocomposite showed increased
electrical conductivity and a specific capacitance of 528 F g−1
. The nanocomposite also
showed better thermal stability up to 350 oC. Patil et al. synthesized PPy/polyacrylic
acid (PAA)/Ag composite for supercapacitor application (Patil et al., 2013). The
PPy/PAA/Ag thin films were obtained by immersing the stainless steel substrates into a
solution mixture of PPy, PAA and silver nitrate. The highest capacitance of 226 F g−1
was obtained for the PPy/PAA/Ag composite electrode.
The hydrophilic nature of an electrode material is extremely important as the
interaction between the electrolyte and electrode material is the basis for charge storage
either electrostatically (non-Faradaic) or pseudocapacitively (Faradaic). There have
been a number of studies dedicated to study the correlation between the hydrophilicity
of an electrode material and its electrochemical properties. Erdenedelger et al.
functionalized graphene with amino acid to make graphene/PANi composites. The
embedment of PANi particles on the modified graphene is prepared efficiently in an
aqueous system due to the better dispersibility of the functionalized graphene
(Erdenedelger et al., 2014). The composite displayed improved electrochemical
performance of 290 F g−1
owing to the effective ion accessibility in an aqueous
electrolyte. Superwetting monolithic carbon has been synthesized by treatment with 5
M nitric acid (HNO3) and concentrated H2SO4. It was found that monolithic carbon
treated with HNO3 and H2SO4 yield specific capacitances of 320 and 404 F g−1
,
43
respectively, while that of untreated monolithic carbon was only 282 F g−1
. The H2SO4
treated sample had shown remarkable ability to improve protons conduction. The better
electron exchange between the acidic electrolyte and carbon electrode material was due
to the increment of proton mobility on the hydrophilic surface (Wang et al., 2012). The
hydrophilic electrode surface can also enhance the redox reaction activity of metal oxide
electrodes. Nickel oxide (NiO) thin films were electrodeposited onto stainless steel
substrate. The NiO films surface with very fine elongated particles showed hydrophilic
character due to the strong cohesive force between the water droplet and oxide of the
NiO (Navale et al., 2015). The supercapacitive performance of the NiO electrode
demonstrated a specific capacitance as high as 458 F g−1
.
2.6 Electrolytes for Supercapacitors
Electrolytes play a crucial role in determining the performance of
supercapacitors. The electrochemical and physical properties of the electrolytes are the
key factors of determining the equivalent series resistance (ESR) and the power output
of supercapacitor cells (Lust et al., 2004). In addition, the operating voltage of an
electrolyte is restricted by the decomposition potential of the electrolyte, which is
important for determining the energy density of the supercapacitor. Common electrolyte
systems for supercapacitors are separated into three types, aqueous, organic and ionic
liquid electrolytes.
2.6.1 Aqueous Electrolyte
Aqueous electrolytes are popular due to their relatively high conductivity, low
viscosity even in concentrated solutions, non-flammability and environmental
friendliness. Acidic electrolytes such as H2SO4 are used extensively for porous carbon
materials to achieve higher capacitance due to the participation of protons in the

44
pseudo-capacitive reactions for quinone groups on the surface. Similarly, alkaline
electrolytes such as KOH will be involved in the Faradaic reactions with the pyrone
functionalities on the surface of carbon materials (Andreas & Conway, 2006). Lee et al.
showed that the specific capacitance values of reduced graphene oxide (RGO) tested in
acidic and alkaline electrolytes were nearly the same (Lee et al., 2013). The specific
capacitance of RGO in 1 M H2SO4 was calculated to be 193 F g−1
whilst that in 1 M
KOH was calculated to be 207 F g−1
.
However, acidic electrolytes cannot be used for manganese oxides (MnOx)
based materials due to the dissolution of MnOx in acidic solutions (Cuentas-Gallegos &
Gómez-Romero, 2005). Neutral electrolytes such as potassium chloride, sodium
chloride and sodium sulfate are commonly used for MnOx based electrode materials. In
comparison, as electrically conducting polymers (ECPs) do not present the dissolution
problems, or the pH dependent conductivity (except for PANi); there is more flexibility
in terms of aqueous electrolyte choice for ECP systems.
The main drawback of aqueous electrolytes is their relatively narrow operating
potential range, and consequently a lower energy storage density, which is limited by
the potential window for the decomposition of water, i.e., 1.23 V. Hence, to avoid the
decomposition of an electrolyte, an operating voltage of 0.8 – 1.0 V is often employed,
resulting in low energy density.
2.6.2 Organic Electrolyte
Organic electrolytes have the merits of allowing supercapacitors to operate in
the voltage range above 2 V due to the larger decomposition potential. Therefore, much
higher energy density can be achieved for a given capacitance value. Non-aqueous

45
solvents such as acetonitrile and propylene carbonate are generally used to dissolve salts
such as tetraalkylammonium and lithium perchlorate to produce organic electrolytes
(Burke, 2007).
In general, the capacitance of activated carbons (ACs) is higher in aqueous
electrolytes (100 – 300 F g−1
) than that in organic electrolytes (< 150 F g−1
), due to the
larger size of the organic molecules. Moreover, the presence of moisture on the surface
of the electrodes is responsible for the aging of the supercapacitor electrodes whenever
organic electrolytes are used (Zhang & Zhao, 2009). The utilization of organic
electrolytes also suffers from a number of issues such as incorporation of toxic and
flammable organic solvents into supercapacitors and higher cost of electrolyte salts
(Wei et al., 2012). Also, the purity of organic solvents can be an issue as slight water
contamination (above 5 ppm) reduces the stability of voltage window significantly and
accelerates the self-discharge process (Ricketts & Ton-That, 2000; Wang et al., 2012).
As a result, strict controls in preparation process of these organic solvents are required.
However, organic electrolytes are still being used in commercial supercapacitors
because of the higher operating voltages, which offer a higher energy density (Zhang &
Zhao, 2009).
2.6.3 Ionic Liquid Electrolyte
Ionic liquid electrolytes, also known as ionic liquids, are low melting point
organic salts that exist as solvent free molten salt at room temperature. Since these
electrolytes do not contain volatile organic compounds but only salts, they have high
electrochemical stability that can operate up to 3 V (Frackowiak, 2007; Zhang & Zhao,
2009). Therefore, high energy density supercapacitors are achievable with the used of
ionic electrolytes. Other attractive features of ionic electrolytes are high thermal
46
stability, non-flammability and very low vapor pressure. The disadvantages posed by
utilization of ionic liquids are similar to that of using organic electrolyte; as they are
usually less conducting and more viscous than aqueous electrolytes, which significantly
hinders their penetration into the electrode structure and aggravates charge propagation
(Fic et al., 2012).
2.7 Applications for Supercapacitors
2.7.1 Transportation
One vital application of supercapacitors is in regenerative brake systems that are
often used in hybrid electric vehicles. Energy storage in transportation involves not only
the propulsion (starting and stopping) of vehicles, but also secondary power
requirements such as cruising power requirements of vehicles (Douglas & Pillay, 2005).
In conventional brake system, brake pads produce friction with the brake rotor to slow
or stop the vehicle, turning kinetic energy to heat. However, with the regenerative brake
system, the vehicle’s electric motor will enter a reverse mode upon braking, causing it
to run backwards, and thus slowing the car’s wheel. While running backwards, the
motor will act as an electric generator, producing electricity which is transferred to the
capacitor for storage. The electric energy stored is used to propel the vehicle or motor
assistance mode, increasing the fuel efficiency of vehicles. Figure 2.11 shows the
mechanism of the regenerative brake system used by Mazda®, labelled as ‘i-ELOOP’
(intelligent energy loop) (http://www.mazda.com/). In real-world driving conditions
with frequent acceleration and braking, the ‘i-ELOOP’ is able to improve fuel economy
by approximately 10%.

47
Figure 2.11: Mechanism of regenerative brake system employed in Mazda®
(http://www.mazda.com/).
2.7.2 Stationary Electrical Energy Storage
Supercapacitors are useful as energy storage systems in microgrids and power
grids. A power grid is an interconnected network consisting of generating stations that
produce electrical power, high-voltage transmission lines and distribution lines to
consumers whereas a microgrid is a small-scale power grid that can operate
independently or in conjunction with the area’s main power grid. Supercapacitors are
useful in ensuring grid stability by absorbing the energy and releasing it at the right time
to prevent dropouts, especially when the power generation are from intermittent
renewable energy sources. As an increased amount of intermittent renewable energy
such as solar and wind penetrates the grid, the output becomes increasingly unstable. It
is very important to increase the reliability and efficiency of using these renewable
energy sources. By using supercapacitors, the power quality problem in distributed
power generation (e.g. voltage fluctuation) can effectively be solved (Cheng et al.,
2006). Maxwell Technologies® provides supercapacitors to address this exact issue that
are capable to fill in short-term power intermittencies and provide ramp rate control for
longer intermittencies.

48
2.7.3 Portable Power Systems
Supercapacitors have also been used as energy backup supplies in consumer
appliances. The supercapacitors are still able to provide energy to the system in the case
of power outages, where there is a brief interruption in power supply. The use of
supercapacitors is better than batteries because they can deliver much higher voltage in
a limited amount of time. Moreover, supercapacitors have longer lifetime as compared
to batteries. This means that supercapacitors do not need to be replaced regularly,
effectively reducing the cost of appliances (Lai et al., 1992). Since then, energy backup
systems for consumer electronic products are one of the biggest markets for
supercapacitors.
Batteries are generally poor at power delivery whereas supercapacitors suffer
from low energy density to sustain peak load for long periods of time. Hence, by
combining supercapacitors and batteries, their drawbacks are minimized. The use of
supercapacitors in parallel with batteries will smooth out the severe load demand of
batteries by meeting the peak power requirements, whilst the batteries supply the
average load (Kuperman & Aharon, 2011). The decreased of pulsed current drawn from
the battery results in an extended battery lifetime. This combination is particularly
useful in portable power tools where peak current demand is high. Applications of
supercapacitor can easily be found in satellite TV (TV-channel setting and clock time),
car audio systems (radio station memory), coffee machines (programmed functions),
programmable pocket calculators, camera flash and toys, etc. (Goodenough et al., 2007).
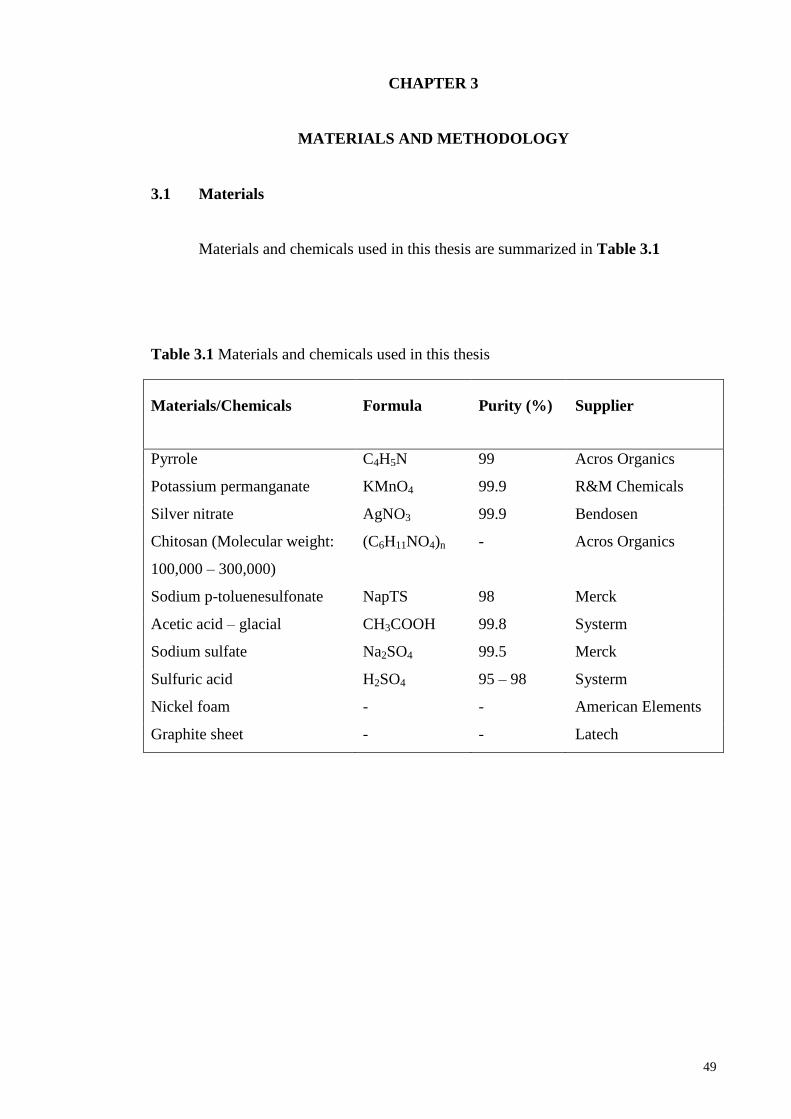
49
CHAPTER 3
MATERIALS AND METHODOLOGY
3.1 Materials
Materials and chemicals used in this thesis are summarized in Table 3.1
Table 3.1 Materials and chemicals used in this thesis
Materials/Chemicals Formula Purity (%) Supplier
Pyrrole C4H5N 99 Acros Organics
Potassium permanganate KMnO4 99.9 R&M Chemicals
Silver nitrate AgNO3 99.9 Bendosen
Chitosan (Molecular weight:
100,000 – 300,000)
(C6H11NO4)n - Acros Organics
Sodium p-toluenesulfonate NapTS 98 Merck
Acetic acid – glacial CH3COOH 99.8 Systerm
Sodium sulfate Na2SO4 99.5 Merck
Sulfuric acid H2SO4 95 – 98 Systerm
Nickel foam - - American Elements
Graphite sheet - - Latech
50
3.2 Synthesis method
3.2.1 Synthesis of PPy/MnO2 nanocomposites
The PPy/MnO2 nanocomposites were prepared by the in-situ reaction between pyrrole
and KMnO4 in different pH solutions. First, pyrrole monomer (0.21 mL) was dissolved
in 20 mL of 0.15 M NapTS. The pH of the solution was adjusted using H2SO4 to the
desired pH value. Then, 10 mL of 0.03 M KMnO4 solution was added to the above
solution to obtain the final concentrations of 0.1 M pyrrole, 0.1 M NapTS and 0.01 M
KMnO4. The mixture was stirred vigorously for 60 min under ambient conditions.
Finally, the PPy/MnO2 nanocomposite was centrifuged, washed with deionized (DI)
water, and dried in an oven at 60 °C.
3.2.2 Synthesis of PPy/CS composite electrodes
The PPy/CS electrodes were prepared by electrochemical polymerization. Briefly,
different amounts of CS powder were dissolved in 20 mL of 1% acetic acid to obtain
the CS solutions. Then, 10 mL of 0.3 M of pyrrole and NapTS in 1% acetic acid were
added into the CS solution, to make up a deposition solution that consisted of 0.1 M of
pyrrole, 0.1 M of NapTS and different amounts of CS content (0.5, 0.625, 0.75, 0.875,
1.0 wt%). A piece of graphite sheet (2 x 1 cm) was immersed into the deposition
solution and the PPy/CS was deposited at a constant bias of +0.8 V. All potentials were
referenced to a saturated calomel electrode (SCE) and a platinum wire was used as the
auxiliary electrode. The deposition was stopped when the accumulated charge reaches 4
C and the sample-coated electrodes were rinsed with water to ensure removal of
unbound materials. The mass of the deposited material was in the range of 2.0-2.4 mg.
The as-prepared electrodes were denoted as PPy/CS-x, where x depicts the weight

51
percentage of the CS used in the deposition solution. When only PPy/CS is mentioned,
it is prepared at 0.75 wt%.
3.2.3 Synthesis of Ag@PPy nanocomposites
The Ag@PPy nanocomposites were prepared by the in-situ reaction between pyrrole
and AgNO3 followed by electrochemical polymerization from an aqueous solution
placed in a one-compartment cell. The deposition solution that contained 0.1 M pyrrole,
0.1 M NapTS and 0.05 M AgNO3, was stirred vigorously for 5 min to allow the redox
reaction between the pyrrole and Ag+. A piece of graphite sheet (1 x 1 cm) was then
immersed into the deposition solution and the Ag@PPy was deposited at a constant
potential of +0.8 V. All the potentials were referenced to a saturated calomel electrode
(SCE) and a platinum wire was used as the auxiliary electrode. The deposition was
stopped when the accumulated charge reaches 4 C with a mass loading of ~2.3 mg. The
as-prepared electrodes were denoted as xM-Ag@PPy, where x depicts the concentration
of the AgNO3 used. When only Ag@PPy is mentioned, it is prepared at 0.05 M.
3.2.4 Synthesis of Ag@PPy/CS composite electrode
The Ag@PPy/CS nanocomposite electrode was electrochemically deposited from an
aqueous solution placed in a one-compartment cell. The deposition solution contained
0.1 M NapTS, 0.1 M pyrrole, 0.05 M AgNO3 and 0.75 wt% CS. Prior to
electrodeposition, the deposition solution was stirred for 5 min to allow the redox
reaction between the pyrrole and Ag+. A piece of graphite sheet (2 x 1 cm) was used as
the substrate for the deposition of Ag@PPy/CS Electrodeposition was carried out at a
potential of +0.8 V until the total accumulated charge reaches 4 C. All potentials were

52
referenced to a saturated calomel electrode (SCE) and a platinum wire was used as the
auxiliary electrode. Then, the as-synthesized electrodes were rinsed with water to ensure
removal of unbound materials. For comparison, PPy, Ag@PPy and PPy/CS electrodes
were also prepared. The mass of the deposited material was in the range of 2.0-2.4 mg
3.3 Characterization techniques
3.3.1 X-ray diffraction (XRD)
X-ray diffraction (XRD) takes advantages of the coherent scattering of x-ray of
crystalline materials to acquire a wide range of crystallographic information. The
samples in this work were analysed using XRD (Siemens D5000) with monochromatic
Cu Kα radiation (λ = 1.5406 Å) operated at 40 kV and 40 mA with a scanning speed of
0.02 degrees s−1
, scanning from 5-80o. The atomic structure was analysed using the
PANanalytical X’pert Highscore software.
3.3.2 Fourier transform infrared spectroscopy (FT-IR)
A FT-IR is a technique employed to identify the types of chemical bonds
(functional groups) in a molecule by producing an infrared absorption spectrum. In
infrared spectroscopy, infrared radiation is passed through a sample and some of the
infrared spectrum is absorbed by the chemical bonds and some of it is transmitted. The
resulting spectrum represents the molecular absorption and transmission, creating a
molecular fingerprint of the sample. In this work, infrared absorption spectrum was
recorded on a Perkin-Elmer FTIR spectroscopy 1725x.
53
3.3.3 Raman spectroscopy
Raman spectroscopy is a spectroscopic technique that relies on the inelastic
scattering (Raman scattering) of monochromatic light (from laser source) interacting
with a sample. Photons from the laser light are absorbed and then re-emitted by a
sample. The reemitted photons are shifted up or down (Raman shift) in comparison with
the original monochromatic frequency thus providing useful information about
vibrational, rotational and other low frequency transition in the molecules. Raman is
commonly employed in assessing molecular motion and fingerprint of species. In this
thesis, Raman spectra were recorded using a Renishaw inVia Raman microscope with
green laser excitation (514 nm). The measurements were scanned from in the range of
800 ‒2000 cm−1
. The peaks obtained from the spectrum will give the information about
the molecular structure of the sample.
3.3.4 X-ray photoelectron spectroscopy
X-ray photoelectron spectroscopy (XPS) is used to measure the elemental
composition, chemical stoichiometry, chemical state and electronic state on the element
that presence in the samples. X-ray is used as the light source for the excitement of the
electrons that bond in the inner core-level orbitals. The bonding energy of the
photoelectrons will provide the information of material where the electron is escaped. In
this study, XPS measurements were performed using synchrotron radiation from
beamline no. 3.2 at the Synchrotron Light Research Institute, Thailand.

54
3.3.5 Surface area analysis
The surface area is measured by N2 adsorption analysis, in which the sample is
exposed to N2 gas of different pressures at a given temperature. The increment of
pressure results in increased amount of N2 molecules adsorbed on the surface of the
sample to obtain an adsorption isotherm. When the pressure is systematically decreased
to induce desorption of the adsorbed N2 molecules, a desorption isotherm is obtained.
The analysis of the adsorption and desorption isotherms in combination with some
physical models yields information about the pore structure of the sample such as
surface area, pore volume, pore size and surface nature. The N2 sorption/desorption was
carried out at a Micromeritics TrisStar II 3020 analyzer. The sample was degassed at
130 ºC for 5 h in vacuum before the measurement. Specific surface area was determined
by using the Brunauer-Emmett-Teller (BET) model. The pore volume and pore size
distributions were obtained using the Barrett-Joyner-Halenda (BJH) method.
3.3.6 Contact Angle Measurement
The contact angle is a quantitative measure of wetting of a solid by a liquid. The
contact angle is defined as the angle formed by a liquid at the three-phase boundary
where a liquid, gas and solid intersect. In this thesis the liquid used is water and the
contact angles were measured on a goniometer (Dataphysics, OCA, 15EC). The droplet
volume was controlled constantly at 1 μL for each drop. A low contact angle values
indicate that the liquid speared on the solid surface whilst high contact angle values
show poor spreading. It is said that the liquid wets the surface if the contact angle is
below 90o, zero contact angle indicates complete wetting. The surface is said to be non-
wetting with the liquid if the contact angle is greater than 90o.

55
3.3.7 Electron Microscopy
The morphologies of the prepared samples were examined using a field emission
scanning electron microscopy (FESEM, FEI Quanta SEM Model 400F). High
resolution transmission electron microscopy (HRTEM) was carried out using JEOL
JEM2100-F.
3.4 Evaluation of Electrochemical Properties
Electrochemical measurements of the sample including cyclic voltammetry (CV),
galvanostatic charge/discharge (GCD) and electrochemical impedance spectroscopy
(EIS) were measured using Gamry Reference 600 at room temperature. Electrochemical
measurements were firstly conducted with a three-electrode setup, in which a saturated
calomel electrode (SCE) was used as reference electrode, platinum wire as counter
electrode and the synthesized nanocomposite as working electrode, respectively. For
two-electrode setups, symmetric supercapacitors were built using a Teflon Swagelok®
construction with two equal as-synthesized nanocomposite electrodes. A filter paper
soaked in electrolyte was used as separator.
1.0 M sulphuric acid (H2SO4) was used as the electrolyte for the electrochemical
measurements of PPy/CS, Ag@PPy and Ag@PPy/CS. As for the electrochemical
measurements of PPy/MnO2, 0.5 M sodium sulphate (Na2SO4) was used as the
electrolyte instead of H2SO4 as acidic electrolytes would cause the dissolution of MnO2.

56
3.4.1 Cyclic Voltammetry (CV)
Cyclic voltammetry (CV) is a useful technique to determine the potential of the
electrode being studied. The experimental procedure involves potential cycling between
two pre-determined voltage at a constant sweep rate and the current response is
recorded. The cycling is repeated using different sweep rate to access the electrode
material under high as well as low scan rates. The scan rates were varied from 5 to 100
mV s−1
.
3.4.2 Galvanostatic charge/discharge
The specific capacitances of the samples were calculated galvanostatic
charge/discharge (GCD) curves using Equation 2.4. A GCD test is able to simulate a
realistic workload of a supercapacitor. Therefore, in this work, the GCD test was used to
calculate the specific capacitances, evaluate the life cycling stability, energy and power
density of the electrodes.
3.4.3 Electrochemical impedance spectroscopy
Electrochemical impedance spectroscopy (EIS) provides a convenient way to
access the frequency response characteristics of electrode materials, especially the
equivalent series resistance (ESR) and the charge transfer resistance (Rct) values. The
EIS was carried out in the frequency range between 100 kHz and 0.1 Hz with
perturbation amplitude of 5 mV versus the open-circuit potential.
57
CHAPTER 4
EFFECT OF pH ON MORPHOLOGY AND SUPERCAPACITIVE
PROPERTIES OF POLYPYRROLE/MANGANESE OXIDE
NANOCOMPOSITE
4.1 Introduction
Supercapacitors, also known as electrochemical capacitors or ultracapacitors,
bridge the critical performance gap between the current alternatives of conventional
capacitors and batteries. Supercapacitors offer a higher power density than batteries and
a higher energy density than conventional capacitors (You et al., 2014). Hence,
supercapacitors have attracted great attention as fast charging and discharging energy
storage devices. They have an expanding array of applications, including starters, power
back-up systems, hybrid electrical vehicles, and portable electronics (Calvo et al., 2013;
Zhang et al., 2012).
Supercapacitors can be classified into two categories based on their operating
mechanisms: electric double layer capacitors (EDLC) and pseudocapacitors. The charge
storage mechanism of an EDLC is based on non-faradic charge separation at the
electrode/electrolyte interface. On the other hand, pseudocapacitors are based on the
faradic redox reaction that occurs at the surface of the active material of the electrodes.
Recently, much attention has been focused on developing efficient materials for
pseudocapacitors because they generally have higher capacitance values than carbon-
based materials.
58
Various transition metal oxides such as RuO2 (Hu et al., 2004), MnO2 (Wang et
al., 2011) , Co3O4 (Jagadale et al., 2014), NiO (Cheng et al., 2013), TiO2 (Lu et al.,
2012), and V2O5 (Kim et al., 2012) have been reported to be suitable electrode
materials for supercapacitors. Although hydrated RuO2 has a high specific capacitance
(>700 F g-1), it is very expensive, toxic in nature, and requires a strongly acidic
electrolyte (Chang et al., 2008). These drawbacks caused researchers to search for
cheaper and “greener” alternatives as electrode materials. MnO2 has drawn the attention
of researchers because of its great abundance in nature, low cost, high theoretical
specific capacitance, environmental friendliness, and satisfactory capacitance
performance in mild electrolytes (Wei et al., 2011; Zhang & Chen, 2009), which have
made it a promising material for pseudocapacitors. However, manganese oxides have
intrinsically poor electrical conductivity, which reduces the charge transfer reaction
kinetics, while their dense morphologies would cause difficulty in the penetration of
electrolyte into the bulk of the oxide material. In order to improve high-performance
supercapacitors, it would therefore be rational to improve the electrical conductivity
such as compositing with carbonaceous materials (Chen et al., 2010; Sawangphruk et al.,
2013), and conducting polymers (Huo et al., 2014; Li et al., 2010; Yao et al., 2013).
Another effective way is by making nanomaterials with porous morphologies (Dai et al.,
2015; Zhang et al., 2009). Porous structures are able to provide high surface area to
volume ratio, providing shorter ions diffusion path and faster charger transfer kinetics.
Several studies have combined both MnO2 and PPy for supercapacitor
applications. For instance, the preparation of PPy/MnO2 composite supported on
multiwall carbon nanotube pre-dispersed in poly(4-styrenesulfonic acid) (Sharma et al.,
2010). Li et al. synthesized one-dimensional nanostructured PPy/MnO2 composite using
complex of methyl orange and FeCl3 as a reactive and self-degraded soft-template (Li et
al., 2010). Also, PPy/MnO2 coaxial nanotube has been prepared by using pre-prepared

59
MnO2 nanotubes as reactive templates (Yao et al., 2013). Although all these attempts
have shown some improvements in the better utilization of MnO2, more substantial
improvements still have to be made to improve the electrochemical property using
simple and green preparation method as well as low fabrication cost for its successful
commercialization.
In the present study, we successfully developed a green, one-step and facile
synthesis method to prepare PPy/MnO2 nanocomposites without any surfactant. Herein,
we report for the first time the tunable morphologies made possible by varying the pH
conditions of the reaction’s medium. The effect of pH on the electrochemical properties
was also investigated. Three- and two-electrode configurations were used to study the
electrochemical performance of the porous PPy/MnO2 nanocomposite.
4.2 Results and Discussion
4.2.1 FTIR and Raman analysis
In this study, the formation of the PPy/MnO2 nanocomposite took place via the
facile in-situ redox reaction of KMnO4 and pyrrole, in which Mn7+
was reduced to Mn4+
and pyrrole was oxidized to polypyrrole (PPy) simultaneously. Figure 4.1a shows the
FTIR spectrum of the PPy/MnO2 nanocomposite. A broad band around 3250 cm−1
and a
band at 1610 cm−1
are ascribed to the stretching vibration of the O‒H group of adsorbed
water. The peak at 1362 cm−1
can be attributed to the ring vibration of the pyrrole ring
(Zang & Li, 2011). The bands located at 1064 and 932 cm−1
are ascribed to the N‒H in-
plane deformation vibration and C‒H out-of-plane vibration, respectively, indicating the
doped state of PPy (Li et al., 2010). The observed band located at 496 cm−1
corresponds

60
to the characteristic bending vibrations of Mn‒O of [MnO6] octahedron (Abulizi et al.,
2014; Huo et al., 2014).
The Raman spectrum of PPy/MnO2 is shown in Figure 4.1b. The
nanocomposite exhibits the characteristic peaks of PPy at 1345 and 1564 cm−1
, which
are assigned to the ring stretching mode and C=C backbone stretching of PPy,
respectively (Gu et al., 2010). The peak at 640 cm−1
corresponds to the Mn‒O lattice
vibrations perpendicular to the direction of the MnO6 octahedron double chains of
MnO2 (Kumar et al., 2014).
Figure 4.1: (a) FTIR and (b) Raman spectra of PPy/MnO2 nanocomposite.
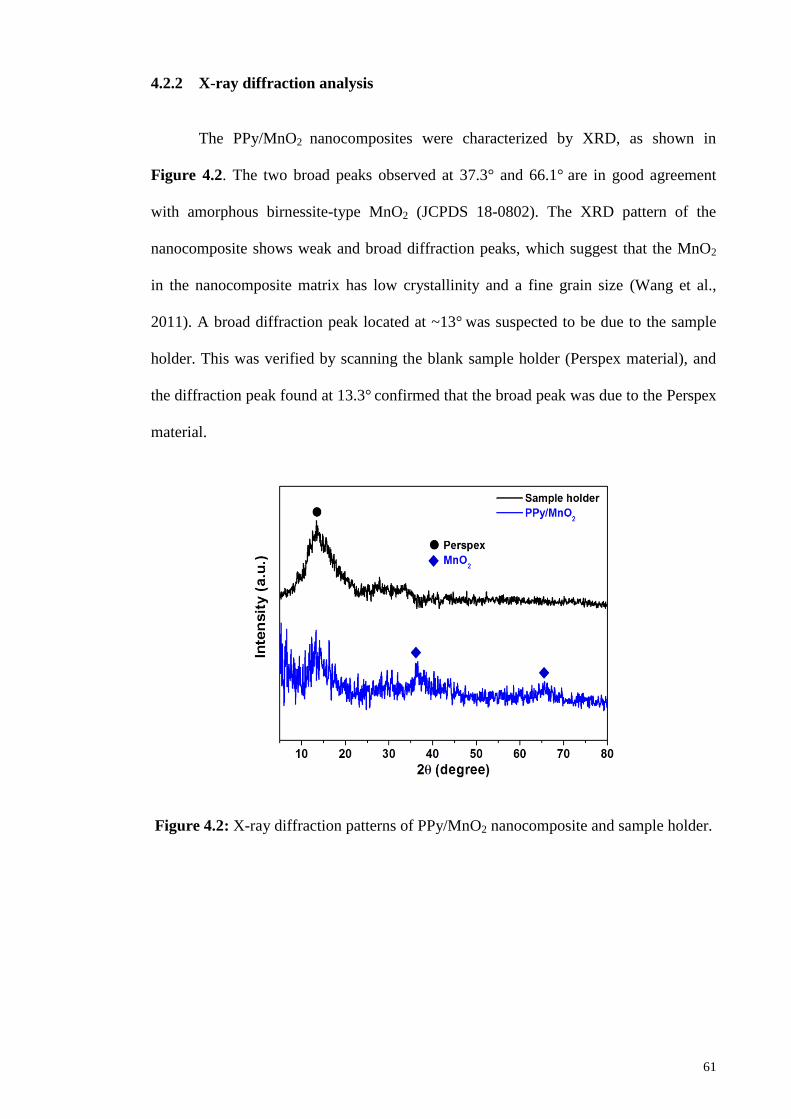
61
4.2.2 X-ray diffraction analysis
The PPy/MnO2 nanocomposites were characterized by XRD, as shown in
Figure 4.2. The two broad peaks observed at 37.3° and 66.1° are in good agreement
with amorphous birnessite-type MnO2 (JCPDS 18-0802). The XRD pattern of the
nanocomposite shows weak and broad diffraction peaks, which suggest that the MnO2
in the nanocomposite matrix has low crystallinity and a fine grain size (Wang et al.,
2011). A broad diffraction peak located at ~13° was suspected to be due to the sample
holder. This was verified by scanning the blank sample holder (Perspex material), and
the diffraction peak found at 13.3° confirmed that the broad peak was due to the Perspex
material.
Figure 4.2: X-ray diffraction patterns of PPy/MnO2 nanocomposite and sample holder.

62
4.2.3 Morphological studies
The morphologies of the PPy/MnO2 nanocomposites prepared under different
pH conditions were studied using FESEM. It was apparent that the pH had a significant
effect on the morphology of the PPy/MnO2 nanocomposite. The nanocomposite
prepared at pH 1.0 (Figure 4.3a) shows a compact, sheet-like morphology, while a
densely packed granular structure was observed when it was prepared at pH 2.0 (Figure
4.3b). Interestingly, when the pH was further increased to 4.0 (Figure 4.3c), the
PPy/MnO2 nanocomposite appeared to be highly porous in nature. At pH 5.0, as shown
in Figure 4.3d, a porous structure can still be seen, but with some randomly dispersed
composite granules within the structure. The porous structure was no longer observed
when the pH of the solution was not adjusted, which was at 7.8; an FESEM image
demonstrated a closely stacked granular morphology (Figure 4.3e). The elemental
mapping (Figure 4.3f) represents the Mn, O, and N element distributions on the surface
of the PPy/MnO2 nanocomposite prepared at pH 4.0. Although the influence of the pH
on the morphology of MnO2 has also been reported elsewhere (Abulizi et al., 2014; Ji et
al., 2012; Zhang & Mu, 2007), in this work, for the first time, we demonstrate the
preparation of PPy/MnO2 binary nanocomposites with different morphologies under the
influence of pH.

63
Figure 4.3: FESEM images of PPy/MnO2 nanocomposites synthesized at various pH
values of (a) 1.0, (b) 2.0, (c) 4.0, (d) 5.0, and (e) 7.8, and (f) elemental mapping of
PPy/MnO2 nanocomposite at pH 4.0.

64
4.2.4 Surface area analysis
The nitrogen adsorption-desorption isotherm can be used to measure the specific
surface area of a material. The typical N2 adsorption-desorption isotherm of the
PPy/MnO2 nanocomposite prepared at pH 1.0, 4.0 and 7.8 is shown in Figure 4.4a. For
the nanocomposite prepared at pH 4.0, the isotherm displayed a Type IV isotherm
according to the IUPAC classification, suggesting that the material has a mesoporous
structure (Sharma et al., 2010). At a relative pressure above 0.6, the isotherm has a
hysteresis loop, which is attributed to the capillary condensation that occurs in the
mesopores (Liang et al., 2012). The typical pore-size distribution was obtained by
means of the Barret-Joyner-Halenda (BJH) method. Figure 4.4b shows an abundance of
mesopores centered at 11.1 nm for pH 4.0. A BET study showed that the PPy/MnO2
prepared at pH 1.0, 4.0 and 7.8 had a specific surface area of 85, 230 and 173 m2
g−1
,
respectively. Furthermore, the porous PPy/MnO2 prepared at pH 4.0 showed the highest
total pore volume of 0.527 cm3 g
−1. The corresponding properties of the PPy/MnO2
nanocomposites prepared at pH 1.0, 4.0, and 7.8 are summarized in Table 4.1. The
highly porous and fibrous-liked structure of the PPy/MnO2 prepared at pH 4.0, as seen
from the FESEM, is in good agreement with the high specific surface area obtained
from the BET studies.

65
Figure 4.4: (a) N2 adsorption/desorption isotherm and (b) pore size distribution curve of
the PPy/MnO2 nanocomposite prepared at pH 1.0, 4.0 and 7.8.
Table 4.1: BET specific surface areas (SBET), total pore volumes, and average pore sizes
of PPy/MnO2 nanocomposites.
pH Types of
morphology
SBET
(m2 g
-1)
Total pore volume
(cm3 g
-1)
Average pore
size
(nm)
1.0 compact sheet 85 0.290 13.2
4.0 porous 230 0.527 8.0
7.8 granular 173 0.258 5.6
4.2.5 XPS analysis
Figure 4.5 shows the XPS spectra obtained from the porous PPy/MnO2
nanocomposite. Figure 4.5a shows the Mn 2p core level spectrum of the PPy/MnO2
nanocomposite, in which two peaks are observed at 642.3 and 654.1 eV corresponding
to the binding energies of the Mn 2p3/2 and Mn 2p1/2 core levels, respectively. The spin

66
energy separation of 11.8 eV is in good agreement with the reported data for MnO2
(Zhao et al., 2014). Figure 4.5b shows the O 1s core level spectrum of the porous
nanocomposite. Deconvolution indicates three different oxygen binding configurations,
namely an Mn-O‒Mn oxide bond at 530.5 eV, Mn‒O‒H hydroxyl bond at 531.1 eV,
and H‒O‒H residual water bond at 532.5 eV. The observed Mn‒O‒H and H‒O‒H
reveals the hydrous nature of MnO2 (Xiao et al., 2014).
Figure 4.5: XPS spectra of MnO2/PPy nanocomposite at (a) Mn 2p and (b) O 1s core
level spectra.
4.2.6 Electrochemical characterization of PPy/MnO2 nanocomposite
The electrochemical performances of the PPy/MnO2 nanocomposites prepared
under different pH conditions were evaluated using cyclic voltammetry (CV) techniques.
Their respective CV curves at a scan rate of 10 mV s−1
in 0.5 M Na2SO4 are shown in
Figure 4.6a. Among the different pH values, the PPy/MnO2 formed at pH 4.0 shows the
largest current area. Therefore, as expected from its CV curve, Figure 4.6b the specific
capacitance calculated from the GCD measurements showed the highest specific
capacitance was obtained for the PPy/MnO2 at pH 4, which was calculated to be 306 F

67
g−1
at 0.2 A g−1
. The specific capacitances calculated from the GCD measurements of
the nanocomposites against the solution pH are plotted in Figure 4.6b. When the pH of
the solution was increased from 1.0 to 4.0, the specific capacitance increased from 41 F
g−1
to a maximum of 306 F g−1
. Then, a further increase in the pH eventually led to a
decrease in specific capacitance. The KMnO4 acted as an oxidant to initiate the
oxidative polymerization of pyrrole, and its oxidizing capability could be easily
controlled by the acidity and concentration (Wang et al., 2012b). In the case of pH 1.0
and 2.0, the very low specific capacitance compared to the other pH values was due the
strong oxidizing power of the KMnO4 under a strong acidic environment. The
overoxidation of PPy causes polymer degradation and hinders the delocalization of
charge carriers in the polymer, thus reducing its electronic conductivity (Frackowiak et
al., 2006; Tallman et al., 2002). Consequently, the overall electrochemical performance
would have deteriorated. The high specific capacitance of the PPy/MnO2
nanocomposite at pH 4.0 could be attributed to its highly porous morphology, which
facilitated the diffusion and effusion of electrolyte ions. Hence, the charge transfer
kinetics was improved because of the higher surface activity. When prepared at the
optimized pH of 4.0, the growth of PPy and MnO2 occurred simultaneously to form a
porous structure, as seen from the FESEM. The moderate acidity of the reactant mixture
was sufficient for the pyrrole to polymerize without overoxidation, concurrently
improving the conductivity of MnO2 by providing a percolative path for electrolytes
ions. After the optimized pH of 4.0, the further diminution of the oxidizing power of
KMnO4 led to the formation of closely stacked granules, resulting in a lower specific
capacitance value.

68
Figure 4.6: (a) CV curves at 10 mV s−1
obtained for PPy/MnO2 nanocomposites
prepared under different pH conditions and (b) specific capacitance values for different
pH conditions calculated at current density of 0.2 A g−1
.
The influence of the scan rate on the electrochemical performance of the porous
PPy/MnO2 nanocomposite at pH 4.0 is shown in Figure 4.7a. The near-ideal
rectangular shape at the low scan rates shows the good capacitance property. At 100 mV
s−1
, the slightly distorted rectangle shape is the effect of the lower charge mobilization
per unit time. Figure 4.7b presents the galvanostatic charge/discharge curves of the
nanocomposite at various current densities, which gave a specific capacitance of 306 F
g−1
at 0.2 A g−1
. The typical triangular shape from the charge and discharge curve
suggests good charge propagation across the porous PPy/MnO2 nanocomposite. The
porous nanostructured design accounts for the increased specific surface area, which
improved the electrolyte accessibility and effectively reduced the relaxation time for the
electrode, resulting in a high electrochemical performance.
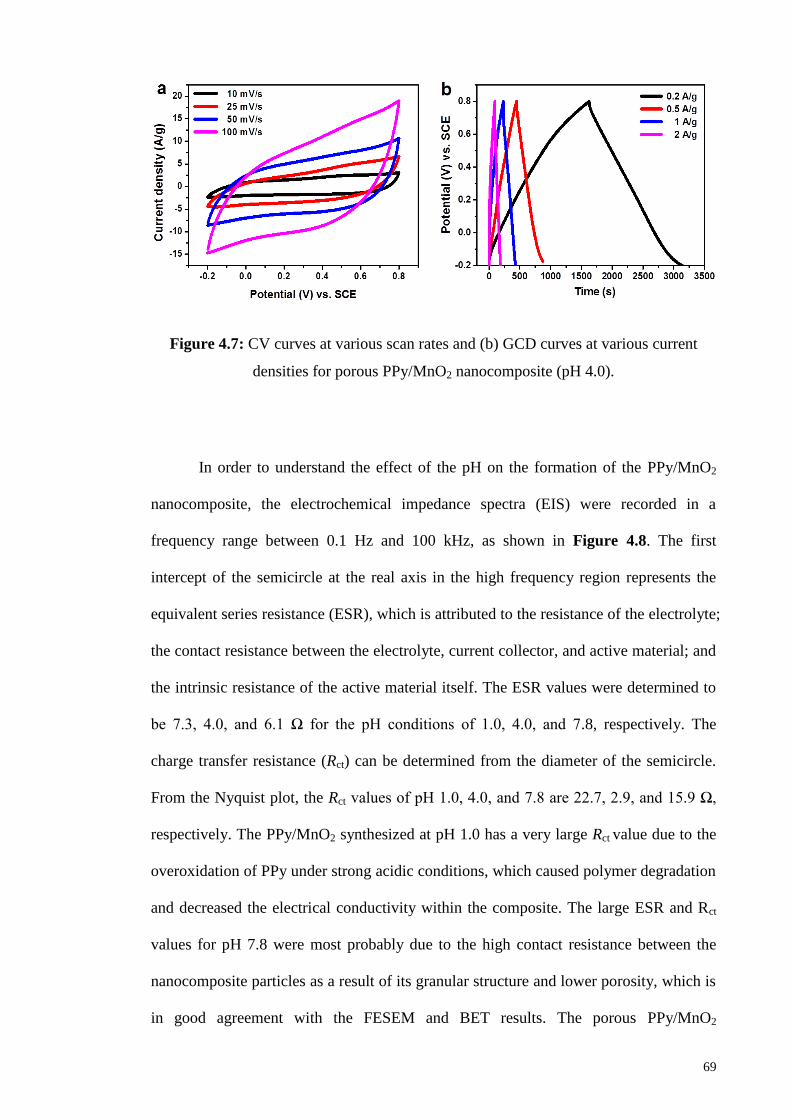
69
Figure 4.7: CV curves at various scan rates and (b) GCD curves at various current
densities for porous PPy/MnO2 nanocomposite (pH 4.0).
In order to understand the effect of the pH on the formation of the PPy/MnO2
nanocomposite, the electrochemical impedance spectra (EIS) were recorded in a
frequency range between 0.1 Hz and 100 kHz, as shown in Figure 4.8. The first
intercept of the semicircle at the real axis in the high frequency region represents the
equivalent series resistance (ESR), which is attributed to the resistance of the electrolyte;
the contact resistance between the electrolyte, current collector, and active material; and
the intrinsic resistance of the active material itself. The ESR values were determined to
be 7.3, 4.0, and 6.1 Ω for the pH conditions of 1.0, 4.0, and 7.8, respectively. The
charge transfer resistance (Rct) can be determined from the diameter of the semicircle.
From the Nyquist plot, the Rct values of pH 1.0, 4.0, and 7.8 are 22.7, 2.9, and 15.9 Ω,
respectively. The PPy/MnO2 synthesized at pH 1.0 has a very large Rct value due to the
overoxidation of PPy under strong acidic conditions, which caused polymer degradation
and decreased the electrical conductivity within the composite. The large ESR and Rct
values for pH 7.8 were most probably due to the high contact resistance between the
nanocomposite particles as a result of its granular structure and lower porosity, which is
in good agreement with the FESEM and BET results. The porous PPy/MnO2

70
nanocomposite (pH 4.0) had the lowest ESR and Rct values owing to its highly porous
morphology, which allowed an efficient penetration of the electrolyte ions, faster charge
transfer kinetics, and a good surface activity.
Figure 4.8: Nyquist plots of EIS for PPy/MnO2 nanocomposites prepared at pH 1.0
(compact sheet), 4.0 (porous), and 7.8 (granular). Inset is a magnified portion of the
PPy/MnO2 prepared at pH 4.0.
4.2.7 Supercapacitor device performance of porous PPy/MnO2 nanocomposite
We had made an attempt to fabricate a symmetric supercapacitor device to
further evaluate the electrochemical performance of the porous PPy/MnO2
nanocomposite (pH 4.0). Figure 4.9a shows the cyclic voltammograms of the
symmetric supercapacitor device, which have a rectangular shape within the potential
range of 0 to 1.0 V. The galvanostatic charge/discharge of the porous PPy/MnO2
nanocomposite is shown in Figure 4.9b. The charging and discharging reveal
symmetrical curves, signifying excellent reversibility. The specific capacitance obtained

71
from the discharging curve is calculated to be 134 F g−1
at a current density of 0.2 A g−1.
The high specific capacitance is ascribed to the good conductivity and porous structure
of the porous PPy/MnO2 nanocomposite. The mesopores favor the access of the
electrolyte ions to the active surface of the electrode, improving the charge transfer
process (Ra et al., 2009). The Ragone plot shows the dependence between the power
output and energy density of the symmetric supercapacitor device (Figure 4.9c). The
power density of the electrode decreased from 2800 to 475 W kg−1
as the energy density
increased from 3.9 to 17.0 W h kg−1
. A high power density of 2800 W kg-1
was achieved
with an energy density of 3.9 W h kg−1
.
Figure 4.9: (a) CV curves at various scan rates, (b) galvanostatic charge/discharge
curves at various current densities, and (c) Ragone plot of the symmetric supercapacitor
device.

72
In our previous study, we obtained 321 F g−1
of specific capacitance for our
MnO2-Mn2O3/graphene/PPy electrode (three-electrode system). However, such high
capacitance value is only obtainable at a very low scan rate (1 mV s−1
) (Lim et al.,
2014). The highly distorted shape of the CV curve at high scan rates showed large
performance loss, which hinders their practical applications as supercapacitor electrode.
The present study is able to achieve specific capacitance of 306 F g−1
at scan rate of 0.2
A g−1
and the CV shows quasi-rectangular shapes even at high scan rates suggest good
charge propagation across the porous PPy/MnO2 nanocomposite. In another previous
work, a symmetric supercapacitor of MnO2-Mn2O3/graphene oxide/PPy
electrodeposited on porous nickel foam substrate showed very low maximum energy
density of 6.8 W h kg−1
and a maximum power density of 469 W kg−1
(Ng et al., 2014),
in contrast to our current study which showed a maximum energy density of 17.0 W h
kg−1
and a maximum power density of 2800 W kg-1
. The study also showed a specific
capacitance of 65 F g−1
at 1 A g−1
while our present study showed a specific capacitance
of 87 F g−1
calculated at the same current density (Figure 4.10). These improvements
are essential in meeting the increasing demand for high power and energy devices.
Although the utilization of nickel foam as a substrate gave rise to porous morphologies,
the nanocomposite itself is not porous enough on a nanoscopic level; hence its low
energy and power density. In both previous studies, the electrodeposited manganese
oxide within the composite consisted of Mn3+
and Mn4+
. According to Taguchi et al.,
the conductivity of Mn2O3 involving Mn3+
is rather low as compared to that of MnO2
involving Mn4+
(Taguchi et al., 2006). This could be the reason of the low
electrochemical performances of our previous works. This present work has
successfully addressed previous shortcomings by combining the desirable MnO2 and the
synthesis of nanoscopic porous structures. This demonstrates the superiority of the
present PPy/MnO2 over our previous studies.

73
Figure 4.10: Dependence of specific capacitance values on current density for the
symmetric supercapacitor device.
Cycling stability is essential for the commercialization of supercapacitor
materials. Figure 4.11 shows the capacitance retention as a function of the cycle
number at a current density of 1 A g−1
for up to 1000 cycles. The porous PPy/MnO2
showed remarkable cycling stability and retained up to 93.2% of its initial capacitance
after 1000 charge/discharge cycles owing to its highly porous morphology that
facilitates the diffusion and effusion of electrolytes, exhibit promising characteristics as
an electrode material for high-performance supercapacitors.
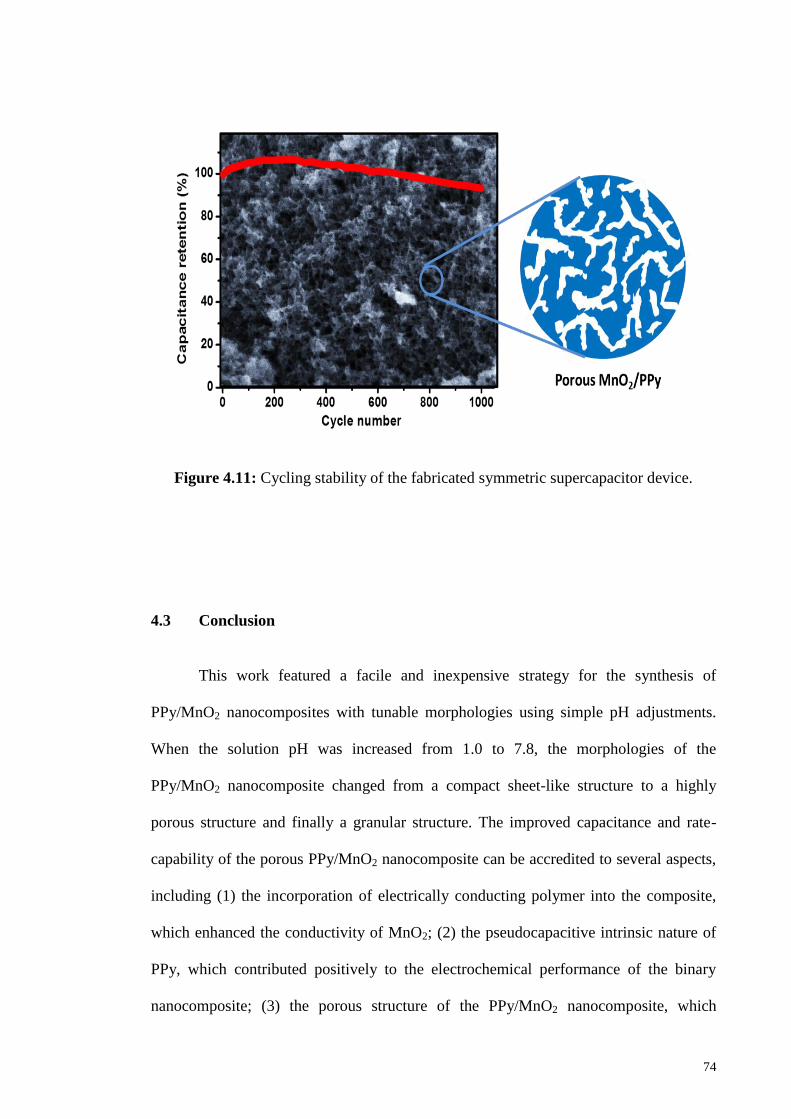
74
Figure 4.11: Cycling stability of the fabricated symmetric supercapacitor device.
4.3 Conclusion
This work featured a facile and inexpensive strategy for the synthesis of
PPy/MnO2 nanocomposites with tunable morphologies using simple pH adjustments.
When the solution pH was increased from 1.0 to 7.8, the morphologies of the
PPy/MnO2 nanocomposite changed from a compact sheet-like structure to a highly
porous structure and finally a granular structure. The improved capacitance and rate-
capability of the porous PPy/MnO2 nanocomposite can be accredited to several aspects,
including (1) the incorporation of electrically conducting polymer into the composite,
which enhanced the conductivity of MnO2; (2) the pseudocapacitive intrinsic nature of
PPy, which contributed positively to the electrochemical performance of the binary
nanocomposite; (3) the porous structure of the PPy/MnO2 nanocomposite, which

75
improved the electrolyte accessibility, improved the charge transfer kinetics, and
produced a higher surface activity on the electrode, resulting in maximum utilization of
the active materials. Benefiting from its splendid characteristics, the porous PPy/MnO2
nanocomposite was shown to exhibit a significantly improved electrochemical
performance.

76
CHAPTER 5
EXCEPTIONAL ELECTROCHEMICAL PERFORMANCE OF HYDROPHILIC
POLYPYRROLE/CHITOSAN NANOCOMPOSITE ELECTRODE FOR
SUPERCAPACITORS
5.1 Introduction
Supercapacitors or electrochemical capacitors offer a promising approach to
meet the increasing power demands of energy storage systems in the twenty first
century and they bridge the critical performance gap between the current alternatives of
conventional capacitors and batteries. Supercapacitors offer a higher power density than
batteries and a higher energy density than conventional capacitors (You et al., 2014).
Supercapacitors have a wide array of applications, including consumer electronics,
power back-up systems, starters and military defence systems (Calvo et al., 2013; Zhang
et al., 2012).
Based on the operating mechanism, supercapacitors can be classified into two
categories; electric double layer capacitors (EDLC) and pseudocapacitors. Carbon-
based materials are examples of EDLC. These carbonaceous store charges non-
Faradaically, relying on the electrostatic charge separations at the highly accessible
surface area of the electrode/electrolyte interface. Pseudocapacitors apply a completely
different charge-storage mechanism. Instead of storing charges, charges are being
transferred through the reversible faradaic redox reactions at the electrode/electrolyte
interface (Su et al., 2013). Lately, pseudocapacitors have been brought into the limelight
as they have relatively higher capacitances values than EDLC (Conway et al., 1997) and
they can be chosen from a wide array of materials that include transition metal oxides

77
(Jagadale et al., 2014; Lei et al., 2010; Pusawale et al., 2013; Ren et al., 2013) and
conducting polymers (Dubal et al., 2013; Ramya et al., 2013). Conducting polymers
stood out from the rest as they have higher charge density compared to carbon materials
and lower cost in contrast to metal oxides (Patil et al., 2013).
From an application standpoint, PPy is one of the most widely used polymers in
the research and in the industry, due to its electrochemical processing flexibility, light
weight, and high electrical conductivity than most commercially available conducting
polymers (Hepowit et al., 2012). The main drawback of conducting polymers is that it
suffer from low mechanical stability and a shorter life cycle due to phase changes and
the slow diffusion of ions within the bulk of the electrode during faradic reaction
(Snook et al., 2011). To counter this problem and to enhance the energy storage
performance, PPy has been strategically combined with carbon based materials such as
activated carbon (Keskinen et al., 2015), carbon nanotubes (Oh et al., 2008) and
graphene (Wang et al., 2012) and metal oxides like MnO2 (Bahloul et al., 2013), and
CoO (Zhou et al., 2013). Producing PPy with porous morphologies is also an effective
approach to enhance the electrochemical performance of PPy (Dubal et al., 2012;
Sharma et al., 2008b).
Chitosan (CS) is a linear hydrophilic polysaccharide derived from naturally
occurring chitin, second most abundant organic compound next to cellulose. Its unique
properties such as antimicrobial activity, biocompatibility, nontoxicity, high mechanical
strength and a susceptibility to chemical modifications have been utilized in biosensors,
water purification, would healing, and scaffolds for tissue engineering (Ayad et al.,
2014; Fusco et al., 2013; Koev et al., 2010; Sun et al., 2009; Zeng et al., 2009).
For supercapacitor applications, CS is commonly used as a polymer gel
electrolyte (Sudhakar & Selvakumar, 2012; Yamagata et al., 2013) or can be carbonized

78
to produce nitrogen-doped carbon materials (Hao et al., 2015; Ling et al., 2015; Sun et
al., 2015). However, only a handful of studies employ CS nanocomposites directly as an
electrode material for energy storage applications. Hassan et al. prepared MnO2–CS
nanocomposite via cathodic electrodeposition yielded a specific capacitance of 424 F
g−1
obtained at a current density of 1 mA cm−2
(Hassan et al., 2014). A ternary
composite of CS/ZnO/Polyaniline reached a maximum specific capacitance of 587 F g−1
at a current density of 150 mA cm−2
(Pandiselvi & Thambidurai, 2014).
In this present work, we attempt to increase the specific capacitance of PPy by
improving its hydrophilicity with CS. Studies have reported that the increased
hydrophilicity of an electrode surface can augment the supercapacitive characteristics
due to the better infiltration of the electrolyte into the framework of the electrode
(Erdenedelger et al., 2014; Navale et al., 2015; Pawar et al., 2012; Wang et al., 2012) .
The rational of this study is to incorporate the hydrophilic CS into PPy to improve the
hydrophilicity of the PPy and accordingly enhance its electrochemical capacitance as
electrode materials for supercapacitors.
The work of Yalçınkaya et al. reported the electrochemical synthesis of PPy/CS
composite with improved thermal stability. Electrochemical measurements have shown
that the PPy/CS composite is very stable and extremely electroactive (Yalçınkaya et al.,
2010). However, this study was limited to the synthesis and characterization of the
PPy/CS composite without any application studies. To the best of our knowledge, there
is no report on PPy/CS for supercapacitor applications. Herein, PPy/CS composites
prepared via a one-step anodic electrodeposition were demonstrated for the first time as
electrode material for supercapacitors. The CS content was varied to determine its effect
on the hydrophilicity and the specific capacitance. Electrochemical performances of the
PPy/CS composite electrodes were studied using three- and two-electrode
configurations.

79
5.2 Results and Discussion
5.2.1 Synthesis and formation mechanism
In this study, the PPy/CS nanocomposite electrode was formed from a
deposition mixture containing CS solution and pyrrole monomer. Even though we have
successfully electrodeposited PPy and PPy/CS nanocomposite under the positive
potential of 0.8 V, we were unable to do so for the lone CS solution. The
electrodeposition of CS from an aqueous suspension had been reported using
electrophoretic deposition method in which the deposition of CS occurs on the cathode
under high voltages between 4 to 30 V (Li et al., 2011; Sun et al., 2009), another way of
getting CS film is by applying reduction voltages (−0.1 to −1 V) to the working
electrode in a conventional three-electrode system (Zangmeister et al., 2006; Zeng et al.,
2009). Both methods take advantage of the pH dependent solubility of CS. At reducing
potentials, hydrogen evolution takes place at the surface of the cathode lead to a locally
high pH values. The CS then becomes deprotonated and is no longer soluble under basic
conditions, depositing at the electrode surface (Koev et al., 2010; Luo et al., 2005).
However, these working potentials are unsuitable for the electrodeposition pyrrole
monomers because the high voltages applied during electrophoretic deposition may
cause the overoxidation of PPy, producing unfavourable PPy films with low
conductivity. On the other hand, the pyrrole monomers are unable to polymerize under
reducing potentials. We found that the deposition of CS at low positive potentials is
only possible in the presence of pyrrole monomer. We deduce that the pyrrole
monomers were already entrapped in the CS biopolymer during the preparation of the
deposition solution due to the strong hydrogen bonds formed between them. During the
polymerization of pyrrole on the electrode surface, the pyrrole monomers with the
attached CS will be attracted to the electrode surface and propagate to form the PPy/CS

80
nanocomposite. Electrodeposition of PPy/CS nanocomposite using CV technique
scanned only at positive potentials was also reported where CS was incorporated into
the nanocomposite without deprotonation (Yalçınkaya et al., 2010). The schematic
representation in Figure 5.1 shows the attachment of pyrrole monomers onto chitosan
followed by polymerization to form the PPy/CS nanocomposite electrode.
Figure 5.1: Mechanism for the formation of PPy/CS nanocomposite electrode.
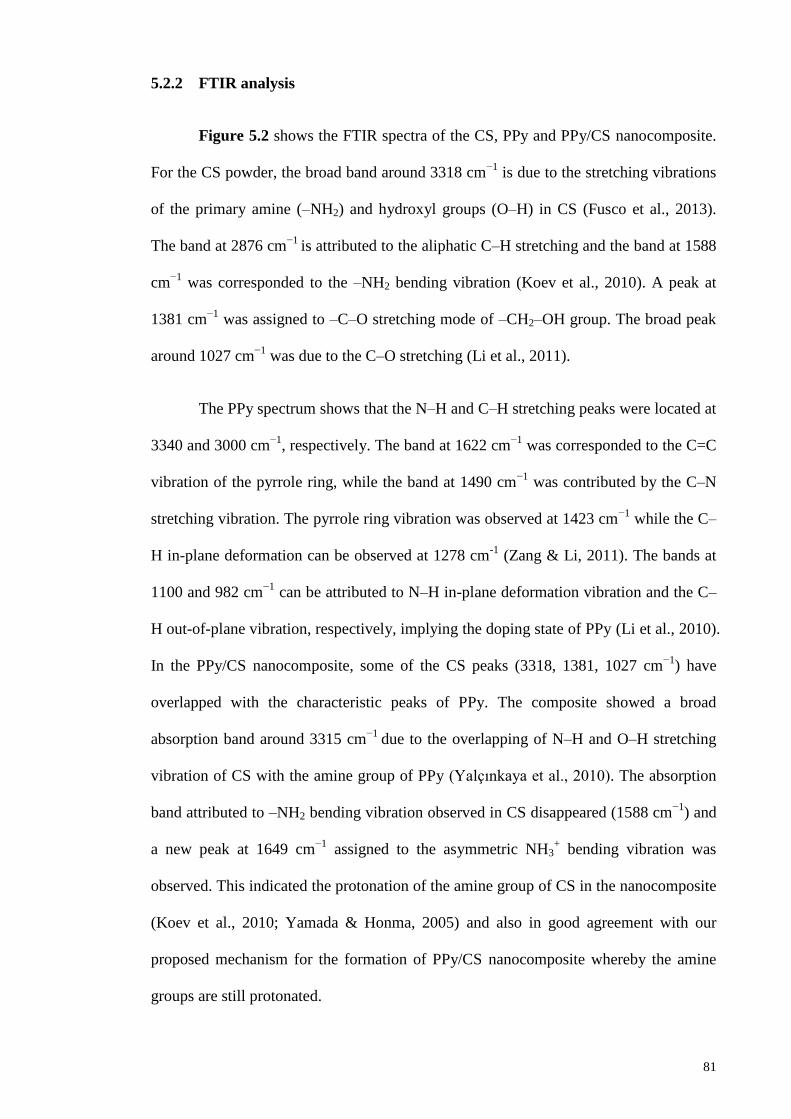
81
5.2.2 FTIR analysis
Figure 5.2 shows the FTIR spectra of the CS, PPy and PPy/CS nanocomposite.
For the CS powder, the broad band around 3318 cm−1
is due to the stretching vibrations
of the primary amine (–NH2) and hydroxyl groups (O–H) in CS (Fusco et al., 2013).
The band at 2876 cm−1
is attributed to the aliphatic C–H stretching and the band at 1588
cm−1
was corresponded to the –NH2 bending vibration (Koev et al., 2010). A peak at
1381 cm−1
was assigned to –C–O stretching mode of –CH2–OH group. The broad peak
around 1027 cm−1
was due to the C–O stretching (Li et al., 2011).
The PPy spectrum shows that the N–H and C–H stretching peaks were located at
3340 and 3000 cm−1
, respectively. The band at 1622 cm−1
was corresponded to the C=C
vibration of the pyrrole ring, while the band at 1490 cm−1
was contributed by the C–N
stretching vibration. The pyrrole ring vibration was observed at 1423 cm−1
while the C–
H in-plane deformation can be observed at 1278 cm-1
(Zang & Li, 2011). The bands at
1100 and 982 cm−1
can be attributed to N–H in-plane deformation vibration and the C–
H out-of-plane vibration, respectively, implying the doping state of PPy (Li et al., 2010).
In the PPy/CS nanocomposite, some of the CS peaks (3318, 1381, 1027 cm−1
) have
overlapped with the characteristic peaks of PPy. The composite showed a broad
absorption band around 3315 cm−1
due to the overlapping of N–H and O–H stretching
vibration of CS with the amine group of PPy (Yalçınkaya et al., 2010). The absorption
band attributed to –NH2 bending vibration observed in CS disappeared (1588 cm−1
) and
a new peak at 1649 cm−1
assigned to the asymmetric NH3+ bending vibration was
observed. This indicated the protonation of the amine group of CS in the nanocomposite
(Koev et al., 2010; Yamada & Honma, 2005) and also in good agreement with our
proposed mechanism for the formation of PPy/CS nanocomposite whereby the amine
groups are still protonated.

82
Figure 5.2: FTIR of CS, PPy and PPy/CS.
5.2.3 Morphological studies of PPy/CS nanocomposite electrodes
The morphologies of the PPy/CS composite electrodes were analyzed by
FESEM. Figure 5.3a shows that the pure PPy electrode is made up of spheres with
fairly smooth surfaces. For PPy/CS-0.5, the spheres appear to be rougher and more
distinct from each other (Figure 5.3b). As for Figure 5.3c and d, the further increment
in the CS content gave larger and rougher spheres with noticeable bulbous particle
protruding out of the surface of the spheres. Elemental mapping was performed on the
PPy/CS-0.75 nanocomposite, as shown in Figure 5.3e. The areas of bright contrast on
the element maps correlate with the C, N and O signal maps.

83
Figure 5.3: FESEM images of (a) pure PPy; PPy/CS nanocomposite electrodes with CS
contents of (b) 0.5, (c) 0.75, (d) 1.0 wt%, and (e) elemental mapping of the PPy/CS-0.75
nanocomposite electrode.
5.2.4 Surface wettability studies of PPy/CS nanocomposite electrodes
An appreciable wetting of solid electrode by the aqueous electrolyte is only
possible when the surface is hydrophilic in nature. The digital images for the water
contact angle measurements are shown in Figure 5.4. The wettability of a solid with
water depends on the relation between the interfacial tensions (water/air, water/solid and
solid/air). A contact angle of 0o indicates complete wetting whilst a contact angle of

84
180o shows complete non-wetting. The water contact angle of the pure PPy electrode
was found to be 71.1o which was still less than 90
o, indicating that PPy is an
intrinsically hydrophilic material (Jagadale et al., 2014). For the nanocomposite
electrodes, it was observed that the water contact angle decreased from 46.5o to 33.6
o
when the CS content was increased from 0.5 to 1.0 wt%, displaying an increased in
hydrophilicity. The water contact angle of the nanocomposites were far lower than the
pure PPy because of the presence of hydroxyl and amine groups in the CS molecule that
enable the formation of hydrogen bonds with the water droplet, greatly improving the
electrode’s wettability.
Figure 5.4: Digital images of water droplets on the surfaces of the as-prepared
electrodes.

85
5.2.5 Electrochemical characterization of PPy/CS nanocomposite electrodes
Electrochemical performances of the electrodes were first examined in a three-
electrode system by cyclic voltammetry (CV) and galvanostatic charge/discharge (GCD)
in 1 M H2SO4. Figure 5.5a shows the CV profiles of PPy and PPy/CS nanocomposite
electrode at a scan rate of 25 mV s−1
. Notably, the area under the curve for the PPy/CS
composite electrode is larger than that of the PPy electrode. This larger area correlates
to the higher specific capacitance that is attributed to the better wettability of the
composite electrode. The GCD test of the PPy and PPy/CS were performed at a current
density of 0.2 A g−1
. As shown in Figure 5.5b, the GCD curves exhibit almost linear
lines, indicating typical behavior of supercapacitors. The specific capacitances of the
electrodes calculated from the discharge curves are 273 and 403 F g−1
for the PPy and
PPy/CS, respectively. The advantage of PPy/CS composite electrode over the pure PPy
electrode is evident. The improved hydrophilicity improved the infiltration of
electrolyte ions, resulting in better utilization of the active materials (Pan et al., 2010).
Figure 5.5c shows plot of specific capacitance verses current density of the PPy and
PPy/CS electrodes. The PPy/CS composite electrode performed better than the PPy
electrode at various current densities. It is noteworthy that a specific capacitance as high
as at 215 A g−1
can still be obtained for PPy/CS at 10 A g−1
, indicating good electrode
wettability that enables rapid and effective interaction between electrolytes ions and
electrode even at high scan rates. This desirable property allows the electrode to operate
at a wide range of current densities. Figure 5.5d shows the CV curves of PPy/CS
composite electrode obtained at various scan rates. The nearly rectangular CV profiles
at various scan rates indicate good capacitive nature with good ion response (Zhang et
al., 2011).

86
Figure 5.5: (a) CV curves at 25 mV s−1
, (b) GCD curves at 0.2 A g−1
, (c) dependence of
specific capacitance on current density for PPy and PPy/CS nanocomposite electrode,
and (d) CV curves of PPy/CS nanocomposite electrode as a function of scan rate.
Further optimization of CS with PPy is vital toward designing commercially
feasible PPy/CS nanocomposite electrodes. On that account, the electrochemical
performances of the PPy/CS nanocomposite electrodes prepared using different weight
percentages of CS in the deposition solution were investigated. As shown in Figure 5.6,
the observed results clearly revealed that the specific capacitance increased from 325 to
403 F g−1
when the CS content was increased from 0.5 to 0.75 wt%, as a result of the
increased hydrophilicity. Then, a further increase of the CS content attenuated the
charge storage performance of the nanocomposite electrodes, which led to the decrease
in specific capacitance. It is observed from the water contact angle measurement that CS

87
effectively increases the wettability of the electrodes; however, the CS biopolymer is
not a conductive material (Yin et al., 2010). The high CS content beyond 0.75 wt% in
the nanocomposite will lower the conductivity of the electrode to such a great degree
that the increased hydrophilicity can no longer enhance the specific capacitance
anymore and hence the importance of optimizing the CS content in the nanocomposite.
Figure 5.6: Specific capacitance values for different CS content calculated at current
density of 0.2 A g−1
.
5.2.6 Supercapacitor device performance of PPy/CS nanocomposite electrode
In order to completely determine the electrochemical performance and the
potential applications of the as-prepared composite electrodes, we assembled
symmetrical supercapacitor devices based on the PPy/CS and PPy electrodes. The
electrochemical impedance spectra (EIS) of the electrodes were carried out to study the
effect of different CS contents on the impedance of the electrode. The Nyquist plots of
EIS for the as-fabricated symmetric supercapacitors of PPy and PPy/CS
nanocomposites electrode are shown in Figure 5.7. The equivalent series resistance

88
(ESR) can be obtained from the intercept at the real axis and it represents a
combinational resistance of the ionic resistance of electrolyte; the intrinsic resistance of
the active material; and the contact resistance between the active material, electrolyte
and the current collector (Pusawale et al., 2013). The ESR of the PPy and PPy/CS
nanocomposite electrodes (0.5, 0.75 and 1.0 wt%) were determined to be 0.30, 0.20,
0.22 and 0.22 Ω; respectively. The charge transfer resistance (Rct) can be estimated from
the diameter of the semicircle. From the Nyquist plots, the Rct value of PPy is only 2.90
whereas the Rct values for all the PPy/CS nanocomposite electrodes increases from 3.20
to 6.18 Ω when the CS content was increased from 0.5 to 1.0 wt%. This increased in the
Rct value stems from the nonconductive CS in the nanocomposite (Yin et al., 2010). The
corresponding ESR and Rct values of the electrodes are summarized in Table 5.1.
As observed, the presence of CS in the nanocomposite increases the Rct value;
however, the ESR of the PPy/CS nanocomposite electrodes is lower than the PPy. This
interesting feature is caused by the increased hydrophilicity of the electrode that
facilitates the electrode/electrolyte interaction which reduces the contact resistance
between the electrode and the aqueous electrolyte (Erdenedelger et al., 2014). Yu et al.
also observed similar Nyquist plots with increased Rct but reduced ESR values for their
CS-Fe3O4 nanocomposite (Yu et al., 2011). These results also indicated that the CS was
successfully incorporated into PPy to form PPy/CS nanocomposites.

89
Figure 5.7: Nyquist plots of EIS for the as-fabricated symmetric supercapacitors of PPy
and PPy/CS nanocomposite electrodes at 0.50, 0.75 and 1.0 wt% chitosan.
Table 5.1: The ESR and Rct values of the symmetric supercapacitors of PPy and
PPy/CS nanocomposites obtained from Nyquist plot.
Electrodes ESR (Ω) Rct (Ω)
PPy 0.30 2.90
PPy/CS-0.50 0.20 3.20
PPy/CS-0.75 0.22 4.08
PPy/CS-1.0 0.22 6.18

90
The cyclic voltammograms of the PPy/CS symmetric supercapacitor is shown in
Figure 5.8a. Rectangular-like shapes are observed even at a high scan rate of 200 mV
s−1
, indicating ideal capacitive behavior. Figure 5.8b shows the GCD curves of the
PPy/CS composite electrode at various current densities. The highly symmetrical
charge/discharge curves indicated excellent reversibility. The specific capacitance
calculated from the discharging curve is 146 F g−1
at a current density of 0.2 A g−1
while
specific capacitance of 96 F g−1
was obtained for the PPy electrode at the same current
density (Figure 5.8c). The PPy/CS symmetric supercapacitor gives good electrolyte
affinity, resulting in an upsurge of electrolyte penetration into the surface layer, render
its high specific capacitance (Yoo et al., 2014). As expected the specific capacitance
decreased at higher current densities was due to the limited diffusion on the electrode
surface (Huang et al., 2012).
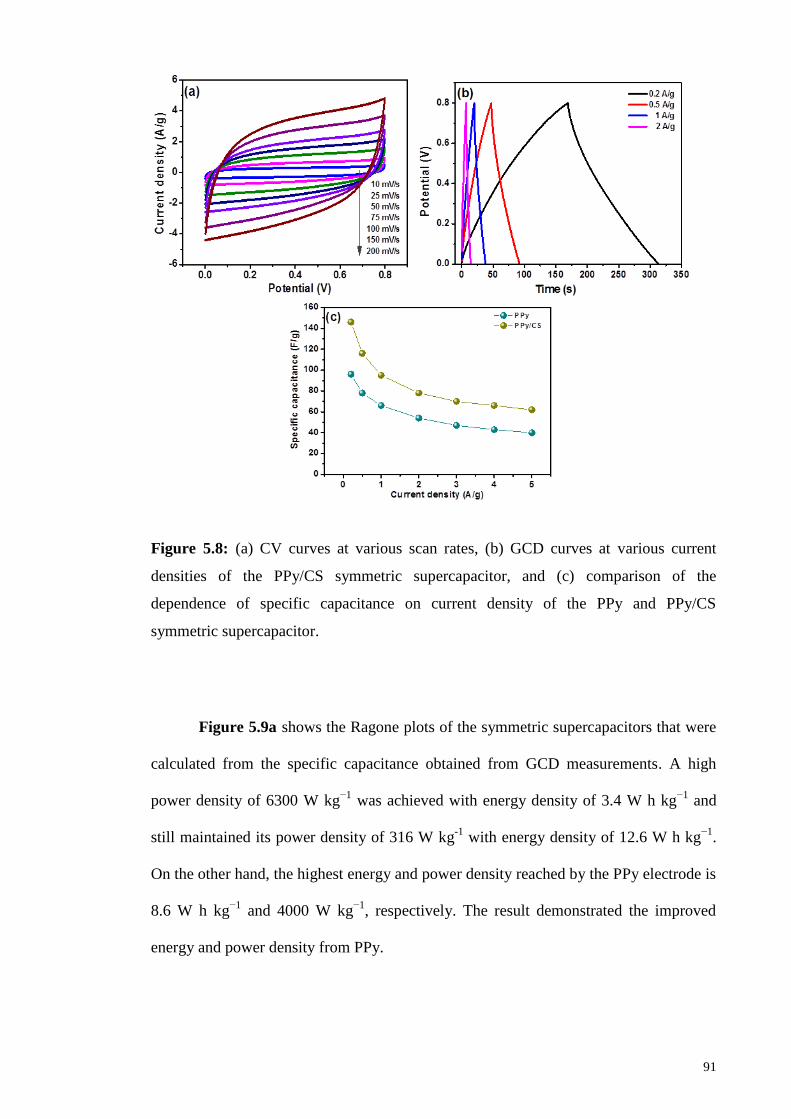
91
Figure 5.8: (a) CV curves at various scan rates, (b) GCD curves at various current
densities of the PPy/CS symmetric supercapacitor, and (c) comparison of the
dependence of specific capacitance on current density of the PPy and PPy/CS
symmetric supercapacitor.
Figure 5.9a shows the Ragone plots of the symmetric supercapacitors that were
calculated from the specific capacitance obtained from GCD measurements. A high
power density of 6300 W kg−1
was achieved with energy density of 3.4 W h kg−1
and
still maintained its power density of 316 W kg-1
with energy density of 12.6 W h kg−1
.
On the other hand, the highest energy and power density reached by the PPy electrode is
8.6 W h kg−1
and 4000 W kg−1
, respectively. The result demonstrated the improved
energy and power density from PPy.

92
Cycling stability is another critical factor for the commercialization of
supercapacitor materials and is shown in Figure 5.9b. The specific capacitance
increased rapidly in the first 100 cycles due to the good water absorbency character of
CS that is capable to hydrate the internal volume of the electrode (Huang et al., 2013).
The specific capacitance then decreased after this, but still retained up to 94.0% of its
initial capacitance after 1000 cycles, whereas the PPy electrode only retained 88.8% of
its initial capacitance. The improved electrochemical stability of the PPy/CS
nanocomposite electrode is mainly due to the addition of CS in the polymer matrix that
can partly prevent PPy component from severely swelling and shrinking during cycling,
owing to the high mechanical strength of CS (Li et al., 2011). These results
demonstrated that the addition of CS effectively enhanced the electrochemical stability
of PPy.
Figure 5.9: (a) Ragone plots, and (b) cycling stability plots for the symmetric
supercapacitors of PPy and PPy/CS.

93
5.3 Conclusion
In this work, we demonstrated a facile strategy for the synthesis of PPy/CS
nanocomposite. The deposition of CS under anodic potentials is made possible with the
presence of pyrrole in the deposition solution. The improved specific capacitance and
rate-capability of the PPy/CS nanocomposite electrode is undoubtedly due to the
contribution of the hydrophilic CS biopolymer in the PPy/CS nanocomposite electrode.
The enhanced hydrophilicity enables easy access of the solvated ions to the
electrode/electrolyte interface, thereby reducing the contact resistance between the
electrode and the electrolyte. Furthermore, the greater wettability of the PPy/CS
nanocomposite electrode improved the infiltration of the electrolyte ions, resulting in
better utilization of the electroactive PPy. Owing to its unique properties, the PPy/CS
nanocomposite electrode shows the promise as an electrode material for high-
performance supercapacitors.

94
CHAPTER 6
HYBRID SILVER NANOPARTICLE/NANOCLUSTER-DECORATED
POLYPYRROLE FOR HIGH-PERFORMANCE SUPERCAPACITORS
6.1 Introduction
Supercapacitors or electrochemical capacitors have a wide array of applications,
including starters, consumer electronics, military defence systems and power back-up
systems (Calvo et al., 2013; Zhang et al., 2012). Supercapacitors have attracted great
attention due to their superior fast charging and discharging process, long cycle life and
environmental friendliness (Shen et al., 2013; Simon & Gogotsi, 2008; Vidhyadharan et
al., 2014). They offer a higher energy density than conventional capacitors and a higher
power density than batteries (You et al., 2014).
Supercapacitors can be classified into two categories; electric double layer
capacitors (EDLC) and pseudocapacitors. EDLC store charges by non-faradaic charge
separation at the electrode/electrolyte interface. Carbon-based materials are usually
employed as electrode materials in EDLC. On the other hand, pseudocapacitors undergo
fast and reversible faradaic reaction between electrolyte and electrode. Recently, much
attention has been shifted to pseudocapacitors as they possess relatively higher
capacitances as compared to carbon-based materials (Conway et al., 1997). The charge
storage mechanisms of pseudocapacitors are based on the faradaic redox reactions that
occur at the interface between the electrode and electrolyte. Pseudocapacitor materials
include conducting polymers like polypyrrole (PPy), polyaniline (PANI) and several
transition metal oxides, including V2O5 (Kim et al., 2012), NiO (Cheng et al., 2013),
MnO2 (Wang et al., 2011), and Co3O4 (Jagadale et al., 2014). Among pseudocapacitor

95
materials, conducting polymers offer the advantages of higher charge density compared
to carbon materials and lower cost in contrast to metal oxides (Patil et al., 2013).
Among the available conducting polymers, PPy is one of the most studied
conducting polymers as pseudocapacitor materials. PPy, which contains a conjugated
structure of alternating C=C double bonds has recently garnered much attention due to
its greater degree electrochemical processing flexibility, light weight, and high electrical
conductivity than most other commercially available conducting polymers (Hepowit et
al., 2012). The main drawback of using conducting polymers as supercapacitor
electrodes is their poor stability during cycling when used as bulk materials. The
conducting polymers films undergo swelling, shrinking, cracks or breaking during the
doping-dedoping process (insertion/deinsertion of counter ions). These processes
gradually aggravate their conducting properties (Frackowiak et al., 2006; Simon &
Gogotsi, 2008). To overcome this problem, researches have focused on synthesizing
PPy/carbon based composites such as activated carbon (Keskinen et al., 2015), carbon
nanotubes (Oh et al., 2008), and graphene (Wang et al., 2012). Also, the synergistic
effects of PPy/metal oxides composite electrodes have been applied as electrode for
supercapacitor applications (Yao et al., 2013; Zhou et al., 2013). Another effective way
to enhance the electronic conductivity of PPy is by metal doping (García-Fernández et
al., 2015; Wysocka-Żołopa et al., 2013).
Recently, PPy hybrids with silver have been prepared from various methods for
different application studies. Zhao et al. have synthesized nanofiber-like Ag@PPy core-
shell structure from silver nitrate and pyrrole in the presence of sodium dodecyl benzyl
sulfonate (SDBS). They investigated the effects of the concentration of SDBS on the
morphology and the electrical conductivity of the composites (Zhao & Nan, 2012). PPy-
Ag nanowire has been synthesized by Hnida et al. via cathodic co-deposition and its use
in hydrogen peroxide sensing (Hnida et al., 2013). Yang et al. have reported the

96
formation of PPy-Ag composite nanotubes in the presence of polyvinylpyrrolidone
(PVP) and its chemiresistor response to ammonia (Yang et al., 2010).
PPy/Ag composites used as electrode materials for supercapacitors applications are
worthwhile to explore considering the highly electrically conductive Ag metal that may
mediate the effective charge migration through the PPy. However, there have been a
limited number of studies on the supercapacitor application of PPy/Ag composites. In a
recent study, Patil et al. synthesized PPy/polyacrylic acid (PAA)/Ag composite
electrodes for supercapacitor application (Patil et al., 2013). The PPy/PAA/Ag
electrodes were prepared via a series of steps involving the polymerization of pyrrole
using oxidant, preparing a solution mixture of PPy, PAA and silver nitrate, followed by
dip coating of the substrate into the solution mixture. Although supercapacitance of the
composite electrode was enhanced due to the incorporation of Ag, the pre-synthesized
PPy bulk particles do not have sufficient surface area for the incorporation of Ag
nanoparticles on a nanoscale level as only the outer surface of the PPy particles are
decorated with Ag nanoparticles. This approach reduces the practical specific
capacitance of the PPy. Hence, substantial improvements have to be made for its
commercialization.
In this study, we report a facile route to synthesize a unique hybrid Ag
nanoparticle/nanocluster-decorated PPy electrode. Herein, we report for the first time
the formation of hybrid Ag nanoparticle/nanocluster compositing with PPy via in-situ
redox reaction followed by electrodeposition. The influence of the AgNO3
concentrations on the formation of Ag nanoparticle/nanocluster and their
electrochemical performances were also investigated. Three- and two- electrode
configurations were used to study the electrochemical performances of the hybrid
Ag@PPy nanocomposite electrodes.

97
6.2 Results and Discussion
6.2.1 Synthesis and formation mechanism
In this study, the formation of the Ag@PPy nanocomposite took place via a
facile in-situ redox reaction of pyrrole and AgNO3, in which the Ag+
was reduced to Ag
and pyrrole was oxidized to PPy in the absence of any stabilizer or surfactant. The
recent work of Amarnath et al. showed that pyrrole can act as a reducing agent
(Amarnath et al., 2011). When AgNO3 is added into the pyrrole solution, pyrrole
monomers will oxidize to from the radical cations of pyrrole monomer, releasing free
electrons during the process. The Ag+ ions are subsequently reduced to Ag particles by
the free electrons released during the formation of free radicals. The coupling process
between two cation radicals followed by the expelling of two protons resulted in the
generation of an aromatic dimer. The propagation step continues via the oxidation,
coupling and deprotonation processes. Even though the reaction mixture of pyrrole and
AgNO3 was only allowed to stir for 5 min, color change can already be observed in the
reaction vessel as shown in Figure 6.1. We believe that it is due to the formation of
pyrrole oligomers. The stirring time is kept short to prevent the oligomers from
propagating into solid PPy, as solid PPy is not suitable for electrodeposition. Finally,
the propagation step is continued via electrodeposition to deposit Ag@PPy
nanocomposite onto a graphite sheet.

98
Figure 6.1: Physical appearance of the reaction mixture after stirring for 5 min prior to
electrodeposition.
6.2.2 FTIR and Raman analysis
Figure 6.2a shows the FTIR spectrum of the Ag@PPy nanocomposite. The N‒
H and C‒H stretching peaks were located at 3340 and 3000 cm-1
, respectively. The band
at 1622 cm-1
was corresponded to the C=C vibration of the pyrrole ring, while the band
at 1399 cm-1
was contributed by the pyrrole ring vibration. C‒H in-plane deformation
can be observed at 1260 cm-1
(Zang & Li, 2011). The bands at 1096 and 982 cm-1
can be
attributed to N‒H in-plane deformation vibration and the C‒H out-of-plane vibration,
respectively, implying the doping state of PPy (Li et al., 2010).
The Raman spectra of pure PPy and Ag@PPy are shown in Figure 6.2b. The
characteristic bands at 1575 and 1385 cm-1
are assigned to the ring stretching mode and
C=C backbone stretching of PPy, respectively. For the pure PPy, the band at 1055 cm-1
is attributed to the symmetrical C‒H in plane bending. In addition, the two bands at 975
and 935 cm-1
are due to the bipolaron ring and polaron structure (Gu et al., 2010). The
characteristics absorption peaks of PPy are also exhibited in Ag@PPy with little
alteration of the bands, which indicates the presence of the unchanged internal structure
of the PPy in the composite.

99
Figure 6.2: (a) FTIR and (b) Raman spectra of PPy and Ag@PPy.
6.2.3 Morphological studies of Ag@PPy nanocomposite
Figure 6.3 shows the FESEM morphologies of the as-prepared samples. Figure
6.3a shows the silver-free PPy film had typical cauliflower morphology and the higher
magnification image shows a smooth PPy without any embedment of Ag nanoparticles.
For 0.01M-Ag@PPy, small spherical Ag nanoparticles can be clearly seen on the
surface of PPy as shown in Figure 6.3b. Surprisingly, when the concentration of
AgNO3 increased to 0.05 M, two different sizes of Ag were observed; Ag nanoparticles
and Ag nanoclusters. The Ag nanoclusters with particle size ranging from 55-100 nm
can be seen decorated evenly alongside the small Ag nanoparticles on the PPy film
(Figure 6.3c). We deduce that the small Ag nanoparticles were already formed during
the initial redox reaction between pyrrole and Ag+ ions prior to electrodeposition.
During electrodeposition, the oxidizing role of Ag+ ions is replaced by the electrode
oxidation process on the substrate when potential is applied. The excess Ag+ ions will
selectively adsorbed onto the Ag nanoparticles surfaces because of ionic adsorption
effect (Patil et al., 2013) and is subsequently reduced to Ag nanoclusters from the free
electrons released during the continuous formation of radical pyrrole cations. The Ag

100
nanoclusters tend to have irregular shapes with increased in their sizes when the AgNO3
concentration was further increased to 0.10 M as depicted in Figure 6.3d. Elemental
mapping was performed on the 0.05M-Ag@PPy nanocomposite, as shown in Figure
6.3e. The areas of bright contrast correlate to the distributions of C, N and Ag in the
nanocomposite. The model for the formation of different Ag@PPy nanocomposite is
shown in Figure 6.4.

101
Figure 6.3: FESEM images of (a) pure PPy, inset showing PPy at lower magnification;
Ag@PPy nanocomposites with AgNO3 concentrations of (b) 0.01 M, (c) 0.05 M, (d)
0.10 M, and (e) elemental mapping of the 0.05M-Ag@PPy nanocomposite.

102
Figure 6.4: Schematic reperesentation of the evolution of different Ag@PPy
nanocomposites.
HRTEM images of the 0.05M-Ag@PPy nanocomposite are shown in Figure 6.5.
The Ag nanoclusters and Ag nanoparticles can be clearly seen in Figure 6.5a and b,
respectively. Figure 6.5b clearly shows the deposition of distributed ultra-small Ag
nanoparticles having a size range of 2-4 nm on the surface of the PPy film.
Figure 6.5: HRTEM images of (a) Ag nanoclusters and (b) Ag nanoparticles.

103
6.2.4 XPS analysis of hybrid Ag@PPy nanocomposite
XPS was used to characterize the chemical state of the as-prepared hybrid
Ag@PPy nanocomposite and is shown in Figure 6.6. The N 1s core level spectrum of
the Ag@PPy nanocomposite could be deconvoluted into three peaks as shown in
Figure 6.6a. The main peak at 399.1 eV was attributed to the neutral amine nitrogen
(N‒H). The peak at higher binding energy of 400.3 eV corresponds to the positively
charged nitrogen (‒N+). Another peak at the lower binding energy side (397.9 eV) can
be assigned to the imine nitrogen (‒N=) (Cao et al., 2015). The Ag 3d core level
spectrum of the Ag@PPy nanocomposite is shown in Figure 6.6b. Two peaks are
observed at 368.0 and 374.1 eV with 6.1 eV spin energy separations, corresponding to
the binding energies of the Ag 3d5/2 and Ag 3d3/2 core levels, respectively (Babu et al.,
2012). The XPS analysis provided support for the existence of metallic silver in the
nanocomposite materials.
Figure 6.6: XPS spectra of Ag@PPy nanocomposite at (a) N 1s and (b) Ag 3d core
level spectra.

104
6.2.5 Electrochemical characterizations of Ag@PPy nanocomposite
Cyclic voltammetry (CV) was used to evaluate the electrochemical
performances of the as-prepared PPy and Ag@PPy nanocomposite electrodes. Figure
6.7a shows the CV curves of the electrodes in 1.0 M H2SO4 electrolyte at a scan rate of
10 mV s−1
. It is apparent that the peak current was greatly enhanced for the Ag@PPy
nanocomposite electrode as compared to that for the pure PPy electrode. No well-
defined peaks were observed for the PPy electrode. Interestingly, two pairs of redox
peaks were observed for the Ag@PPy nanocomposite electrode. For the Ag
nanoparticles, the oxidation peak was observed at 0.19 V while the minute reduction
peak was observed at around 0.01 V (Patil et al., 2012). The second pair of redox peak
was attributed by the oxidation and reduction of Ag nanoclusters, having broad anodic
and cathodic peaks situated at 0.50 and 0.20 V, respectively (Wei et al., 2013). Here we
observed that redox behavior is affected by size. Also, the separation between the
anodic and cathodic peaks increases with the size of Ag particles. These observations
are in good agreement with previous studies (Chaki et al., 2004; Ivanova & Zamborini,
2010). The CV results imply the presence of hybrid Ag nanoparticles and Ag
nanoclusters in the Ag@PPy nanocomposite.
Figure 6.7b shows the GCD curves of the pure PPy and the Ag@PPy
nanocomposite electrodes at current density of 0.2 A g−1
. The GCD curve of Ag@PPy
nanocomposite shows longer discharge time than the pure PPy, indicating that the
Ag@PPy nanocomposite has better capacitance property than PPy. The specific
capacitances of the electrodes were calculated from the GCD curves at current density
of 0.2 A g−1
. A capacitance of 273 F g−1
was found for the pure PPy and the capacitance
improved to 414 F g−1
with the incorporation of Ag nanoparticles and nanoclusters,
which was almost a 52% increment in the specific capacitance. This shows that the

105
addition of Ag nanoparticles improved the electron transfer in the Ag@PPy system. The
metallic conductor Ag nanoparticles mediate the electron hopping within the conjugated
systems of the PPy chains, harnessing fully the capacitance properties of PPy while the
anchored Ag nanoclusters acted as spacers to prevent the restacking of PPy films.
Conversely, the thick and densely packed PPy electrode is undesirable for fast ion
kinetics and attributes to decreased charge storage performance. The dependence of
specific capacitance on current density for the PPy and hybrid Ag@PPy nanocomposite
is shown in Figure 6.7c. It can be observed that the specific capacitance of the hybrid
Ag@PPy nanocomposite is much higher than that of pure PPy at all current densities.
The specific capacitance for the hybrid Ag@PPy nanocomposite at 10 A g−1
remained
high at 206 F g−1
; this desirable feature of the electrode allows it to operate at a wide
range of current densities. It should be noted that the specific capacitance
of 414 F g−1
of the optimized Ag@PPy nanocomposite electrode is
higher than that of many previously reported Ag@PPy-based electrodes, such as
PPy-Ag free standing porous films (282 F g−1
at 1 mV s−1
) (Singh et al., 2013) and
PPy/Polyacrylic acid/Ag nanocomposite (226 F g−1
at 10 mV s−1
) (Patil et al., 2013).

106
Figure 6.7: CV curves at 10 mV s−1
, (b) GCD curves at 0.2 A g−1
, and (c) dependence
of specific capacitance on current density for PPy and hybrid Ag@PPy nanocomposite
electrode.
To ascertain the applicability of the electrodes for high-performance
supercapacitors, CV curves of PPy and hybrid Ag@PPy nanocomposite electrode were
recorded and compared at various scan rates. Figure 6.8a and b show that the area
under the curve increases as the scan rate increases. At their respective scan rates, the
Ag@PPy nanocomposite electrode exhibited higher output current in comparison the
PPy electrode, indicating an enhancement of charge storage in the composite electrode.
Although the output currents of the PPy electrode was lower compared to that of the
hybrid Ag@PPy nanocomposite electrode, the CV curves still exhibited quasi-
rectangular shapes, revealing the good capacitance behavior and high-rate compatibility
of PPy, making it a suitable platform for the anchoring of Ag nanoparticle/nanocluster.
As shown in Figure 6.8b, with the increase of potential scan rate from 10 to 100 mV s−1
,

107
the anodic peak potential shifted to higher potentials and the cathodic peaks shifted to
lower potentials. This is mainly due to the resistance of the electrode (Yan et al., 2010).
The shape of the CV curves was maintained even at high scan rates, indicating excellent
capacitance behavior of the nanocomposite electrode.
Figure 6.8: CV curves at various scan rates for (a) PPy, and (b) hybrid Ag@PPy
nanocomposite electrode.
The optimization of Ag on PPy is essential from the economic and high-
performance perspective for a supercapacitor. Hence, the electrochemical performances
of the Ag@PPy nanocomposite electrodes prepared using different concentrations of
AgNO3 were evaluated. Figure 6.9 shows the effect of AgNO3 concentration on the
electrochemical performance of nanocomposite. The specific capacitances increased
from 273 F g−1
to 414 F g−1
when the AgNO3 concentration was increased from 0 to
0.05 M. Then, a further increase in the AgNO3 concentration eventually led to the
decrease in specific capacitance. The decrease in the efficiency at high Ag loading is
due to the free standing/excess Ag in the composite that may oxidized to Ag(I) and also
may be eroded by the electrolyte (Lim et al., 2014). As seen from the FESEM results,
the Ag@PPy prepared from 0.10 M AgNO3 has irregular and large Ag nanoclusters
anchored on the nanocomposite which may lead to a decrease in the active surface area

108
of PPy film, reducing its interaction with the electrolyte ions. Consequently, the overall
supercapacitance performance of the electrode would have deteriorated.
Figure 6.9: Specific capacitance values for different AgNO3 concentrations calculated
at current density of 0.2 A g−1
.
6.2.6 Supercapacitor device performance of hybrid Ag@PPy nanocomposite
A three-electrode system has heightened sensitivity to faradaic reaction that can
lead to large deviation when projecting the energy storage capability of an electrode
material (Stoller & Ruoff, 2010). To the best of our knowledge, there is no report on the
electrochemical performance of a two-electrode system fabricated from Ag@PPy
nanocomposite. We had made an attempt to fabricate a symmetrical two-electrode cell
using hybrid Ag@PPy. Figure 6.10a shows the cyclic voltammograms of the
symmetric supercapacitor device, which have a rectangular shape within the range of 0
to 0.8 V. The GCD curves of the hybrid Ag@PPy nanocomposite are shown in Figure
6.10b. The charging and discharging reveal symmetrical curves, signifying excellent
reversibility. The specific capacitance obtained from the discharging curve is calculated

109
to be 161 F g−1
at a current density of 0.2 A g−1
. The high specific capacitance is
ascribed to the unique hybrid Ag nanoparticle/nanocluster-decorated PPy
nanocomposite. The highly conducting metallic Ag nanoparticles mediate the effective
charge migration through the PPy, whilst Ag nanoclusters prevent the restacking of PPy
films. Both hybrid Ag nanoparticle/nanocluster extend the active sites for redox
reactions, leading to improved specific capacitance of the hybrid Ag@PPy electrode.
Figure 6.10: (a) CV at various scan rates and (b) GCD at various current densities of
the as-fabricated symmetric supercapacitor of Ag@PPy nanocomposite.
The electrochemical impedance spectra (EIS) of the fabricated symmetric
supercapacitors were recorded in a frequency range between 0.1 Hz and 100 kHz, as
shown in Figure 6.11. The first intercept of the semicircle at the real axis in the high
frequency region represents the equivalent series resistance (ESR), which is attributed to
the resistance of the electrolyte; the contact resistance between the electrolyte, current
collector, and active material; and the intrinsic resistance of the active material itself.
The ESR values were determined to be 0.30 and 0.26 Ω for the PPy and hybrid
Ag@PPy nanocomposite electrode, respectively. The charge transfer resistance (Rct) can
be estimated from the diameter of the semicircle. From the Nyquist plot, the Rct values

110
of PPy and hybrid Ag@PPy nanocomposite and 2.90 and 0.82 Ω, respectively. The
remarkably reduced Rct is the result of the integration of metallic silver into PPy. This
desirable feature effectively enhanced the electron hopping system of the PPy, resulting
in better utilization of the PPy.
Figure 6.11: Nyquist plots of EIS for the symmetric supercapacitors of PPy and hybrid
Ag@PPy nanocomposites. Inset is a magnified portion of the high-frequency region.
The Ragone plot shows the dependence between the power output and energy
density of the symmetric supercapacitor device (Figure 6.12a). The energy density of
the hybrid Ag@PPy nanocomposite decreased from 13.6 to 2.6 W h kg-1
as the power
density increased from 312 to 5850 W kg−1
. On the other hand, the highest energy and
power density reached by the PPy electrode is 8.6 W h kg−1
and 4000 W kg−1
,
respectively. The result demonstrated the improved energy and power density from PPy.
Cycling stability is essential for the commercialization of supercapacitor materials.
Figure 6.12b shows the capacitance retention as a function of the cycle number at a

111
current density of 0.5 A g−1
for 1000 cycles. The hybrid Ag@PPy nanocomposite
exhibited remarkable cycling stability and retained up to 98.9% of its initial capacitance
after 1000 charge/discharge cycles, whereas the PPy electrode only retained 88.8% of
capacitance. These results show that the addition of hybrid Ag particles enhanced the
cycling stability of PPy.
Figure 6.12: (a) Ragone plot, and (b) cycling stability of the symmetric supercapacitors
of PPy and hybrid Ag@PPy nanocomposite.
6.3 Conclusion
This work featured a facile strategy for the synthesis of hybrid Ag
nanoparticle/nanocluster-decorated PPy nanocomposites. The FESEM images showed
that the best combination of nanoparticles and nanoclusters are formed at the optimized
concentration of 0.05 M AgNO3. When lower concentration was used, no Ag
nanoclusters were found, while at higher concentration, many Ag nanoclusters
agglomerated with irregular shapes were observed. The improved capacitance and rate-
capability of the hybrid Ag@PPy can be accredited to its unique architecture. Firstly,
the 2-4 nm Ag nanoparticles that are evenly distributed on PPy effectively enhanced the
electron hopping system of the conjugated PPy, thereby increasing the capacitance of
the PPy. Secondly, the larger Ag nanoclusters with a size range of 55-100 nm were

112
uniformly adhered to the PPy film acted as spacers, preventing the PPy films from
restacking. Thirdly, the enhanced morphology shortened the transport pathway for
electrons and gave better cycling stability. Benefiting from its splendid characteristics,
the hybrid Ag nanoparticle/nanocluster-decorated PPy nanocomposite was shown to
exhibit a significantly improved electrochemical performance.

113
CHAPTER 7
BOOSTING THE SUPERCAPACITIVE PROPERTIES OF POLYPYRROLE
WITH CHITOSAN AND HYBRID SILVER NANOPARTICLE/NANOCLUSTER
7.1 Introduction
The increasing demand for energy has triggered enormous research activities for
energy storage and conversion form clean and renewable energy sources.
Electrochemical capacitors, also known as supercapacitors, are promising energy
storage devices for many applications including portable power systems, hybrid electric
vehicles, consumer electronics, and power back-up systems (Calvo et al., 2013; Zhang
et al., 2012).
Generally, supercapacitors are classified into two types; (i) electric double layer
capacitors (EDLC), which are carbon-based materials that depend on the non-faradaic
charge separation at the electrode/electrolyte interface, and (ii) pseudocapacitors, which
are made of metal oxides and conducting polymers, undergo faradic charge transfer
across the active material of the electrodes. The conducting polymer, polypyrrole (PPy)
is particularly promising and one of the most widely used polymers owing to its good
electrical conductivity, ease of low cost synthesis, environmental stability and
electrochemical processing flexibility (Biswas & Drzal, 2010; Hepowit et al., 2012).
Recently, researches have shifted their focuses on the synthesis of PPy
composites electrode in order to reinforce the stability of the PPy composite as well as
to improve the capacitance of PPy. Hybrids of PPy that combines carbonaceous
materials or metal oxides with PPy include graphene (Davies et al., 2011), carbon
nanotubes (Raicopol et al., 2013) activated carbon (Keskinen et al., 2015), carbon

114
aerogel (An et al., 2010), MnO2 (Bahloul et al., 2013), and CoO (Zhou et al., 2013)
have been widely studied. These composites are usually done by combining the
different classes of supercapacitors i.e., EDLCs and pseudocapacitors, that enhanced the
electrochemical performance of PPy.
Another effective way that is worthwhile to explore is by incorporating the
highly conductive metallic silver into the structures of PPy to assist the electron
transport throughout the conjugated system of PPy. Zhao et al. studied the effect of
different morphologies of Ag@PPy core-shell structures on the electrical conductivity
of the composite (Zhao & Nan, 2012). The formation of Ag@PPy composite nanotubes
by Yang et al. showed improved chemiresistor response towards ammonia due to better
charge transmission in the nanocomposite (Yang et al., 2010). There are limited studies
on Ag@PPy for supercapacitors applications. In a recent study by Patil et al.,
PPy/polyacrylic acid (PAA)/Ag nanocomposite electrodes have been synthesized for
supercapacitor applications through the polymerization of PPy followed by dipping in a
solution of PPy, PAA and silver nitrate (Patil et al., 2013). The nanocomposite achieved
a maximum specific capacitance of 226 F g−1
at 10 mV s−1
. In our previous report, we
studied the effect of the concentration of silver nitrate on the electrochemical
performance of Ag@PPy nanocomposite electrode. The unique architectures of hybrid
Ag nanoparticle/nanocluster-decorated PPy and the reduced resistivity of the electrode
gave a specific capacitance of 414 F g−1
at 0.2 A g−1
(Gan et al., 2015).
Besides increasing the electrical conductivity of PPy, excellent electrode
wettability is also indispensable for producing outstanding supercapacitors. Many
studies have demonstrated that the hydrophilicity of an electrode surface can enhance
the supercapacitive properties of an active material (Erdenedelger et al., 2014; Navale et
al., 2015; Pawar et al., 2012; Wang et al., 2012). An electrode with good wettability
enables better infiltration of the electrolyte ions into the framework of the electrode. In
115
our previous study, PPy was composited with chitosan (CS) showed an improvement in
the capacitance mainly due to the hydrophilic contribution by CS. Furthermore, CS is an
attractive biomaterial with many unique properties such as environmental friendly
nature, low cost, nontoxicity, high mechanical strength, and antimicrobial activity that
have found its niche in a variety of applications (Ayad et al., 2014; Fusco et al., 2013;
Koev et al., 2010; Sun et al., 2009; Zeng et al., 2009).
In the present investigation we attempt to combine the merits CS and Ag with
PPy to further augment the supercapacitive characteristics of PPy. The roles of CS and
Ag on the structural and electrochemical properties on the Ag@PPy/CS ternary
nanocomposite were discussed. The electrochemical performance was first investigated
using a three-electrode configuration followed by the fabrication of symmetric
supercapacitor of Ag@PPy/CS.
7.2 Results and Discussion
7.2.1 Synthesis and formation mechanism
The Ag@PPy/CS nanocomposite electrode was formed via a facile and easily
scalable electrodeposition method. The Ag@PPy/CS nanocomposite electrode was form
at selected chitosan content of 0.75 wt% and 0.05 M AgNO3 which were the optimized
concentrations to get the highest specific capacitance as reported in our earlier work.
The as-prepared deposition solution was subjected to electrodeposition under a constant
potential of +0.8 V to coat the Ag@PPy/CS nanocomposite onto a piece of graphite
sheet. It is interesting to note that the reduction of Ag and the deposition of CS are only
possible at negative potentials. However, they are also feasible under anodic potentials
in the presence of pyrrole. In the former case, pyrrole acted as a reducing agent
116
(Amarnath et al., 2011) to reduce the Ag+ ions to Ag. The redox reaction was initiated
upon the introduction of AgNO3 where pyrrole is oxidized to form radical cations of
pyrrole monomers, the free electrons released during the formation of radicals caused
the Ag+ ions to reduce to Ag. The free electrons released from the polymerization of
pyrrole during the electrodeposition step continue to reduce Ag+ ions to Ag. In the latter
case, the pyrrole monomers were entrapped in the CS biopolymer due to the hydrogen
bonds formed between the hydroxyl and amine groups of CS with the amine group of
pyrrole monomers. During the polymerization of pyrrole on the electrode surface, the
attached pyrrole monomers on CS will be attracted to the electrode surface and
propagate to form PPy/CS films with the simultaneous doping of Ag on the PPy/CS
films, producing the Ag@PPy/CS nanocomposite electrode.
CS has also been reported to act as a reducing agent in either basic condition,
heating, or both (Fang et al., 2015; Guo et al., 2012; Sanpui et al., 2008). The basic
suspension and the degradation products of CS (e.g. glucosamide) during heating may
supply electrons and function as a reducing agent (Twu et al., 2008). Since no base and
heating were involved in this work, the role of CS as a reducing agent was unlikely.
However, CS can act as a stabilizing agent, protecting the Ag particles from
agglomeration (Akmaz et al., 2013; Wei et al., 2009).
7.2.2 FTIR and XPS analysis
Figure 7.1a shows the FTIR spectra of the CS, PPy, Ag@PPy, PPy/CS and
Ag@PPy/CS nanocomposite. For the CS powder, the broad band around 3318 cm−1
is
due to the stretching vibrations of the primary amine (–NH2) and hydroxyl groups (O–H)
in CS (Fusco et al., 2013). The bands at 2876 cm−1
and 1588 cm−1
were attributed to the
aliphatic C–H stretching and –NH2 bending vibration, respectively (Koev et al., 2010).

117
C–O stretching mode of –CH2–OH group was observed at 1381 cm−1
whilst a broad
peak at 1027 cm−1
was attributed to the C–O–C stretching (Li et al., 2011).
The spectra of PPy and Ag@PPy showed the typical N–H stretching at 3340
cm−1
, the peak located 3000 cm
−1 was assigned to aromatic C–H stretching of the
pyrrole ring and the peak at 1622 cm−1
was corresponded to the C=C vibration of the
pyrrole ring. The peak at 1490 cm−1
was contributed by the C–N stretching vibration
while the peak at 1415 cm−1
was due to
the pyrrole ring vibration. Absorption bands at
1278, 1094 and 990 cm−1
were corresponded to C–H in-plane deformation, N–H in-
plane deformation vibration and the C–H out-of-plane vibration, respectively (Gu et al.,
2010; Zang & Li, 2011).
The infrared spectrum of the PPy/CS and Ag@PPy/CS nanocomposites showed
a broad absorption band centered around 3313 cm−1
due to the overlapping of N–H and
O–H stretching vibration of CS with the amine group of PPy (Yalçınkaya et al., 2010).
The absorption band corresponded to –NH2 bending vibration in the CS at 1588 cm−1
was not observed in the PPy/CS and Ag@PPy/CS nanocomposite. Instead, a new peak
attributed to the asymmetric NH3+ bending at 1649 cm
−1 appeared in the CS
nanocomposites, indicating the protonation of the amine group in the CS (Koev et al.,
2010; Yamada & Honma, 2005). The CS in the nanocomposites remained protonated
because the electrodeposition took place under an anodic potential of +0.8 V in the
presence of pyrrole. CS films that are electrodeposited under cathodic potentials will
give deprotonated CS films. This is due to the fact that cathodic electrodeposition takes
advantage of CS’s pH dependent solubility. At negative potentials, the evolution of
hydrogen leads to a locally high pH near the cathode surface. The CS becomes
deprotonated and is no longer soluble under basic conditions, depositing CS films on
the electrode (Koev et al., 2010; Luo et al., 2005).
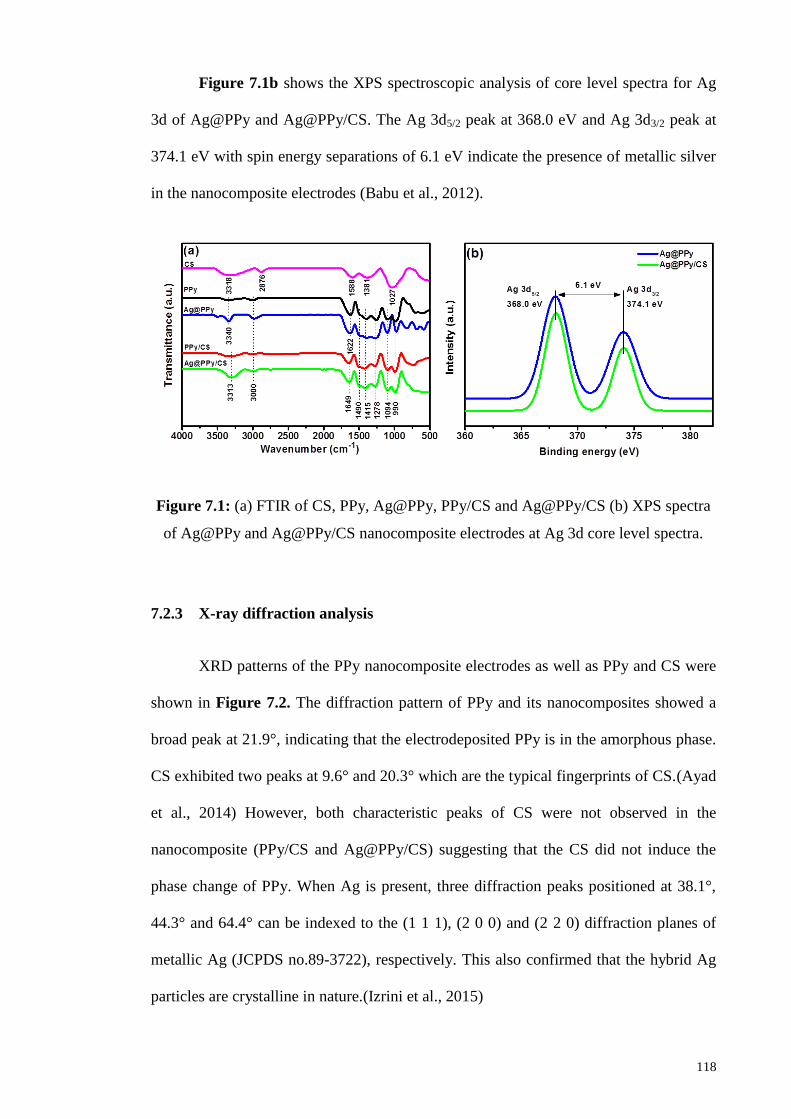
118
Figure 7.1b shows the XPS spectroscopic analysis of core level spectra for Ag
3d of Ag@PPy and Ag@PPy/CS. The Ag 3d5/2 peak at 368.0 eV and Ag 3d3/2 peak at
374.1 eV with spin energy separations of 6.1 eV indicate the presence of metallic silver
in the nanocomposite electrodes (Babu et al., 2012).
Figure 7.1: (a) FTIR of CS, PPy, Ag@PPy, PPy/CS and Ag@PPy/CS (b) XPS spectra
of Ag@PPy and Ag@PPy/CS nanocomposite electrodes at Ag 3d core level spectra.
7.2.3 X-ray diffraction analysis
XRD patterns of the PPy nanocomposite electrodes as well as PPy and CS were
shown in Figure 7.2. The diffraction pattern of PPy and its nanocomposites showed a
broad peak at 21.9°, indicating that the electrodeposited PPy is in the amorphous phase.
CS exhibited two peaks at 9.6° and 20.3° which are the typical fingerprints of CS.(Ayad
et al., 2014) However, both characteristic peaks of CS were not observed in the
nanocomposite (PPy/CS and Ag@PPy/CS) suggesting that the CS did not induce the
phase change of PPy. When Ag is present, three diffraction peaks positioned at 38.1°,
44.3° and 64.4° can be indexed to the (1 1 1), (2 0 0) and (2 2 0) diffraction planes of
metallic Ag (JCPDS no.89-3722), respectively. This also confirmed that the hybrid Ag
particles are crystalline in nature.(Izrini et al., 2015)
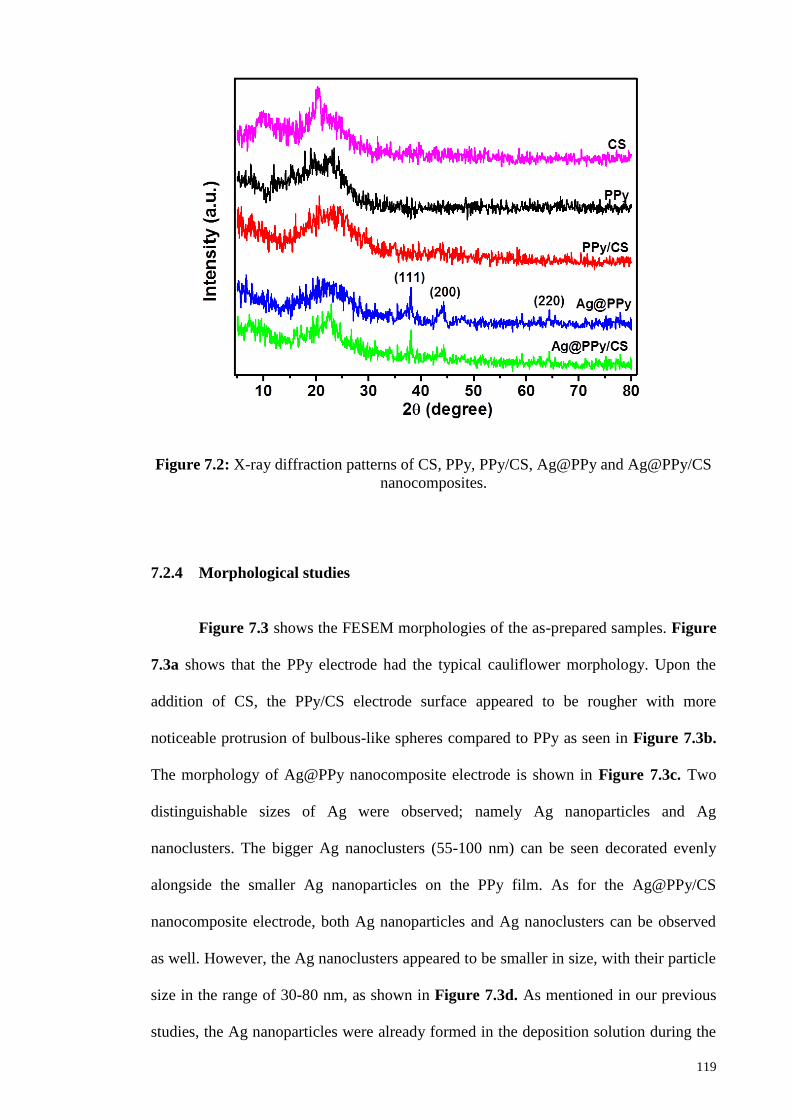
119
Figure 7.2: X-ray diffraction patterns of CS, PPy, PPy/CS, Ag@PPy and Ag@PPy/CS
nanocomposites.
7.2.4 Morphological studies
Figure 7.3 shows the FESEM morphologies of the as-prepared samples. Figure
7.3a shows that the PPy electrode had the typical cauliflower morphology. Upon the
addition of CS, the PPy/CS electrode surface appeared to be rougher with more
noticeable protrusion of bulbous-like spheres compared to PPy as seen in Figure 7.3b.
The morphology of Ag@PPy nanocomposite electrode is shown in Figure 7.3c. Two
distinguishable sizes of Ag were observed; namely Ag nanoparticles and Ag
nanoclusters. The bigger Ag nanoclusters (55-100 nm) can be seen decorated evenly
alongside the smaller Ag nanoparticles on the PPy film. As for the Ag@PPy/CS
nanocomposite electrode, both Ag nanoparticles and Ag nanoclusters can be observed
as well. However, the Ag nanoclusters appeared to be smaller in size, with their particle
size in the range of 30-80 nm, as shown in Figure 7.3d. As mentioned in our previous
studies, the Ag nanoparticles were already formed in the deposition solution during the

120
redox reaction between pyrrole and Ag+
ions. The oxidation of the pyrrole during
electrodeposition at the electrode surface continues to supply electrons to reduce the
remaining Ag+ ions to Ag nanoclusters. The significantly higher rate of reduction of
Ag+ during electrodeposition gave rise to the bigger particle size of Ag nanoclusters.
The base morphology of Ag@PPy/CS is also similar to that of PPy/CS where bulbous-
like spheres can be seen projecting out of the surface. In Figure 7.3e, the areas of bright
contrast on the element maps correlate with the C, N, O and Ag signal maps.

121
Figure 7.3: FESEM images of (a) PPy, (b) PPy/CS, (c) Ag@PPy, (d) Ag@PPy/CS
nanocomposite electrodes, and (e) elemental mapping of the Ag@PPy/CS
nanocomposite electrode. Insets of (c) and (d) show the lower magnification images of
the respective nanocomposites.

122
The structure of the Ag@PPy and Ag@PPy/CS nanocomposite electrodes was
characterized by HRTEM and shown in Figure 7.4. The Ag nanoclusters in both
nanocomposite electrodes can be seen in Figure 7.4a and 7.4c. An obvious reduction in
the size of Ag nanoclusters was observed in Ag@PPy/CS due to the addition of CS.
Similarly, the ultra-small Ag nanoparticles also showed decrease in size when CS is
present in the nanocomposite. The Ag nanoparticles from Ag@PPy displayed a size
range of 2 – 4 nm (Figure 7.4b) whilst the Ag nanoparticles from Ag@PPy/CS
displayed an even smaller size range of 1 ‒ 2 nm as seen in Figure 7.4d. It was found
that the addition of CS caused an apparent decrease in the particle sizes of both Ag
nanoclusters and Ag nanoparticles. Ag+ ions readily form coordinate bonds with the
lone pair electrons from the amine groups of PPy. When CS is added, more coordinate
bonds can be formed with the Ag+ ions due to the presence hydroxyl groups in the CS,
providing more sites for the reduction of Ag+ ions. Furthermore, the long polymer
chains of CS retarded the growth of metallic Ag sterically by protecting the particles
from agglomeration and slowing the particle growth, facilitating the particle size
reduction of Ag (Cruz-Silva et al., 2007; Sun et al., 2012).
The schematic representation for the one-step electrodeposition of Ag@PPy/CS
nanocomposite is illustrated in Figure 7.5. Color change can be observed in the reaction
vessel during the preparation of the deposition solution indicating the initial formation
of Ag particles and oligomers of pyrrole.
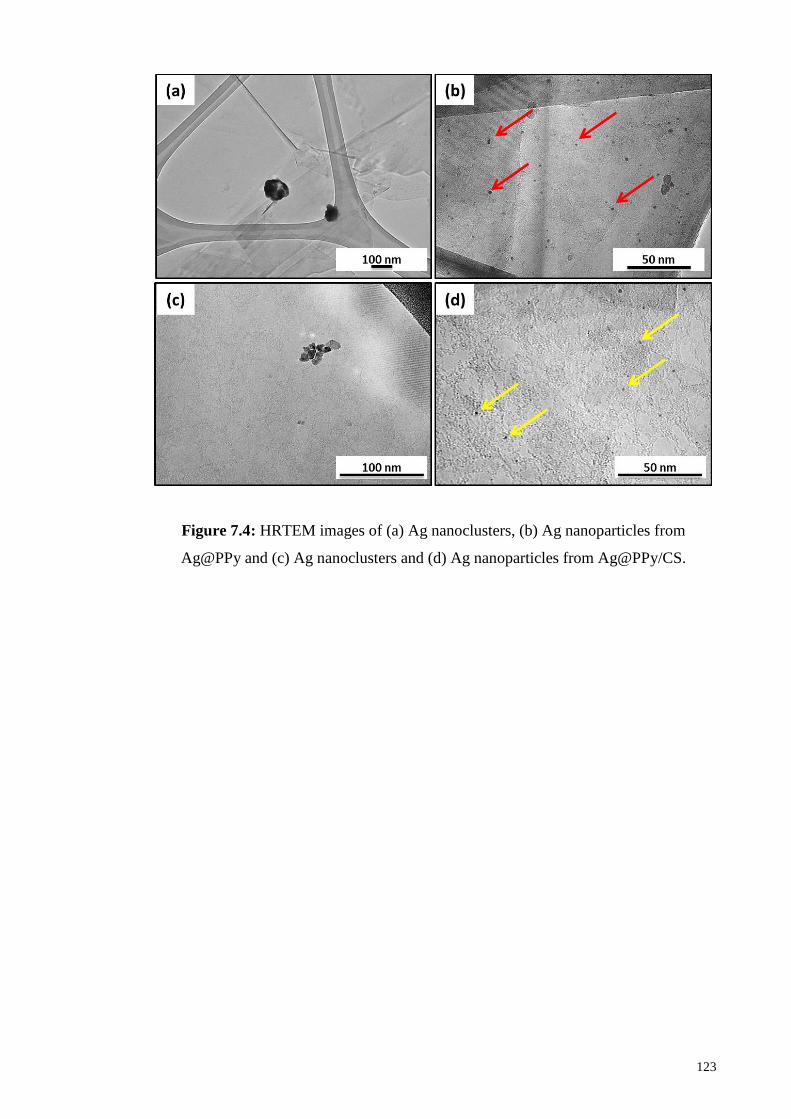
123
Figure 7.4: HRTEM images of (a) Ag nanoclusters, (b) Ag nanoparticles from
Ag@PPy and (c) Ag nanoclusters and (d) Ag nanoparticles from Ag@PPy/CS.

124
Figure 7.5: Schematic representation for the formation of Ag@PPy/CS nanocomposite
via one-step electrodeposition.
7.2.5 Surface wettability studies
The wettability of a solid with water depends on the interfacial tensions between
water/air, water/solid and solid/air. The wettability of the electrode by aqueous
electrolyte plays an important role on the specific capacitance of the electrode because a
hydrophilic electrode will allow better electrolyte infiltration throughout the internal
volume of the material. The wetting results are showed in Figure 7.6. A contact angle
of 180o means complete non-wetting, on the other hand, a contact angle of 0
o
corresponds to complete wetting. The water contact angles of PPy and Ag@PPy were
measured to be 85.1o
and 85.2o, respectively. Both electrodes having similar contact
angle implies that the embedded Ag nanoparticles and Ag nanoclusters on the PPy
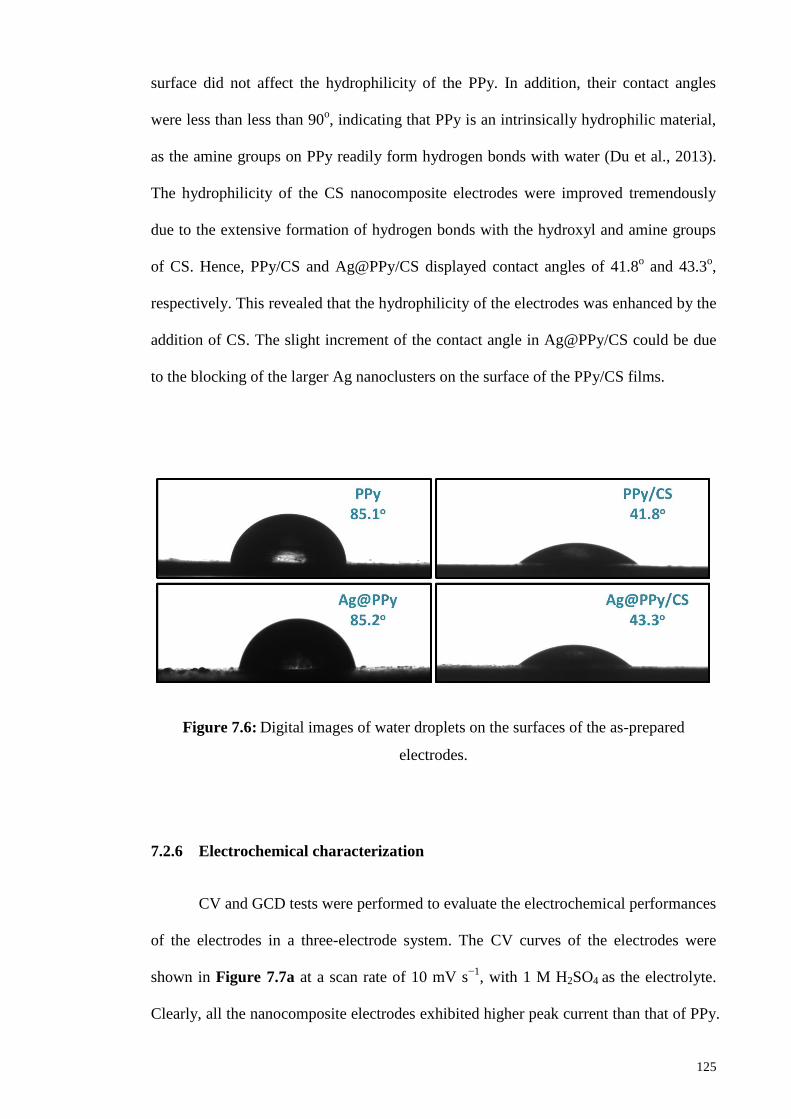
125
surface did not affect the hydrophilicity of the PPy. In addition, their contact angles
were less than less than 90o, indicating that PPy is an intrinsically hydrophilic material,
as the amine groups on PPy readily form hydrogen bonds with water (Du et al., 2013).
The hydrophilicity of the CS nanocomposite electrodes were improved tremendously
due to the extensive formation of hydrogen bonds with the hydroxyl and amine groups
of CS. Hence, PPy/CS and Ag@PPy/CS displayed contact angles of 41.8o and 43.3
o,
respectively. This revealed that the hydrophilicity of the electrodes was enhanced by the
addition of CS. The slight increment of the contact angle in Ag@PPy/CS could be due
to the blocking of the larger Ag nanoclusters on the surface of the PPy/CS films.
Figure 7.6: Digital images of water droplets on the surfaces of the as-prepared
electrodes.
7.2.6 Electrochemical characterization
CV and GCD tests were performed to evaluate the electrochemical performances
of the electrodes in a three-electrode system. The CV curves of the electrodes were
shown in Figure 7.7a at a scan rate of 10 mV s−1
, with 1 M H2SO4 as the electrolyte.
Clearly, all the nanocomposite electrodes exhibited higher peak current than that of PPy.

126
Two pairs of redox peaks can be observed when Ag nanoparticles and Ag nanoclusters
are present in the nanocomposites. It has been reported that the electrochemical redox
behavior and the peak separation are dependent on the size of Ag particles (Chaki et al.,
2004; Ivanova & Zamborini, 2010). The Ag nanoparticles and Ag nanoclusters in the
nanocomposite electrodes can be distinguished easily from their redox peak. The anodic
and cathodic peaks of Ag nanoparticles in both nanocomposite electrodes are 0.19 and
0.01 V, respectively, having a peak separation of 0.18 V. Their redox peak potentials
are the same due to them having very close size ranges. The Ag nanoclusters in the
ternary nanocomposite Ag@PPy/CS displayed the anodic and cathodic peaks at 0.44
and 0.21, respectively, with a peak separation of 0.23 V. On the other hand, the Ag
nanoclusters in the binary nanocomposite Ag@PPy displayed a pair of redox peaks
located at 0.50 and 0.20, owing to the anodic and cathodic peak of Ag, with a peak
separation of 0.30 V. As the size of Ag increase, it is observed that the peak separation
between the anodic and cathodic peaks increases. This is due to the decrease in the
electron transfer with an increase in the size (Chaki et al., 2004). The CV results signify
the presence of hybrid Ag nanoparticles and Ag nanoclusters in the Ag@PPy and
Ag@PPy/CS nanocomposites. Table 7.1 summarizes detailed analysis of the
electrochemical parameters such as anodic and cathodic peak potentials, peak separation
obtained from the cyclic voltammograms at 10 mV s−1
scan rate, along with the size
range of Ag particles.

127
Figure 7.7: (a) CV curves at 10 mV s−1
and (b) GCD curves at 0.2 A g−1
of the as-
synthesized electrodes.
Table 7.1: Electrochemical data for Ag@PPy and Ag@PPy/CS nanocomposite
electrodes.
The GCD curves of the nanocomposite electrodes were shown in Figure 7.7b.
Ag@PPy/CS showed the longest discharge time, revealing that it has the highest
specific capacitance among the other electrodes. Hence, the specific capacitances
calculated from the discharge curve at 0.2 A g−1
were 273, 403, 414 and 513 F g−1
for
PPy, PPy/CS, Ag@PPy and Ag@PPy/CS. The Ag@PPy/CS outperformed the other
electrodes due to the synergetic contribution from the Ag particles and CS. The Ag
nanoparticles increase the electrical conductivity of the PPy by enhancing the electron
hopping along the conjugated PPy chains while the bigger Ag nanoclusters prevent the
Electrode Types of Ag
particles
Size
range
(nm)
Anodic
peak
Ea (V)
Cathodic
peak
Ec (V)
Peak
separation
∆E (V)
Ag@PPy Ag nanoparticles 2 – 4 0.19 0.01 0.18
Ag nanoclusters 55 – 100 0.50 0.20 0.30
Ag@PPy/CS Ag nanoparticles 1 – 2 0.19 0.01 0.18
Ag nanoclusters 30 – 80 0.44 0.21 0.23
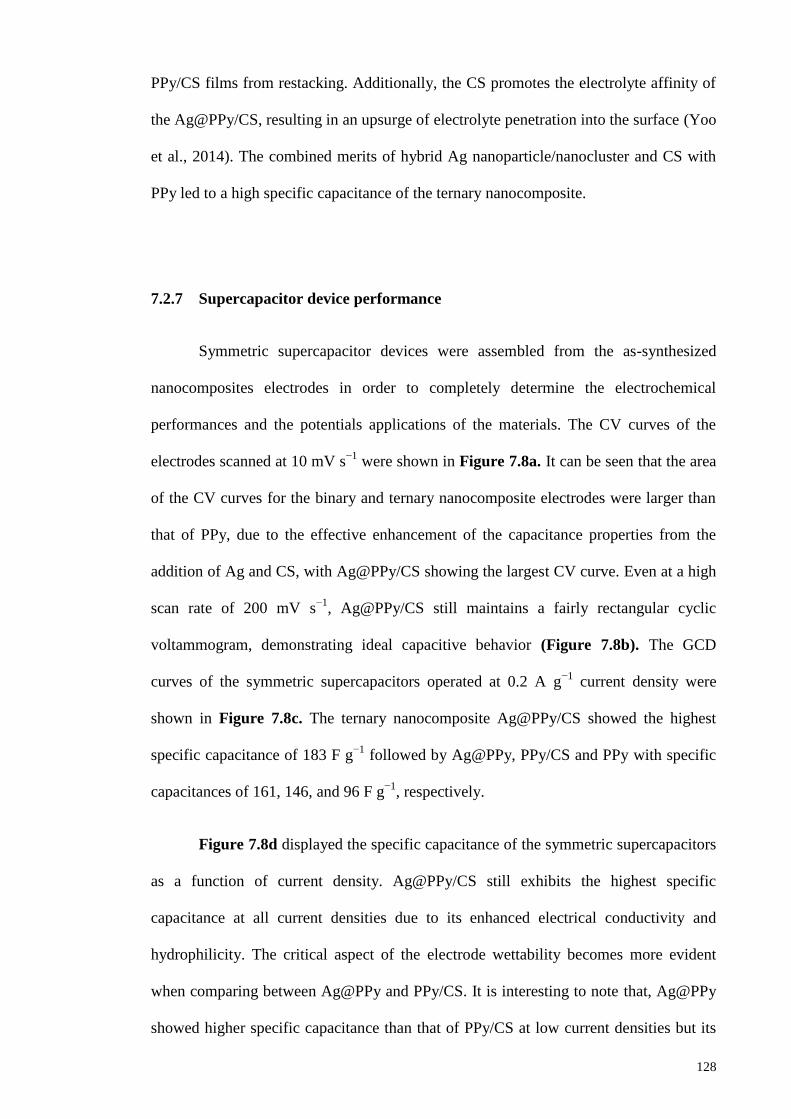
128
PPy/CS films from restacking. Additionally, the CS promotes the electrolyte affinity of
the Ag@PPy/CS, resulting in an upsurge of electrolyte penetration into the surface (Yoo
et al., 2014). The combined merits of hybrid Ag nanoparticle/nanocluster and CS with
PPy led to a high specific capacitance of the ternary nanocomposite.
7.2.7 Supercapacitor device performance
Symmetric supercapacitor devices were assembled from the as-synthesized
nanocomposites electrodes in order to completely determine the electrochemical
performances and the potentials applications of the materials. The CV curves of the
electrodes scanned at 10 mV s−1
were shown in Figure 7.8a. It can be seen that the area
of the CV curves for the binary and ternary nanocomposite electrodes were larger than
that of PPy, due to the effective enhancement of the capacitance properties from the
addition of Ag and CS, with Ag@PPy/CS showing the largest CV curve. Even at a high
scan rate of 200 mV s−1
, Ag@PPy/CS still maintains a fairly rectangular cyclic
voltammogram, demonstrating ideal capacitive behavior (Figure 7.8b). The GCD
curves of the symmetric supercapacitors operated at 0.2 A g−1
current density were
shown in Figure 7.8c. The ternary nanocomposite Ag@PPy/CS showed the highest
specific capacitance of 183 F g−1
followed by Ag@PPy, PPy/CS and PPy with specific
capacitances of 161, 146, and 96 F g−1
, respectively.
Figure 7.8d displayed the specific capacitance of the symmetric supercapacitors
as a function of current density. Ag@PPy/CS still exhibits the highest specific
capacitance at all current densities due to its enhanced electrical conductivity and
hydrophilicity. The critical aspect of the electrode wettability becomes more evident
when comparing between Ag@PPy and PPy/CS. It is interesting to note that, Ag@PPy
showed higher specific capacitance than that of PPy/CS at low current densities but its

129
performance rapidly degrades at higher current densities, rendering it to perform poorer
than PPy/CS. Generally, the specific capacitance decreases with increasing current
density because of the lower charge mobilization of the electrolyte ions per unit time. A
more hydrophilic electrode will allow rapid infiltration of electrolyte ions into the
framework of the electrode; hence more capacitance can be retained at high current
densities. Therefore, the PPy/CS has higher specific capacitance than Ag@PPy at high
current densities.
Figure 7.8: (a) CV curves at 10 mV s−1
, (b) CV curves of Ag@PPy/CS symmetric
supercapacitor at various scan rates, (c) GCD curves at 0.2 A g−1
, and (d) comparison of
the dependence of specific capacitance on the current density of the symmetric
supercapacitors.
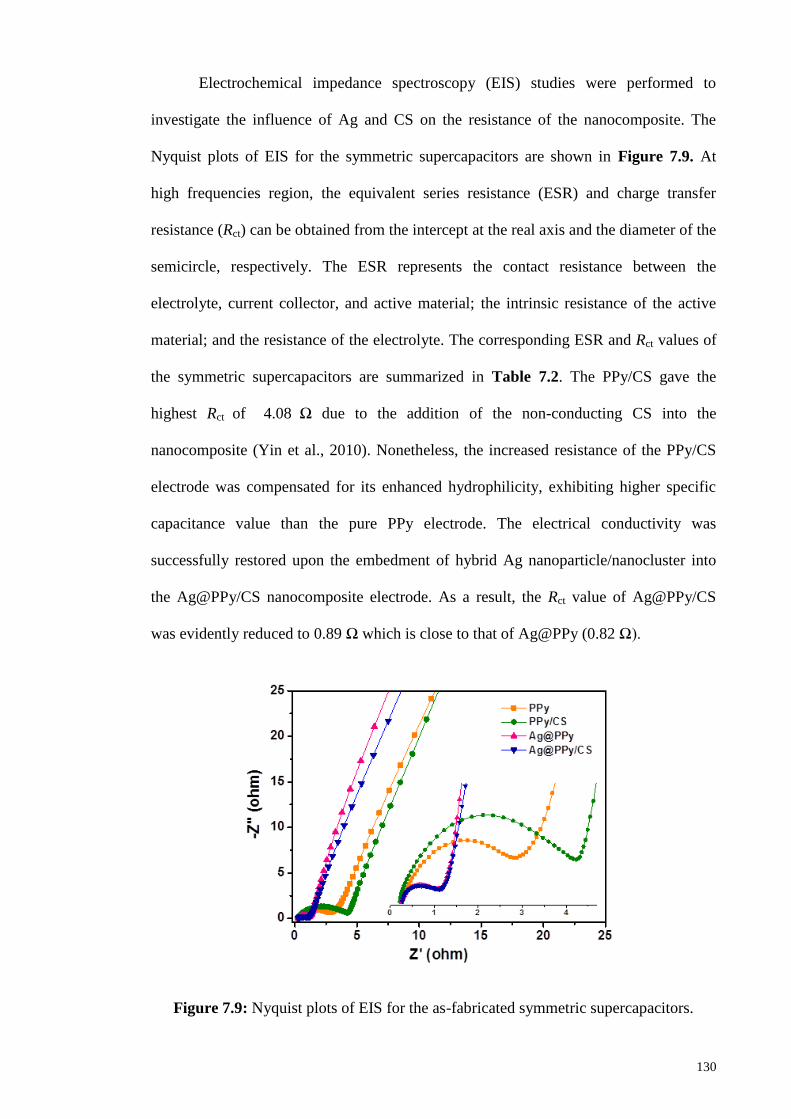
130
Electrochemical impedance spectroscopy (EIS) studies were performed to
investigate the influence of Ag and CS on the resistance of the nanocomposite. The
Nyquist plots of EIS for the symmetric supercapacitors are shown in Figure 7.9. At
high frequencies region, the equivalent series resistance (ESR) and charge transfer
resistance (Rct) can be obtained from the intercept at the real axis and the diameter of the
semicircle, respectively. The ESR represents the contact resistance between the
electrolyte, current collector, and active material; the intrinsic resistance of the active
material; and the resistance of the electrolyte. The corresponding ESR and Rct values of
the symmetric supercapacitors are summarized in Table 7.2. The PPy/CS gave the
highest Rct of 4.08 Ω due to the addition of the non-conducting CS into the
nanocomposite (Yin et al., 2010). Nonetheless, the increased resistance of the PPy/CS
electrode was compensated for its enhanced hydrophilicity, exhibiting higher specific
capacitance value than the pure PPy electrode. The electrical conductivity was
successfully restored upon the embedment of hybrid Ag nanoparticle/nanocluster into
the Ag@PPy/CS nanocomposite electrode. As a result, the Rct value of Ag@PPy/CS
was evidently reduced to 0.89 Ω which is close to that of Ag@PPy (0.82 Ω).
Figure 7.9: Nyquist plots of EIS for the as-fabricated symmetric supercapacitors.

131
Table 7.2: The ESR and Rct values of the symmetric supercapacitors obtained from the
Nyquist plots.
The Ragone plots of the symmetric supercapacitors calculated from the GCD
curves are shown in Figure 7.10a. The Ag@PPy/CS nanocomposite electrode had an
energy density of 16.3 W h kg−1
at a power density of 322 W kg−1
. The power density
can be improved to 8707 W kg−1
at an energy density of 7.0 W h kg−1
. The energy and
power density of the Ag@PPy/CS nanocomposite electrode was superior to Ag@PPy,
PPy/CS and PPy, proving the active involvement of the hybrid Ag
nanoparticle/nanocluster and CS in improving the electrochemical properties of the PPy.
The cycling stability of the electrodes was accessed over 1000 charge/discharge
cycle at 0.5 A g−1
and are shown in Figure 7.10b. The Ag@PPy/CS and Ag@PPy
revealed good capacitance retention, retaining up to 98.3% and 98.9%, respectively. The
rapid increment of the specific capacitance in the first 100 cycles of the PPy/CS is
believed to be caused by the good water absorbency of CS (Huang et al., 2013), but still
able to retained up to 94.0% of its initial capacitance. PPy only retained 88.8%
capacitance due to its excessive swelling and shrinking of the polymer chains during the
charge/discharge process (Zhang et al., 2009). The improved cycling stability of the
binary and ternary nanocomposites revealed that the electrochemical stability of PPy
has been enhanced.
Electrodes ESR (Ω) Rct (Ω)
PPy 0.30 2.90
PPy/CS 0.22 4.08
Ag@PPy 0.26 0.82
Ag@PPy/CS 0.28 0.89

132
Figure 7.10: (a) Ragone plots, and (b) cycling stability plots for the symmetric
supercapacitors.
7.3 Conclusion
In this study, we demonstrate a facile one-step electrodeposition to produce a
Ag@PPy/CS nanocomposite. The results show that Ag@PPy/CS nanocomposite
electrode is beneficial for the transportation of both electrolyte ions and electrons,
leading to high electrochemical performance. Firstly, the increased accessibility of
electrolyte ions is due to the enhanced hydrophilicity contributed by CS. Secondly, the
coordination of CS with Ag stabilized the growth of metallic Ag, reducing the particle
size of the hybrid Ag nanoparticle/nanocluster. Thirdly, the evenly distributed ultra-
small Ag nanoparticles (1-2 nm) enhanced the electron hopping system of the
conjugated PPy. Finally, the larger Ag nanoclusters in the size range of 30-80 nm acted
as spacers, preventing the restacking of PPy/CS films besides improving the electrical
conductivity of the nanocomposite. The elegant synergy between CS and Ag boosted
the supercapacitive properties of PPy making it a promising candidate for application as
electrode for high-performance supercapacitors.

133
CHAPTER 8
CONCLUSION AND FUTURE WORK RECOMMENDATIONS
8.1 Conclusion
The aim of this research was to develop PPy-based nanocomposites, which was
intended to harness the unique physical and electrochemical benefits of PPy. The
synthesis and electrochemical characterization of four different PPy-based
nanocomposites were presented in this work.
Firstly, the PPy was paired up with another class of pseudocapacitor, MnO2. The
facile mixing of KMnO4 and pyrrole gave rise to PPy/MnO2 nanocomposite. Various
morphologies were synthesized by varying the pH value of the reaction mixture. When
the solution pH increased from 1.0 to 7.8, the morphologies of the PPy/MnO2
nanocomposite changed from a compact sheet-like structure to a highly porous structure
and finally to a granular structure. The porous morphology obtained at pH 4.0 showed
the highest specific surface area of 230 m2 g
−1 thereby displayed the highest specific
capacitance of 306 F g−1
compared to the other PPy/MnO2 prepared at different pH
values.
PPy/CS was the second nanocomposite explored in this work. Even though CS
is a non-conductive material as observed from the increased Rct in the EIS data,
however, it offered excellent hydrophilic nature to the PPy/CS. The good electrode
wettability of the PPy/CS nanocomposite electrode encouraged better electrolyte
infiltration into the electrode. This enhanced hydrophilic property compensated the
increased resistivity of the PPy/CS. Therefore, the specific capacitance was improved
accordingly from 273 to 403 F g−1
for PPy to PPy/CS, respectively.

134
The third part of this work featured a hybrid Ag nanoparticle/nanocluster
decorated on PPy. The unique hybrid Ag nanoparticle/nanocluster was optimized at
0.05 M AgNO3. Incorporation of metallic Ag undoubtedly improved the
electrochemical properties of PPy due to the highly conductive Ag nanoparticles and Ag
nanoclusters. Moreover, the larger Ag nanoclusters suppress the restacking of PPy films,
extending the active sites for redox reactions. As a result, the Ag@PPy showed a
maximum of specific capacitance of 414 F g−1
.
The fourth PPy-based nanocomposite presented in this thesis is Ag@PPy/CS.
The combined advantages of both Ag and CS successfully enhanced the electrical
conductivity and hydrophilicity of the ternary nanocomposite. Additionally, the
presence of the biopolymer chitosan acted as a stabilizer for the growth of Ag particles,
producing smaller sizes of Ag nanoparticle/nanocluster in Ag@PPy/CS as compared to
Ag@PPy. As a consequence of the improved electron and electrolyte ion transport, the
ternary nanocomposite displayed a specific capacitance of 513 F g−1
.
The PPy nanocomposite (PPy/MnO2, PPy/CS, Ag@PPy and Ag@PPy/CS)
presented in this thesis was formed by strategically combining electroactive and non-
electroactive materials into PPy in order to improve its supercapacitive performance.
The evaluation of the physical structure and morphology, in conjunction with
electrochemical measurements, revealed that the PPy-based nanocomposite as a novel
and promising class of electrode materials for high-performance supercapacitors.

135
8.2 Future work recommendations
Supercapacitors are still needed to address the critical performance gap between
batteries and conventional capacitors. Designing high-performance supercapacitors with
high specific capacitance, high energy density and good cycling stability are required
due to the rapidly growing demands on energy storage devices. This thesis is finalized
with recommendations for further research works based on this research.
In this research, the aqueous electrolytes Na2SO4 and H2SO4 were used for the
electrochemical characterization of the as-prepared nanocomposite electrodes. However,
the operating voltage of aqueous electrolytes is often limited by the decomposition
potential of water which is at 1.23 V. This limits their practical employment in
supercapacitor applications as energy density is largely dependent on the operating
charge discharge of the supercapacitor. Hence, organic and ionic liquid electrolyte can
be used to replace the current aqueous electrolyte. The higher decomposition potential
of organic electrolytes allow the operating voltage to go above 2 V and even up to 3 V
for ionic liquid as mentioned in the literature review section in this thesis. Employing
these electrolytes can dramatically boost the energy density of the PPy-based
nanocomposite electrodes.
Another way of widening the operating voltage of the supercapacitor electrode is
by fabricating asymmetric supercapacitors. Therefore, researches on asymmetric
supercapacitors are recommended. Normally carbon-based electrodes are employed as
the negative electrode whereas pseudocapacitors are used as the positive electrode
because of their complementary working potential windows. In asymmetric
supercapacitors, the pseudocapacitors electrode can reach for a higher voltage, while the
minimum potential of the carbon-based electrode is extended towards more negative

136
potential values. This allows the cell voltages to reach up to 2 V or more, significantly
improving the energy density (Demarconnay et al., 2011; Gao et al., 2012).
Finally, as CS and Ag are neither EDLC nor pseudocapacitors, their
incorporation of Ag and CS into PPy presented in chapter 5, 6 and 7 can pave the way
for designing new hybrid supercapacitor electrodes with desirable properties. The
results reported in this thesis may provide useful information for further researches into
the employment of non-electroactive materials with common electroactive materials.

137
REFERENCES
Abulizi, A., Yang, G. H., Okitsu, K., & Zhu, J.-J. (2014). Synthesis of MnO2
nanoparticles from sonochemical reduction of MnO4- in water under different pH
conditions. Ultrasonics Sonochemistry, 21: 1629–1634.
Akmaz, S., Adıgüzel, E. D., Yasar, M., & Erguven, O. (2013). The effect of Ag content
of the chitosan-silver nanoparticle composite material on the structure and
antibacterial activity. Advances in Materials Science and Engineering, 2013: 12–
18.
Allen, M. J., Tung, V. C., & Kaner, R. B. (2010). Honeycomb carbon: a review of
graphene. Chemical Reviews, 110: 132–145.
Amarnath, C. A., Hong, C. E., Kim, N. H., Ku, B.-C., Kuila, T., & Lee, J. H. (2011).
Efficient synthesis of graphene sheets using pyrrole as a reducing agent. Carbon,
49: 3497–3502.
An, H., Wang, Y., Wang, X. X., Zheng, L., Wang, X. X., Yi, L., Bai, L., & Zhang, X.
(2010). Polypyrrole/carbon aerogel composite materials for supercapacitor.
Journal of Power Sources, 195: 6964–6969.
Andreas, H. A., & Conway, B. E. (2006). Examination of the double-layer capacitance
of an high specific-area C-cloth electrode as titrated from acidic to alkaline pHs.
Electrochimica Acta, 51: 6510–6520.
Ansari, R. (2006). Polypyrrole Conducting Electroactive Polymers: Synthesis and
Stability Studies. E-Journal of Chemistry, 3: 186–201.
Ayad, M., Salahuddin, N., Fayed, A., Bastakoti, B. P., Suzuki, N., & Yamauchi, Y.
(2014). Chemical design of a smart chitosan–polypyrrole–magnetite
nanocomposite toward efficient water treatment. Phys. Chem. Chem. Phys., 16:
21812–21819.
Babu, K. F., Dhandapani, P., Maruthamuthu, S., & Kulandainathan, M. A. (2012). One
pot synthesis of polypyrrole silver nanocomposite on cotton fabrics for
multifunctional property. Carbohydrate Polymers, 90: 1557–1563.
Bahloul, A., Nessark, B., Briot, E., Groult, H., Mauger, A., Zaghib, K., & Julien, C. M.
(2013). Polypyrrole-covered MnO2 as electrode material for supercapacitor.
Journal of Power Sources, 240: 267–272.
Baños, R., Manzano-Agugliaro, F., Montoya, F. G., Gil, C., Alcayde, a., & Gómez, J.
(2011). Optimization methods applied to renewable and sustainable energy: A
review. Renewable and Sustainable Energy Reviews, 15: 1753–1766.
Becker, H.I 1957 Patent US280616 (1957). Low voltage electrolytic capacitor.
138
Biswas, S., & Drzal, L. T. (2010). Multilayered nanoarchitecture of graphene
nanosheets and polypyrrole nanowires for high performance supercapacitor electrodes.
Chemistry of Materials, 5667–5671.
Bordjiba, T., Mohamedi, M., & Dao, L. H. (2008). New class of carbon-nanotube
aerogel electrodes for electrochemical power sources. Advanced Materials, 20:
815–819.
Brousse, T., Bélanger, D., & Long, J. W. (2015). To be or not to be pseudocapacitive?
Journal of the Electrochemical Society, 162: A5185–A5189.
Burke, A. (2000). Ultracapacitors: Why, how, and where is the technology. Journal of
Power Sources, 91: 37–50.
Burke, A. (2007). R&D considerations for the performance and application of
electrochemical capacitors. Electrochimica Acta, 53: 1083–1091.
Calvo, E. G., Lufrano, F., Staiti, P., Brigandì, A., Arenillas, A., & Menéndez, J. A.
(2013). Optimizing the electrochemical performance of aqueous symmetric
supercapacitors based on an activated carbon xerogel. Journal of Power Sources,
241: 776–782.
Cao, J., Wang, Y., Chen, J., Li, X., Walsh, F. C., Ouyang, J., Jia, D., & Zhou, Y. (2015).
Three-dimensional graphene oxide/polypyrrole composite electrodes fabricated by
one-step electrodeposition for high performance supercapacitors. Journal of
Materials Chemistry A, 3: 14445–14457.
Chaki, N. K., Sharma, J., Mandle, A. B., Mulla, I. S., Pasricha, R., Vijayamohanan, K.,
& Division, P. C. (2004). Size dependent redox behavior of monolayer protected
silver nanoparticles (2–7 nm) in aqueous medium. Physical Chemistry Chemical
Physics : PCCP, 6: 1304–1309.
Chang, H., & Wu, H. (2013). Graphene-based nanocomposites: preparation,
functionalization, and energy and environmental application. Energy &
Environmental Science, 6: 3483–3507.
Chang, J.-K., Lee, M.-T., Huang, C.-H., & Tsai, W.-T. (2008). Physicochemical
properties and electrochemical behavior of binary manganese–cobalt oxide
electrodes for supercapacitor applications. Materials Chemistry and Physics, 108:
124–131.
Chen, W., Fan, Z., Gu, L., Bao, X., & Wang, C. (2010). Enhanced capacitance of
manganese oxide via confinement inside carbon nanotubes. Chemical
Communications, 46: 3905–3907.
Cheng, Q., Tang, J., Ma, J., Zhang, H., Shinya, N., & Qin, L.-C. (2011). Graphene and
nanostructured MnO2 composite electrodes for supercapacitors. Carbon, 49: 2917–
2925.

139
Cheng, S., Yang, L., Liu, Y., Lin, W., Huang, L., Chen, D., Wong, C. P., & Liu, M.
(2013). Carbon fiber paper supported hybrid nanonet/nanoflower nickel oxide
electrodes for high-performance pseudo-capacitors. Journal of Materials
Chemistry A, 1: 7709–7716.
Cheng, Y., Mierlo, J. Van, Bosschet, P. Van Den, & Lataire, P. (2006). Using super
capacitor based energy storage to improve power quality in distributed power
generation. Power Electronics and Motion Control Conference, EPE-PEMC, 537 –
543.
Cherusseri, J., & Kar, K. K. (2015). Self-standing carbon nanotube forest electrodes for
flexible supercapacitors. RSC Advances, 5: 34335–34341.
Conway, B. E., Birss, V., & Wojtowicz, J. (1997). The role and utilization of
pseudocapacitance for energy storage by supercapacitors. Journal of Power
Sources, 66: 1–14.
Conway, B.E. (1999). Electrochemical supercapacitors: Scientific fundamentals and
technological applications. New York, Kluwer Academic/Plenum Press.
Cruz-Silva, R., Escamilla, A., Nicho, M. E., Padron, G., Ledezma-Perez, A., Arias-
Marin, E., Moggio, I., & Romero-Garcia, J. (2007). Enzymatic synthesis of pH-
responsive polyaniline colloids by using chitosan as steric stabilizer. European
Polymer Journal, 43: 3471–3479.
Cuentas-Gallegos, A. K., & Gómez-Romero, P. (2005). In-situ synthesis of polypyrrole-
MnO2−x nanocomposite hybrids. Journal of New Materials for Electrochemical
Systems, 188: 181–188.
Dai, Y., Li, J., Yan, G., Xu, G., Xue, Q., & Kang, F. (2015). Preparation of the cactus-
like porous manganese oxide assisted with surfactant sodium dodecyl sulfate for
supercapacitors. Journal of Alloys and Compounds, 621: 86–92.
Dai, Y. M., Tang, S. C., Ba, Z. X., Zhu, S. S., Wang, Q., Wang, C., & Meng, X. K.
(2014). Coating MnO2 nanowires by silver nanoparticles for an improvement of
capacitance performance. Materials Letters, 117: 104–107.
Davies, A., Audette, P., Farrow, B., Hassan, F., Chen, Z., Choi, J.-Y., & Yu, A. (2011).
Graphene-based flexible supercapacitors: pulse-electropolymerization of
polypyrrole on free-standing graphene films. The Journal of Physical Chemistry C,
115: 17612–17620.
Demarconnay, L., Raymundo-Piñero, E., & Béguin, F. (2011). Adjustment of electrodes
potential window in an asymmetric carbon/MnO2 supercapacitor. Journal of Power
Sources, 196: 580–586.
Dhibar, S., & Das, C. K. (2014). Silver nanoparticles decorated polyaniline/multiwalled
carbon nanotubes nanocomposite for high-performance supercapacitor electrode.
Industrial & Engineering Chemistry Research, 53: 3495–3508.
Donald, L.B. 1970 US3536963 (1970). Electrolytic capacitor having carbon paste
electrodes.

140
Douglas, H., & Pillay, P. (2005). Sizing ultracapacitors for hybrid electric vehicles.
Industrial Electronics Society, 2005. IECON 2005. 31st Annual Conference of
IEEE, 6.
Du, X., Hao, X., Wang, Z., Ma, X., Guan, G., Abuliti, A., Ma, G., & Liu, S. (2013).
Highly stable polypyrrole film prepared by unipolar pulse electro-polymerization
method as electrode for electrochemical supercapacitor. Synthetic Metals, 175:
138–145.
Dubal, D. P., Lee, S. H., Kim, J. G., Kim, W. B., & Lokhande, C. D. (2012). Porous
polypyrrole clusters prepared by electropolymerization for a high performance
supercapacitor. Journal of Materials Chemistry, 22: 3044–3052.
Dubal, D. P., Patil, S. V., Gund, G. S. S., & Lokhande, C. D. (2013). Polyaniline–
polypyrrole nanograined composite via electrostatic adsorption for high
performance electrochemical supercapacitors. Journal of Alloys and Compounds,
552: 240–247.
Dubal, D. P., Patil, S. V., Kim, W. B., & Lokhande, C. D. (2011). Supercapacitors
based on electrochemically deposited polypyrrole nanobricks. Materials Letters,
65: 2628–2631.
Energy Information Administration, 2013. Accessed on 5/10/2015,
http://www.eia.gov/todayinenergy/detail.cfm?id=12251
Erdenedelger, G., Lee, T., Dao, T. D., Kim, J. S., Kim, B.-S., & Jeong, H. M. (2014).
Solid-state functionalization of graphene with amino acids toward water-dispersity:
implications on a composite with polyaniline and its characteristics as a
supercapacitor electrode material. Journal of Materials Chemistry A, 2: 12526–
12534.
Fang, L., Liyan, Z., & Tao, X. (2015). Synthesis and performance study of nano-Ag
particles-chitosan-graphene composites synthesis and performance study of nano-
Ag. Integrated Ferroelectrics, 160: 10–17.
Fic, K., Lota, G., Meller, M., & Frackowiak, E. (2012). Novel insight into neutral
medium as electrolyte for high-voltage supercapacitors. Energy & Environmental
Science, 5: 5842–5850.
Frackowiak, E. (2007). Carbon materials for supercapacitor application. Physical
Chemistry Chemical Physics : PCCP, 9: 1774–1785.
Frackowiak, E., Khomenko, V., Jurewicz, K., Lota, K., & Béguin, F. (2006).
Supercapacitors based on conducting polymers/nanotubes composites. Journal of
Power Sources, 153: 413–418.
Fusco, S., Chatzipirpiridis, G., Sivaraman, K. M., Ergeneman, O., Nelson, B. J., & Pané,
S. (2013). Chitosan electrodeposition for microrobotic drug delivery. Advanced
Healthcare Materials, 2: 1037–1044.

141
Gan, J. K., Lim, Y. S., Huang, N. M., & Lim, H. N. (2015). Hybrid silver
nanoparticle/nanocluster-decorated polypyrrole for high-performance
supercapacitors. RSC Adv., 5: 75442–75450.
Gao, H., Xiao, F., Ching, C. B., & Duan, H. (2012). Flexible all-solid-state asymmetric
supercapacitors based on free-standing carbon nanotube/graphene and Mn3O4
nanoparticle/graphene paper electrodes. ACS Applied Materials & Interfaces, 4:
7020–7026.
García-Fernández, M. J., Buitrago-Sierra, R., Pastor-blas, M. M., Soares, O. S. G. P.,
Pereira, M. F. R., & Sepúlveda-Escribano, A. (2015). Green synthesis of
polypyrrole-supported metal catalysts: application to nitrate removal in water. RSC
Advances, 5: 32706–32713.
Ge, J., Yao, H.-B., Hu, W., Yu, X.-F., Yan, Y.-X., Mao, L.-B., Li, H.-H., Li, S.-S., &
Yu, S.-H. (2013). Facile dip coating processed graphene/MnO2 nanostructured
sponges as high performance supercapacitor electrodes. Nano Energy, 2: 505–513.
Geim, A. K., & Novoselov, K. S. (2007). The rise of graphene. Nature Materials, 6:
183–191.
Ghosh, A., Ra, E. J., Jin, M., Jeong, H.-K., Kim, T. H., Biswas, C., & Lee, Y. H. (2011).
High Pseudocapacitance from Ultrathin V2O5 Films Electrodeposited on Self-
Standing Carbon-Nanofiber Paper. Advanced Functional Materials, 21: 2541–2547.
Goodenough, J., Abruña, H., & Buchanan, M. (2007). Basic research needs For
electrical energy storage: Report of basic energy sciences workshop on energy
storage. Office of Basic Energy Sciences, DOE. Retrieved from
http://www.sc.doe.gov/bes/reports/files/EES_rpt.pdf
Gu, Z., Li, C., Wang, G., Zhang, L., Li, X., Wang, W., & Jin, S. (2010). Synthesis and
characterization of polypyrrole/graphite oxide composite by in situ emulsion
polymerization. Journal of Polymer Science Part B: Polymer Physics, 48: 1329–
1335.
Guo, Y., Sun, X., Liu, Y., Wang, W., Qiu, H., & Gao, J. (2012). One pot preparation of
reduced graphene oxide (RGO) or Au (Ag) nanoparticle-RGO hybrids using
chitosan as a reducing and stabilizing agent and their use in methanol
electrooxidation. Carbon, 50: 2513–2523.
Hao, P., Zhao, Z., Leng, Y., Tian, J., Sang, Y., Boughton, R. I., Wong, C. P., Liu, H., &
Yang, B. (2015). Graphene-based nitrogen self-doped hierarchical porous carbon
aerogels derived from chitosan for high performance supercapacitors. Nano Energy,
15: 9–23.
Hassan, S., Suzuki, M., & El-moneim, A. A. (2014). Synthesis of MnO2-chitosan
nanocomposite by one-step electrodeposition for electrochemical energy storage
application. Journal of Power Sources, 246: 68–73.
Hepowit, L. R., Kim, K. M., Kim, S. H., Ryu, K. S., Lee, Y. M., & Ko, J. M. (2012).
Supercapacitive properties of electrodeposited polypyrrole on acrylonitrile–
butadiene rubber as a flexible current collector. Polymer Bulletin, 69: 873–880.

142
Hnida, K. E., Socha, R. P., & Sulka, G. D. (2013). Polypyrrole−silver composite
nanowire arrays by cathodic co-deposition and their electrochemical properties.
The Journal of Physical Chemistry C.
Hu, C.-C., Chen, W.-C., & Chang, K.-H. (2004). How to Achieve Maximum Utilization
of Hydrous Ruthenium Oxide for Supercapacitors. Journal of The Electrochemical
Society.
Hu, C.-C., Liu, M.-J., & Chang, K.-H. (2007). Anodic deposition of hydrous ruthenium
oxide for supercapacitors. Journal of Power Sources, 163: 1126–1131.
Huang, H., Wu, J., Lin, X., Li, L., Shang, S., Yuen, M. C., & Yan, G. (2013). Self-
assembly of polypyrrole/chitosan composite hydrogels. Carbohydrate Polymers,
95: 72–76.
Huang, Z.-D., Zhang, B., Oh, S., Zheng, Q., Lin, X., Yousefi, N., & Kim, J.-K. (2012).
Self-assembled reduced graphene oxide/carbon nanotube thin films as electrodes
for supercapacitors. Journal of Materials Chemistry, 22: 3591–3599.
Huo, Y.-Q., Zhang, S.-B., & Zhang, H.-Y. (2014). Capacitive performance of
polyaniline/manganese dioxide nanofiber microsphere. Journal of Applied Polymer
Science, 131: 40575.
Inagaki, M., Konno, H., & Tanaike, O. (2010). Carbon materials for electrochemical
capacitors. Journal of Power Sources, 195: 7880–7903.
Ivanova, O. S., & Zamborini, F. P. (2010). Size-dependent electrochemical oxidation of
silver nanoparticles. Journal of the American Chemical Society, 132: 70–72.
Izrini, N., Rameshkumar, P., Pandikumar, A., Ikhsan, N. I., Rameshkumar, P.,
Pandikumar, A., Shahid, M. M., Huang, N. M., Kumar, S. V., Lim, H. N., Izrini,
N., Rameshkumar, P., & Pandikumar, A. (2015). Facile synthesis of graphene
oxide-silver nanocomposite and its modified electrode for enhanced
electrochemical detection of nitrite ions. Talanta, 144: 908–914.
Jagadale, A. D., Kumbhar, V. S., Bulakhe, R. N., & Lokhande, C. D. (2014). Influence
of electrodeposition modes on the supercapacitive performance of Co3O4
electrodes. Energy, 64: 234–241.
Ji, Z.-H., Dong, B., Liu, Y.-Q., & Liu, C.-G. (2012). The effect of pH and anions on the
anisotropic growth of MnO2. Materials Research Bulletin, 47: 3377–3382.
Ju, Y.-W., Choi, G., Jung, H.-R., & Lee, W.-J. (2008). Electrochemical properties of
electrospun PAN/MWCNT carbon nanofibers electrodes coated with polypyrrole.
Electrochimica Acta, 53: 5796–5803.
Keskinen, J., Tuurala, S., Sjödin, M., Kiri, K., Nyholm, L., Flyktman, T., Strømme, M.,
& Smolander, M. (2015). Asymmetric and symmetric supercapacitors based on
polypyrrole and activated carbon electrodes. Synthetic Metals, 203: 192–199.

143
Khomenko, V., Frackowiak, E., & Béguin, F. (2005). Determination of the specific
capacitance of conducting polymer/nanotubes composite electrodes using different
cell configurations. Electrochimica Acta, 50: 2499–2506.
Kierzek, K., Frackowiak, E., Lota, G., Gryglewicz, G., & Machnikowski, J. (2004).
Electrochemical capacitors based on highly porous carbons prepared by KOH
activation. Electrochimica Acta, 49: 515–523.
Kim, B.-H., Kim, C. H., Yang, K. S., Rahy, A., & Yang, D. J. (2012). Electrospun
vanadium pentoxide/carbon nanofiber composites for supercapacitor electrodes.
Electrochimica Acta, 83: 335–340.
Kim, D.-S. (2004). Activated carbon from peach stones using phosphoric acid activation
at medium temperatures. Journal of Environmental Science and Health, Part A, 39:
1301–1318.
Kim, J.-H., Lee, Y.-S., Sharma, A. K., & Liu, C. G. (2006). Polypyrrole/carbon
composite electrode for high-power electrochemical capacitors. Electrochimica
Acta, 52: 1727–1732.
Koev, S. T., Dykstra, P. H., Luo, X., Rubloff, G. W., Bentley, W. E., Payne, G. F., &
Ghodssi, R. (2010). Chitosan: an integrative biomaterial for lab-on-a-chip devices.
Lab on a Chip, 10: 3026–3042.
Kumar, G. G., Awan, Z., Nahm, K. S., & Xavier, J. S. (2014). Nanotubular
MnO2/graphene oxide composites for the application of open air-breathing cathode
microbial fuel cells. Biosensors and Bioelectronics, 53: 528–534.
Kuperman, A., & Aharon, I. (2011). Battery–ultracapacitor hybrids for pulsed current
loads: A review. Renewable and Sustainable Energy Reviews, 15: 981–992.
Lai, J., Levy, S., & Rose, M. F. (1992). High energy density double-layer capacitors for
energy storage applications. Aerospace and Electronic Systems Magazine, IEEE,
14–19.
Lee, H. Y., & Goodenough, J. B. (1999). Supercapacitor Behavior with KCl Electrolyte.
Journal of Solid State Chemistry, 144: 220–223.
Lee, R.-J., Temmer, R., Tamm, T., Aabloo, A., & Kiefer, R. (2013). Renewable
antioxidant properties of suspensible chitosan–polypyrrole composites. Reactive
and Functional Polymers, 73: 1072–1077.
Lee, Y.-H., Chang, K.-H., & Hu, C.-C. (2013). Differentiate the pseudocapacitance and
double-layer capacitance contributions for nitrogen-doped reduced graphene oxide
in acidic and alkaline electrolytes. Journal of Power Sources, 227: 300–308.
Lei, Y., Daffos, B., Taberna, P. L., Simon, P., & Favier, F. (2010). MnO2-coated Ni
nanorods: enhanced high rate behavior in pseudo-capacitive supercapacitor.
Electrochimica Acta, 55: 7454–7459.

144
Li, C., Wang, D., Liang, T., Wang, X., & Ji, L. (2004). A study of activated carbon
nanotubes as double-layer capacitors electrode materials. Materials Letters, 58:
3774–3777.
Li, J., Cui, L., & Zhang, X. (2010). Preparation and electrochemistry of one-
dimensional nanostructured MnO2/PPy composite for electrochemical capacitor.
Applied Surface Science, 256: 4339–4343.
Li, Q., Liu, J., Zou, J., Chunder, A., Chen, Y., & Zhai, L. (2011). Synthesis and
electrochemical performance of multi-walled carbon nanotube/polyaniline/MnO2
ternary coaxial nanostructures for supercapacitors. Journal of Power Sources, 196:
565–572.
Li, X., & Wei, B. (2012). Facile synthesis and super capacitive behavior of
SWNT/MnO2 hybrid films. Nano Energy, 1: 479–487.
Li, X., & Zhitomirsky, I. (2013). Electrodeposition of polypyrrole-carbon nanotube
composites for electrochemical supercapacitors. Journal of Power Sources, 221:
49–56.
Li, Y., Pang, X., Epand, R. F., & Zhitomirsky, I. (2011). Electrodeposition of chitosan–
hemoglobin films. Materials Letters, 65: 1463–1465.
Liang, K., Tang, X., & Hu, W. (2012). High-performance three-dimensional
nanoporous NiO film as a supercapacitor electrode. Journal of Materials
Chemistry, 22: 11062–11067.
Lim, S. P., Pandikumar, A., Huang, N. M., & Lim, H. N. (2014). Enhanced photovoltaic
performance of silver@itania plasmonic photoanode in dye-sensitized solar cells.
RSC Advances, 4: 38111–38118.
Lim, Y. S., Tan, Y. P., Lim, H. N., Huang, N. M., & Tan, W. T. (2013). Preparation and
characterization of polypyrrole/graphene nanocomposite films and their
electrochemical performance. Journal of Polymer Research, 20: 156.
Lim, Y. S., Tan, Y. P., Lim, H. N., Huang, N. M., Tan, W. T., Yarmo, M. A., & Yin,
C.-Y. (2014). Potentiostatically deposited polypyrrole/graphene decorated nano-
manganese oxide ternary film for supercapacitors. Ceramics International, 40:
3855–3864.
Ling, Z., Wang, G., Zhang, M., Fan, X., Yu, C., Yang, J., Xiao, N., & Qiu, J. (2015).
Boric acid-mediated B,N-codoped chitosan-derived porous carbons with a high
surface area and greatly improved supercapacitor performance. Nanoscale, 7:
5120–5125.
Liu, Y., Peng, X., Ye, H., Xu, J., & Chen, F. (2015). Fabrication and properties of
conductive chitosan/polypyrrole composite fibers. Polymer-Plastics Technology
and Engineering, 54: 411–415.

145
Long, C., Jiang, L., Wu, X., Jiang, Y., Yang, D., Wang, C., Wei, T., & Fan, Z. (2015).
Facile synthesis of functionalized porous carbon with three-dimensional
interconnected pore structure for high volumetric performance supercapacitors.
Carbon, 93: 412–420.
Lozano-Castelló, D., Cazorla-Amorós, D., Linares-Solano, A., Shiraishi, S., Kurihara,
H., & Oya, A. (2003). Influence of pore structure and surface chemistry on electric
double layer capacitance in non-aqueous electrolyte. Carbon, 41: 1765–1775.
Lu, X., Wang, G., Zhai, T., Yu, M., Gan, J., Tong, Y., & Li, Y. (2012). Hydrogenated
TiO2 Nanotube Arrays for Supercapacitors. Nano Letters, 12: 1690–1696.
Luo, X. L., Xu, J. J., Zhang, Q., Yang, G. J., & Chen, H. Y. (2005). Electrochemically
deposited chitosan hydrogel for horseradish peroxidase immobilization through
gold nanoparticles self-assembly. Biosensors and Bioelectronics, 21: 190–196.
Lust, E., Jänes, a, & Arulepp, M. (2004). Influence of solvent nature on the
electrochemical parameters of electrical double layer capacitors. Journal of
Electroanalytical Chemistry, 562: 33–42.
Maxwell Technologies. Accessed on 20/11/2015, http://www.maxwell.com/
Mazda. Accessed on 20/11/2015, http://www2.mazda.com/en/technology/env/i-eloop/
Meng, C., Liu, C., & Fan, S. (2009). Flexible carbon nanotube/polyaniline paper-like
films and their enhanced electrochemical properties. Electrochemistry
Communications, 11: 186–189.
Mi, J., Wang, X. R., Fan, R. J., Qu, W. H., & Li, W. C. (2012). Coconut-shell-based
porous carbons with a tunable micro/mesopore ratio for high-performance
supercapacitors. Energy and Fuels, 26: 5321–5329.
Misnon, I. I., Zain, N. K. M., Aziz, R. A., Vidyadharan, B., & Jose, R. (2015).
Electrochemical properties of carbon from oil palm kernel shell for high
performance supercapacitors. Electrochimica Acta, 174: 78–86.
Muthulakshmi, B., Kalpana, D., Pitchumani, S., & Renganathan, N. G. (2006).
Electrochemical deposition of polypyrrole for symmetric supercapacitors. Journal
of Power Sources, 158: 1533–1537.
Navale, S. T., Mali, V. V., Pawar, S. a., Mane, R. S., Naushad, M., Stadler, F. J., & Patil,
V. B. (2015). Electrochemical supercapacitor development based on
electrodeposited nickel oxide film. RSC Adv., 5: 51961–51965.
Ng, C. H., Lim, H. N., Lim, Y. S., Chee, W. K., & Huang, N. M. (2014). Fabrication of
flexible polypyrrole/graphene oxide/manganese oxide supercapacitor. International
Journal of Energy Research, 39: 344–355.
Oh, J., Kozlov, M. E., Kim, B. G., Kim, H.-K., Baughman, R. H., & Hwang, Y. H.
(2008). Preparation and electrochemical characterization of porous SWNT–PPy
nanocomposite sheets for supercapacitor applications. Synthetic Metals, 158: 638–
641.

146
Ong, L. K., Kurniawan, a., Suwandi, a. C., Lin, C. X., Zhao, X. S., & Ismadji, S.
(2012). A facile and green preparation of durian shell-derived carbon electrodes for
electrochemical double-layer capacitors. Progress in Natural Science: Materials
International, 22: 624–630.
Ozdemir, I., Şahin, M., Orhan, R., & Erdem, M. (2014). Preparation and
characterization of activated carbon from grape stalk by zinc chloride activation.
Fuel Processing Technology, 125: 200–206.
Pan, H., Li, J., & Feng, Y. P. (2010). Carbon nanotubes for supercapacitor. Nanoscale
Research Letters, 5: 654–668.
Pandiselvi, K., & Thambidurai, S. (2014). Chitosan-ZnO/polyaniline ternary
nanocomposite for high-performance supercapacitor. Ionics, 20: 551–561.
Pang, S. C., Anderson, M. a, & Chapman, T. W. (2000). Novel electrode materials for
thin-film ultracapacitors: Comparison of electrochemical properties of sol-gel-
derived and electrodeposited manganese dioxide. Journal of The Electrochemical
Society, 147: 444–450.
Patil, D. S., Pawar, S. A., Devan, R. S., Gil, M., Ma, Y.-R., Hyeok, J., & Patil, P. S.
(2013). Electrochemical supercapacitor electrode material based on polyacrylic
acid/polypyrrole/silver composite. Electrochimica Acta, 105: 569–577.
Patil, D. S., Shaikh, J. S., Pawar, S. A., Devan, R. S., Ma, Y. R., Moholkar, A. V., Kim,
J. H., Kalubarme, R. S., Park, C. J., & Patil, P. S. (2012). Investigations on
silver/polyaniline electrodes for electrochemical supercapacitors. Physical
Chemistry Chemical Physics : PCCP, 14: 11886–95.
Pawar, D. K., Shaikh, J. S., Pawar, B. S., Pawar, S. M., Patil, P. S., & Kolekar, S. S.
(2012). Synthesis of hydrophilic nickel zinc ferrite thin films by chemical route for
supercapacitor application. Journal of Porous Materials, 19: 649–655.
Pusawale, S. N., Deshmukh, P. R., Gunjakar, J. L., & Lokhande, C. D. (2013). SnO2-
RuO2 composite films by chemical deposition for supercapacitor application.
Materials Chemistry and Physics, 139: 416–422.
Qi, F., Wang, Y., Ma, T., Zhu, S., Zeng, W., Hu, X., Liu, Z., Huang, J., & Luo, Z.
(2013). Electrical regulation of olfactory ensheathing cells using conductive
polypyrrole/chitosan polymers. Biomaterials, 34: 1799–1809.
Ra, E. J., Raymundo-Piñero, E., Lee, Y. H., & Béguin, F. (2009). High power
supercapacitors using polyacrylonitrile-based carbon nanofiber paper. Carbon, 47:
2984–2992.
Raicopol, M., Pruna, A., & Pilan, L. (2013). Supercapacitance of single-walled carbon
nanotubes-polypyrrole composites. Journal of Chemistry, 2013: 367473.
Ramya, R., Sivasubramanian, R., & Sangaranarayanan, M. V. (2013). Conducting
polymers-based electrochemical supercapacitors—progress and prospects.
Electrochimica Acta, 101: 109–129.

147
Ren, B., Fan, M., Liu, Q., Wang, J., Song, D., & Bai, X. (2013). Hollow NiO nanofibers
modified by citric acid and the performances as supercapacitor electrode.
Electrochimica Acta, 92: 197–204.
Ricketts, B. W., & Ton-That, C. (2000). Self-discharge of carbon-based supercapacitors
with organic electrolytes. Journal of Power Sources, 89: 64–69.
Ryu, K. S., Kim, K. M., Park, N.-G., Park, Y. J., & Chang, S. H. (2002). Symmetric
redox supercapacitor with conducting polyaniline electrodes. Journal of Power
Sources, 103: 305–309.
Sadki, S., Schottland, P., Sabouraud, G., & Brodie, N. (2000). The mechanisms of
pyrrole electropolymerization. Chemical Society Reviews, 29: 283–293.
Sanpui, P., Murugadoss, a., Prasad, P. V. D., Ghosh, S. S., & Chattopadhyay, A. (2008).
The antibacterial properties of a novel chitosan-Ag-nanoparticle composite.
International Journal of Food Microbiology, 124: 142–146.
Sawangphruk, M., Srimuk, P., Chiochan, P., Krittayavathananon, A., Luanwuthi, S., &
Limtrakul, J. (2013). High-performance supercapacitor of manganese
oxide/reduced graphene oxide nanocomposite coated on flexible carbon fiber paper.
Carbon, 60: 109–116.
Sharma, R. K., Karakoti, A., Seal, S., & Zhai, L. (2010). Multiwall carbon nanotube-
poly(4-styrenesulfonic acid) supported polypyrrole/manganese oxide nano-
composites for high performance electrochemical electrodes. Journal of Power
Sources, 195: 1256–1262.
Sharma, R. K., Rastogi, a. C., & Desu, S. B. (2008a). Manganese oxide embedded
polypyrrole nanocomposites for electrochemical supercapacitor. Electrochimica
Acta, 53: 7690–7695.
Sharma, R. K., Rastogi, A. C., & Desu, S. B. (2008b). Pulse polymerized polypyrrole
electrodes for high energy density electrochemical supercapacitor.
Electrochemistry Communications, 10: 268–272.
Shen, J., Yang, C., Li, X., & Wang, G. (2013). High-performance asymmetric
supercapacitor based on nanoarchitectured polyaniline/graphene/carbon nanotube
and activated graphene electrodes. ACS Applied Materials and Interfaces, 5: 8467–
8476.
Simon, P., & Gogotsi, Y. (2008). Materials for electrochemical capacitors. Nature
Materials, 7: 845–854.
Singh, A., Salmi, Z., Joshi, N., Jha, P., Decorse, P., Lecoq, H., Lau-Truong, S., Jouini,
M., Aswal, D. K., & Chehimi, M. M. (2013). Electrochemical investigation of
free-standing polypyrrole–silver nanocomposite films: a substrate free electrode
material for supercapacitors. RSC Advances, 3: 24567–24575.
Snook, G. A., Kao, P., & Best, A. S. (2011). Conducting-polymer-based supercapacitor
devices and electrodes. Journal of Power Sources, 196: 1–12.

148
Stoller, M. D., Park, S., Zhu, Y., An, J., & Ruoff, R. S. (2008). Graphene-based
ultracapacitors. Nano Letters, 8: 3498–3502.
Stoller, M. D., & Ruoff, R. S. (2010). Best practice methods for determining an
electrode material’s performance for ultracapacitors. Energy & Environmental
Science, 3: 1294–1301.
Su, A. D., Zhang, X., Rinaldi, A., Nguyen, S. T., Liu, H., Lei, Z., Lu, L., & Duong, H.
M. (2013). Hierarchical porous nickel oxide–carbon nanotubes as advanced
pseudocapacitor materials for supercapacitors. Chemical Physics Letters, 561-562:
68–73.
Sudhakar, Y. N., & Selvakumar, M. (2012). Lithium perchlorate doped plasticized
chitosan and starch blend as biodegradable polymer electrolyte for supercapacitors.
Electrochimica Acta, 78: 398–405.
Sun, F., Pang, X., & Zhitomirsky, I. (2009). Electrophoretic deposition of composite
hydroxyapatite-chitosan-heparin coatings. Journal of Materials Processing
Technology, 209: 1597–1606.
Sun, G., Li, B., Ran, J., Shen, X., & Tong, H. (2015). Three-dimensional hierarchical
porous carbon/graphene composites derived from graphene oxide-chitosan
hydrogels for high performance supercapacitors. Electrochimica Acta, 171: 13–22.
Sun, W., Tian, W., Zhang, Y., He, J., Mao, S., & Fang, L. (2012). Effect of novel
stabilizers-cationic polymers on the particle size and physical stability of poorly
soluble drug nanocrystals. Nanomedicine: Nanotechnology, Biology, and Medicine,
8: 460–467.
Taguchi, A., Inoue, S., Akamaru, S., Hara, M., Watanabe, K., & Abe, T. (2006). Phase
transition and electrochemical capacitance of mechanically treated manganese
oxides. Journal of Alloys and Compounds, 414: 137–141.
Tallman, D. E., Vang, C., Wallace, G. G., & Bierwagen, G. P. (2002). Direct
Electrodeposition of Polypyrrole on Aluminum and Aluminum Alloy by Electron
Transfer Mediation. Journal of The Electrochemical Society, 149: C173–C179.
Toupin, M., Brousse, T., & Bélanger, D. (2004). Charge storage mechanism of MnO2
electrode used in aqueous electrochemical capacitor. Chemistry of Materials, 16:
3184–3190.
Twu, Y.-K., Chen, Y.-W., & Shih, C.-M. (2008). Preparation of silver nanoparticles
using chitosan suspensions. Powder Technology, 185: 251–257.
Vidhyadharan, B., Khayyriah, N., Zain, M., Misnon, I. I., Aziz, R. A., Ismail, J., Yusoff,
M. M., & Jose, R. (2014). High performance supercapacitor electrodes from
electrospun nickel oxide nanowires. Journal of Alloys and Compounds, 610: 143–
150.
Wang, G., Zhang, L., & Zhang, J. (2012). A review of electrode materials for
electrochemical supercapacitors. Chemical Society Reviews, 41: 797–828.

149
Wang, H., Peng, C., Peng, F., Yu, H., & Yang, J. (2011). Facile synthesis of
MnO2/CNT nanocomposite and its electrochemical performance for
supercapacitors. Materials Science and Engineering B, 176: 1073–1078.
Wang, J., Xu, Y., Zhu, J., & Ren, P. (2012). Electrochemical in situ polymerization of
reduced graphene oxide/polypyrrole composite with high power density. Journal
of Power Sources, 208: 138–143.
Wang, J.-G., Yang, Y., Huang, Z., & Kang, F. (2014). MnO2/polypyrrole nanotubular
composites: reactive template synthesis, characterization and application as
superior electrode materials for high-performance supercapacitors. Electrochimica
Acta, 130: 642–649.
Wang, J.-G., Yang, Y., Huang, Z.-H., & Kang, F. (2011). Coaxial carbon
nanofibers/MnO2 nanocomposites as freestanding electrodes for high-performance
electrochemical capacitors. Electrochimica Acta, 56: 9240–9247.
Wang, J.-G., Yang, Y., Huang, Z.-H., & Kang, F. (2012a). Incorporation of
nanostructured manganese dioxide into carbon nanofibers and its electrochemical
performance. Materials Letters, 72: 18–21.
Wang, J.-G., Yang, Y., Huang, Z.-H., & Kang, F. (2012b). Rational synthesis of
MnO2/conducting polypyrrole@carbon nanofiber triaxial nano-cables for high-
performance supercapacitors. Journal of Materials Chemistry, 22: 16943–16949.
Wang, Y., Tao, S., & An, Y. (2012). Superwetting monolithic carbon with hierarchical
structure as supercapacitor materials. Microporous and Mesoporous Materials, 163:
249–258.
Wang, Y., & Zhitomirsky, I. (2011). Cathodic electrodeposition of Ag-doped
manganese dioxide films for electrodes of electrochemical supercapacitors.
Materials Letters, 65: 1759–1761.
Wei, D., Sun, W., Qian, W., Ye, Y., & Ma, X. (2009). The synthesis of chitosan-based
silver nanoparticles and their antibacterial activity. Carbohydrate Research, 344:
2375–2382.
Wei, J., Xing, G., Gao, L., Suo, H., He, X., Zhao, C., Li, S., & Xing, S. (2013). Nickel
foam based polypyrrole–Ag composite film: a new route toward stable electrodes
for supercapacitors. New Journal of Chemistry, 37: 337–341.
Wei, L., Sevilla, M., Fuertes, A. B., Mokaya, R., & Yushin, G. (2012). Polypyrrole-
derived activated carbons for high-performance electrical double-layer capacitors
with ionic liquid electrolyte. Advanced Functional Materials, 22: 827–834.
Wei, W., Cui, X., Chen, W., & Ivey, D. G. (2011). Manganese oxide-based materials as
electrochemical supercapacitor electrodes. Chemical Society Reviews, 40: 1697–
1721.
World Energy Outlook. (2014) Accessed on 5/10/2015,
http://www.iea.org/textbase/npsum/weo2014sum.pdf

150
Wu, X., Wen, T., Guo, H., Yang, S., Wang, X., & Xu, A. (2013). Biomass-derived
sponge-like carbonaceous hydrogels and aerogels for supercapacitors. ACS Nano,
3589–3597.
Wu, Y., Shen, Z., & Yu, T. (2014). Two-dimensional carbon: Fundamental properties,
synthesis, characterization, and applications. Boca Raton, FL: Pan Stanford
Publishing.
Wysocka-Żołopa, M., Grądzka, E., Szymański, K., & Winkler, K. (2013).
Electrodeposition of nickel, cobalt, and iron on polypyrrole films. Thin Solid Films,
548: 44–51.
Xiao, J., Yang, S., Wan, L., Xiao, F., & Wang, S. (2014). Electrodeposition of
manganese oxide nanosheets on a continuous three-dimensional nickel porous
scaffold for high performance electrochemical capacitors. Journal of Power
Sources, 245: 1027–1034.
Yalçınkaya, S., Demetgül, C., Timur, M., & Çolak, N. (2010). Electrochemical
synthesis and characterization of polypyrrole/chitosan composite on platinum
electrode: Its electrochemical and thermal behaviors. Carbohydrate Polymers, 79:
908–913.
Yamada, M., & Honma, I. (2005). Anhydrous proton conductive membrane consisting
of chitosan. Electrochimica Acta, 50: 2837–2841.
Yamagata, M., Soeda, K., Ikebe, S., Yamazaki, S., & Ishikawa, M. (2013). Chitosan-
based gel electrolyte containing an ionic liquid for high-performance nonaqueous
supercapacitors. Electrochimica Acta, 100: 275–280.
Yan, J., Liu, J., Fan, Z., Wei, T., & Zhang, L. (2012). High-performance supercapacitor
electrodes based on highly corrugated graphene sheets. Carbon, 50: 2179–2188.
Yan, J., Wei, T., Fan, Z., Qian, W., Zhang, M., Shen, X., & Wei, F. (2010). Preparation
of graphene nanosheet/carbon nanotube/polyaniline composite as electrode
material for supercapacitors. Journal of Power Sources, 195: 3041–3045.
Yan, J., Wei, T., Qiao, W., Fan, Z., Zhang, L., Li, T., & Zhao, Q. (2010). A high-
performance carbon derived from polyaniline for supercapacitors. Electrochemistry
Communications, 12: 1279–1282.
Yang, X., Li, L., & Yan, F. (2010). Polypyrrole/silver composite nanotubes for gas
sensors. Sensors & Actuators B: Chemical, 145: 495–500.
Yao, W., Zhou, H., & Lu, Y. (2013a). Synthesis and property of novel
MnO2@polypyrrole coaxial nanotubes as electrode material for supercapacitors.
Journal of Power Sources, 241: 359–366.
Yao, W., Zhou, H., & Lu, Y. (2013b). Synthesis and property of novel
MnO2@polypyrrole coaxial nanotubes as electrode material for supercapacitors.
Journal of Power Sources, 241: 359–366.

151
Yen, H., Horng, Y., Hu, M., Yang, W., Wen, J.-R., Ganguly, A., Tai, Y., Chen, K.-H.,
& Chen, L.-C. (2014). Vertically aligned epitaxial graphene nanowalls with
dominated nitrogen doping for superior supercapacitors. Carbon, 82: 124–134.
Yin, H., Zhou, Y., Ma, Q., Ai, S., Chen, Q., & Zhu, L. (2010). Electrocatalytic
oxidation behavior of guanosine at graphene, chitosan and Fe3O4 nanoparticles
modified glassy carbon electrode and its determination. Talanta, 82: 1193–1199.
Yoo, H., Min, M., Bak, S., Yoon, Y., & Lee, H. (2014). A low ion-transfer resistance
and high volumetric supercapacitor using hydrophilic surface modified carbon
electrodes. Journal of Materials Chemistry A, 2: 6663–6668.
You, B., Wang, L., Li, N., & Zheng, C. (2014). Improving the Energy Storage
Performance of Graphene through Insertion of Pristine CNTs and Ordered
Mesoporous Carbon Coating. ChemElectroChem, 1: 772–778.
Yu, C., Gou, L., Zhou, X., Bao, N., & Gu, H. (2011). Chitosan–Fe3O4 nanocomposite
based electrochemical sensors for the determination of bisphenol A.
Electrochimica Acta, 56: 9056–9063.
Yu, G., Xie, X., Pan, L., Bao, Z., & Cui, Y. (2013). Hybrid nanostructured materials for
high-performance electrochemical capacitors. Nano Energy, 2: 213–234.
Zang, J., & Li, X. (2011). In situ synthesis of ultrafine β-MnO2/polypyrrole nanorod
composites for high-performance supercapacitors. Journal of Materials Chemistry,
21: 10965–10969.
Zangmeister, R. A., Park, J. J., Rubloff, G. W., & Tarlov, M. J. (2006). Electrochemical
study of chitosan films deposited from solution at reducing potentials.
Electrochimica Acta, 51: 5324–5333.
Zeng, X., Li, X., Xing, L., Liu, X., Luo, S., Wei, W., Kong, B., & Li, Y. (2009).
Electrodeposition of chitosan–ionic liquid–glucose oxidase biocomposite onto
nano-gold electrode for amperometric glucose sensing. Biosensors and
Bioelectronics, 24: 2898–2903.
Zhang, A., Xiao, Y., Lu, L., Wang, L., & Li, F. (2013). Polypyrrole/MnO2 composites
and their enhanced electrochemical capacitance. Journal of Applied Polymer
Science, 128: 1327–1331.
Zhang, D., Zhang, X., Chen, Y., Yu, P., Wang, C., & Ma, Y. (2011). Enhanced
capacitance and rate capability of graphene/polypyrrole composite as electrode
material for supercapacitors. Journal of Power Sources, 196: 5990–5996.
Zhang, H., Cao, G., Wang, Z., Yang, Y., Shi, Z., & Gu, Z. (2008). Growth of
manganese oxide nanoflowers on vertically-aligned carbon nanotube arrays for
high-rate electrochemical capacitive energy storage. Nano Letters, 8: 2664–2668.
Zhang, J., & Zhao, X. S. (2012). Conducting Polymers Directly Coated on Reduced
Graphene Oxide Sheets as High-Performance Supercapacitor Electrodes. The
Journal of Physical Chemistry C, 116: 5420–5426.

152
Zhang, L. L., & Zhao, X. S. (2009). Carbon-based materials as supercapacitor
electrodes. Chemical Society Reviews, 38: 2520–2531.
Zhang, S., Li, Y., & Pan, N. (2012). Graphene based supercapacitor fabricated by
vacuum filtration deposition. Journal of Power Sources, 206: 476–482.
Zhang, S. W., & Chen, G. Z. (2009). Manganese oxide based materials for
supercapacitors. Energy Materials, 3: 186–200.
Zhang, W., Li, J., Du, X., & Zhang, Z. (2009). Porous manganese oxide synthesized
through organic-electrolyte templates and their catalytic applications. Materials
Research Bulletin, 44: 2072–2080.
Zhang, X., Sun, X., Zhang, H., Zhang, D., & Ma, Y. (2013). Microwave-assisted reflux
rapid synthesis of MnO2 nanostructures and their application in supercapacitors.
Electrochimica Acta, 87: 637–644.
Zhang, Y., Feng, H., Wu, X., Wang, L., Zhang, A., Xia, T., Dong, H., Li, X., & Zhang,
L. (2009). Progress of electrochemical capacitor electrode materials: A review.
International Journal of Hydrogen Energy, 34: 4889–4899.
Zhang, Z., & Mu, J. (2007). Effect of hydrothermal time, pH, and alkali on crystal phase
and morphology of manganese oxides. Journal of Dispersion Science and
Technology, 28: 793–796.
Zhao, B., & Nan, Z. (2012). Formation of self-assembled nanofiber-like Ag@PPy
core/shell structures induced by SDBS. Materials Science and Engineering: C, 32:
1971–1975.
Zhao, H., Liu, F., Han, G., Liu, Z., Liu, B., Fu, D., Li, Y., & Li, M. (2014). Co-
electrodeposition of MnO2/graphene oxide coating on carbon paper from
phosphate buffer and the capacitive properties. Journal of Solid State
Electrochemistry, 18: 553–559.
Zhi, J., Zhao, W., Liu, X., Chen, A., Liu, Z., & Huang, F. (2014). Highly Conductive
Ordered Mesoporous Carbon Based Electrodes Decorated by 3D Graphene and 1D
Silver Nanowire for Flexible Supercapacitor. Advanced Functional Materials, 24:
2013–2019.
Zhi, M., Manivannan, A., Meng, F., & Wu, N. (2012). Highly conductive electrospun
carbon nanofiber/MnO2 coaxial nano-cables for high energy and power density
supercapacitors. Journal of Power Sources, 208: 345–353.
Zhou, C., Zhang, Y., Li, Y., & Liu, J. (2013). Construction of high-capacitance 3D
CoO@polypyrrole nanowire array electrode for aqueous asymmetric
supercapacitor. Nano Letters, 13: 2078–2085.

153
LIST OF PUBLICATIONS AND PAPERS PRESENTED
Publications
1. Gan, J. K., Lim, Y. S., Huang, N. M., & Lim, H. N. (2015). Effect of pH on
morphology and supercapacitive properties of manganese oxide/polypyrrole
nanocomposite. Applied Surface Science, 357: 479-486.
2. Gan, J. K., Lim, Y. S., Huang, N. M., & Lim, H. N. (2015). Hybrid silver
nanoparticle/nanocluster-decorated polypyrrole for high-performance
supercapacitors. RSC Advances, 5: 75442-75450.
3. Gan, J. K., Lim, Y. S., Pandikumar A., Huang, N. M., & Lim, H. N. (2015).
Graphene/polypyrrole-coated carbon nanofiber core-shell architecture electrode
electrochemical capacitors. RSC Advances, 5: 12692-12699.
Paper presented in international conference:
1. Gan, J. K., Lim, Y. S., Huang, N. M., & Lim, H. N. “Hybrid silver
nanoparticle/nanocluster-decorated polypyrrole for high-performance
supercapacitors.” in International Conference On Recent Advances In Materials
And Chemical Sciences, 14-15 December 2015, Department of Chemistry,
Gandhigram Rural Institute, Dindigul District, Tamil Nadu, India. (Poster
presentation).
![Synthesis and Electrochemical Performance of Polypyrrole ...carbonlett.org/Upload/files/CARBONLETT/[157-160]-04.pdf · Synthesis and Electrochemical Performance of Polypyrrole-](https://img.pdfslide.net/doc/110x75/5b7197897f8b9a6f6b8ba2b2/synthesis-and-electrochemical-performance-of-polypyrrole-157-160-04pdf.jpg)