Embed Size (px)
Citation preview

Examining the Effects of On-Orbit Aging of SL-12 Rocket Bodies using Visible Band Spectra with the MMT Telescope and 5-Color Photometry with the UKIRT/WFCAM
Eric C. Pearce*, Benjamin Weiner†, Adam Block*, Harrison Krantz*, Kris Rockowitz*, B. Sease‡, G. Hennessy§, and Michelle Wilson⁑
*Steward Observatory, University of Arizona †MMT Observatory
‡Computational Physic Inc. §U.S. Naval Observatory
⁑SAIC
ABSTRACT
The characterization of deep space debris has posed a significant challenge in Space Situational Awareness (SSA). To be most operationally effective, characterization must be performed quickly and under non-ideal operational conditions, generally using non-resolved techniques. The use of multi-color photometry and the resultant color indices offer the potential to rapidly discriminate between debris and intact space objects such as rocket bodies and satellites. However, these studies are not well informed by high resolution spectra of these same objects due to the lack of prior measurements with large astronomical telescopes. High resolution spectroscopy is not routinely collected by our SSA network. Nonetheless, several researchers have collected satellite spectra for research purposes and noted the progressive reddening of spacecraft surfaces with age.
In this study, we re-analyze our previous UKIRT near-IR five-color photometric measurements of SL-12 fourth stage rocket bodies with the additional context of high-resolution visible band spectra on the same objects. The SL-12 fourth stage rocket bodies (henceforth referred to as “SL-12 RB”) offer a convenient ensemble of objects for which photometric techniques can be developed and tested. The SL-12 (also called the “Proton K”) was a mainstay Russian four-stage to GEO launch vehicle that was used from 1974 to 2012. The five SL-12s measured have a range of years-on-orbit (YOO) from 23 to 35 years, allowing a comparative study of the evolution of the spectra over a 12-year difference in age. The spectra were collected with the Blue Channel Spectrograph on the 6.5 m MMT telescope at Mt. Hopkins. The spectra cover a 5200 Å range at a dispersion of 1.96 Å/pixel. The large collecting aperture of the MMT allowed the rapid collection of multiple high signal-to-noise spectra with short 2-minute exposures. This short exposure allows us to have confidence the solar phase angle was near constant during each collection, but that the spectra were averaged over the rotation of the rocket body. In addition to the UKIRT measurements, we supplement the analysis data with Sloan r’, i’, and z’ high-speed photometric data with the Chimera High-Speed photometer on the Kuiper 61” telescope at Mt. Bigelow near Tucson AZ. The spectra are analyzed for evidence of the effects of on-orbit aging.
1. INTRODUCTION
Since the launch of Sputnik in 1957, space surveillance has tracked and studied satellites and space debris with optical telescopes. The first attempts to use optical photometry to characterize satellites were published by the U.S and Russians in the late 1950s [1, 2]. The excellent historical review papers by Lambert [3] and Sukhov [4] summarize much of the history of photometric technique development in the US and Russia respectively. Multi-color photometric measurements offer the opportunity to quickly measure the bulk spectral characteristics of a space object. The concept of exploiting the color indices in the visible bands has been previously explored in SSA. For example, BVRI photometry with the Cerro Tololo Inter-American Observatory (CTIO) 0.9 m telescope has been used by Lederer et al. to compare measured color indices of 18 IDCSP (Initial Defense Communications Satellite Program) satellites with the predictions from laboratory measurements of solar cells [5].
Copyright © 2019 Advanced Maui Optical and Space Surveillance Technologies Conference (AMOS) – www.amostech.com

As we have found studying the few published spectra of satellites on-orbit in the near-IR, these same bands are highly diagnostic for satellite characterization. For example, the strong spectral features typically associated with solar cell band gaps in the 1.0–1.1 µm (c.f. Figure 2 in [6]) and the strong features in the reflectance spectra of Kapton near 0.5 µm (c.f. Figure 3 in [7]) — both common satellite materials both strongly influence red and near-IR color indices. The Z−Y and Z−J color indices are especially diagnostic of solar panel dominated space objects. In the visible part of the spectrum, the Sloan i’ (695–844 nm), z_s1 (826–920 nm), z’ (> 820 nm), and Y (950–1058 nm) offer similar diagnostic bands.
Relatively few studies have focused on the efficacy of multi-color photometric characterization in the near-IR bands. One reason for this is that near-IR requires special cameras and large telescopes to reach a comparable sensitivity to the visible bands. One study, conducted by D. Sanchez and his collaborators, measured 10 geosynchronous satellites in the J and H bands with the 3.6 m telescope at the Starfire Optical Range and an IR Laboratory NCMOS camera [8]. The study compared results to their own optical measurements and a comprehensive multicolor study by Beavers and Swezey that had excellent phase angle diversity [9]. Sanchez concluded that the near-IR observations are potentially more useful than visible band measurements. Since both J and H are above typical solar panel band-gap features, Sanchez could not measure color indices across the solar cell band gap. Nonetheless, his photometric characterization showed encouraging results.
Previously we performed a study considering the efficacy of 5-color photometry in the near-IR to rapidly characterize geosynchronous space objects with the modest goal of distinguishing classes of objects and identifying anomalous members of classes [10]. The results were encouraging and showed that anomalous members could be identified from a class of objects. To date, our analysis of that data has focused on comparative analysis of SL-12 fourth stage rocket bodies as an ensemble of similar objects launched over several decades. Additional unpublished results from that same study showed that various payload classes shared characteristic color indices. The colors of old solar panel covered spacecraft were easily discriminated using colors spanning the band-gap. Frith and his colleagues at NASA JSC have published a similar study using 5-color near-IR photometry to study an ensemble of inactive solar panel covered Boeing HS-376 satellites using many of the same concepts [11]. However, none of these studies were well informed by high resolution spectral data on the similar objects that could aid in the interpretation of the multi-color photometry.
The investigators recently had the opportunity to measure five of the previously observed SL-12 RB with the MMT telescope Blue Channel Spectrograph. Consequently, we are now able to analyze near-IR photometric measurements in five bands, visible band high resolution spectroscopy, and visible band multi-color high-speed photometry on the same set of objects. Our intent is to use the high-resolution spectroscopy to provide detailed insight into the interpretation of both the near-IR and the visible band photometry. The five SL-12s measured have a range of years-on-orbit (YOO) from 23 to 35 years, allowing a comparative study of the evolution of the spectra over a 12-year difference in age. Finally, we will revisit our 2016 near-IR photometric characterization of the SL-12 RB in the context of on-orbit aging.
2. THE SL-12 FOURTH STAGE ROCKET BODY
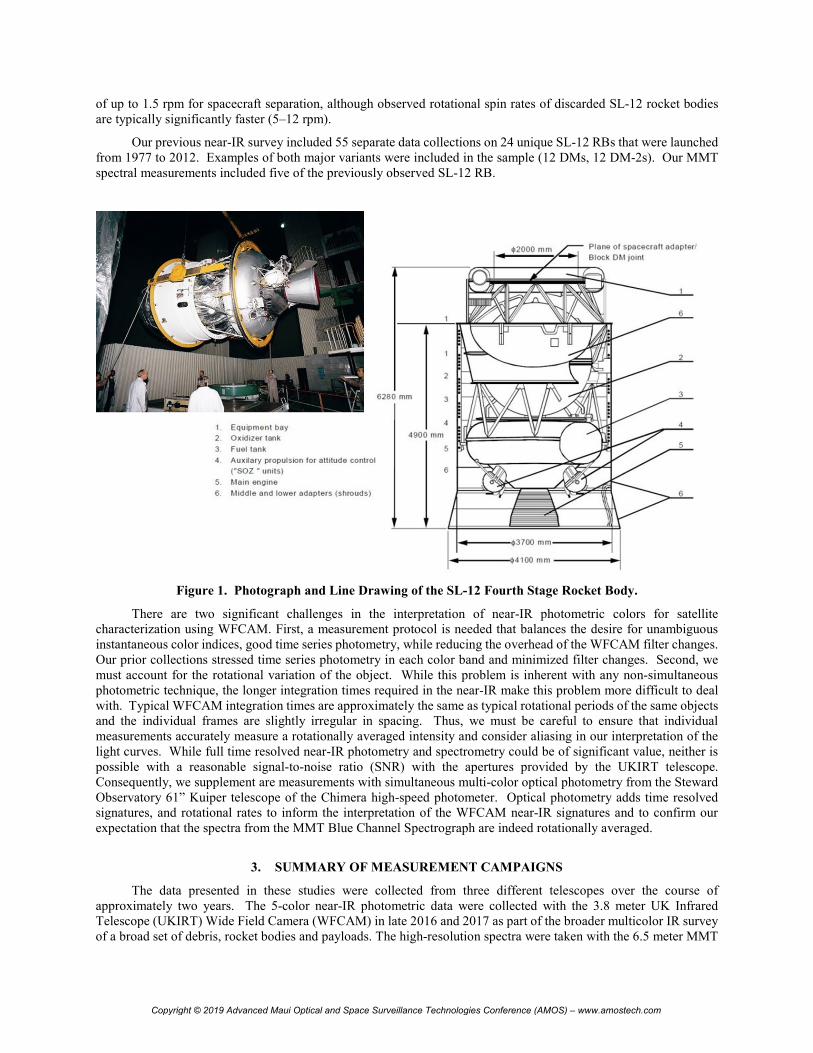
For this study, targets were selected Russian SL-12 fourth stage rocket bodies (see Figure 1). The SL-12 (also called the “Proton K”) was a mainstay Russian four-stage to GEO launch vehicle that was used from 1974 to 1994 (see Figure 1) [12, 13]. The SL-12 fourth stage rocket bodies (henceforth referred to as “SL-12 RB”) offer a convenient ensemble of objects for which photometric techniques can be developed and tested. The rocket bodies are bright (11.5 mag in the Z band, or 12 mv), and at least 25 such objects are available within the longitude range visible from Hawaii and Tucson, Arizona. This upper stage was used to insert the payload into GEO from its transfer orbit and was discarded in GEO without moving it to a graveyard orbit.
The SL-12 RB had at least three different versions. The Blok DM (1974) and Blok DM-2 (1982) were similar in structure and fuel but differed slightly in length. A third version (DM-2M) was developed specifically to support sea launches and is similar structurally to the DM-2. This upper stage was used to insert the payload into GEO from its transfer orbit and was discarded in GEO without moving it to a graveyard orbit. The SL-12 RB is large, measuring 3.7 m in diameter and approximately 6.2 m long (the DM-2 version). Reportedly the stage could impart a rotation rate
1 Here z_s refers to the Astrodon filter which cuts off the open-ended Sloan z at 920 nm.
Copyright © 2019 Advanced Maui Optical and Space Surveillance Technologies Conference (AMOS) – www.amostech.com
of up to 1.5 rpm for spacecraft separation, although observed rotational spin rates of discarded SL-12 rocket bodies are typically significantly faster (5–12 rpm).
Our previous near-IR survey included 55 separate data collections on 24 unique SL-12 RBs that were launched from 1977 to 2012. Examples of both major variants were included in the sample (12 DMs, 12 DM-2s). Our MMT spectral measurements included five of the previously observed SL-12 RB.
Figure 1. Photograph and Line Drawing of the SL-12 Fourth Stage Rocket Body.
There are two significant challenges in the interpretation of near-IR photometric colors for satellite characterization using WFCAM. First, a measurement protocol is needed that balances the desire for unambiguous instantaneous color indices, good time series photometry, while reducing the overhead of the WFCAM filter changes. Our prior collections stressed time series photometry in each color band and minimized filter changes. Second, we must account for the rotational variation of the object. While this problem is inherent with any non-simultaneous photometric technique, the longer integration times required in the near-IR make this problem more difficult to deal with. Typical WFCAM integration times are approximately the same as typical rotational periods of the same objects and the individual frames are slightly irregular in spacing. Thus, we must be careful to ensure that individual measurements accurately measure a rotationally averaged intensity and consider aliasing in our interpretation of the light curves. While full time resolved near-IR photometry and spectrometry could be of significant value, neither is possible with a reasonable signal-to-noise ratio (SNR) with the apertures provided by the UKIRT telescope. Consequently, we supplement are measurements with simultaneous multi-color optical photometry from the Steward Observatory 61” Kuiper telescope of the Chimera high-speed photometer. Optical photometry adds time resolved signatures, and rotational rates to inform the interpretation of the WFCAM near-IR signatures and to confirm our expectation that the spectra from the MMT Blue Channel Spectrograph are indeed rotationally averaged.
3. SUMMARY OF MEASUREMENT CAMPAIGNS
The data presented in these studies were collected from three different telescopes over the course of approximately two years. The 5-color near-IR photometric data were collected with the 3.8 meter UK Infrared Telescope (UKIRT) Wide Field Camera (WFCAM) in late 2016 and 2017 as part of the broader multicolor IR survey of a broad set of debris, rocket bodies and payloads. The high-resolution spectra were taken with the 6.5 meter MMT
Copyright © 2019 Advanced Maui Optical and Space Surveillance Technologies Conference (AMOS) – www.amostech.com

telescope Blue Channel Spectrograph on a single night in January 2019. Finally, the supporting high-speed visible photometry was taken with the Chimera Photometer on the Steward Observatory 1.5 m telescope at Mt. Bigelow in 2018 and 2019. Each of these data collections is summarized below.
3.1. UKIRT NEAR-IR PHOTOMETRY
The near-IR 5-color survey data discussed in this paper were collected with the UKIRT WFCAM between 2 November 2016 and 6 February 2017 [10]. The 3.8 m telescope is the large dedicated IR telescope located on Mauna Kea in HI. The telescope has a suite of astronomical spectrographs and imagers operating at the Cassegrain focus, and a unique large mosaic near-IR survey camera that operates at the prime focus [14]. The UKIRT control system has a robust queue scheduler and allows data collection on satellites using standard two-line element sets (TLEs).
Although the details of the collection protocols evolved during the survey, most collections initially acquired the space object near the center of camera 3 in the Z band, then sequenced through the near IR filters Z, Y, J, H and K. The sequences started with the Z band to maximize detection sensitivity for the initial acquisition. Later protocols shortened the sequence significantly and finished the sequence with a brief second collection in Z band to provide both astrometric calibration and a photometric reference that could be compared back to the beginning of the track. A typical data collection sequence would take between 10 and 40 minutes.
This near-IR survey included 55 separate data collections on 24 unique SL-12 RBs that were launched from 1977 to 2012. Examples of both major variants were included in the sample (12 DMs, 12 DM-2s). Figure 2 shows a typical five-color collection on one of the SL-12 RB in our sample, 1987-109D (SCN 18718), an original Blok DM. This collection was our original long ZYJHK observing protocol which cycled through each filter over approximately 39 min. Typical integration times were 5 s in Z, Y, J, and H, and 10 s in K. The typical sensitivity of WFCAM is 19.1 (Z), 18.7 (Y), 18.1 (J), 17.3 (H), 16.7 (K) in 5 seconds at a SNR of 5. The longer collection in the K band is a consequence of our early interest in K band for potential thermal emission during eclipse. Later collections used a quicker 15 min sequence.
Figure 2. Typical WFCAM survey 5-color collection on an SL-12 RB. The scatter in the Z-H band is
due to aliasing between the integration time and rotational period of the satellite. The bright features in K band were commonly observed in the SL-12 signatures and is unexplained.
3.2. MMT VISIBLE SPECTROSCOPY
High-resolution spectra taken on five of the SL-12 RB with the MMT 6.5 meter telescope and spectrograph on Mt. Hopkins [15]. The MMT Spectrograph is a two-channel low-intermediate resolution echelle spectrograph originally commissioned with the MMT telescope in 1979 and later upgraded with new detectors [16, 17]. The original design paralleled the Hale Double Spectrograph’s dual optical paths, one optimized for the blue end of the visible
Copyright © 2019 Advanced Maui Optical and Space Surveillance Technologies Conference (AMOS) – www.amostech.com
spectrum, and the other for red, reflecting the spectral response of detectors in the late 1970s. For our measurements, only the blue channel was available, providing a spectral coverage of 520 nm range at a dispersion of 0.196 nm/pixel.2
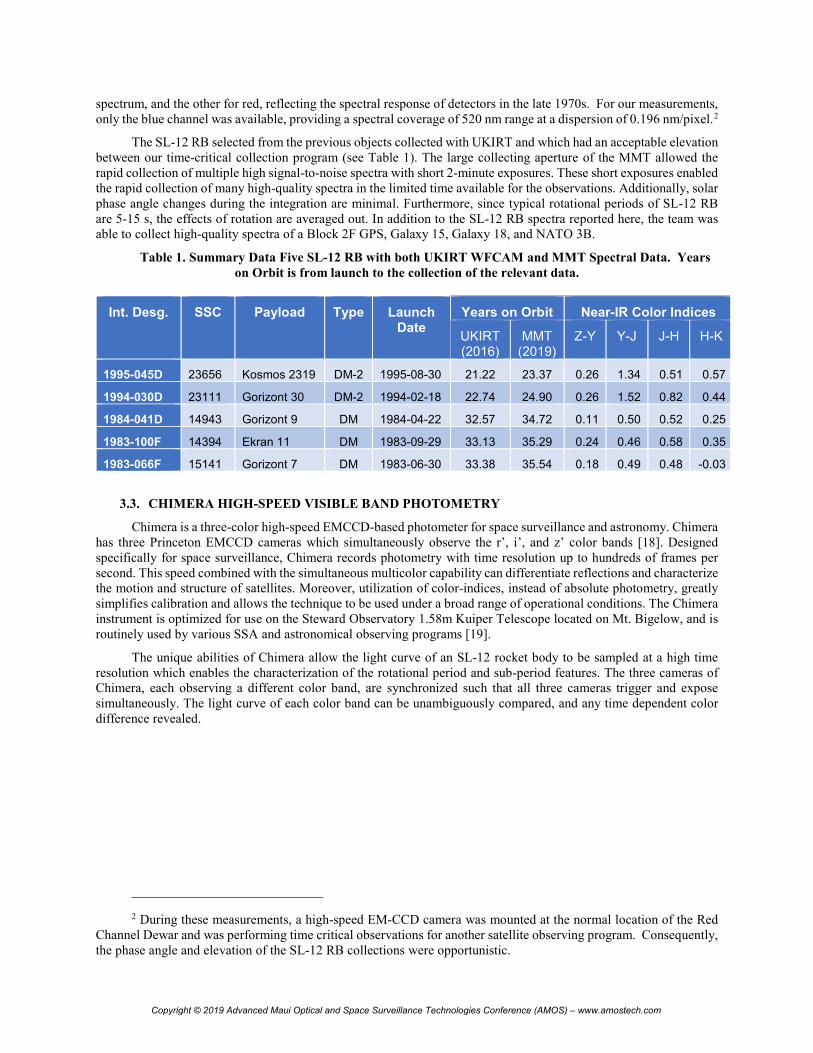
The SL-12 RB selected from the previous objects collected with UKIRT and which had an acceptable elevation between our time-critical collection program (see Table 1). The large collecting aperture of the MMT allowed the rapid collection of multiple high signal-to-noise spectra with short 2-minute exposures. These short exposures enabled the rapid collection of many high-quality spectra in the limited time available for the observations. Additionally, solar phase angle changes during the integration are minimal. Furthermore, since typical rotational periods of SL-12 RB are 5-15 s, the effects of rotation are averaged out. In addition to the SL-12 RB spectra reported here, the team was able to collect high-quality spectra of a Block 2F GPS, Galaxy 15, Galaxy 18, and NATO 3B.
3.3. CHIMERA HIGH-SPEED VISIBLE BAND PHOTOMETRY
Chimera is a three-color high-speed EMCCD-based photometer for space surveillance and astronomy. Chimera has three Princeton EMCCD cameras which simultaneously observe the r’, i’, and z’ color bands [18]. Designed specifically for space surveillance, Chimera records photometry with time resolution up to hundreds of frames per second. This speed combined with the simultaneous multicolor capability can differentiate reflections and characterize the motion and structure of satellites. Moreover, utilization of color-indices, instead of absolute photometry, greatly simplifies calibration and allows the technique to be used under a broad range of operational conditions. The Chimera instrument is optimized for use on the Steward Observatory 1.58m Kuiper Telescope located on Mt. Bigelow, and is routinely used by various SSA and astronomical observing programs [19].
The unique abilities of Chimera allow the light curve of an SL-12 rocket body to be sampled at a high time resolution which enables the characterization of the rotational period and sub-period features. The three cameras of Chimera, each observing a different color band, are synchronized such that all three cameras trigger and expose simultaneously. The light curve of each color band can be unambiguously compared, and any time dependent color difference revealed.
2 During these measurements, a high-speed EM-CCD camera was mounted at the normal location of the Red
Channel Dewar and was performing time critical observations for another satellite observing program. Consequently, the phase angle and elevation of the SL-12 RB collections were opportunistic.
Table 1. Summary Data Five SL-12 RB with both UKIRT WFCAM and MMT Spectral Data. Years on Orbit is from launch to the collection of the relevant data.
Int. Desg. SSC Payload Type Launch Date
Years on Orbit Near-IR Color Indices
UKIRT (2016)
MMT (2019)
Z-Y Y-J J-H H-K
1995-045D 23656 Kosmos 2319 DM-2 1995-08-30 21.22 23.37 0.26 1.34 0.51 0.57
1994-030D 23111 Gorizont 30 DM-2 1994-02-18 22.74 24.90 0.26 1.52 0.82 0.44
1984-041D 14943 Gorizont 9 DM 1984-04-22 32.57 34.72 0.11 0.50 0.52 0.25
1983-100F 14394 Ekran 11 DM 1983-09-29 33.13 35.29 0.24 0.46 0.58 0.35
1983-066F 15141 Gorizont 7 DM 1983-06-30 33.38 35.54 0.18 0.49 0.48 -0.03
Copyright © 2019 Advanced Maui Optical and Space Surveillance Technologies Conference (AMOS) – www.amostech.com

The SL-12 rocket bodies observed by Chimera thus far exhibit a range of rotational periods of 5-15 s, consistent with the observations of other researchers (see Figure 3) [20,21]. Through examination of the light curve and correlation with the diagrams and images of the SL-12 rocket body one can make guesses as to the structural elements which produce specular reflections. Time dependent color differences in the reflections may be related to material usage and aging related changes. Additionally, documenting the rotational periods of the SL-12 rocket bodies will provide valuable information for accompanying observations including spectroscopy such as those described in this paper. A complete analysis of the data in this context will be the subject of a future paper.
For the purposes of this study, we use both the Lomb Scargle (LS) Periodogram and Phase Dispersion Minimization (PDM) methods of determining periods from light curves, and use those periods to verify that our near-IR photometry represents rotationally averaged values [22,23,24]. An example of our period determination analysis is shown below in Figure 4. Both LS and PDM identify the primary frequency of 0.209 Hz and associated period of 4.76 s, although LS performs much more reliably than PDM. A visual examination of the light curve shows that this is half the actual rotational period of 9.52 s as the object has two nearly identical peaks per rotation.
We have attempted to apply LS to UKIRT data, which is particularly challenging as for the WFCAM Z and Y band light curves as the integration time of 5 s closely matches the primary frequency, and the WFCAM frames have slightly irregular time spacing. Nonetheless, LS applied to the Z and Y band data correctly determine primary periods of 9.533 and 9.537 s respectively. The ability to reliably detect rotational variation in the future WFCAM photometry will be a powerful tool to support interpretation of the near-IR photometry with the system.
4. SL-12 ROCKET BODY SPECTRA
There are few published spectra of satellites or debris on-orbit published in the open literature. Additionally, measurement of spectral evolution of satellites with age is inconsistent. Jorgensen measured reflectance spectra over a range of years-on-orbit (YOO) of 10–13 years of foreign discarded rocket bodies and noted significant and
Figure 3. Light curve of SL-12 RB 1983-066F (15141) with the
Chimera Photometer (Sloan r’, 50 ms integration time, ~ 20 fps).
Figure 4. Period Analysis optical light curve of 1983-066F using both Lomb Scargle and PDM techniques.
Copyright © 2019 Advanced Maui Optical and Space Surveillance Technologies Conference (AMOS) – www.amostech.com

systematic decrease in reflectance over time above 750 nm3 [25]. These measurements were made with the SPICA spectrograph on the AMOS 1.6 m telescopes using the instrumentation and techniques described by Nishimoto [26]. Note that this evolution in the spectra is a general decrease in the redness of the object, and opposite of the commonly held expectation that reddening should be expected due to space weathering. Guyote et al. has also attempted to explain the phenomenon by adapting a space weathering model developed by B. Hapke for asteroids with mixed results and the presumption that surfaces redden with aging [27]. Understanding the physical processes and predicting the spectral evolution of objects on orbit is greatly complicated by a lack of high-quality data of similar objects over a range of years-on-orbit. In the open literature, despite the common belief that satellites become redder with age, there is little data to support this expectation.
We observed five SL-12 RB targets on 11 January 2019 with the MMT 6.5-m telescope on Mt. Hopkins, using the Blue Channel Spectrograph. The spectrograph used a 300-line/mm grating, allowing a coverage of 4000–9000 Å with a resolution of about 5 Å FWHM. The telescope tracked each object from its orbital elements. Several other satellites in geosynchronous orbit were also observed, and a spectrophotometric standard star was observed with the same setup on 12 January 2019. We obtained several exposures for each satellite of 40-180 sec depending on brightness. For calibration, spectra of a HeAr/Ne internal lamp was taken immediately after each satellite series, and an internal continuum lamp and twilight sky exposures were taken for flat fields.
Data reduction of the spectra followed standard astronomical procedures using the IRAF (Image Reduction and Analysis Facility) software4 as described in Massey et al. [28]. Briefly, the long-slit spectral images are corrected for zero level, flatfield (pixel response), and the instrumental response in both the dispersion and spatial directions. The spectral trace (location) of the object is fit in each image and a flux spectrum is extracted. The trace is also used to extract a spectrum from the corresponding HeAr/Ne calibration lamp image. Emission lines are identified in the calibration spectrum and a low-order Chebyshev polynomial is used to fit the wavelength as a function of pixel number. This calibration is applied to produce a spectrum of flux as a function of wavelength.
Figure 5 shows the spectrum of 1995-045D, the youngest of the observed SL-12 RBs. The overall shape of this spectrum and many of the small-scale features are due to the incident solar spectrum, and the falloff of spectrograph sensitivity at blue and red ends of the spectrum. The absorption bands at 6800 and 7600 Å are atmospheric. Redward of 6600 Å, there is some residual ringing in the spectrum with a period of approximately 30 Å due to fringing in the CCD that is not fully removed by our reduction.
Figure 6 shows the spectra of the five SL-12 RBs normalized to the youngest, 1995-045D (23656), at 5500 Å.5 Normalizing the spectra compensates for the solar illumination and response effects and allows a direct visualization of the reflectance spectra with respect to the youngest SL-12 RB in our sample. Dividing the spectra causes larger fringing artifacts, so the
normalized spectra have been smoothed by a 75 Å filter. The data from 7500 to 7700 Å have been omitted as they have large residuals from the atmospheric absorption. One object, 1984-041D (14943), has lower observed flux in the blue: this is an observational artifact caused by atmospheric extinction, as 1984-041D was observed at airmass 2.2 while the others were observed at airmass 1.3–1.6. There is a systematic trend that the older SL-12s have less
3 Jorgensen et. al. did not identify the specific class of RB, although in other works, both the Russian SL-12
and U.S. IUS are studied. 4 IRAF is distributed by NOAO, the National Optical Astronomical Observatory. 5 Note that this RB was not cataloged in order of launch date. The first TLE for oldest RB 1983-066F (15141)
was not issued until August 1984.
Figure 5. Spectrum of 1995-045D (SSC 23656), the youngest
SL-12 RB in the sample.
Copyright © 2019 Advanced Maui Optical and Space Surveillance Technologies Conference (AMOS) – www.amostech.com

reflectivity in the red; this is a real effect. Our sample of five RB span in age from 23.4 to 35.5 YOO, expanding considerably over the range of YOO observed by Jorgensen et al. in 2004.
5. RE-VISITING UKIRT 5-COLOR PHOTOMETRY
The original intent of our previously referenced near-IR 5-color survey was to broadly collect reference data for later study on a wide variety of space objects, including payloads, rocket bodies, cataloged debris, and high area-to-mass ratio (HAMR) objects. During that collection, 24 different SL-12 RBs were measured, and one, the newest, was determined to be anomalous in the class. The difference in the color indices of that SL-12 RB were far too great to be explained by only on-orbit aging.
In the context of this study, we reexamine the remaining RB in the sample, spanning 18 years of YOO for the possible effects of aging. As shown in Figure 7, the results show only a weak downward trend in the Z-Y and Y-J colors. Assuming a similar trend from the MMT spectral observations, we could expect differences on the order of 20% or 0.2 magnitudes. However, the precise determination of color indices from UKIRT WFCAM data is complicated by several factors, including accounting for rotational and phase angle variations, and the non-simultaneous collection in the different bands. Clearly, to convincingly quantify the effects of aging with near-IR photometry, more precise measurement of the color indices is needed. Each of these issues are discussed briefly in turn.
Figure 6. Comparison of the spectra of the five SL-12 upper stage RBs. All spectra have been
normalized to the youngest RB, 1995-045D (23656).
Copyright © 2019 Advanced Maui Optical and Space Surveillance Technologies Conference (AMOS) – www.amostech.com

• The typical integration times when observing with WFCAM are 5 s in Z, Y, J and H, and 10 s in K). These are closely matched to the observed rotational periods of SL-12 RB as observed by Cardona and Yurasov and by our own measurements with the Chimera photometer. The effects of this can be visualized in the exemplar light curve shown in Figure 2. Since our data are averaged over several frames, the resulting photometry is rotationally averaged, but some error may be introduced by the small averaging interval, especially then the integration time and rotational periods are closely matched.
• One of the assumptions in our original analysis for rapid discrimination of objects using near-IR colors was that the variation in color index as a function of phase angle would be minimal, at least at phase angles that were not near specular conditions. To first order, we believe this to be true, however our phase angle coverage of color measurements was sparse in our 2016 campaign, there is not enough data to defend this assumption. Data taken over a wide range of phase angles by Frith et al. of Boeing HS-376 spacecraft shows that there is a significant variation in color in that object. It is unclear how those results would apply to SL-12 rocket bodies where the dominant surfaces are a white painted shroud and aluminum fuel tank. We plan future measurements with an observational protocol to more comprehensively sample variations in phase angle and explore how large the color variations are with respect to phase angle.
• Since the UKIRT WFCAM does not allow the simultaneous measurement of different color bands, color indices must be developed from sequential observations with an intervening filter change. The color indices from the 2016 campaign were developed from that data by averaging the pre- and post-filter change observations to develop the two near-IR magnitudes, and then differencing the two. Frith et al. used a more sophisticated polynomial fit to develop color indices. With both our technique and Frith, the sampling
Figure 7. Z-Y and Y-J color indices of Sl-12 RB spanning nearly twenty years on orbit. Except for very old SL-12 RB launched prior to 1980 (YOO > 36), there is a weak trend towards bluer color indices with age.
Copyright © 2019 Advanced Maui Optical and Space Surveillance Technologies Conference (AMOS) – www.amostech.com

intervals were adjusted based on the signature of the satellite, seeking the most consistent color indices possible.
6. FUTURE WORK
Our MMT visible band spectra represent a unique data set in the community, measuring similar objects over an 18-year span of years-on-orbit and showing systematic bluing with age. Our UKIRT near-IR colors suggest this may also occur in the near-IR but the spectral resolution and quality of our color-indices are not high enough to be compelling. In the future, we plan to survey a similar set of SL-12 RB over a range of age using the UKIRT 1–5 Micron Imager Spectrometer (UIST) [29]. With this instrument, we plan to create a similar data set to the MMT SL-12 RB spectra here that can be used to systematically study the effects of aging in those spectral bands and inform our interpretation of the near-IR color indices in that context. We also intend to develop and test new observational and processing techniques to use UKIRT in the future to take high-quality colors with WFCAM and to improve the phase angle coverage of the 5-color photometry for several different classes of objects, including the SL-12 RB.
In this study we have shown the efficacy of combining data from multiple bands and different telescopes to refine our previous analysis of SL-12 RBs. Our spectral measurements with MMT show for the first time compelling evidence for spectral evolution and demonstrate that for this class of object, this effect results in a systematic decrease in reflectiveness in the red. Over the next year we plan to continue to refine our techniques, continuing to develop operational techniques for rapid object characterization while informing the development of those techniques with high resolution observations such as spectrometry.
7. ACKNOWLEDGEMENTS
This work was funded by the United States Naval Observatory and by the University of Arizona Office of Research, Discovery and Innovation.
Observations reported here were obtained at the MMT Observatory, a joint facility of the University of Arizona and the Smithsonian Institution.
Observations reported here were obtained with the Kuiper 61” Telescope operated by the University of Arizona Steward Observatory. The Chimera Photometer was developed with funding the University of Arizona Office of Research, Discovery and Innovation
8. REFERENCES
1. J. G. Moore, "Photometric Observations of the Second Soviet Satellite (1957 β1)," Publications of the Astronomical Society of the Pacific, vol. 71, (419), pp. 163–165, 1959.
2. V. M. Grigorevskij, “About Methods of Photometry of Artificial Earth’s Satellites,” Byulleten' Stantsii Nablyudenia ISZ, No. 7, p. 14, 1959.
3. J. V. Lambert and K.E. Kissell, “The Early Development of Satellite Characterization Capabilities at the Air Force Laboratories,” in Proceedings AMOS Conference, Wailea, Maui, Hawaii, 2006.
4. P. P. Sukhov and K. P. Sukhov, "On some problems of photometric identification of geostationary satellites," Kinematics and Physics of Celestial Bodies, vol. 31, (6), pp. 314–318, 2015.
5. S.M. Lederer et al, “Preliminary Characterization of IDCSP Spacecrafts through a Multi-Analytical Approach,” in Proceedings AMOS Conference, Wailea, Maui, Hawaii, 2012.
6. K. J. Abercromby, P. Abell, and E. Baker, "Reflectance Spectra Comparison of Orbital Debris, Intact Spacecraft, and Intact Rocket Bodies in the GEO Regime," Fifth European Conference on Space Debris, Darmstadt, Germany, 2009.
7. L. Bai et al, "Spectral Scattering Characteristics of Space Target in Near-UV to Visible Bands," Optical Express vol. 22, (7), pp. 8515–8524, 2014.
8. D.J. Sanchez et al. (2000), “Photometric Measurements of Deep Space Satellites,” Proceeding of SPIE, International Symposium on Optical Science and Technology, San Diego CA, 31 October 2000.
Copyright © 2019 Advanced Maui Optical and Space Surveillance Technologies Conference (AMOS) – www.amostech.com
9. W.I. Beavers and L.W. Swezey (1995), “Optical Monitoring of Geosynchronous Satellites, Final Report.” MIT Lincoln Laboratory Project Report STK-240, October 1995.
10. E.C. Pearce et al. (2017), “Rapid Characterization of Geosynchronous Space Debris with 5-Color Near-IR Photometry,” Proceedings AMOS Conference, Maui HI, September 2017.
11. J. Frith, P. Anz-Meador, S. Lederer, H. Cowardin, and B. Buckalew (2015), “NIR Color vs Launch Date: A 20-year Analysis of Space Weathering Effects on the Boeing 376 Spacecraft,” Proceedings AMOS Conference, Maui HI, September 2017.
12. “Mission Overview GE-6 Launch on the Proton Launch Vehicle,” International Launch Services, 2000. 13. Gunter’s Space Page, “Blok-D,” available: http://space.skyrocket.de/doc_stage/blok-d.htm, 2017. 14. M. Casali et al, "The UKIRT Wide-field Camera," Astronomy and Astrophysics, vol. 467, (2), pp. 777-784,
2007. 15. W.G. Grant (2018), “The MMT Observatory: Entering a New Era of Scientific Discovery,” Proceedings of the
SPIE, Ground-based and Airborne Telescopes VII, Vol. 10700, id. 107002T, 6 July 2018. 16. J.R.P. Angel, R.L Hilliard, and R.J. Weymann (1979), SAO Special Report, ed. T. Weekes, No. 385, p. 87. 17. G.D. Schmidt, R.H. Weymann, and C.B. Foltz (1989), “A Moderate-Resolution, High-Throughput CCD
Channel for the Multiple Mirror Telescope Spectrograph,” Publications Astronomical Society of the Pacific, Vol. 101, pp. 713–724, August 1989.
18. H. Krantz, E.C. Pearce, L. Avner, O. Durney, C. Sauve, C. (2018). “Chimera: A high-speed three-color photometer for space surveillance and astronomy,” Proceedings of the SPIE, Astronomical Telescopes and Instrumentation, Austin TX, 6 July 2018.
19. University of Arizona (2019), “Kuiper 61” Telescope”, https://www.as.arizona.edu/kuiper-61-telescope, downloaded 14 August 2019.
20. V. S. Yurasov, V. G. Vygon, and V.D. Shargorodskiy, "Classification and Identification of Geostationary Space Objects by Using Coordinate and Photometric Observations,” in Proceedings of the Sixth US/Russian Space Surveillance Workshop, Russian Academy of Science, St. Petersburg, Russia, 2005.
21. T. Cardona et al. (2016), “BVRI Photometric Observations and Light-Curve Analysis of GEO Objects,” Advances in Space Research, v. 58, pp 514–527.
22. Astropy Developers (2019), “Lomb-Scargle Periodgrams,” https://docs.astropy.org/en/stable/timeseries/lombscargle.html, downloaded 20 August 2019.
23. R.F. Stellingwerf (1978), “Period Determination Using Phase Dispersion Minimization”, Astrophysical Journal, v. 224, pp. 953–960, 15 September 1978.
24. T.P. Robitaille et al. (2013), “Astropy: A Community Python Package for Astronomy,” Astronomy and Astrophysics, v. 558, A33, October 2013.
25. K. Jorgensen, J. Africano, K. Hamada, et al., (2004), “Physical properties of orbital debris from spectroscopic observations,” Advances in Space Research, Vol. 34, 1021–1025.
26. D. Nishimoto, J. Africano, P. Sydney, et al. (2001), “Spectroscopic observations of space objects and phenomena using spica and kala at AMOS,” Proceedings of SPIE, v. 4490. San Diego, California.
27. M. Guyote, J. Okada, and K. Abercromby, (2006), “Using space weathering models to match observed spectra to predicted spectra,” Proceedings AMOS Conference, Maui HI, September 2006.
28. P. Massey, F. Valdes, J. Barnes (1992), "A User's Guide to Reducing Slit Spectra with IRAF," http://ast.noao.edu/sites/default/files/GMOS_Cookbook/_downloads/IRAF_LSreduce.pdf, downloaded 19-Aug-19.
29. S. Ramsay-Howat, M. Ellis, D. Gostick, P. Hastings, M. Strachan, and M. Wells, (2000), “Integration and testing of the UKIRT imaging spectrometer (UIST)”. Proceedings of SPIE, v. 4008, n. 1, pp. 1067–1075.
Copyright © 2019 Advanced Maui Optical and Space Surveillance Technologies Conference (AMOS) – www.amostech.com