Embed Size (px)
Citation preview
Prepared by
Department of Research and Analysis Division of Land Use and Environmental Planning Southern California Association of Governments
July 2013
Aging, Economy, and Responses

2
CSIS Global Aging Initiative
Richard Jackson
Director and Senior Fellow,
Global Aging Initiative
3
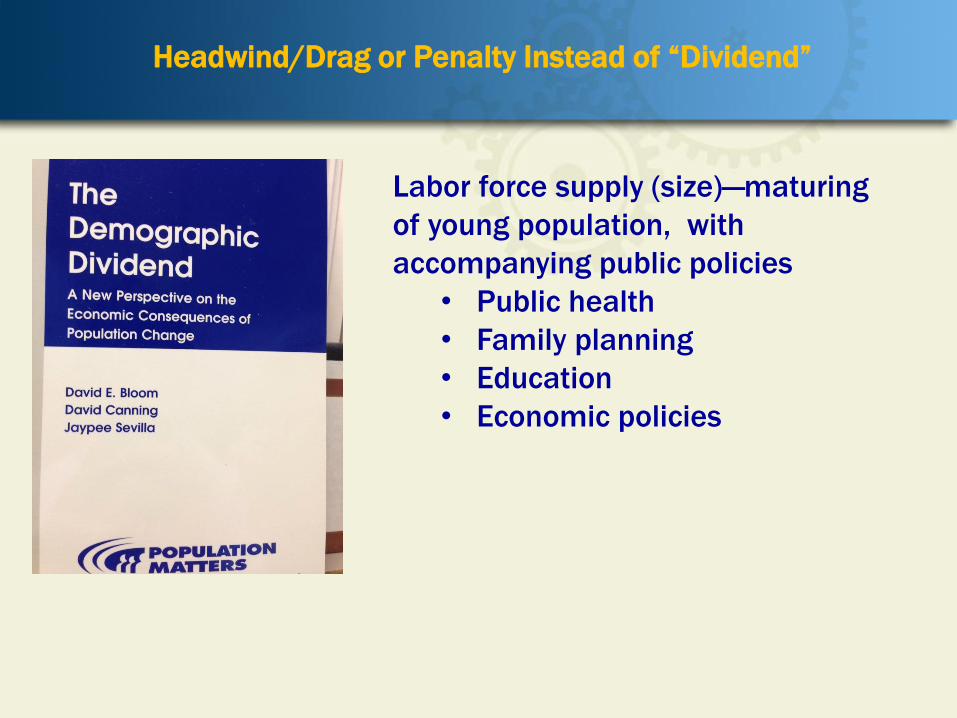
Headwind/Drag or Penalty Instead of “Dividend”
Labor force supply (size)—maturing
of young population, with
accompanying public policies
• Public health
• Family planning
• Education
• Economic policies
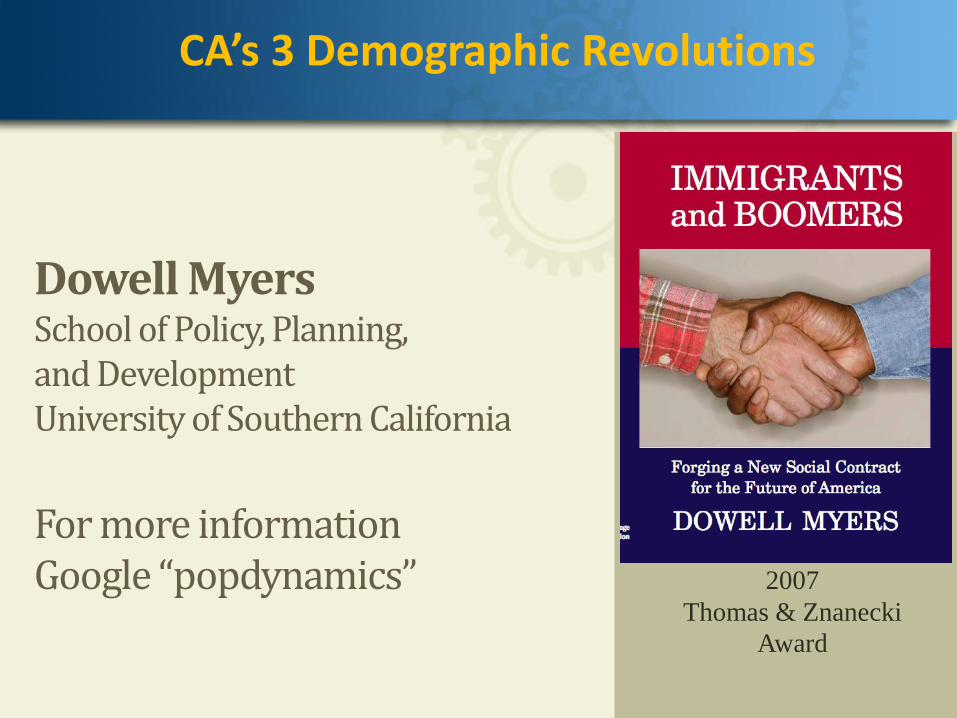
Dowell Myers School of Policy, Planning, and Development University of Southern California
For more information Google “popdynamics”
2007
Thomas & Znanecki
Award
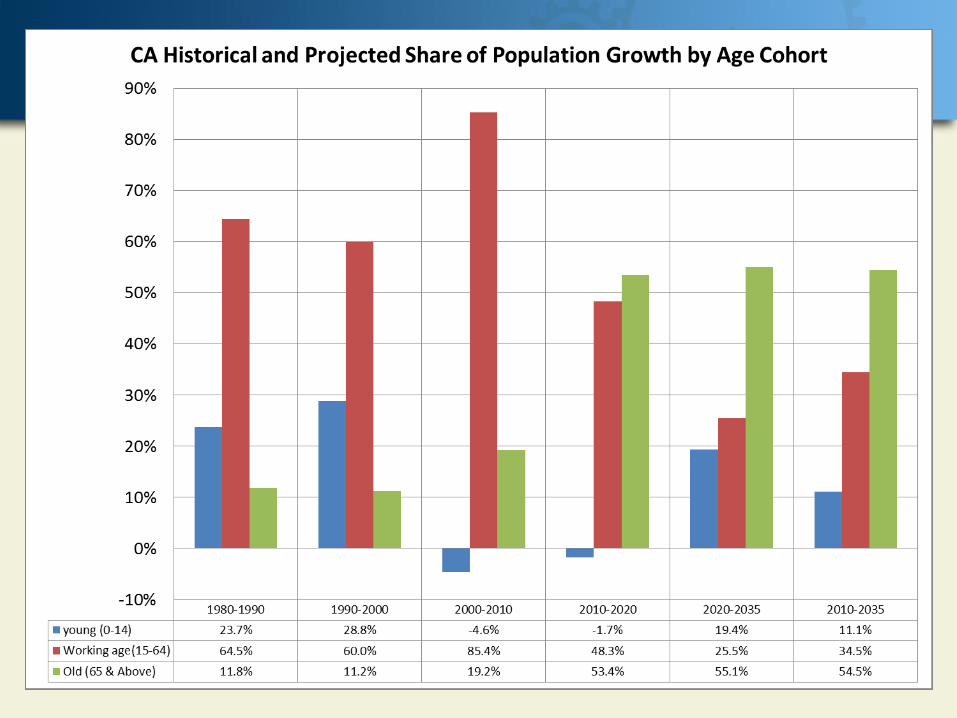
CA’s 3 Demographic Revolutions
5
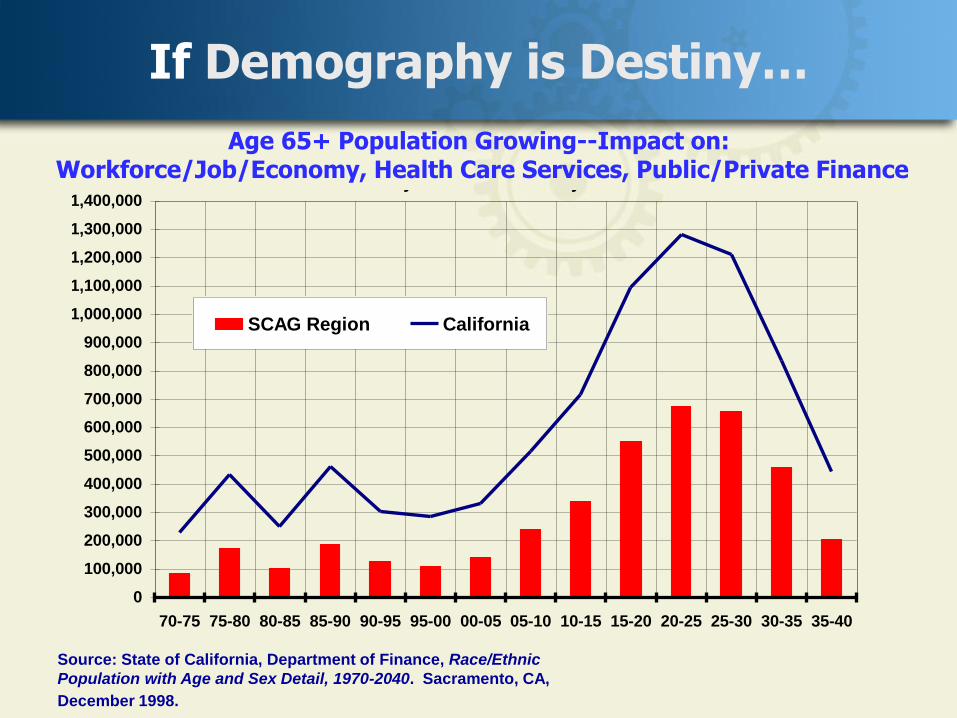
If Demography is Destiny… Population Age Cohort-Ages 65 and Over:
Impact on Workforce, Health Care/Service, Will They Bankrupt the
Economy and Social Security?
0
100,000
200,000
300,000
400,000
500,000
600,000
700,000
800,000
900,000
1,000,000
1,100,000
1,200,000
1,300,000
1,400,000
70-75 75-80 80-85 85-90 90-95 95-00 00-05 05-10 10-15 15-20 20-25 25-30 30-35 35-40
SCAG Region California
Source: State of California, Department of Finance, Race/Ethnic
Population with Age and Sex Detail, 1970-2040. Sacramento, CA,
December 1998.
Age 65+ Population Growing--Impact on: Workforce/Job/Economy, Health Care Services, Public/Private Finance
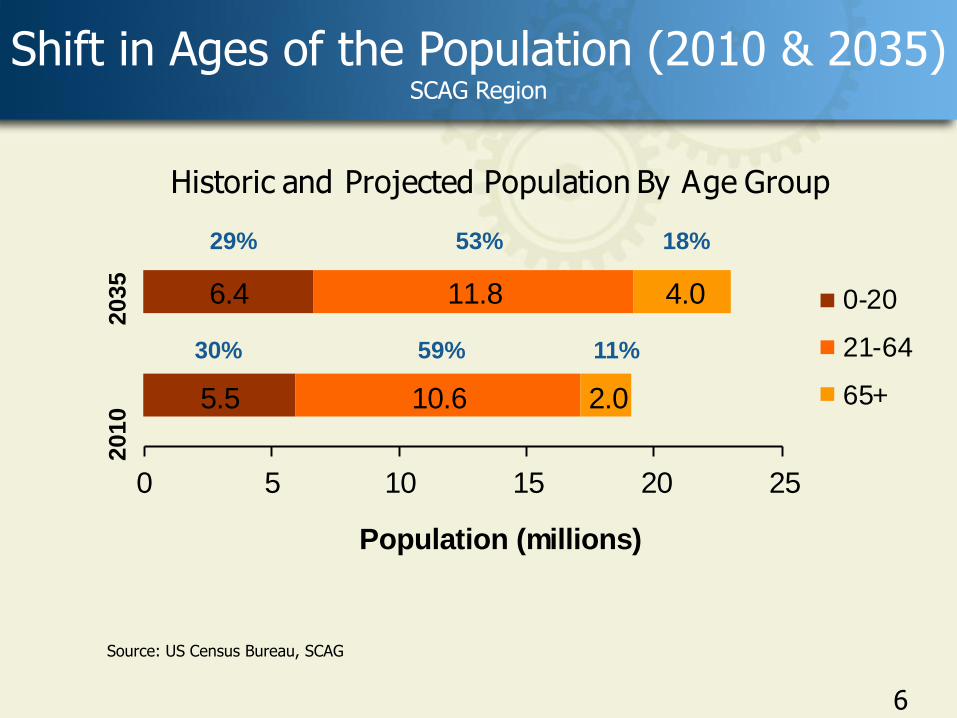
Shift in Ages of the Population (2010 & 2035) SCAG Region
5.5
6.4
10.6
11.8
2.0
4.0
0 5 10 15 20 25
Population (millions)
Historic and Projected Population By Age Group
0-20
21-64
65+
2010
2035
30%
29%
59%
53%
11%
18%
Source: US Census Bureau, SCAG
6
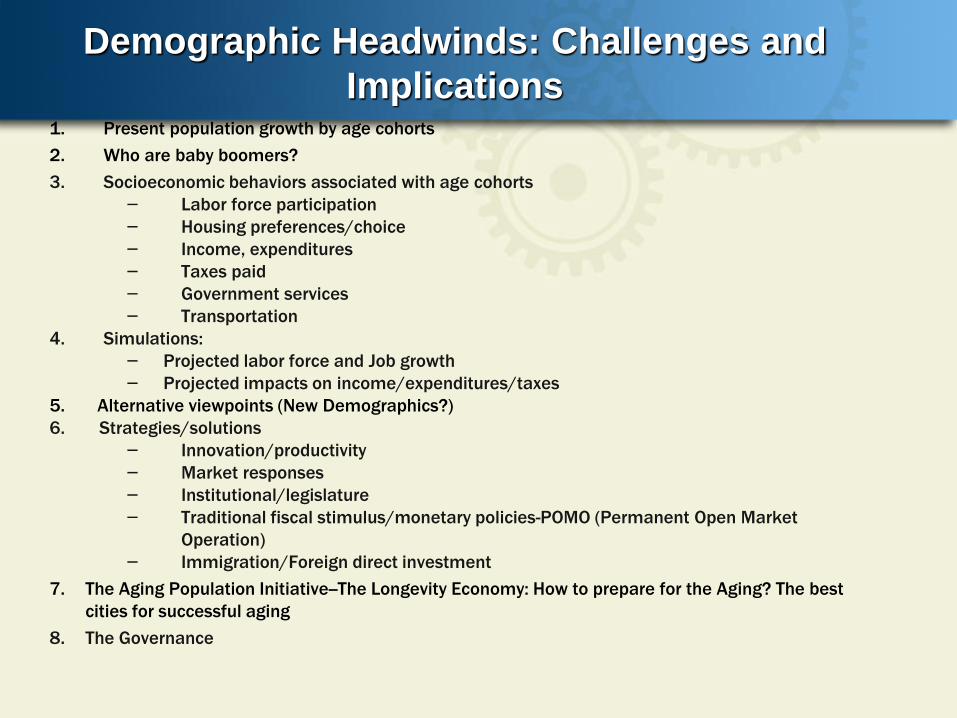
7
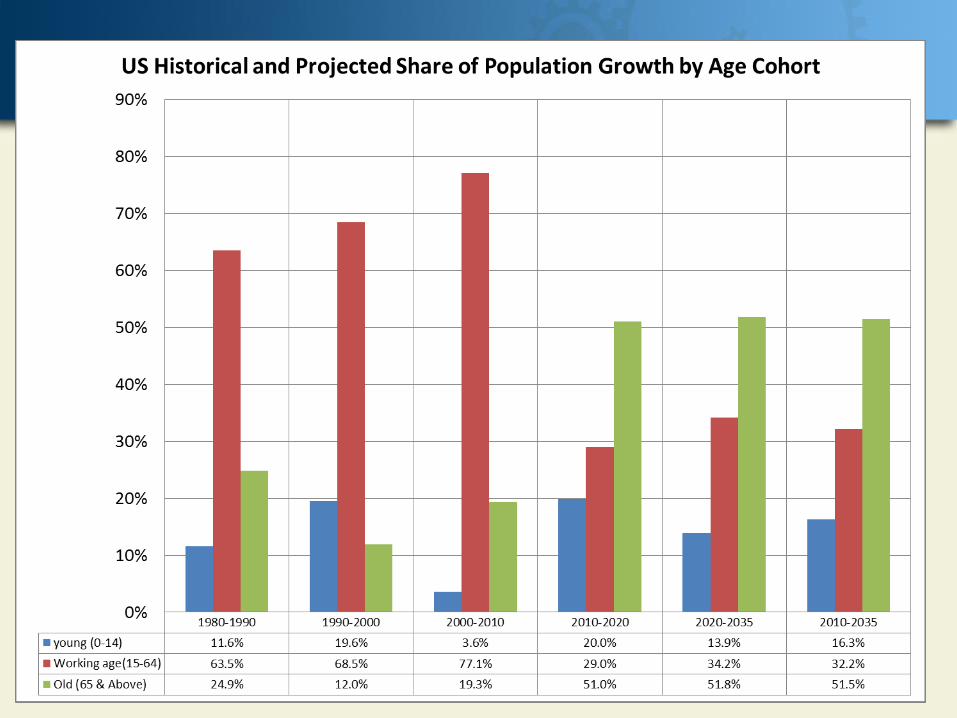
Demographic Headwinds: Challenges and
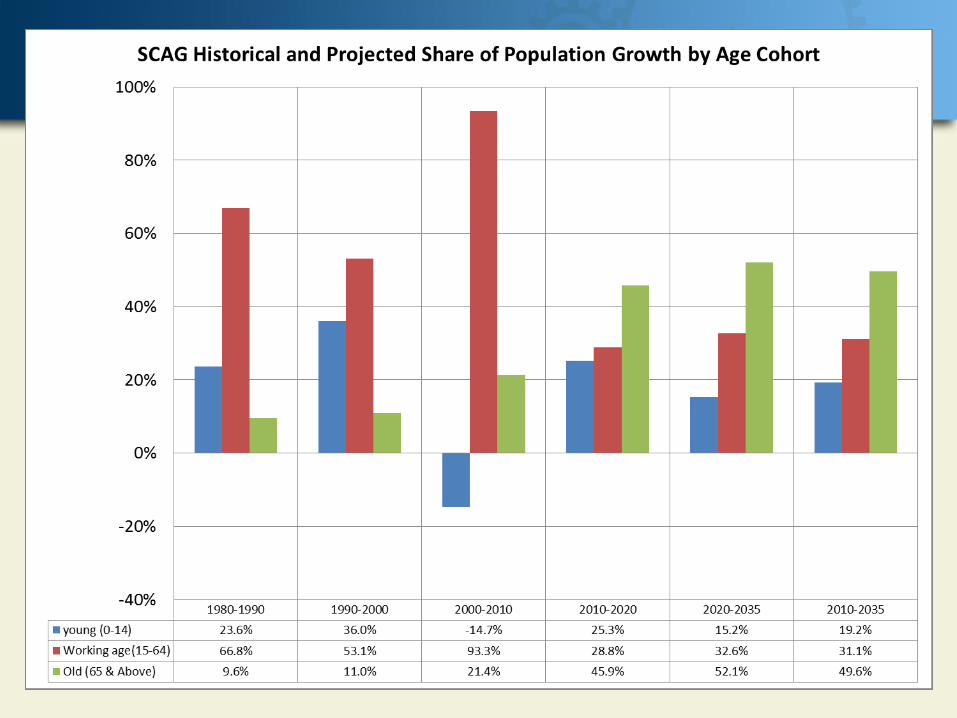
Implications 1. Present population growth by age cohorts
2. Who are baby boomers?
3. Socioeconomic behaviors associated with age cohorts
– Labor force participation
– Housing preferences/choice
– Income, expenditures
– Taxes paid
– Government services
– Transportation
4. Simulations:
– Projected labor force and Job growth
– Projected impacts on income/expenditures/taxes
5. Alternative viewpoints (New Demographics?)
6. Strategies/solutions
– Innovation/productivity
– Market responses
– Institutional/legislature
– Traditional fiscal stimulus/monetary policies-POMO (Permanent Open Market
Operation)
– Immigration/Foreign direct investment
7. The Aging Population Initiative--The Longevity Economy: How to prepare for the Aging? The best
cities for successful aging
8. The Governance
8
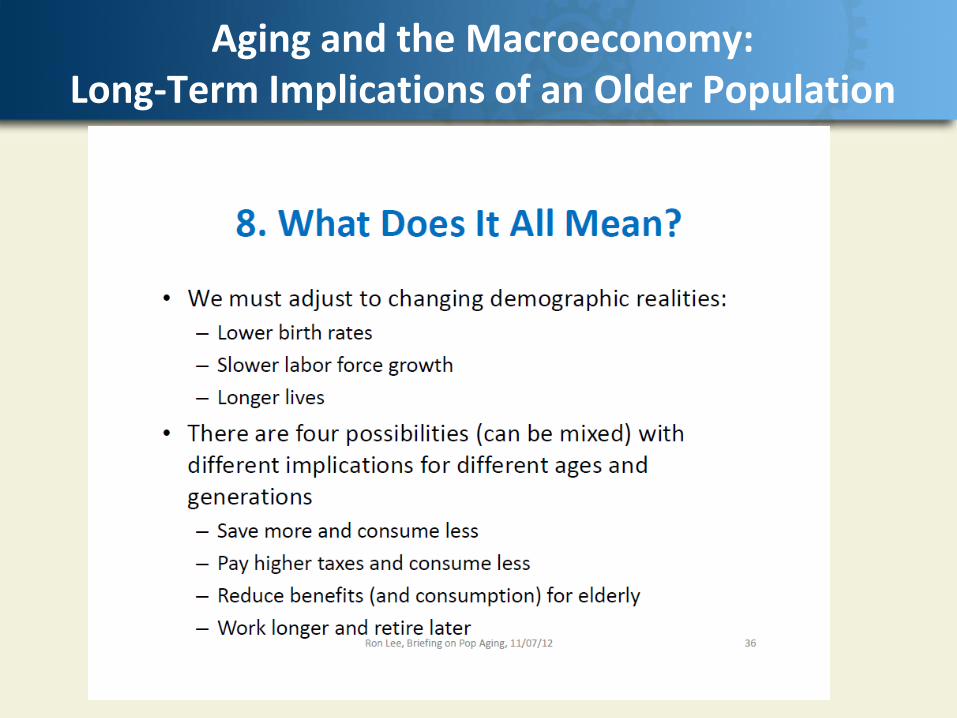
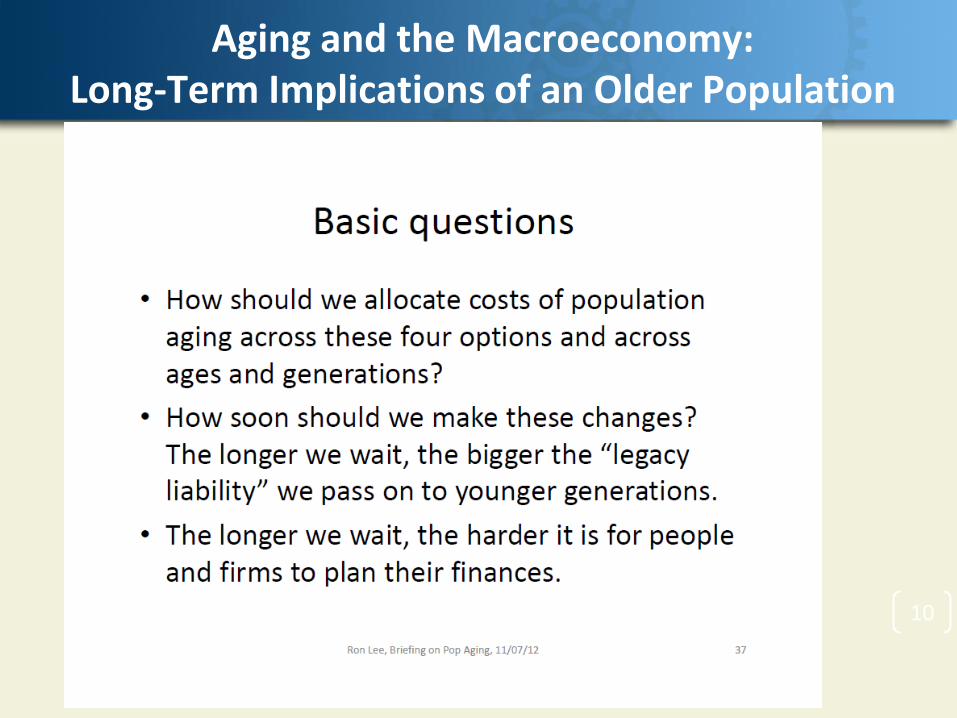
Aging and the Macroeconomy:
Long-Term Implications of an Older Population
Aging and the Macroeconomy: Long-Term Implications of an Older Population
10
Aging and the Macroeconomy: Long-Term Implications of an Older Population

11
Alternative View Point: Growing Debate About Dwindling Innovation
Will we ever
invent anything this useful
again?
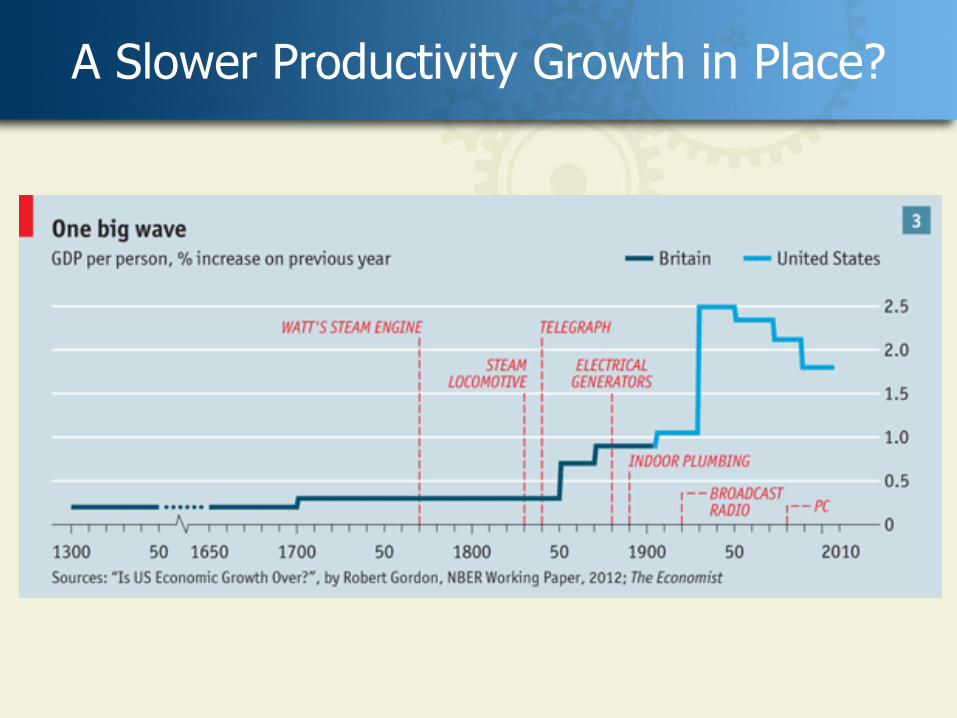
12
A Slower Productivity Growth in Place?
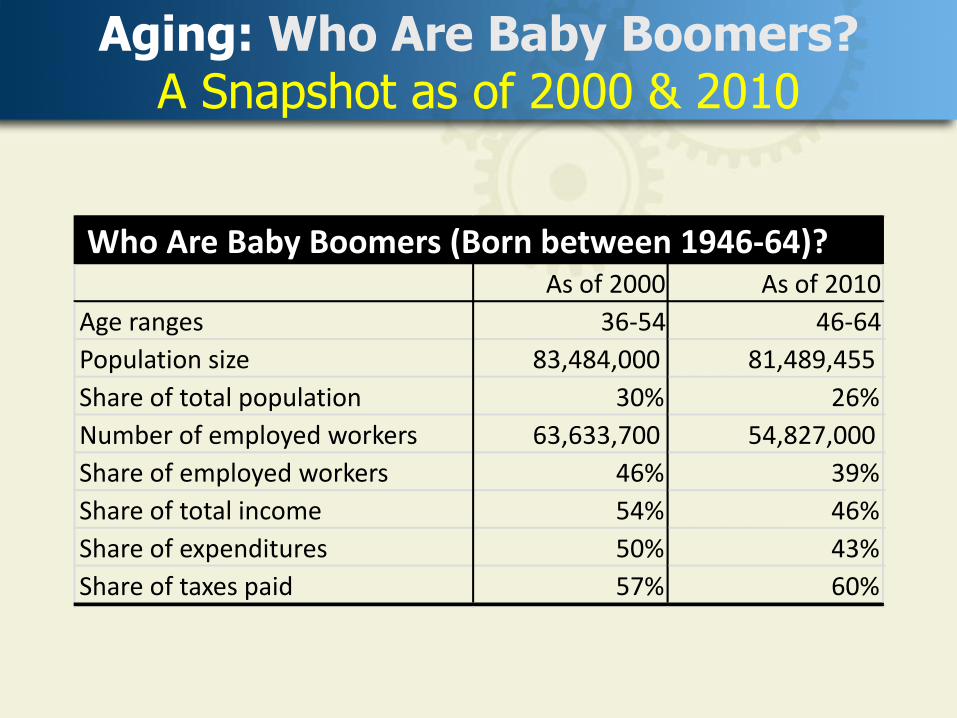
Aging: Who Are Baby Boomers? A Snapshot as of 2000 & 2010
As of 2000 As of 2010
Age ranges 36-54 46-64
Population size 83,484,000 81,489,455
Share of total population 30% 26%
Number of employed workers 63,633,700 54,827,000
Share of employed workers 46% 39%
Share of total income 54% 46%
Share of expenditures 50% 43%
Share of taxes paid 57% 60%
Who Are Baby Boomers (Born between 1946-64)?
18
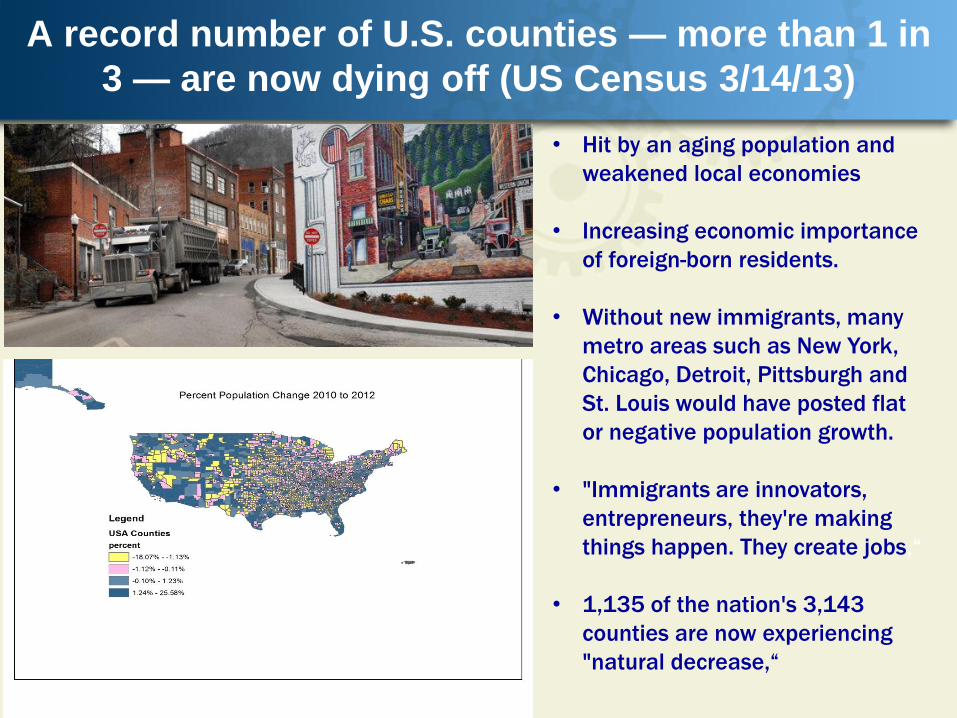
A record number of U.S. counties — more than 1 in
3 — are now dying off (US Census 3/14/13)
• Hit by an aging population and
weakened local economies
• Increasing economic importance
of foreign-born residents.
• Without new immigrants, many
metro areas such as New York,
Chicago, Detroit, Pittsburgh and
St. Louis would have posted flat
or negative population growth.
• "Immigrants are innovators,
entrepreneurs, they're making
things happen. They create jobs,“
• 1,135 of the nation's 3,143
counties are now experiencing
"natural decrease,“
19
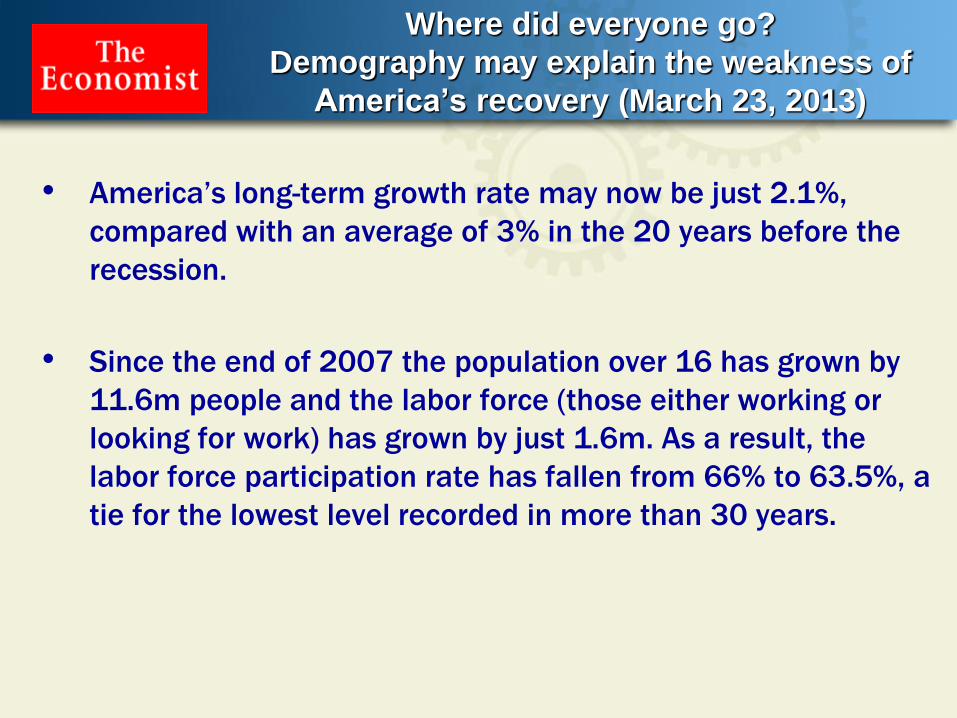
Where did everyone go?
Demography may explain the weakness of
America’s recovery (March 23, 2013)
• America’s long-term growth rate may now be just 2.1%,
compared with an average of 3% in the 20 years before the
recession.
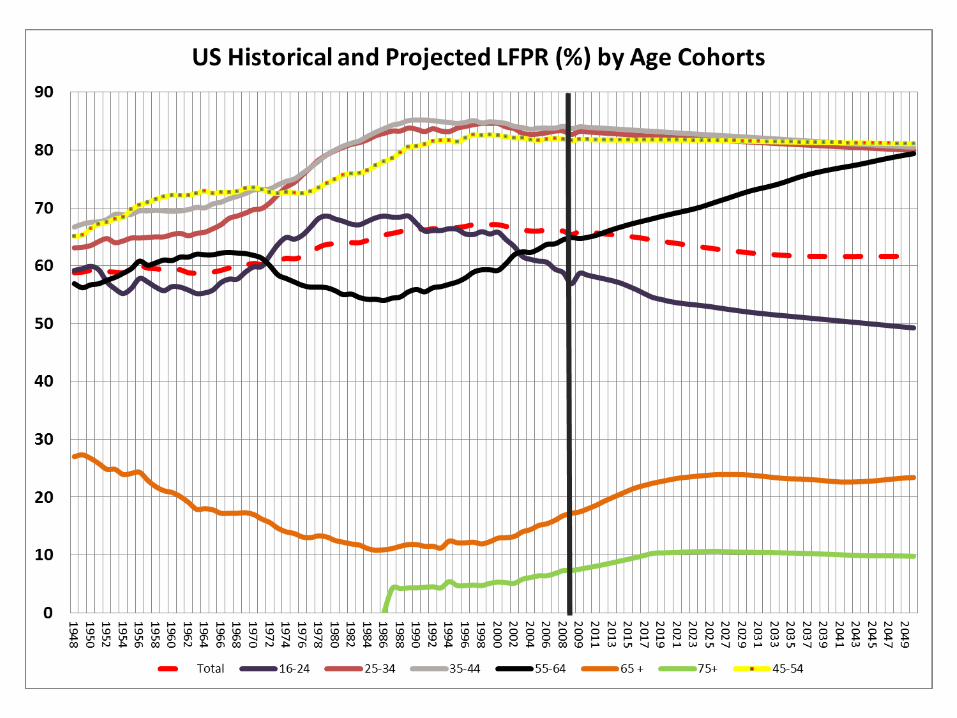
• Since the end of 2007 the population over 16 has grown by
11.6m people and the labor force (those either working or
looking for work) has grown by just 1.6m. As a result, the
labor force participation rate has fallen from 66% to 63.5%, a
tie for the lowest level recorded in more than 30 years.
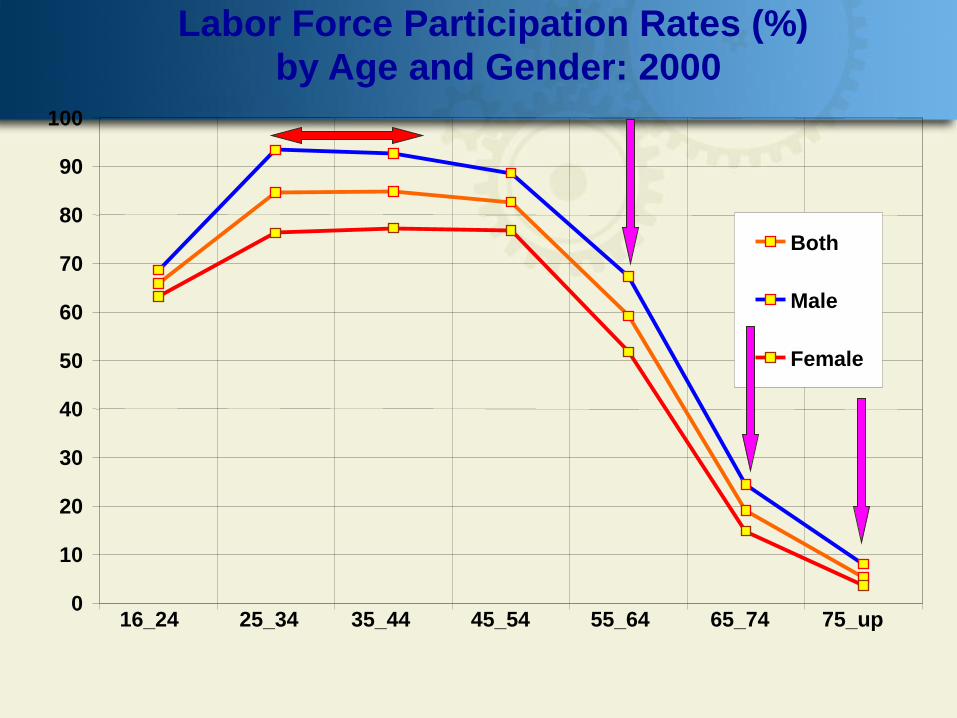
Labor Force Participation Rates (%) by Age and Gender: 2000
0
10
20
30
40
50
60
70
80
90
100
16_24 25_34 35_44 45_54 55_64 65_74 75_up
Both
Male
Female
22
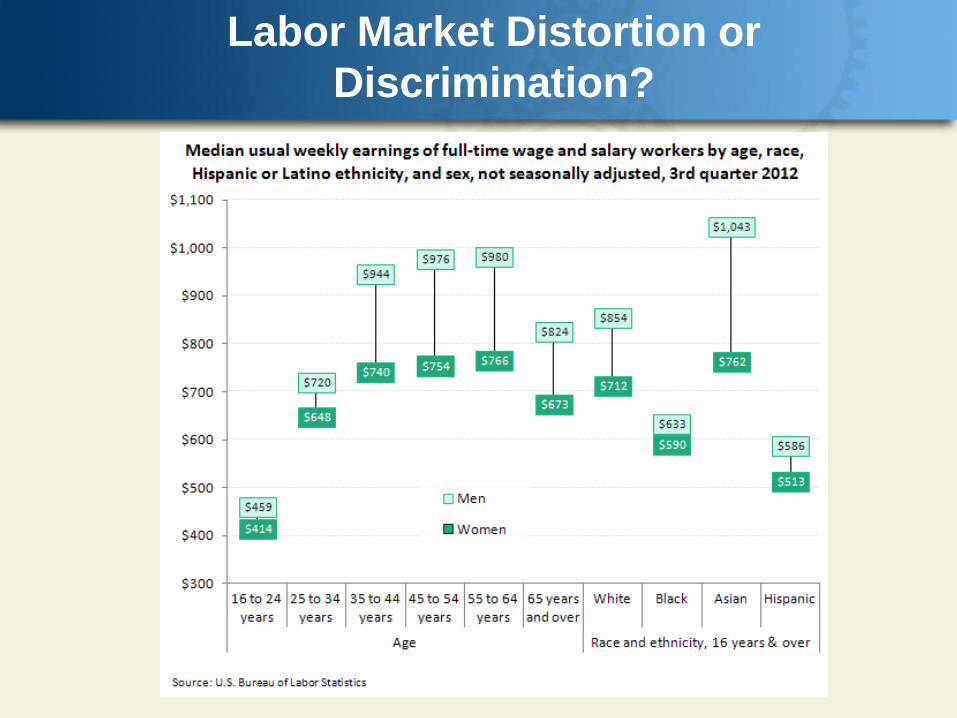
Labor Market Distortion or
Discrimination?
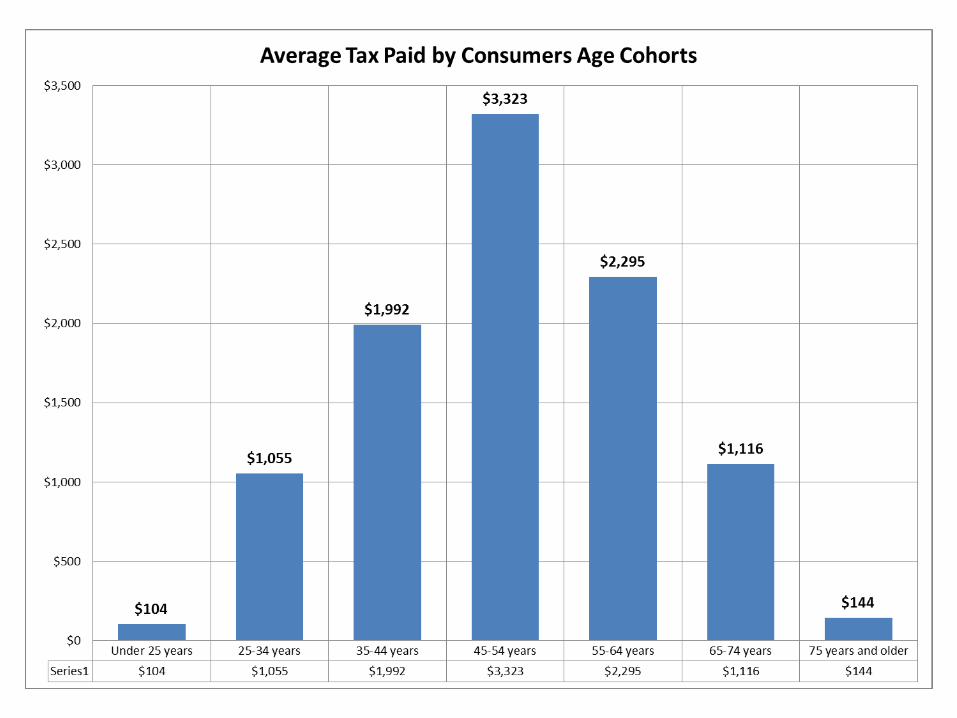
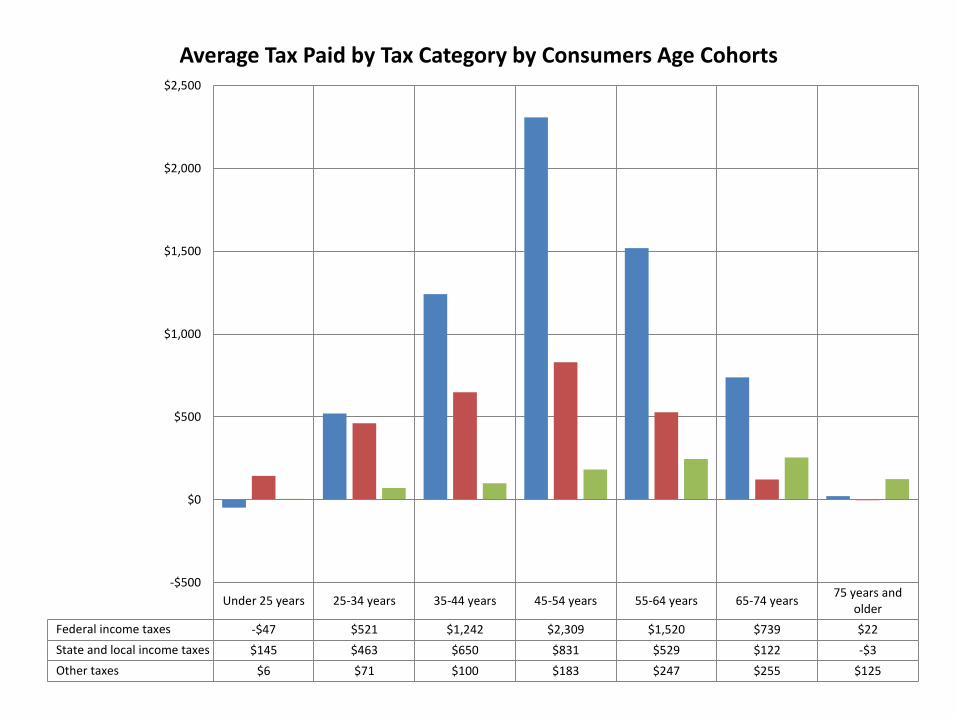
Under 25 years 25-34 years 35-44 years 45-54 years 55-64 years 65-74 years75 years and
older
Federal income taxes -$47 $521 $1,242 $2,309 $1,520 $739 $22
State and local income taxes $145 $463 $650 $831 $529 $122 -$3
Other taxes $6 $71 $100 $183 $247 $255 $125
-$500
$0
$500
$1,000
$1,500
$2,000
$2,500
Average Tax Paid by Tax Category by Consumers Age Cohorts
$0
$2,000
$4,000
$6,000
$8,000
$10,000
$12,000
$14,000
$16,000
$18,000
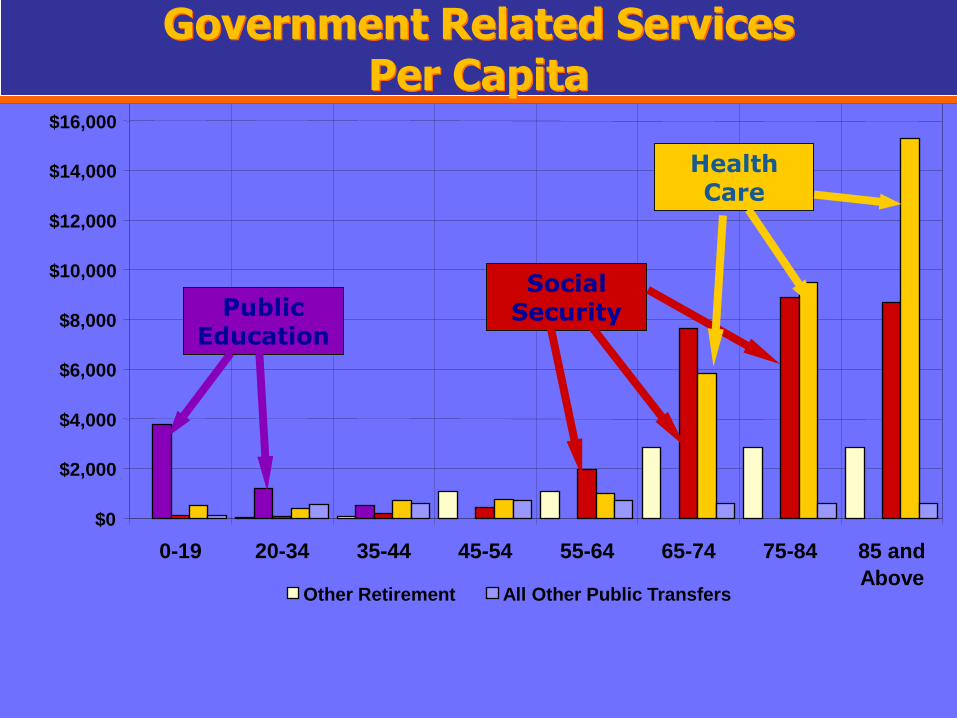
0-19 20-34 35-44 45-54 55-64 65-74 75-84 85 and
Above Other Retirement All Other Public Transfers
Public Education
Social Security
Health Care
Government Related Services Per Capita
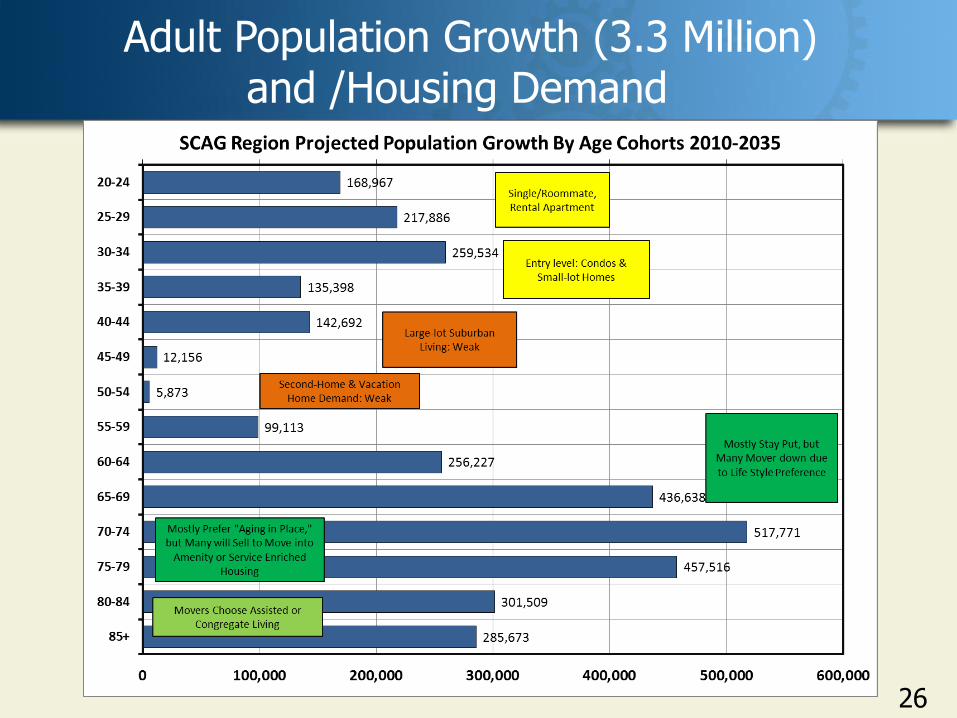
Adult Population Growth (3.3 Million) and /Housing Demand
26
Adult Population Growth (3.3 Million) and / Emerging Housing Demand?
27
• Across age-cohorts: • Multi-generation housing • The home within a home—Lennar’s NEXT GEN • The first national homebuilder to recognize the need of
individual homebuyers and families to “double up or triple-up” • To share the cost of their mortgage and other living expenses. • In response to this growing trend, Lennar offers NEXT GENSM –
The Home within a Home®, • A great solution for:
• long-term guests, • family members or • anyone else who can utilize this innovative space.
• Financial-A sharing economy? • Family-ties and needs • Over supply
Emerging Housing Demand: The Facts About Multigenerational Living In America
?
28
According to the Census Bureau, • 1 in 6 Americans currently lives in a multigenerational
household. • Up 15% from two years previous.
Pew Research Center: the percentage of adults who live in a multigenerational household has increased almost 22% over the past 20 years. In 2009: 24% of foreign-born households 15.6% US-born households 25.8% Asian households 23.7% Black households 23.4% Hispanic households 13.1% White households
What’s driving the interest?
29
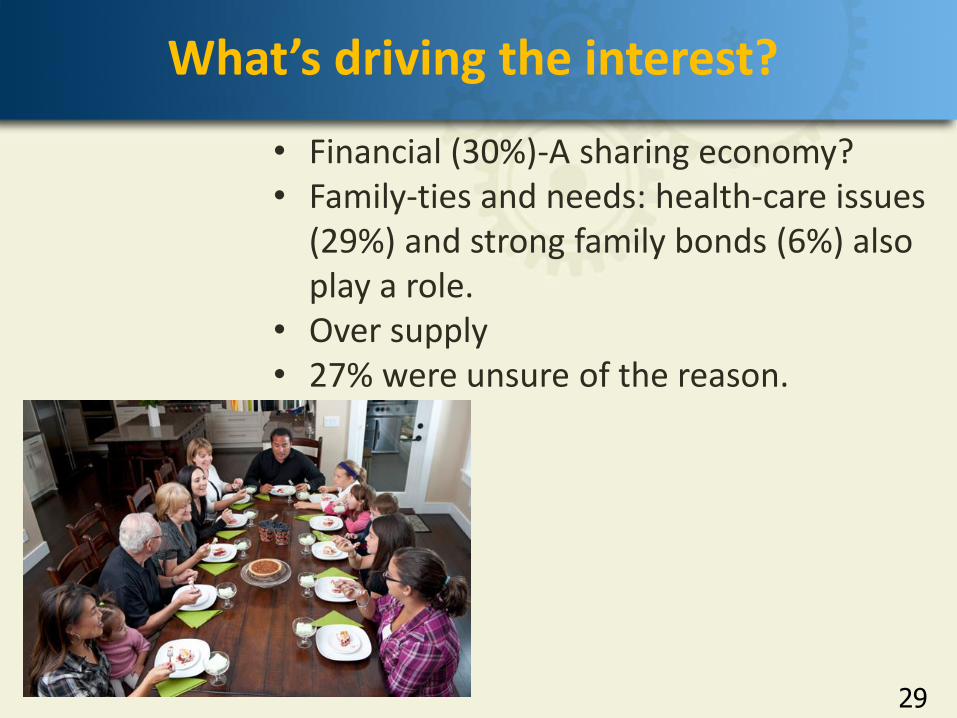
• Financial (30%)-A sharing economy? • Family-ties and needs: health-care issues
(29%) and strong family bonds (6%) also play a role.
• Over supply • 27% were unsure of the reason.
Five Driving Factors For Multigenerational Families
30
1. Economic Conditions 2. All The Single Ladies 3. Cultural Preferences 4. Family Matters 5. Health & Disability
For Multigenerational Families: Outlook It is here to stay
31
Whether you believe that multigenerational living is a wonderful resurrection of what was nearly an extinct way of life in America… or you think is a cop-out by generations x-y and z…
• Since 1990 the number of multigenerational households has grown by almost 40%.
• With an increase in life expectancy, more baby boomers retiring and pension funds decreasing it is certain these numbers will only continue to rise over the next 10-20 years.
• It simply makes economic sense in the midst of a widespread economic lull.
• For many it is compulsory, and for many others, they simply wouldn’t have it any other way.

Emerging Housing Demand?
32
Michael Litchfield, “In-Laws, Outlaws, and Granny Flats: Your Guide to Turning One House into Two Homes.”

Emerging Housing Demand?
33
Multigenerational Homes: Real Estate's Next Big Thing as More Families Share a Space
Emerging Housing Demand?
34
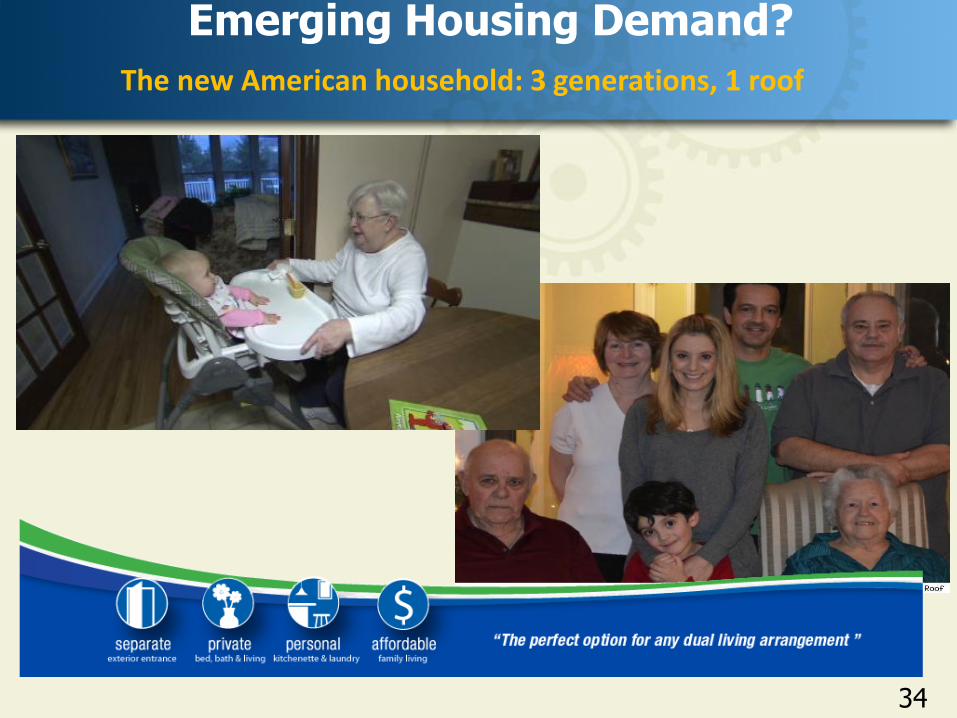
The new American household: 3 generations, 1 roof
35
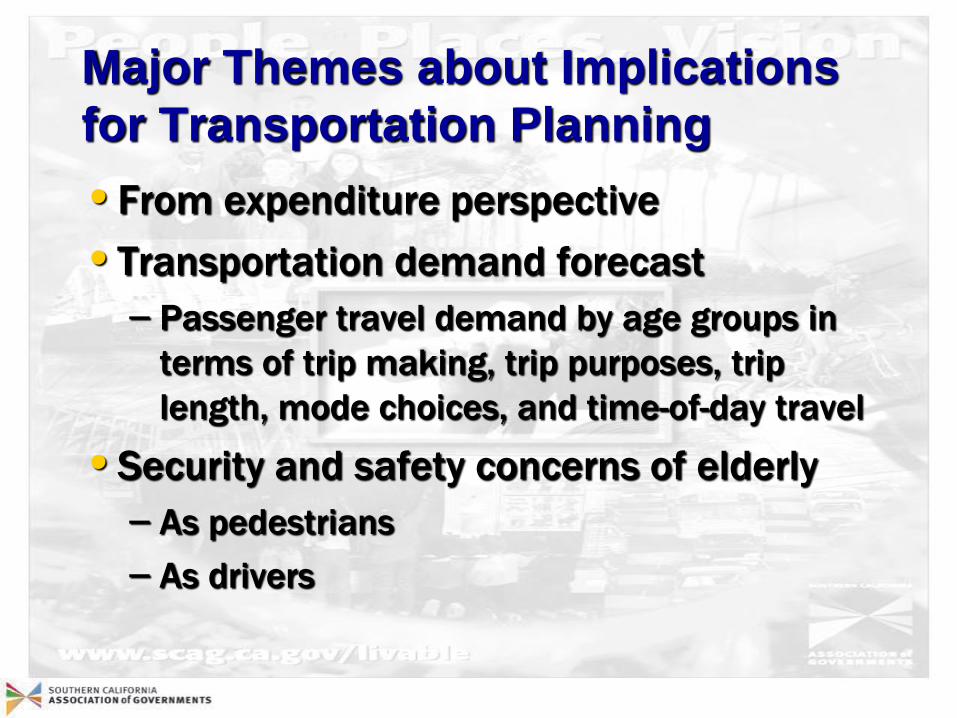
Major Themes about Implications
for Transportation Planning
•From expenditure perspective
•Transportation demand forecast
– Passenger travel demand by age groups in
terms of trip making, trip purposes, trip
length, mode choices, and time-of-day travel
•Security and safety concerns of elderly
– As pedestrians
– As drivers
36
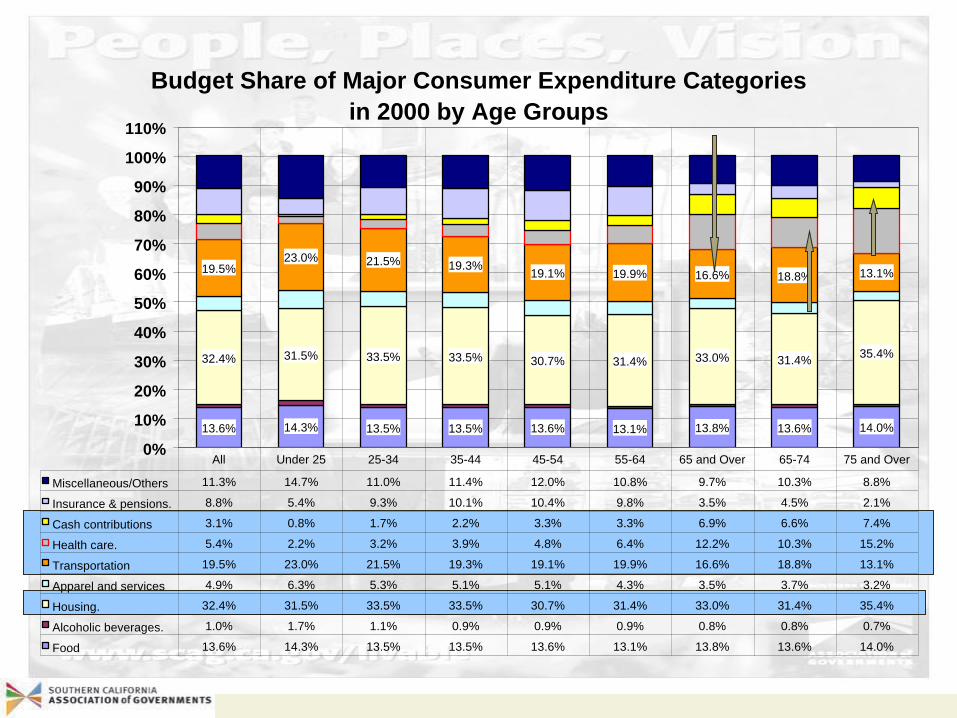
Budget Share of Major Consumer Expenditure Categories
in 2000 by Age Groups
13.6% 14.3% 13.5% 13.5% 13.6% 13.1% 13.8% 13.6% 14.0%
32.4% 31.5% 33.5% 33.5% 30.7% 31.4% 33.0% 31.4%35.4%
19.5%23.0% 21.5% 19.3%
19.1% 19.9% 16.6% 18.8% 13.1%
0%
10%
20%
30%
40%
50%
60%
70%
80%
90%
100%
110%
Miscellaneous/Others 11.3% 14.7% 11.0% 11.4% 12.0% 10.8% 9.7% 10.3% 8.8%
Insurance & pensions. 8.8% 5.4% 9.3% 10.1% 10.4% 9.8% 3.5% 4.5% 2.1%
Cash contributions 3.1% 0.8% 1.7% 2.2% 3.3% 3.3% 6.9% 6.6% 7.4%
Health care. 5.4% 2.2% 3.2% 3.9% 4.8% 6.4% 12.2% 10.3% 15.2%
Transportation 19.5% 23.0% 21.5% 19.3% 19.1% 19.9% 16.6% 18.8% 13.1%
Apparel and services 4.9% 6.3% 5.3% 5.1% 5.1% 4.3% 3.5% 3.7% 3.2%
Housing. 32.4% 31.5% 33.5% 33.5% 30.7% 31.4% 33.0% 31.4% 35.4%
Alcoholic beverages. 1.0% 1.7% 1.1% 0.9% 0.9% 0.9% 0.8% 0.8% 0.7%
Food 13.6% 14.3% 13.5% 13.5% 13.6% 13.1% 13.8% 13.6% 14.0%
All Under 25 25-34 35-44 45-54 55-64 65 and Over 65-74 75 and Over
37
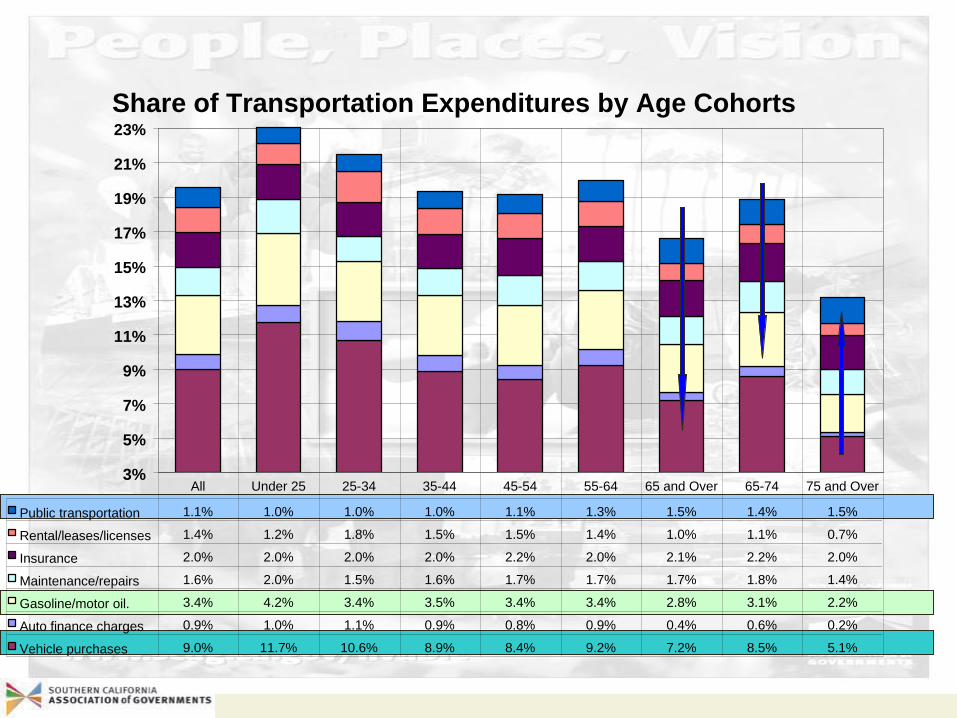
Share of Transportation Expenditures by Age Cohorts
3%
5%
7%
9%
11%
13%
15%
17%
19%
21%
23%
Public transportation 1.1% 1.0% 1.0% 1.0% 1.1% 1.3% 1.5% 1.4% 1.5%
Rental/leases/licenses 1.4% 1.2% 1.8% 1.5% 1.5% 1.4% 1.0% 1.1% 0.7%
Insurance 2.0% 2.0% 2.0% 2.0% 2.2% 2.0% 2.1% 2.2% 2.0%
Maintenance/repairs 1.6% 2.0% 1.5% 1.6% 1.7% 1.7% 1.7% 1.8% 1.4%
Gasoline/motor oil. 3.4% 4.2% 3.4% 3.5% 3.4% 3.4% 2.8% 3.1% 2.2%
Auto finance charges 0.9% 1.0% 1.1% 0.9% 0.8% 0.9% 0.4% 0.6% 0.2%
Vehicle purchases 9.0% 11.7% 10.6% 8.9% 8.4% 9.2% 7.2% 8.5% 5.1%
All Under 25 25-34 35-44 45-54 55-64 65 and Over 65-74 75 and Over
38
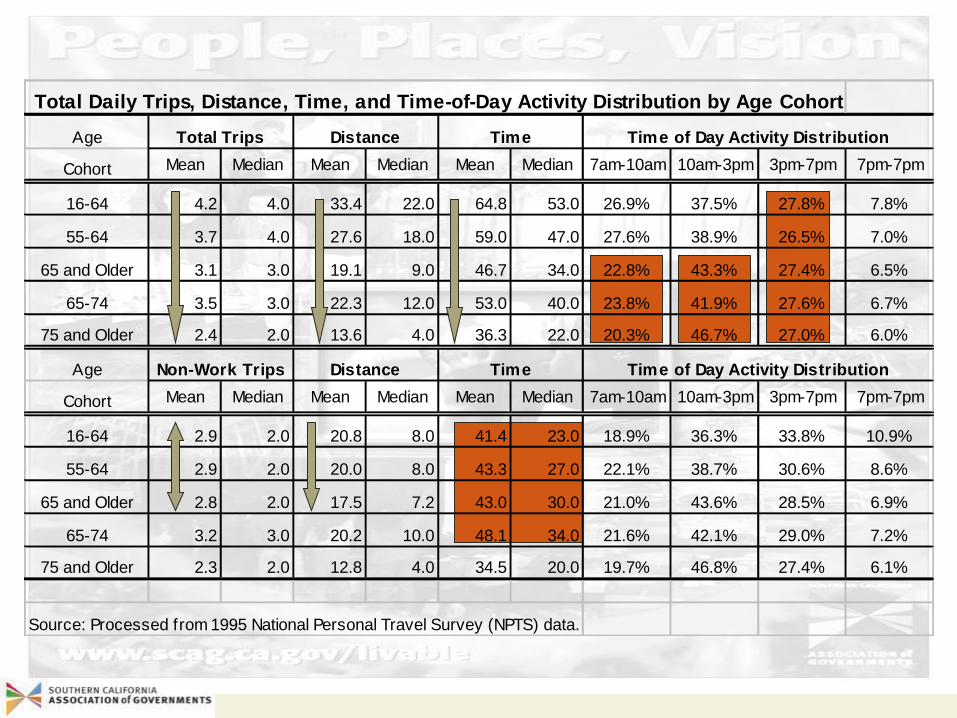
Total Daily Trips, Distance, Time, and Time-of-Day Activity Distribution by Age Cohort
Age
Cohort Mean Median Mean Median Mean Median 7am-10am 10am-3pm 3pm-7pm 7pm-7pm
16-64 4.2 4.0 33.4 22.0 64.8 53.0 26.9% 37.5% 27.8% 7.8%
55-64 3.7 4.0 27.6 18.0 59.0 47.0 27.6% 38.9% 26.5% 7.0%
65 and Older 3.1 3.0 19.1 9.0 46.7 34.0 22.8% 43.3% 27.4% 6.5%
65-74 3.5 3.0 22.3 12.0 53.0 40.0 23.8% 41.9% 27.6% 6.7%
75 and Older 2.4 2.0 13.6 4.0 36.3 22.0 20.3% 46.7% 27.0% 6.0%
Age
Cohort Mean Median Mean Median Mean Median 7am-10am 10am-3pm 3pm-7pm 7pm-7pm
16-64 2.9 2.0 20.8 8.0 41.4 23.0 18.9% 36.3% 33.8% 10.9%
55-64 2.9 2.0 20.0 8.0 43.3 27.0 22.1% 38.7% 30.6% 8.6%
65 and Older 2.8 2.0 17.5 7.2 43.0 30.0 21.0% 43.6% 28.5% 6.9%
65-74 3.2 3.0 20.2 10.0 48.1 34.0 21.6% 42.1% 29.0% 7.2%
75 and Older 2.3 2.0 12.8 4.0 34.5 20.0 19.7% 46.8% 27.4% 6.1%
Source: Processed from 1995 National Personal Travel Survey (NPTS) data.
Time of Day Activity Distribution
Time of Day Activity Distribution
Total Trips
Non-Work Trips Distance Time
TimeDistance
39
0
10
20
30
40
50
60
70
<5 5-9 10-15 16-20 21-24 25-34 35-44 45-54 55-64 65-74 >74 Total
Female
Total
Male
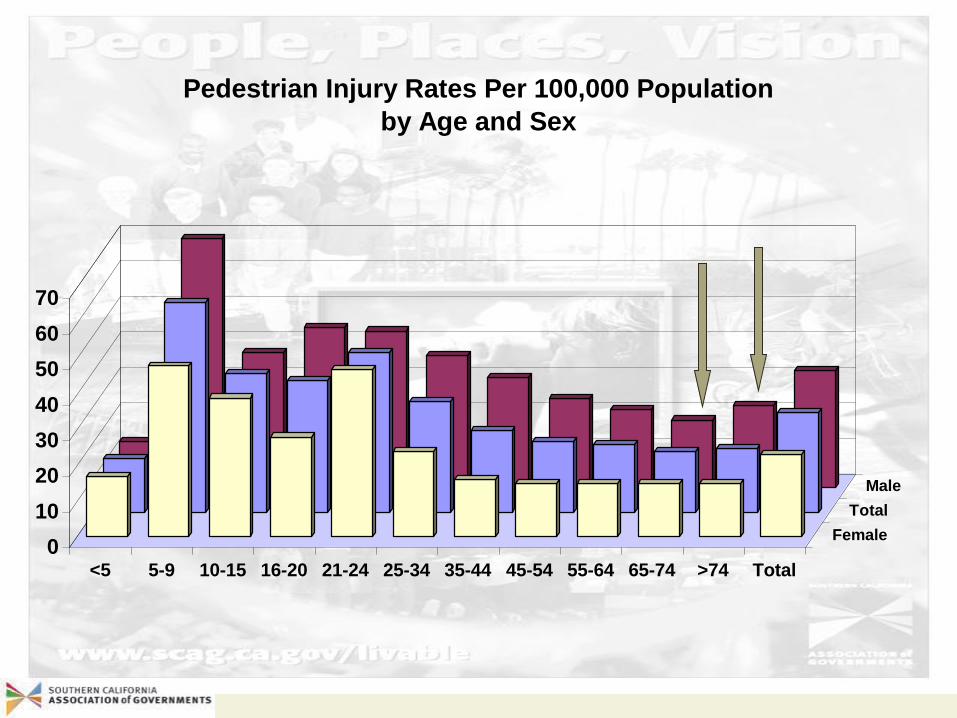
Pedestrian Injury Rates Per 100,000 Population
by Age and Sex
40
0
1
2
3
4
5
6
<5 5-9 10-15 16-20 21-24 25-34 35-44 45-54 55-64 65-74 >74 Total
Female
Total
Male
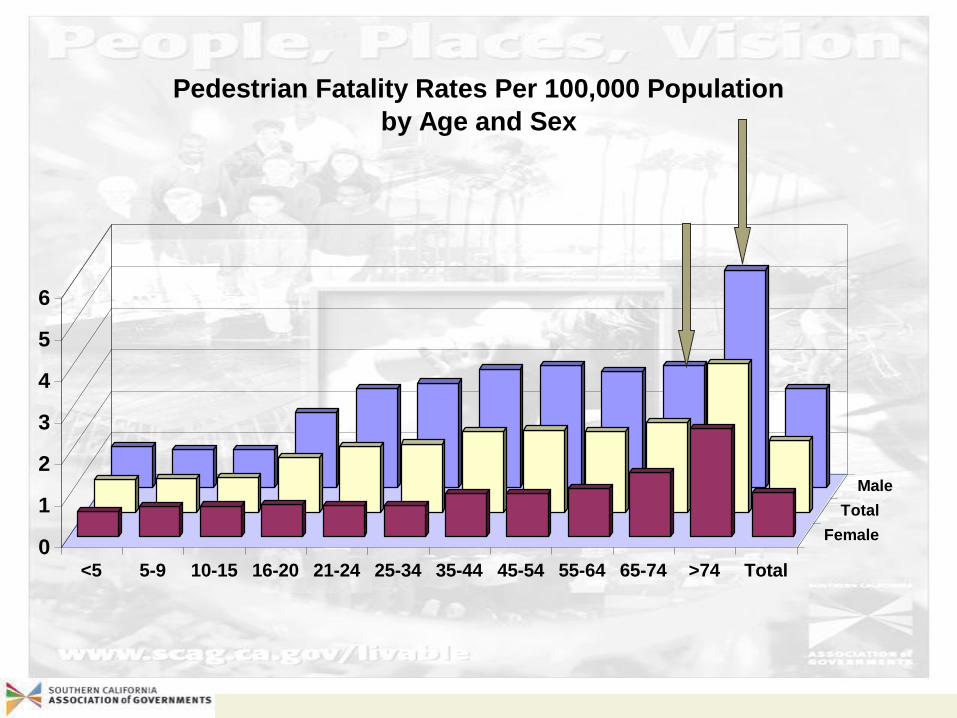
Pedestrian Fatality Rates Per 100,000 Population
by Age and Sex
41
0
20
40
60
80
100
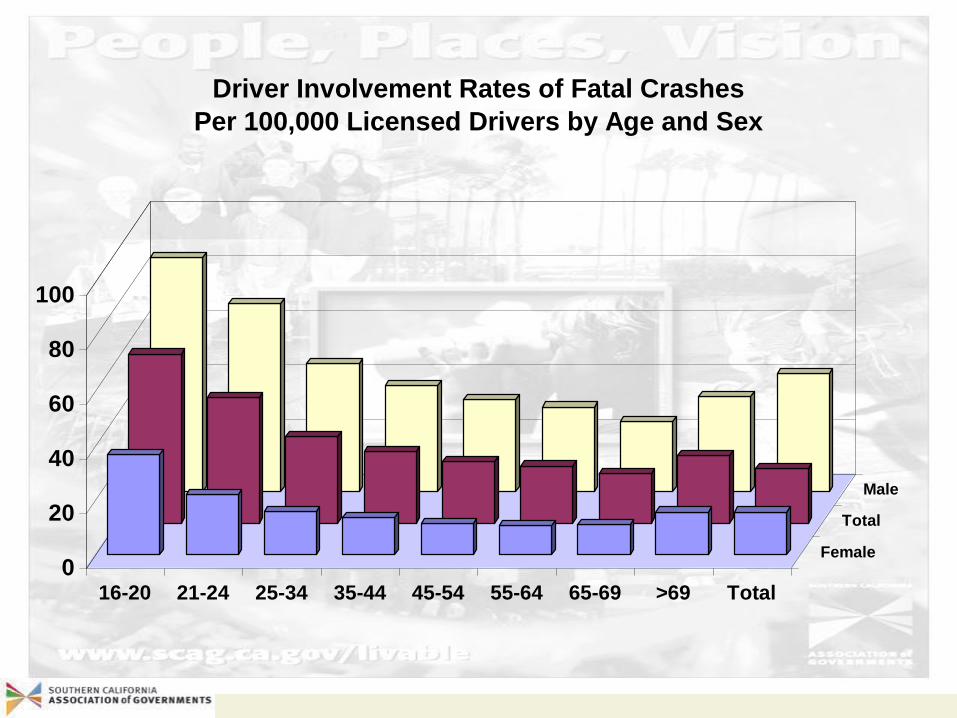
16-20 21-24 25-34 35-44 45-54 55-64 65-69 >69 Total
Female
Total
Male
Driver Involvement Rates of Fatal Crashes
Per 100,000 Licensed Drivers by Age and Sex
42
0
1000
2000
3000
4000
5000
6000
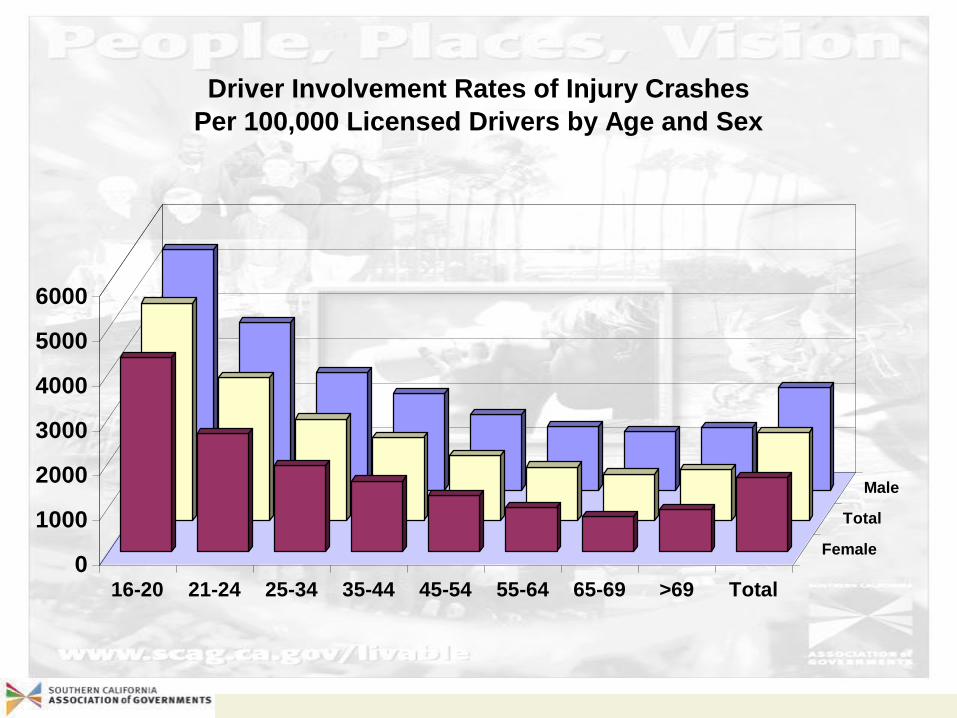
16-20 21-24 25-34 35-44 45-54 55-64 65-69 >69 Total
Female
Total
Male
Driver Involvement Rates of Injury Crashes
Per 100,000 Licensed Drivers by Age and Sex
43
0
2000
4000
6000
8000
10000
12000
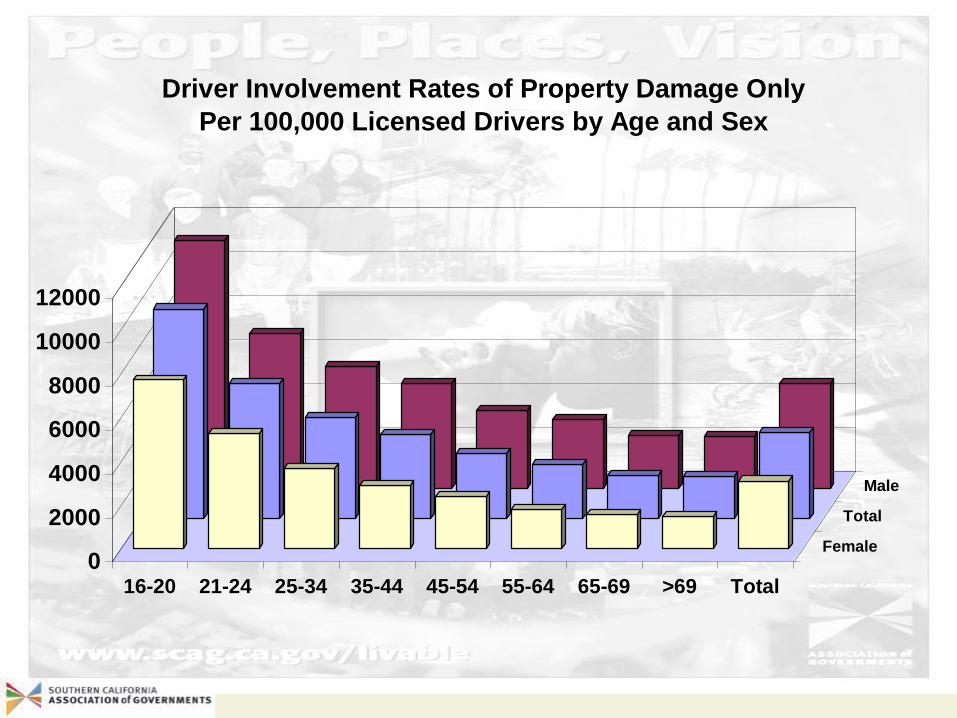
16-20 21-24 25-34 35-44 45-54 55-64 65-69 >69 Total
Female
Total
Male
Driver Involvement Rates of Property Damage Only
Per 100,000 Licensed Drivers by Age and Sex
44
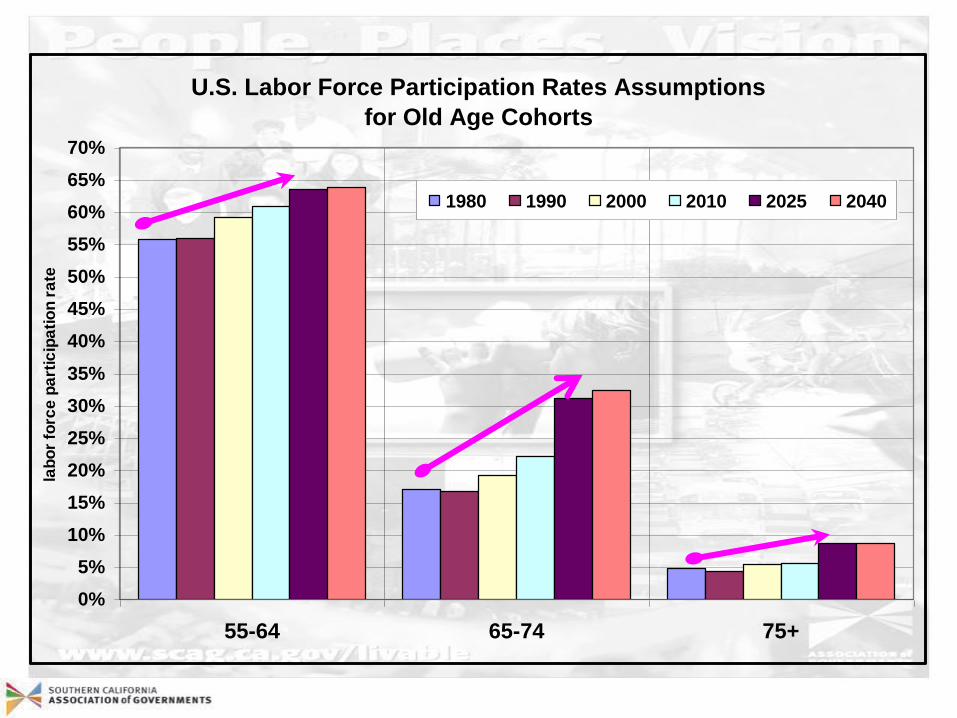
A simulation: Projected Job growth
1. Use projected population growth by age cohorts
2. Apply assumptions of future labor force participation
rates by age
3. Derive the growth in labor force
46
U.S. Labor Force Participation Rates Assumptions
for Old Age Cohorts
0%
5%
10%
15%
20%
25%
30%
35%
40%
45%
50%
55%
60%
65%
70%
55-64 65-74 75+
lab
or
forc
e p
art
icip
ati
on
ra
te
1980 1990 2000 2010 2025 2040
47
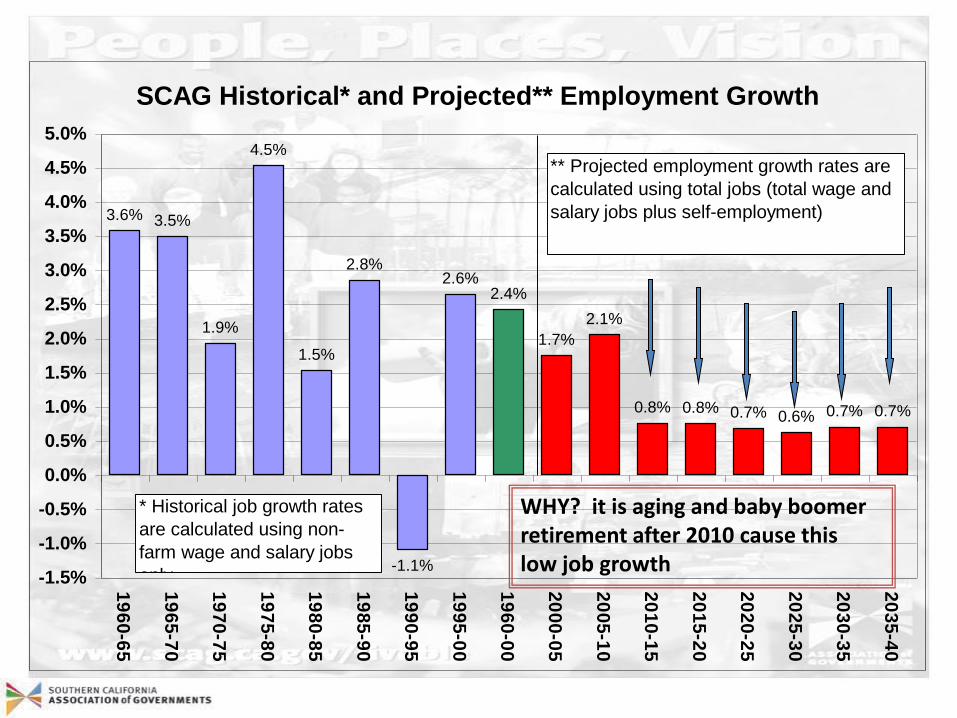
SCAG Historical* and Projected** Employment Growth
3.6% 3.5%
1.9%
4.5%
1.5%
2.8%
-1.1%
2.6%2.4%
1.7%
2.1%
0.8% 0.8% 0.7% 0.6% 0.7% 0.7%
-1.5%
-1.0%
-0.5%
0.0%
0.5%
1.0%
1.5%
2.0%
2.5%
3.0%
3.5%
4.0%
4.5%
5.0%
19
60
-65
19
65
-70
19
70
-75
19
75
-80
19
80
-85
19
85
-90
19
90
-95
19
95
-00
19
60
-00
20
00
-05
20
05
-10
20
10
-15
20
15
-20
20
20
-25
20
25
-30
20
30
-35
20
35
-40
* Historical job growth rates
are calculated using non-
farm wage and salary jobs
only
** Projected employment growth rates are
calculated using total jobs (total wage and
salary jobs plus self-employment)
WHY? it is aging and baby boomer retirement after 2010 cause this low job growth
49
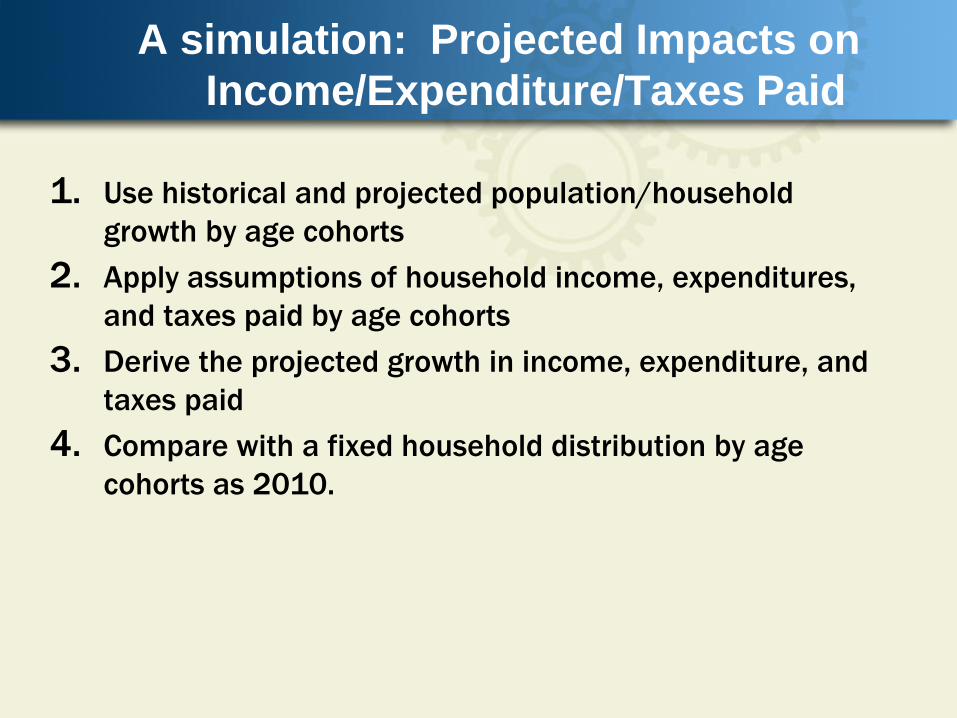
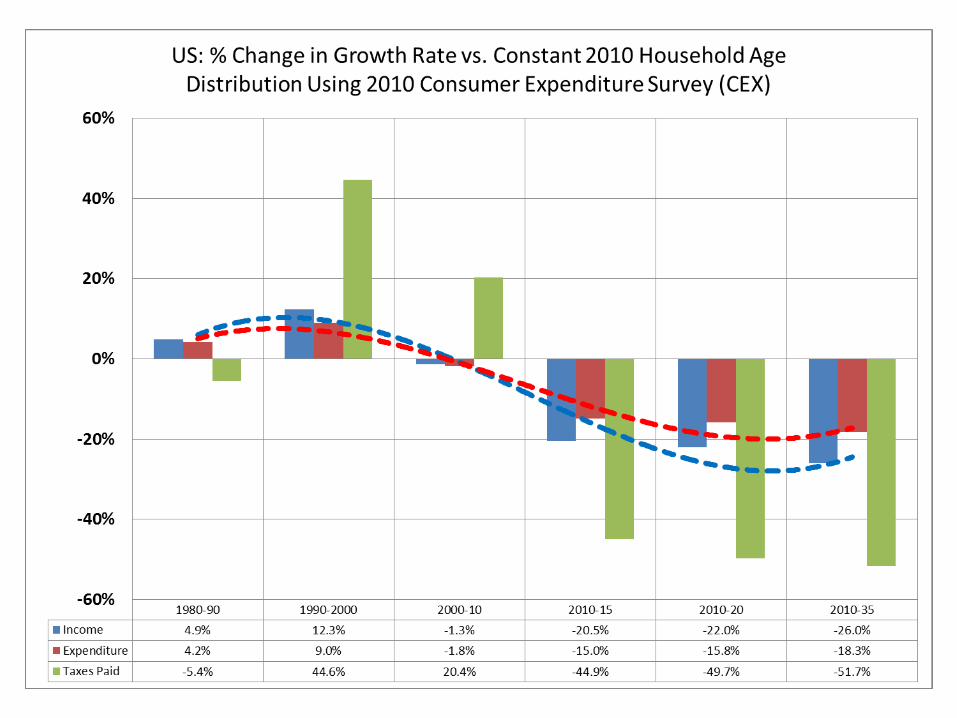
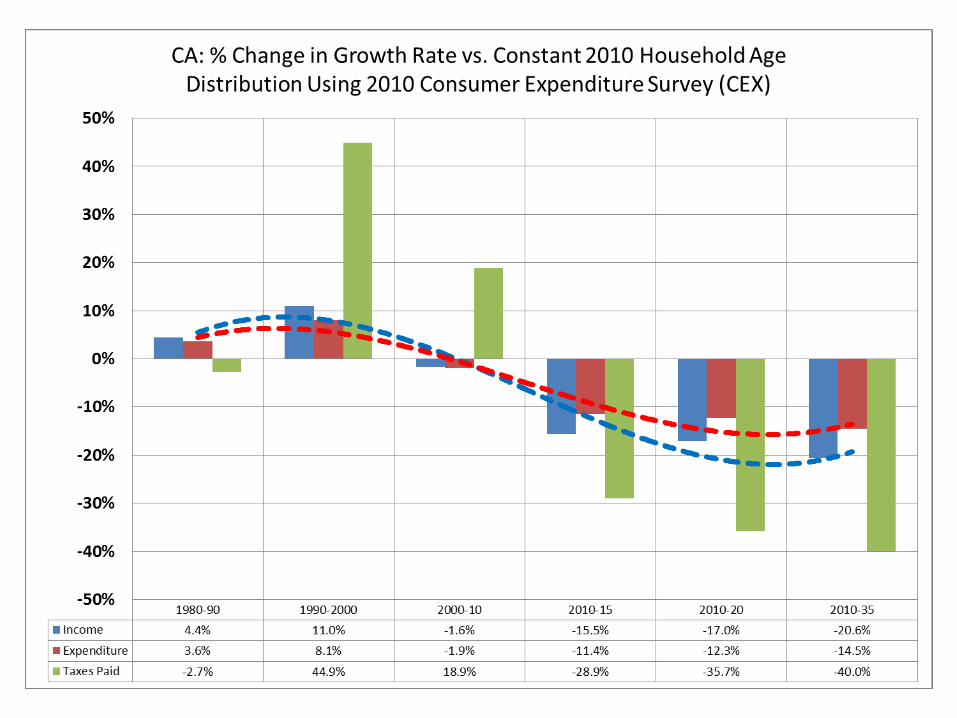
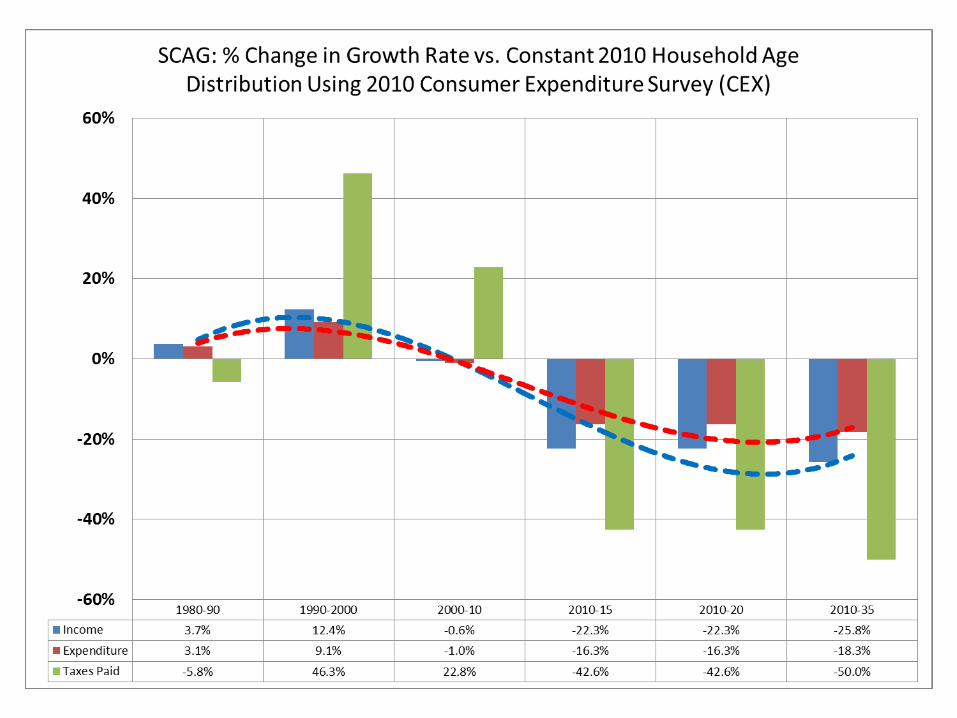
A simulation: Projected Impacts on
Income/Expenditure/Taxes Paid
1. Use historical and projected population/household
growth by age cohorts
2. Apply assumptions of household income, expenditures,
and taxes paid by age cohorts
3. Derive the projected growth in income, expenditure, and
taxes paid
4. Compare with a fixed household distribution by age
cohorts as 2010.
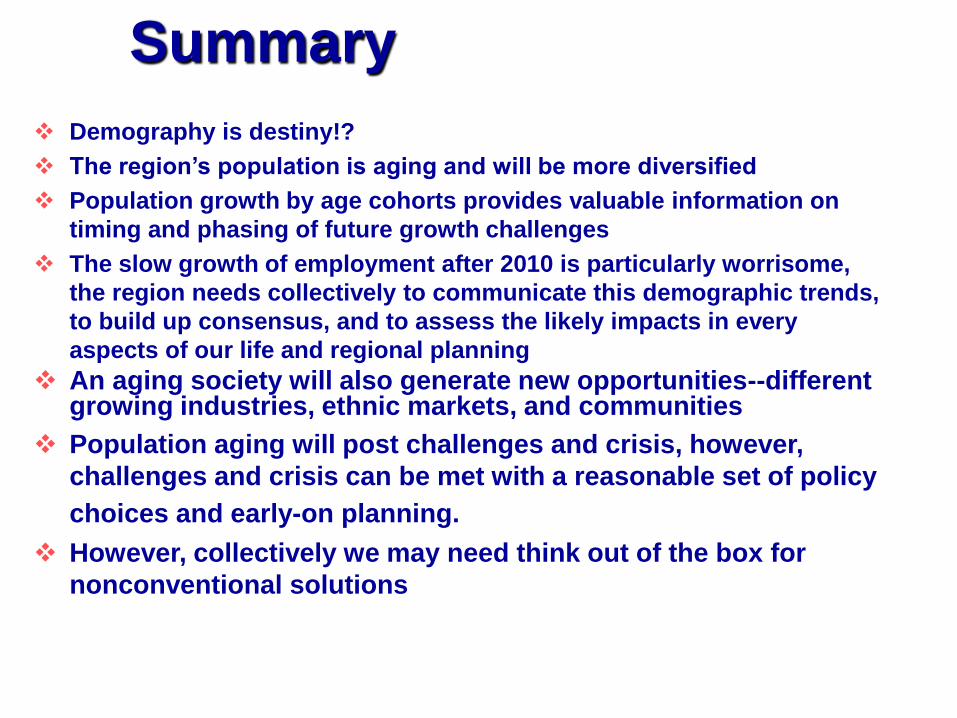
Summary
Demography is destiny!?
The region’s population is aging and will be more diversified
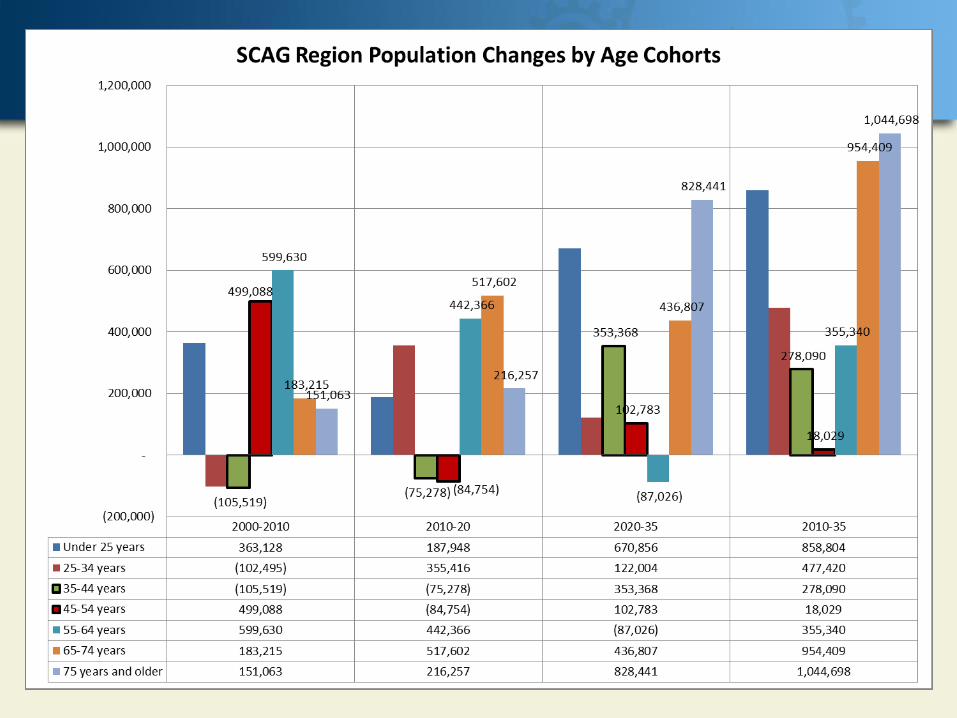
Population growth by age cohorts provides valuable information on
timing and phasing of future growth challenges
The slow growth of employment after 2010 is particularly worrisome,
the region needs collectively to communicate this demographic trends,
to build up consensus, and to assess the likely impacts in every
aspects of our life and regional planning
An aging society will also generate new opportunities--different growing industries, ethnic markets, and communities
Population aging will post challenges and crisis, however,
challenges and crisis can be met with a reasonable set of policy
choices and early-on planning.
However, collectively we may need think out of the box for
nonconventional solutions
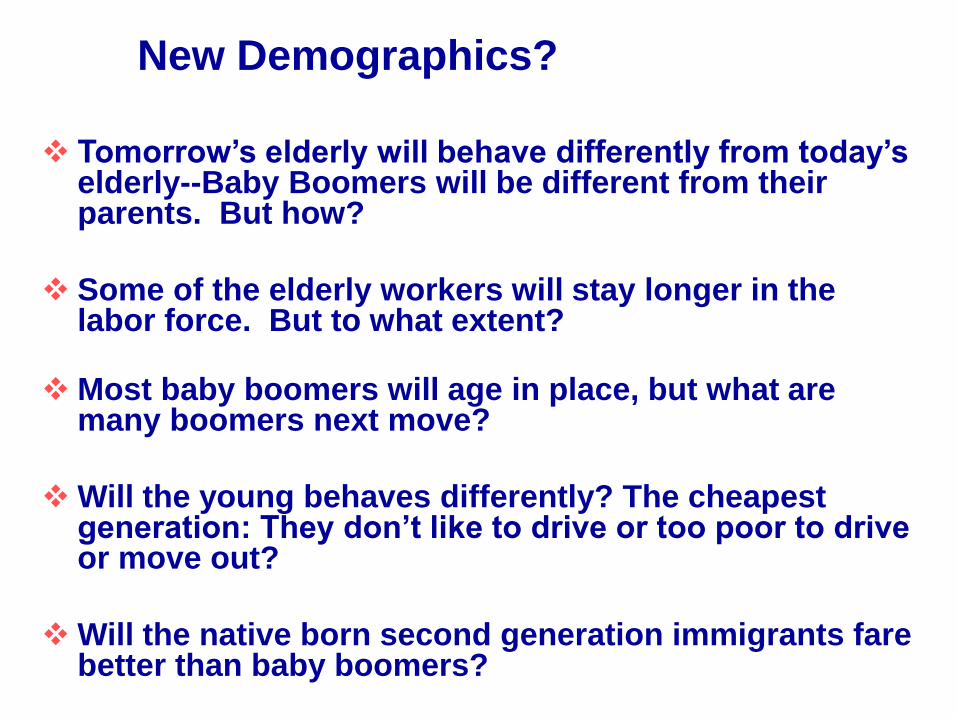
New Demographics?
Tomorrow’s elderly will behave differently from today’s elderly--Baby Boomers will be different from their parents. But how?
Some of the elderly workers will stay longer in the labor force. But to what extent?
Most baby boomers will age in place, but what are many boomers next move?
Will the young behaves differently? The cheapest generation: They don’t like to drive or too poor to drive or move out?
Will the native born second generation immigrants fare better than baby boomers?
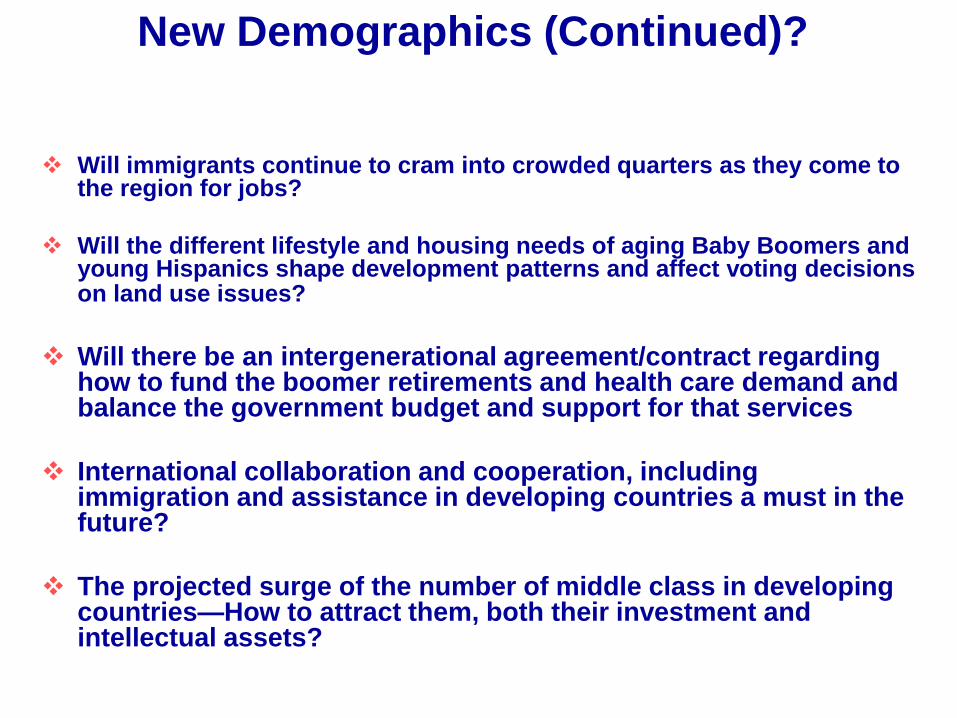
New Demographics (Continued)?
Will immigrants continue to cram into crowded quarters as they come to the region for jobs?
Will the different lifestyle and housing needs of aging Baby Boomers and young Hispanics shape development patterns and affect voting decisions on land use issues?
Will there be an intergenerational agreement/contract regarding how to fund the boomer retirements and health care demand and balance the government budget and support for that services
International collaboration and cooperation, including immigration and assistance in developing countries a must in the future?
The projected surge of the number of middle class in developing countries—How to attract them, both their investment and intellectual assets?
56
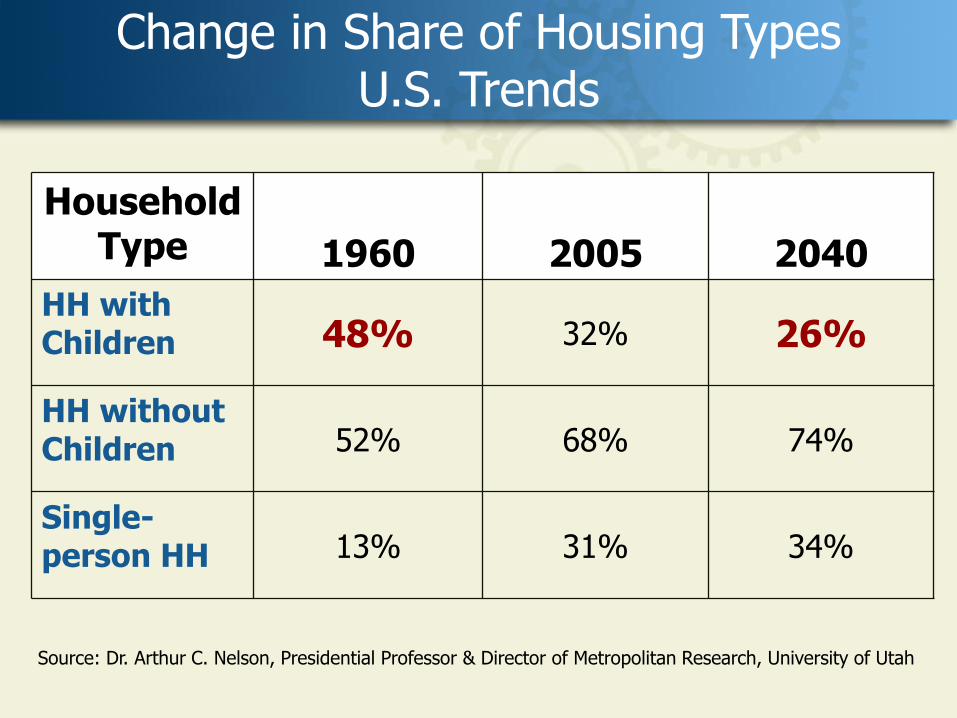
Source: Dr. Arthur C. Nelson, Presidential Professor & Director of Metropolitan Research, University of Utah
Change in Share of Housing Types U.S. Trends
Household Type 1960 2005 2040
HH with Children 48% 32% 26%
HH without Children 52% 68% 74%
Single-person HH 13% 31% 34%
57
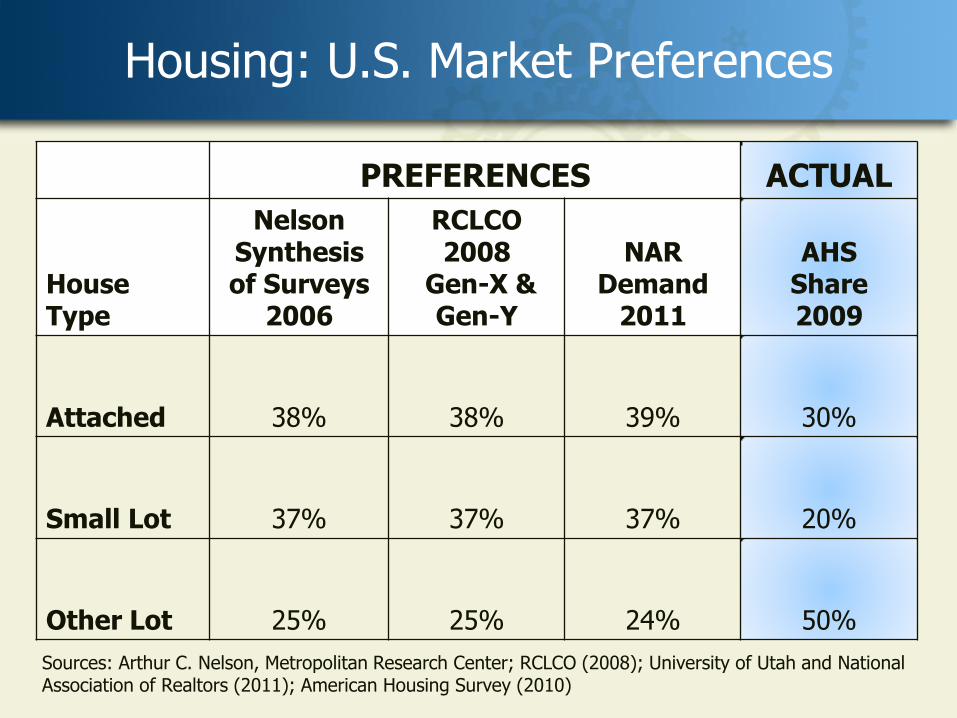
Housing: U.S. Market Preferences
PREFERENCES ACTUAL
House Type
Nelson Synthesis of Surveys
2006
RCLCO 2008
Gen-X & Gen-Y
NAR Demand
2011
AHS Share 2009
Attached 38% 38% 39% 30%
Small Lot 37% 37% 37% 20%
Other Lot 25% 25% 24% 50%
Sources: Arthur C. Nelson, Metropolitan Research Center; RCLCO (2008); University of Utah and National Association of Realtors (2011); American Housing Survey (2010)
58
Milken Institute Population Aging Initiative
59
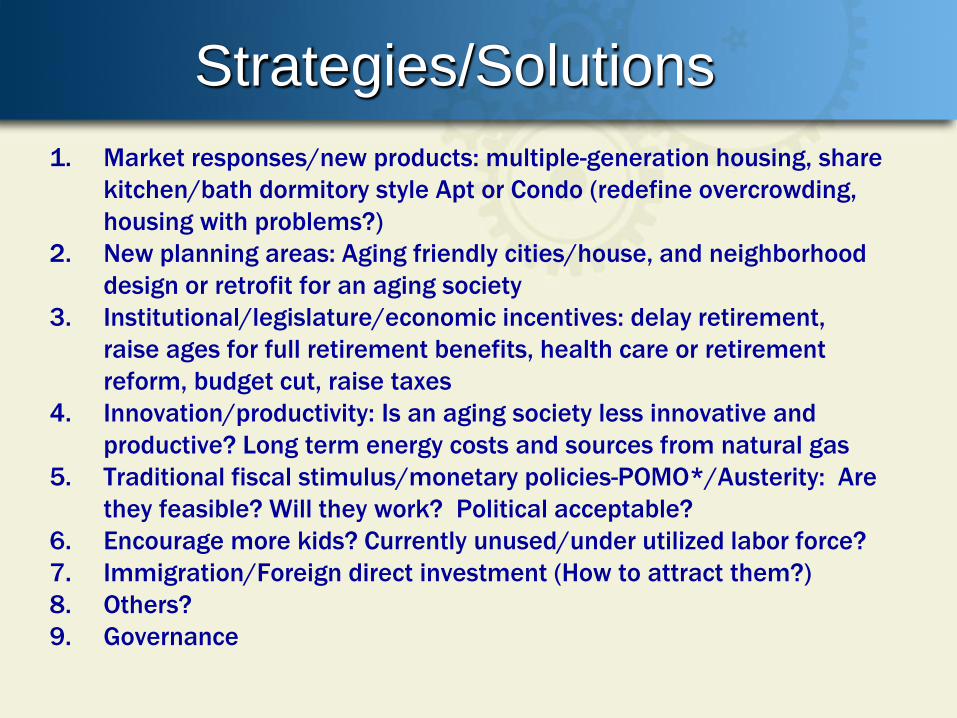
Strategies/Solutions
1. Market responses/new products: multiple-generation housing, share
kitchen/bath dormitory style Apt or Condo (redefine overcrowding,
housing with problems?)
2. New planning areas: Aging friendly cities/house, and neighborhood
design or retrofit for an aging society
3. Institutional/legislature/economic incentives: delay retirement,
raise ages for full retirement benefits, health care or retirement
reform, budget cut, raise taxes
4. Innovation/productivity: Is an aging society less innovative and
productive? Long term energy costs and sources from natural gas
5. Traditional fiscal stimulus/monetary policies-POMO*/Austerity: Are
they feasible? Will they work? Political acceptable?
6. Encourage more kids? Currently unused/under utilized labor force?
7. Immigration/Foreign direct investment (How to attract them?)
8. Others?
9. Governance
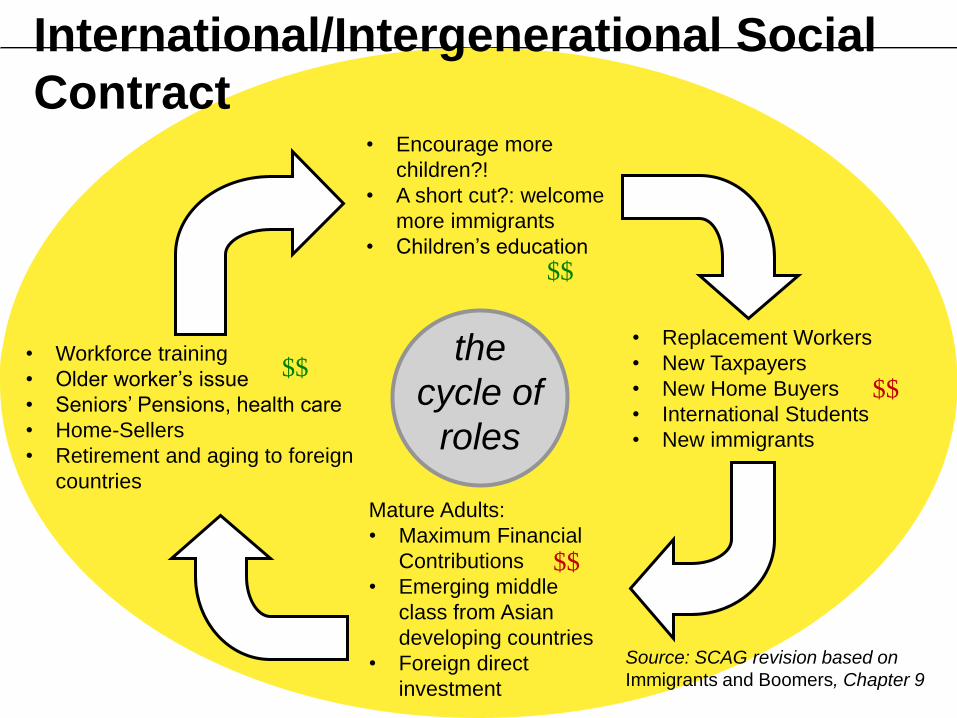
International/Intergenerational Social
Contract • Encourage more
children?!
• A short cut?: welcome
more immigrants
• Children’s education
• Workforce training
• Older worker’s issue
• Seniors’ Pensions, health care
• Home-Sellers
• Retirement and aging to foreign
countries
Mature Adults:
• Maximum Financial
Contributions
• Emerging middle
class from Asian
developing countries
• Foreign direct
investment
• Replacement Workers
• New Taxpayers
• New Home Buyers
• International Students
• New immigrants
the
cycle of
roles
$$
$$
$$
$$
Source: SCAG revision based on
Immigrants and Boomers, Chapter 9