Embed Size (px)
Citation preview
ASSOCIATION OF UNITY CHURCHES 403(B) PLAN
Presented By
For Plan Sponsor Use Only
Investment Review For Period Ending
Tim Duncan
December 31, 2009
Prepared Exclusively For
ASSOCIATION OF UNITY CHURCHES 403(B) PLAN
2
Section I
Section II
Section III
Section IV
Section V
Section VI
Section VII
Section VIII
Section IX
Executive Summary Investment Summary Plan Summary Performance Matrix Fees & Expenses Proposed Investment Options Market Commentary Definitions Disclosure
Table of Contents
ASSOCIATION OF UNITY CHURCHES 403(B) PLAN
3
Contact Information
Servicing Contact Email Address Phone Number
Portfolio Manager: Tim Duncan 816-360-3774 [email protected] Relationship Manager: David Sims 816-360-3762 [email protected]

Section I: Executive Summary4th Quarter, 2009
ASSOCIATION OF UNITY CHURCHES 403(B) PLAN
Executive Summary As of December 31, 2009
5
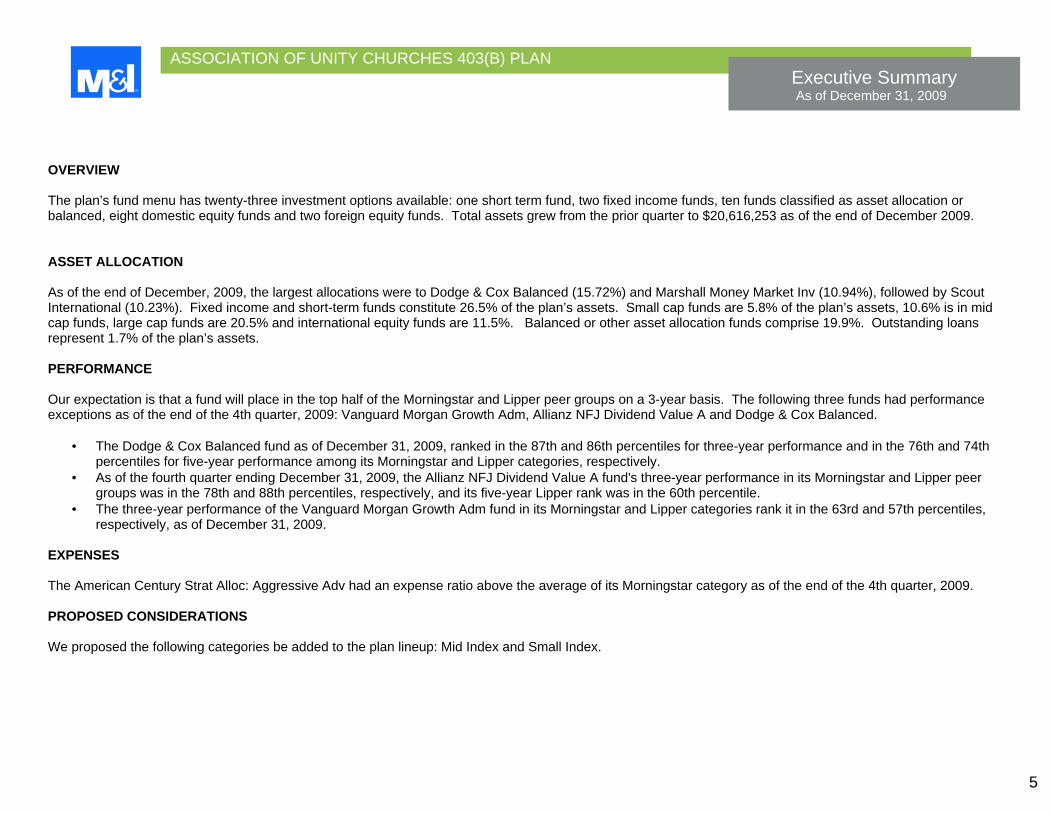
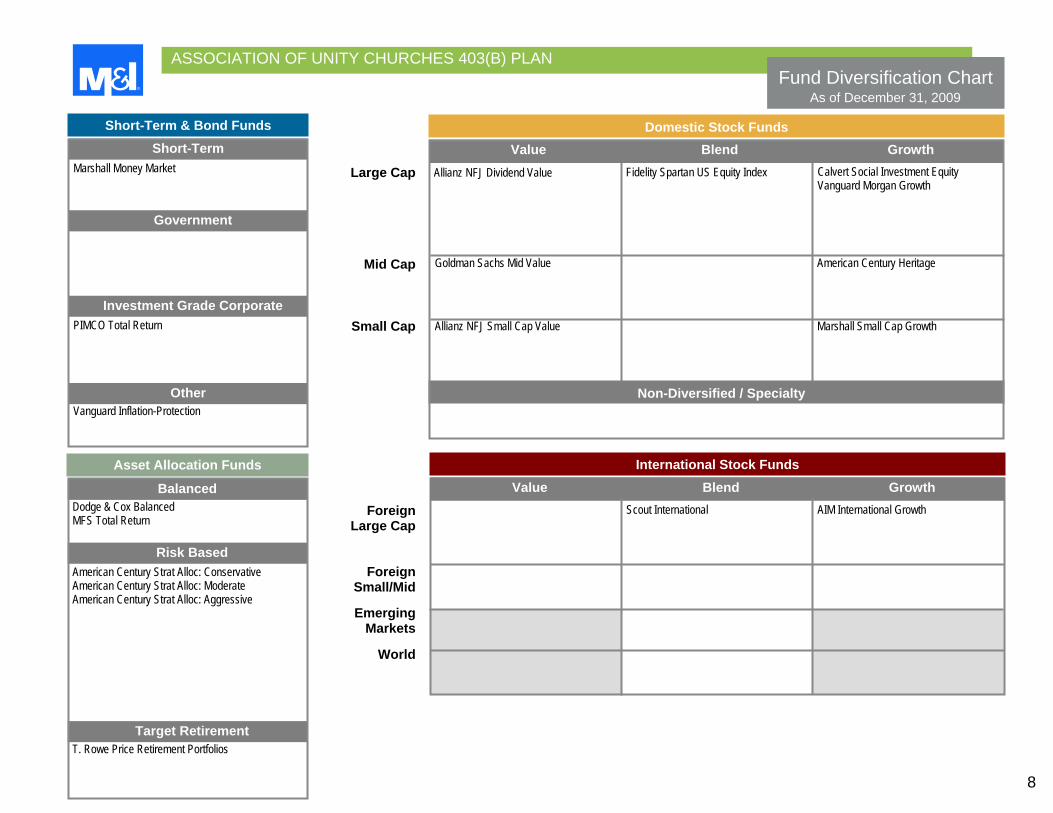
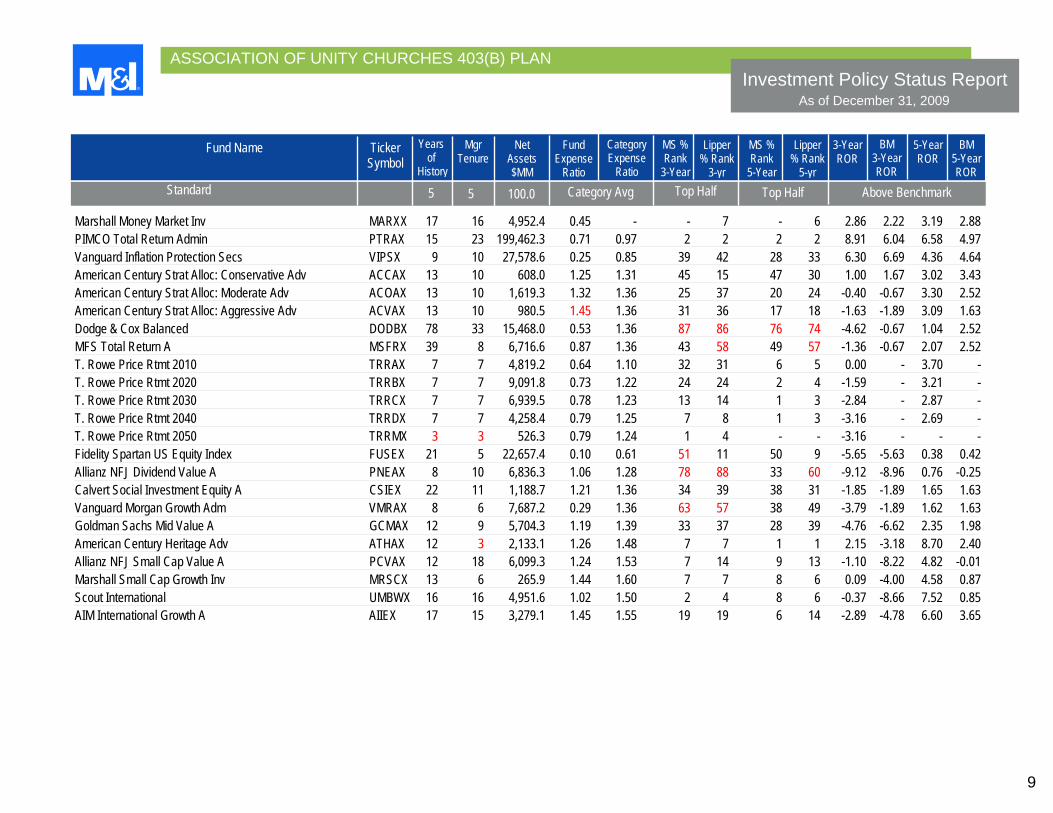
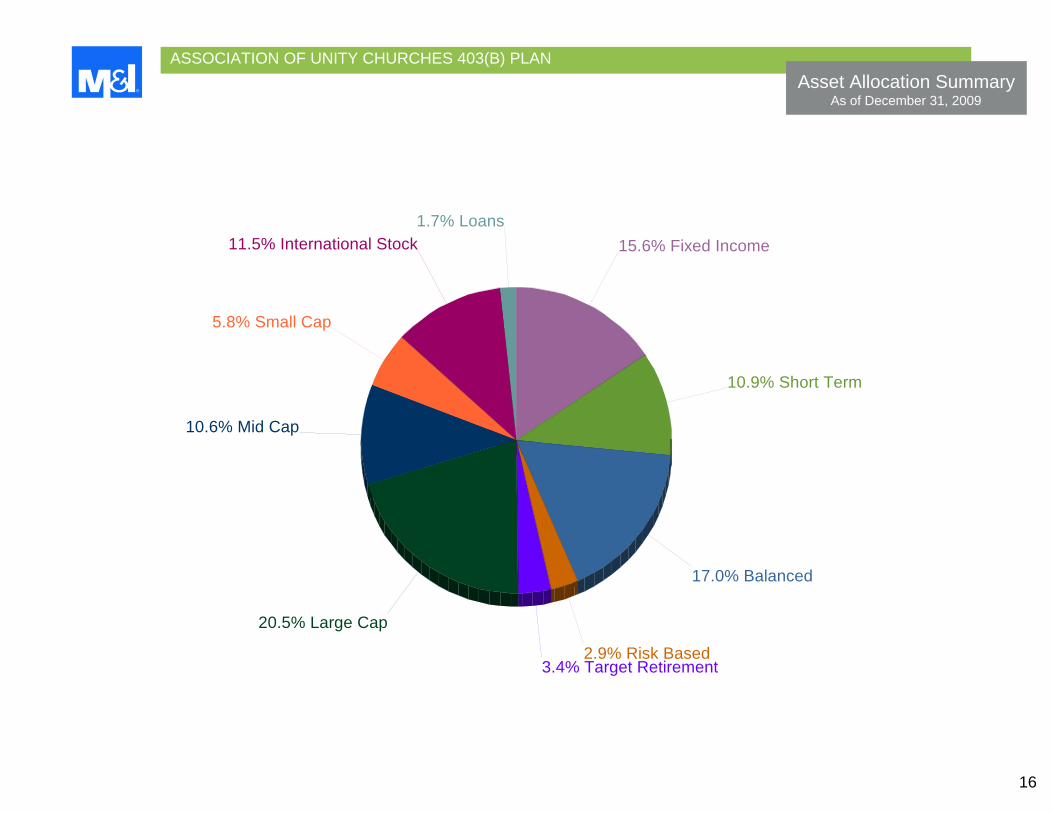
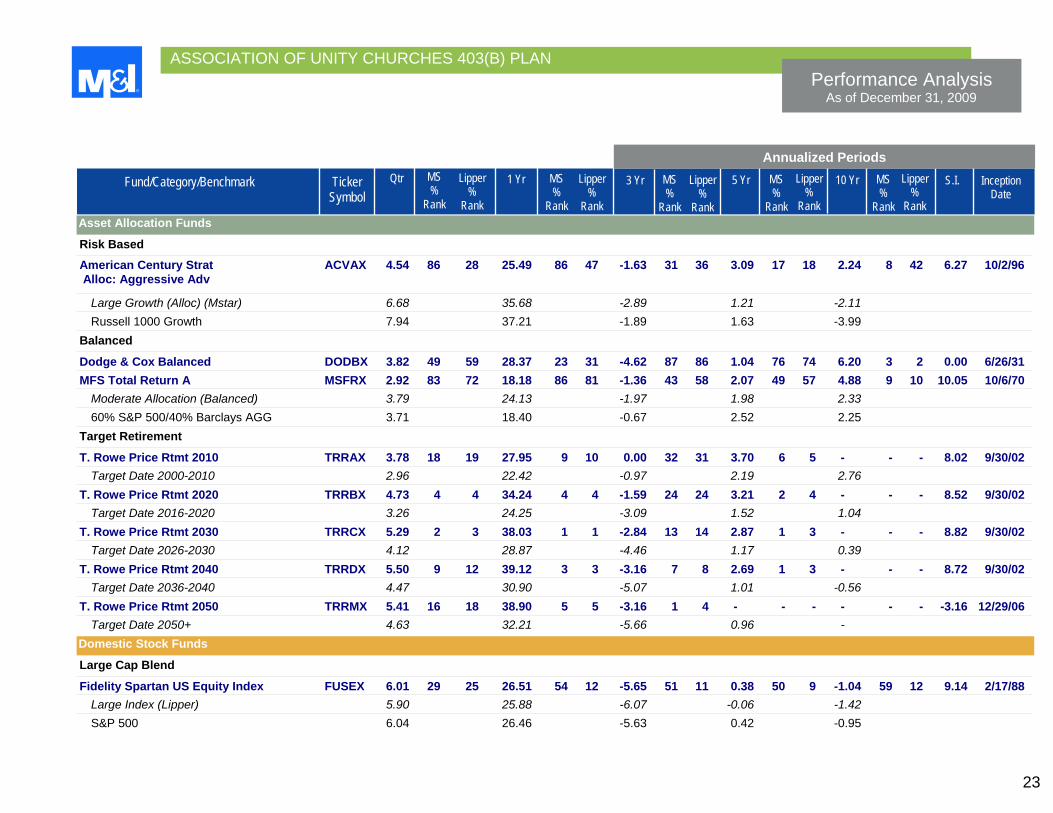
OVERVIEW The plan’s fund menu has twenty-three investment options available: one short term fund, two fixed income funds, ten funds classified as asset allocation or balanced, eight domestic equity funds and two foreign equity funds. Total assets grew from the prior quarter to $20,616,253 as of the end of December 2009. ASSET ALLOCATION As of the end of December, 2009, the largest allocations were to Dodge & Cox Balanced (15.72%) and Marshall Money Market Inv (10.94%), followed by Scout International (10.23%). Fixed income and short-term funds constitute 26.5% of the plan’s assets. Small cap funds are 5.8% of the plan’s assets, 10.6% is in mid cap funds, large cap funds are 20.5% and international equity funds are 11.5%. Balanced or other asset allocation funds comprise 19.9%. Outstanding loans represent 1.7% of the plan’s assets. PERFORMANCE Our expectation is that a fund will place in the top half of the Morningstar and Lipper peer groups on a 3-year basis. The following three funds had performance exceptions as of the end of the 4th quarter, 2009: Vanguard Morgan Growth Adm, Allianz NFJ Dividend Value A and Dodge & Cox Balanced.
• The Dodge & Cox Balanced fund as of December 31, 2009, ranked in the 87th and 86th percentiles for three-year performance and in the 76th and 74th percentiles for five-year performance among its Morningstar and Lipper categories, respectively.
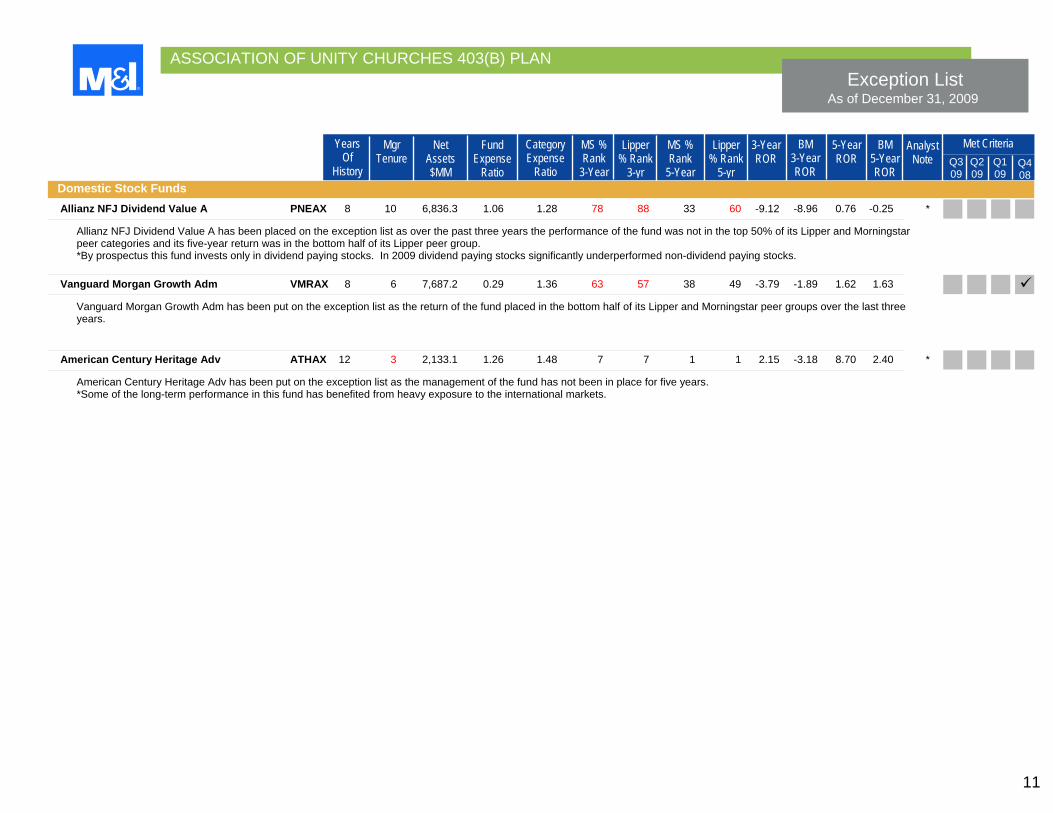
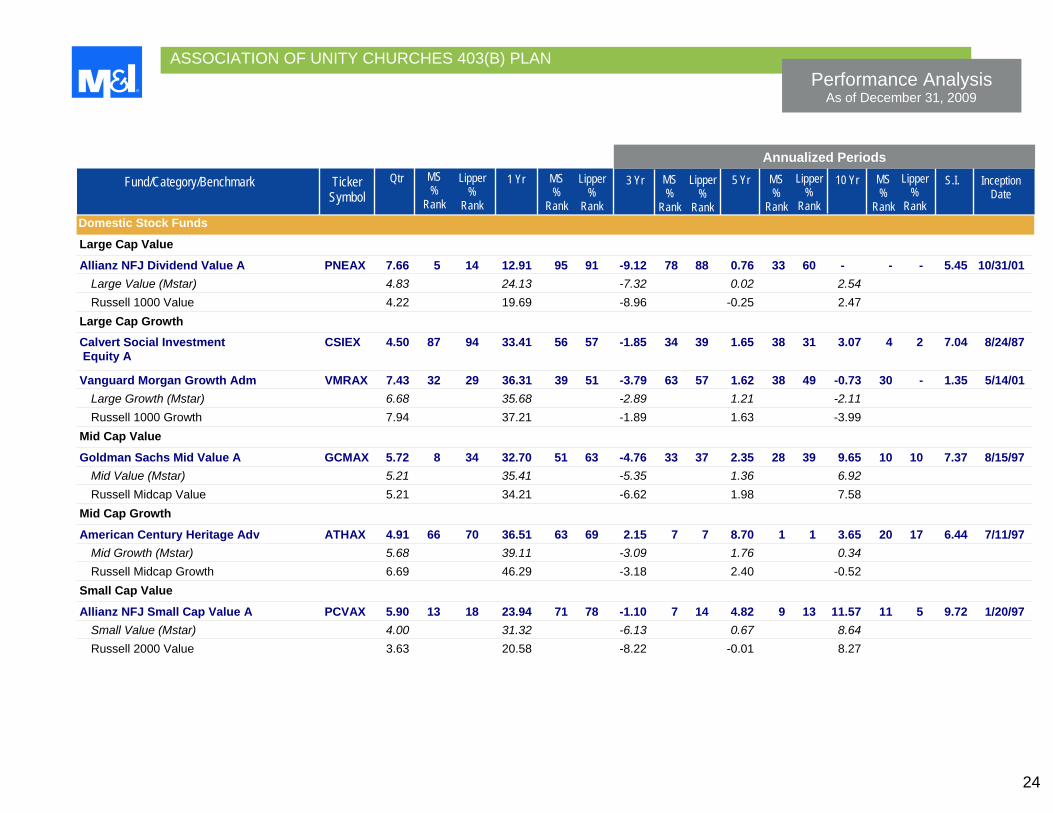
• As of the fourth quarter ending December 31, 2009, the Allianz NFJ Dividend Value A fund's three-year performance in its Morningstar and Lipper peer groups was in the 78th and 88th percentiles, respectively, and its five-year Lipper rank was in the 60th percentile.
• The three-year performance of the Vanguard Morgan Growth Adm fund in its Morningstar and Lipper categories rank it in the 63rd and 57th percentiles, respectively, as of December 31, 2009.
EXPENSES The American Century Strat Alloc: Aggressive Adv had an expense ratio above the average of its Morningstar category as of the end of the 4th quarter, 2009. PROPOSED CONSIDERATIONS We proposed the following categories be added to the plan lineup: Mid Index and Small Index.
ASSOCIATION OF UNITY CHURCHES 403(B) PLAN
Executive Summary As of December 31, 2009
6
SUMMARY As of the end of the 4th quarter, 2009, the investment options offered in the plan are generally performing as expected, notwithstanding the short-term underperformance to be discussed at the next committee meeting. We propose that the committee consider adding the following categories to the plan lineup: Mid Index and Small Index.
7
Section II: Investment Summary4th Quarter, 2009
ASSOCIATION OF UNITY CHURCHES 403(B) PLAN
8
Fund Diversification Chart
Asset Allocation Funds
Short-Term & Bond Funds Short-Term
Government
Investment Grade Corporate
Balanced
Risk Based
Target Retirement
Domestic Stock Funds
International Stock Funds
Non-Diversified / Specialty
Large Cap
Mid Cap
Small Cap
ForeignLarge Cap
ForeignSmall/Mid
EmergingMarkets
World
Value Blend Growth
As of December 31, 2009
Marshall Money Market
PIMCO Total Return
Dodge & Cox Balanced MFS Total Return
American Century Strat Alloc: Conservative American Century Strat Alloc: Moderate American Century Strat Alloc: Aggressive
T. Rowe Price Retirement Portfolios
Allianz NFJ Dividend Value
Goldman Sachs Mid Value
Allianz NFJ Small Cap Value
Fidelity Spartan US Equity Index
Calvert Social Investment EquityVanguard Morgan Growth
American Century Heritage
Marshall Small Cap Growth
Scout International
AIM International Growth
Other Vanguard Inflation-Protection
Value Blend Growth
ASSOCIATION OF UNITY CHURCHES 403(B) PLAN
Investment Policy Status Report As of December 31, 2009
9
Standard
Top Half Above Benchmark
Years of
History
Fund Name MgrTenure
Net Assets$MM
Category Expense
Ratio
MS % Rank
3-Year
Lipper% Rank
3-yr
MS %Rank
5-Year
Lipper% Rank
5-yr
BM3-Year ROR
5-YearROR
BM5-Year ROR
3-YearROR
100.05 Top Half Category Avg 5
Fund Expense
Ratio
Ticker Symbol
Marshall Money Market Inv MARXX 17 16 4,952.4 0.45 - - 7 - 6 2.86 2.22 3.19 2.88 PIMCO Total Return Admin PTRAX 15 23 199,462.3 0.71 0.97 2 2 2 2 8.91 6.04 6.58 4.97 Vanguard Inflation Protection Secs VIPSX 9 10 27,578.6 0.25 0.85 39 42 28 33 6.30 6.69 4.36 4.64 American Century Strat Alloc: Conservative Adv ACCAX 13 10 608.0 1.25 1.31 45 15 47 30 1.00 1.67 3.02 3.43 American Century Strat Alloc: Moderate Adv ACOAX 13 10 1,619.3 1.32 1.36 25 37 20 24 -0.40 -0.67 3.30 2.52 American Century Strat Alloc: Aggressive Adv ACVAX 13 10 980.5 1.45 1.36 31 36 17 18 -1.63 -1.89 3.09 1.63 Dodge & Cox Balanced DODBX 78 33 15,468.0 0.53 1.36 87 86 76 74 -4.62 -0.67 1.04 2.52 MFS Total Return A MSFRX 39 8 6,716.6 0.87 1.36 43 58 49 57 -1.36 -0.67 2.07 2.52 T. Rowe Price Rtmt 2010 TRRAX 7 7 4,819.2 0.64 1.10 32 31 6 5 0.00 - 3.70 - T. Rowe Price Rtmt 2020 TRRBX 7 7 9,091.8 0.73 1.22 24 24 2 4 -1.59 - 3.21 - T. Rowe Price Rtmt 2030 TRRCX 7 7 6,939.5 0.78 1.23 13 14 1 3 -2.84 - 2.87 - T. Rowe Price Rtmt 2040 TRRDX 7 7 4,258.4 0.79 1.25 7 8 1 3 -3.16 - 2.69 - T. Rowe Price Rtmt 2050 TRRMX 3 3 526.3 0.79 1.24 1 4 - - -3.16 - - - Fidelity Spartan US Equity Index FUSEX 21 5 22,657.4 0.10 0.61 51 11 50 9 -5.65 -5.63 0.38 0.42 Allianz NFJ Dividend Value A PNEAX 8 10 6,836.3 1.06 1.28 78 88 33 60 -9.12 -8.96 0.76 -0.25 Calvert Social Investment Equity A CSIEX 22 11 1,188.7 1.21 1.36 34 39 38 31 -1.85 -1.89 1.65 1.63 Vanguard Morgan Growth Adm VMRAX 8 6 7,687.2 0.29 1.36 63 57 38 49 -3.79 -1.89 1.62 1.63 Goldman Sachs Mid Value A GCMAX 12 9 5,704.3 1.19 1.39 33 37 28 39 -4.76 -6.62 2.35 1.98 American Century Heritage Adv ATHAX 12 3 2,133.1 1.26 1.48 7 7 1 1 2.15 -3.18 8.70 2.40 Allianz NFJ Small Cap Value A PCVAX 12 18 6,099.3 1.24 1.53 7 14 9 13 -1.10 -8.22 4.82 -0.01 Marshall Small Cap Growth Inv MRSCX 13 6 265.9 1.44 1.60 7 7 8 6 0.09 -4.00 4.58 0.87 Scout International UMBWX 16 16 4,951.6 1.02 1.50 2 4 8 6 -0.37 -8.66 7.52 0.85 AIM International Growth A AIIEX 17 15 3,279.1 1.45 1.55 19 19 6 14 -2.89 -4.78 6.60 3.65
ASSOCIATION OF UNITY CHURCHES 403(B) PLAN
Exception List As of December 31, 2009
10
MgrTenure
Net Assets$MM
Category Expense
Ratio
MS % Rank
3-Year
Lipper % Rank
3-yr
MS %Rank
5-Year
Lipper% Rank
5-yr
BM3-Year ROR
5-YearROR
BM5-YearROR
3-YearROR
Fund Expense
Ratio
YearsOf
History
Met Criteria AnalystNote Q3
09Q2 09
Q1 09
Q4 08
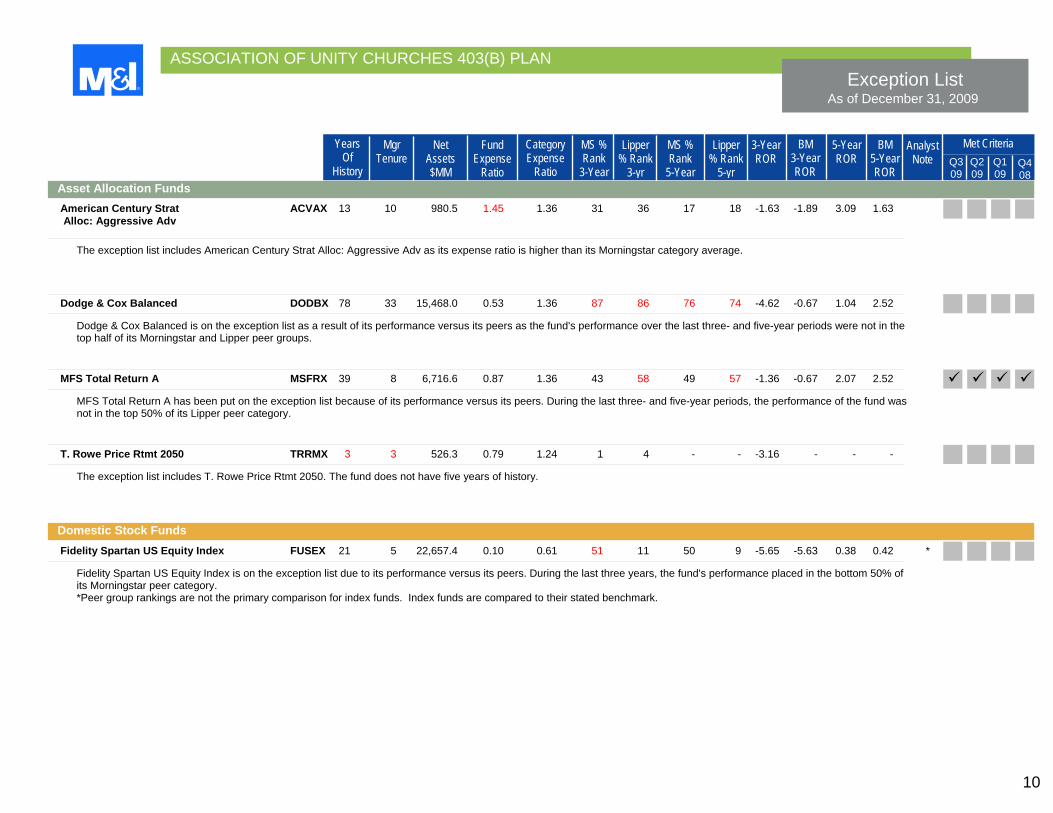
Asset Allocation Funds American Century Strat ACVAX 13 10 980.5 1.45 1.36 31 36 17 18 -1.63 -1.89 3.09 1.63 Alloc: Aggressive Adv
The exception list includes American Century Strat Alloc: Aggressive Adv as its expense ratio is higher than its Morningstar category average.
Dodge & Cox Balanced DODBX 78 33 15,468.0 0.53 1.36 87 86 76 74 -4.62 -0.67 1.04 2.52 Dodge & Cox Balanced is on the exception list as a result of its performance versus its peers as the fund's performance over the last three- and five-year periods were not in the top half of its Morningstar and Lipper peer groups.
MFS Total Return A MSFRX 39 8 6,716.6 0.87 1.36 43 58 49 57 -1.36 -0.67 2.07 2.52 MFS Total Return A has been put on the exception list because of its performance versus its peers. During the last three- and five-year periods, the performance of the fund was not in the top 50% of its Lipper peer category.
T. Rowe Price Rtmt 2050 TRRMX 3 3 526.3 0.79 1.24 1 4 - - -3.16 - - - The exception list includes T. Rowe Price Rtmt 2050. The fund does not have five years of history.
Domestic Stock Funds Fidelity Spartan US Equity Index FUSEX 21 5 22,657.4 0.10 0.61 51 11 50 9 -5.65 -5.63 0.38 0.42 *
Fidelity Spartan US Equity Index is on the exception list due to its performance versus its peers. During the last three years, the fund's performance placed in the bottom 50% of its Morningstar peer category. *Peer group rankings are not the primary comparison for index funds. Index funds are compared to their stated benchmark.
ASSOCIATION OF UNITY CHURCHES 403(B) PLAN
Exception List As of December 31, 2009
11
MgrTenure
Net Assets$MM
Category Expense
Ratio
MS % Rank
3-Year
Lipper % Rank
3-yr
MS %Rank
5-Year
Lipper% Rank
5-yr
BM3-Year ROR
5-YearROR
BM5-YearROR
3-YearROR
Fund Expense
Ratio
YearsOf
History
Met Criteria AnalystNote Q3
09Q2 09
Q1 09
Q4 08
Domestic Stock Funds Allianz NFJ Dividend Value A PNEAX 8 10 6,836.3 1.06 1.28 78 88 33 60 -9.12 -8.96 0.76 -0.25 *
Allianz NFJ Dividend Value A has been placed on the exception list as over the past three years the performance of the fund was not in the top 50% of its Lipper and Morningstar peer categories and its five-year return was in the bottom half of its Lipper peer group. *By prospectus this fund invests only in dividend paying stocks. In 2009 dividend paying stocks significantly underperformed non-dividend paying stocks.
Vanguard Morgan Growth Adm VMRAX 8 6 7,687.2 0.29 1.36 63 57 38 49 -3.79 -1.89 1.62 1.63 Vanguard Morgan Growth Adm has been put on the exception list as the return of the fund placed in the bottom half of its Lipper and Morningstar peer groups over the last three years.
American Century Heritage Adv ATHAX 12 3 2,133.1 1.26 1.48 7 7 1 1 2.15 -3.18 8.70 2.40 * American Century Heritage Adv has been put on the exception list as the management of the fund has not been in place for five years. *Some of the long-term performance in this fund has benefited from heavy exposure to the international markets.
ASSOCIATION OF UNITY CHURCHES 403(B) PLAN
Proposed Investment Options As of December 31, 2009
12
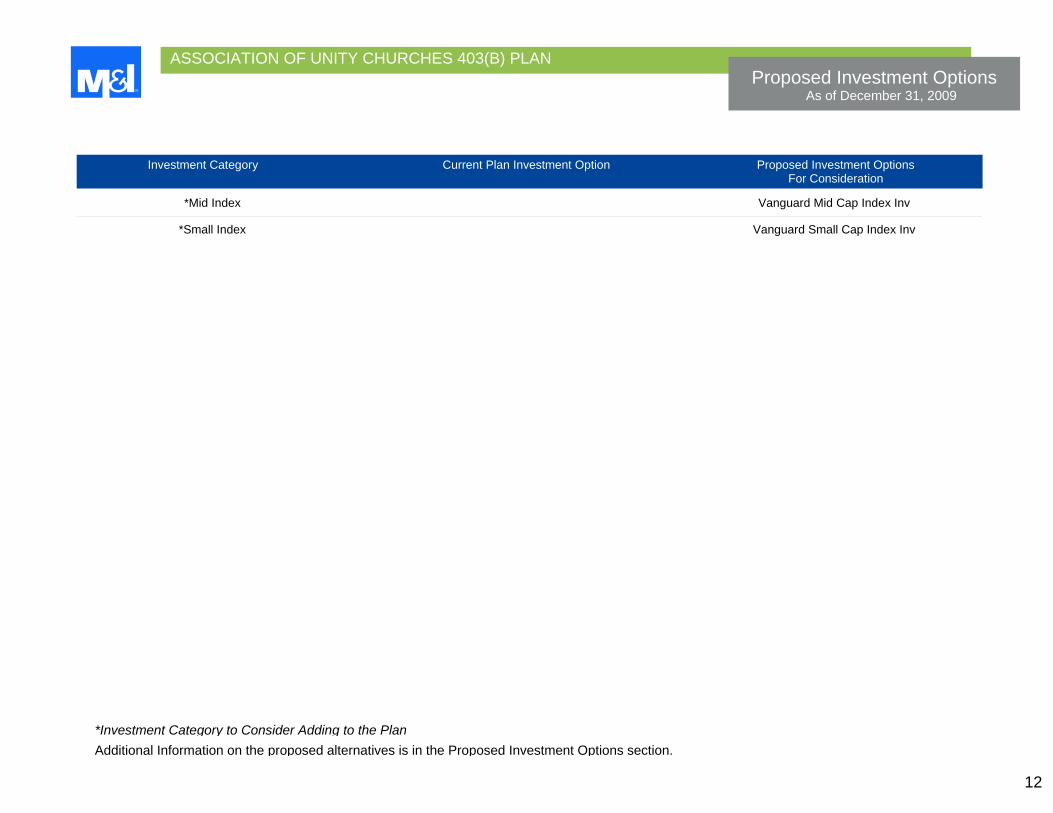
Investment Category Current Plan Investment Option Proposed Investment Options For Consideration
*Mid Index Vanguard Mid Cap Index Inv *Small Index Vanguard Small Cap Index Inv
*Investment Category to Consider Adding to the PlanAdditional Information on the proposed alternatives is in the Proposed Investment Options section.
13
Section III: Plan Summary 4th Quarter, 2009
ASSOCIATION OF UNITY CHURCHES 403(B) PLAN
14
Asset Allocation As of December 31, 2009
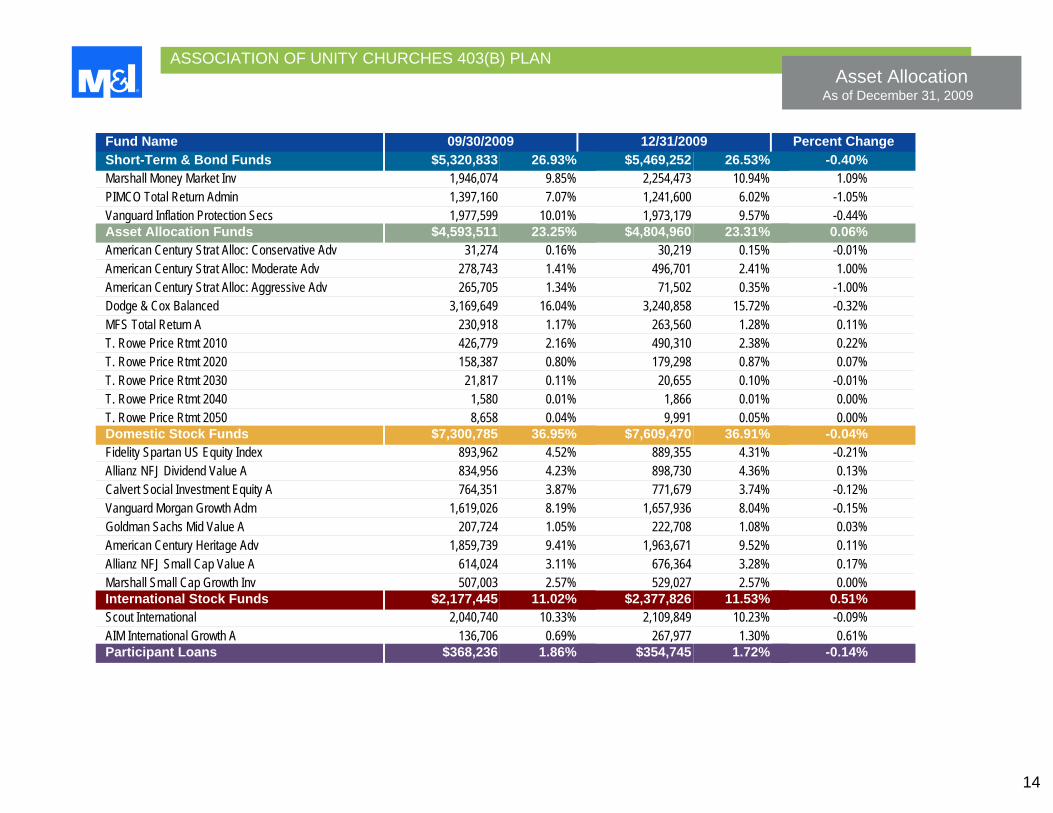
Fund Name 09/30/2009 12/31/2009 Percent Change Short-Term & Bond Funds $5,320,833 26.93% $5,469,252 26.53% -0.40%Marshall Money Market Inv 1,946,074 9.85% 2,254,473 10.94% 1.09%PIMCO Total Return Admin 1,397,160 7.07% 1,241,600 6.02% -1.05%Vanguard Inflation Protection Secs 1,977,599 10.01% 1,973,179 9.57% -0.44%Asset Allocation Funds $4,593,511 23.25% $4,804,960 23.31% 0.06%American Century Strat Alloc: Conservative Adv 31,274 0.16% 30,219 0.15% -0.01%American Century Strat Alloc: Moderate Adv 278,743 1.41% 496,701 2.41% 1.00%American Century Strat Alloc: Aggressive Adv 265,705 1.34% 71,502 0.35% -1.00%Dodge & Cox Balanced 3,169,649 16.04% 3,240,858 15.72% -0.32%MFS Total Return A 230,918 1.17% 263,560 1.28% 0.11%T. Rowe Price Rtmt 2010 426,779 2.16% 490,310 2.38% 0.22%T. Rowe Price Rtmt 2020 158,387 0.80% 179,298 0.87% 0.07%T. Rowe Price Rtmt 2030 21,817 0.11% 20,655 0.10% -0.01%T. Rowe Price Rtmt 2040 1,580 0.01% 1,866 0.01% 0.00%T. Rowe Price Rtmt 2050 8,658 0.04% 9,991 0.05% 0.00%Domestic Stock Funds $7,300,785 36.95% $7,609,470 36.91% -0.04%Fidelity Spartan US Equity Index 893,962 4.52% 889,355 4.31% -0.21%Allianz NFJ Dividend Value A 834,956 4.23% 898,730 4.36% 0.13%Calvert Social Investment Equity A 764,351 3.87% 771,679 3.74% -0.12%Vanguard Morgan Growth Adm 1,619,026 8.19% 1,657,936 8.04% -0.15%Goldman Sachs Mid Value A 207,724 1.05% 222,708 1.08% 0.03%American Century Heritage Adv 1,859,739 9.41% 1,963,671 9.52% 0.11%Allianz NFJ Small Cap Value A 614,024 3.11% 676,364 3.28% 0.17%Marshall Small Cap Growth Inv 507,003 2.57% 529,027 2.57% 0.00%International Stock Funds $2,177,445 11.02% $2,377,826 11.53% 0.51%Scout International 2,040,740 10.33% 2,109,849 10.23% -0.09%AIM International Growth A 136,706 0.69% 267,977 1.30% 0.61%Participant Loans $368,236 1.86% $354,745 1.72% -0.14%
ASSOCIATION OF UNITY CHURCHES 403(B) PLAN
15
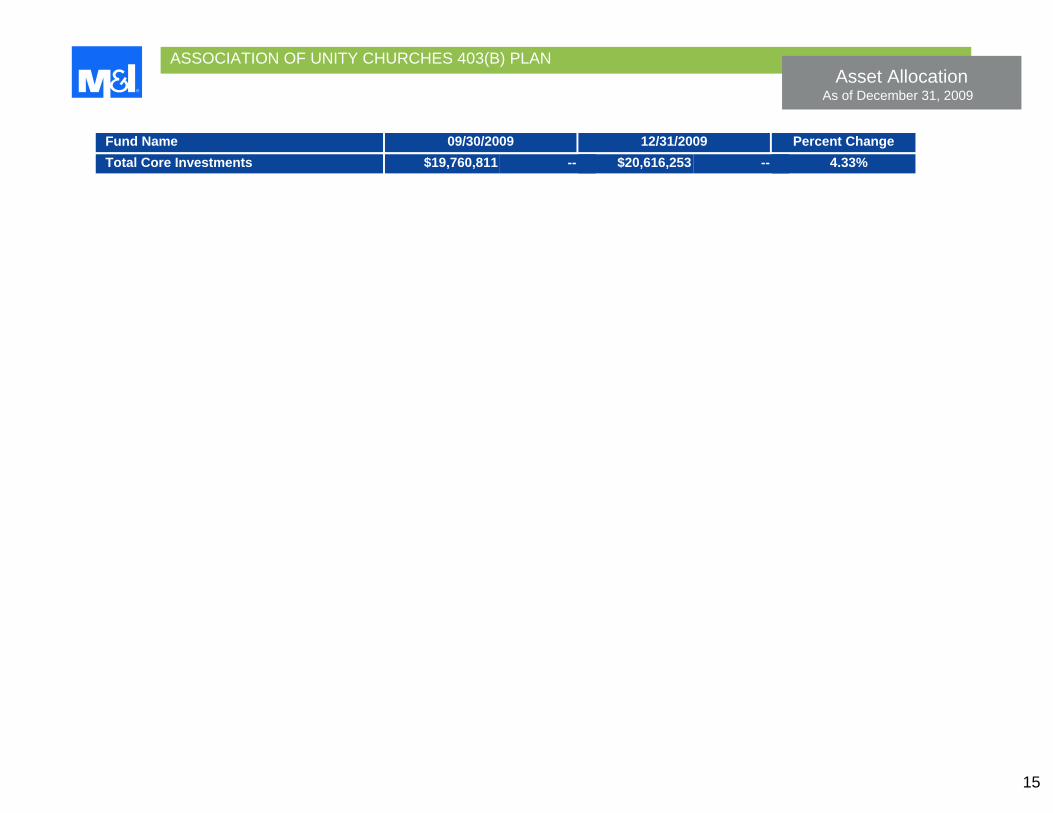
Asset Allocation As of December 31, 2009
Fund Name 09/30/2009 12/31/2009 Percent Change Total Core Investments $19,760,811 -- $20,616,253 -- 4.33%
ASSOCIATION OF UNITY CHURCHES 403(B) PLAN
Asset Allocation Summary As of December 31, 2009
16
1.7% Loans11.5% International Stock
5.8% Small Cap
10.6% Mid Cap
20.5% Large Cap
3.4% Target Retirement2.9% Risk Based
17.0% Balanced
10.9% Short Term
15.6% Fixed Income
ASSOCIATION OF UNITY CHURCHES 403(B) PLAN
17
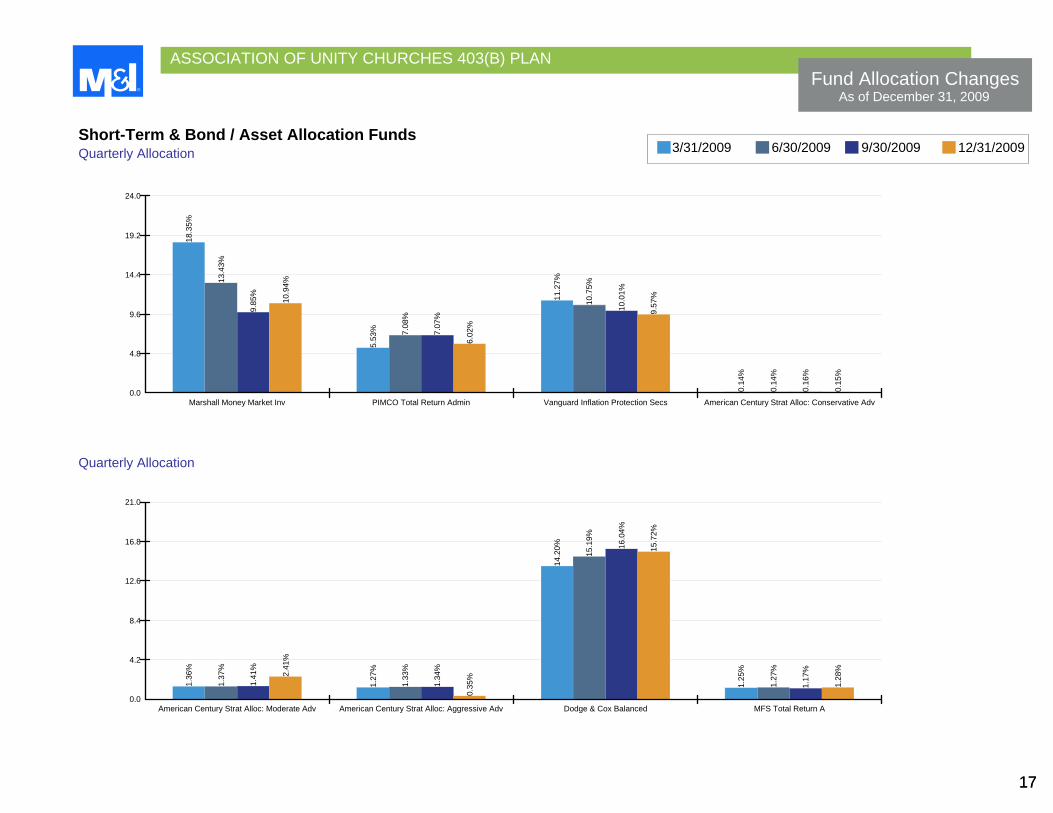
Fund Allocation Changes As of December 31, 2009
17
18.3
5%
13.4
3%
9.85
%
10.9
4%
5.53
% 7.08
%
7.07
%
6.02
%
11.2
7%
10.7
5%
10.0
1%
9.57
%
0.14
%
0.14
%
0.16
%
0.15
%
0.0
4.8
9.6
14.4
19.2
24.0
Marshall Money Market Inv PIMCO Total Return Admin Vanguard Inflation Protection Secs American Century Strat Alloc: Conservative Adv
Short-Term & Bond / Asset Allocation Funds
1.36
%
1.37
%
1.41
%
2.41
%
1.27
%
1.33
%
1.34
%
0.35
%
14.2
0%
15.1
9%
16.0
4%
15.7
2%
1.25
%
1.27
%
1.17
%
1.28
%
0.0
4.2
8.4
12.6
16.8
21.0
American Century Strat Alloc: Moderate Adv American Century Strat Alloc: Aggressive Adv Dodge & Cox Balanced MFS Total Return A
Quarterly Allocation
Quarterly Allocation
3/31/2009 6/30/2009 9/30/2009 12/31/2009
ASSOCIATION OF UNITY CHURCHES 403(B) PLAN
18
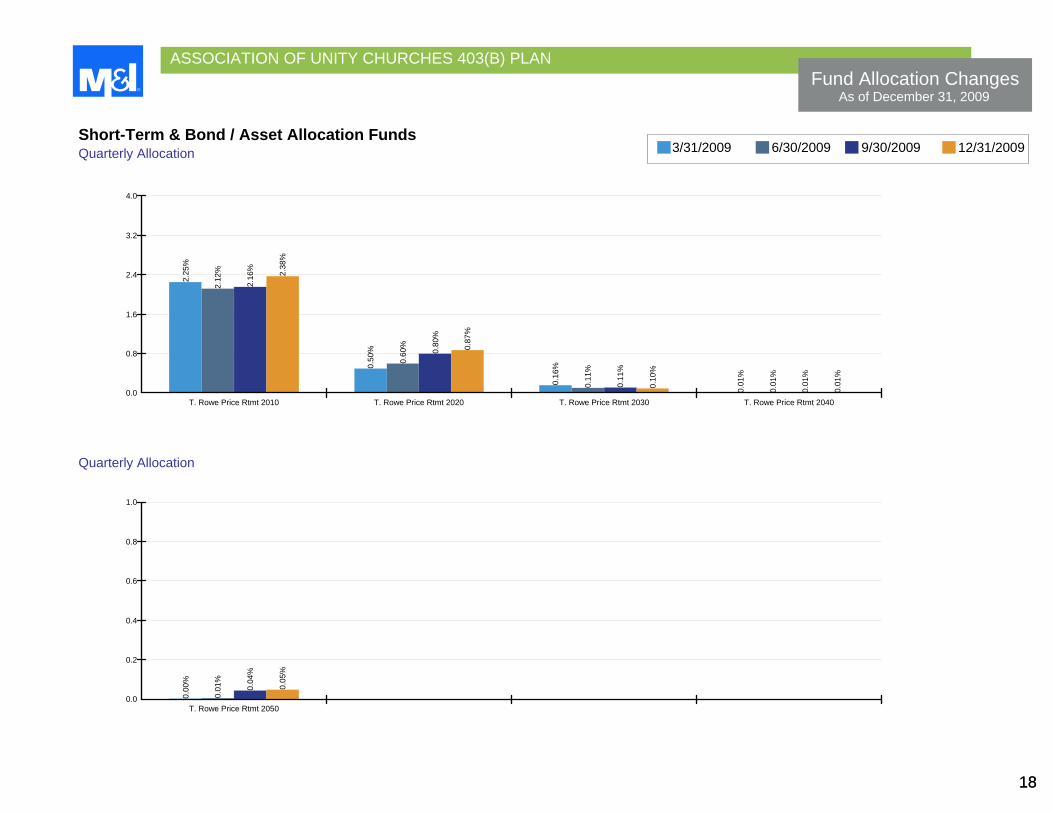
Fund Allocation Changes As of December 31, 2009
18
2.25
%
2.12
%
2.16
% 2.38
%
0.50
%
0.60
%
0.80
%
0.87
%
0.16
%
0.11
%
0.11
%
0.10
%
0.01
%
0.01
%
0.01
%
0.01
%
0.0
0.8
1.6
2.4
3.2
4.0
T. Rowe Price Rtmt 2010 T. Rowe Price Rtmt 2020 T. Rowe Price Rtmt 2030 T. Rowe Price Rtmt 2040
Short-Term & Bond / Asset Allocation Funds
0.00
%
0.01
%
0.04
%
0.05
%
0.0
0.2
0.4
0.6
0.8
1.0
T. Rowe Price Rtmt 2050
Quarterly Allocation
Quarterly Allocation
3/31/2009 6/30/2009 9/30/2009 12/31/2009
ASSOCIATION OF UNITY CHURCHES 403(B) PLAN
19
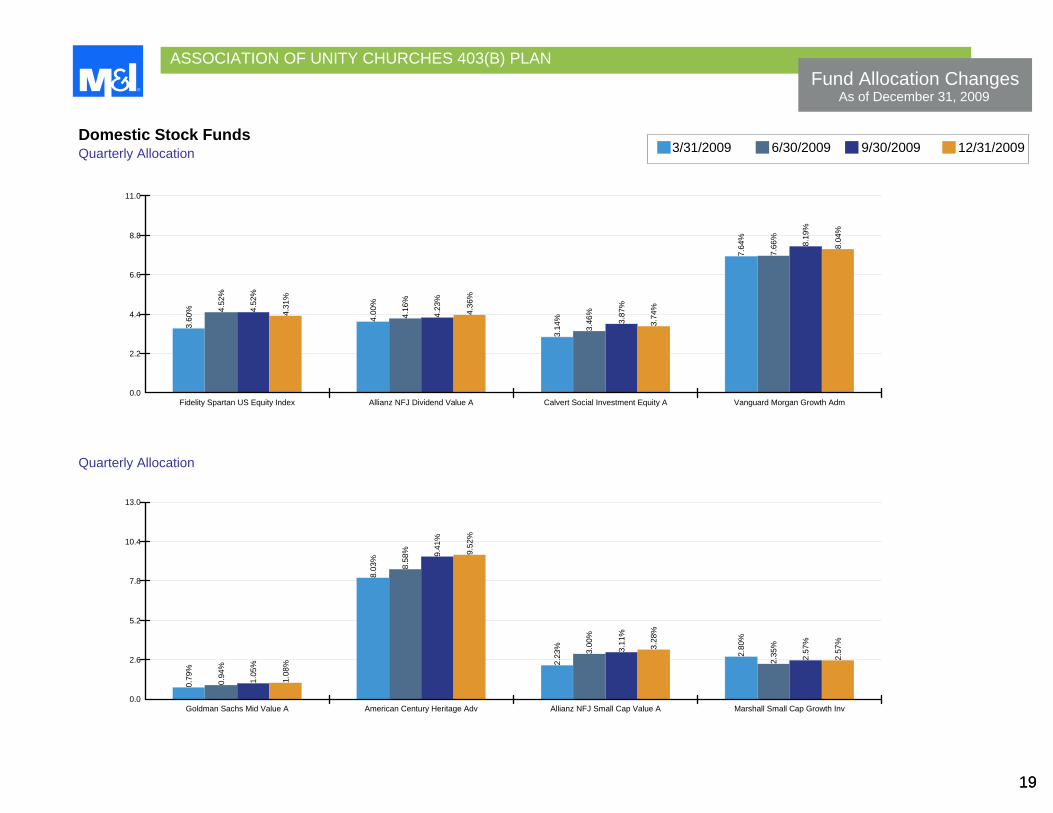
Fund Allocation Changes As of December 31, 2009
19
3.60
% 4.52
%
4.52
%
4.31
%
4.00
%
4.16
%
4.23
%
4.36
%
3.14
%
3.46
%
3.87
%
3.74
%
7.64
%
7.66
%
8.19
%
8.04
%
0.0
2.2
4.4
6.6
8.8
11.0
Fidelity Spartan US Equity Index Allianz NFJ Dividend Value A Calvert Social Investment Equity A Vanguard Morgan Growth Adm
Domestic Stock Funds
0.79
%
0.94
%
1.05
%
1.08
%
8.03
%
8.58
% 9.41
%
9.52
%
2.23
% 3.00
%
3.11
%
3.28
%
2.80
%
2.35
%
2.57
%
2.57
%
0.0
2.6
5.2
7.8
10.4
13.0
Goldman Sachs Mid Value A American Century Heritage Adv Allianz NFJ Small Cap Value A Marshall Small Cap Growth Inv
Quarterly Allocation
Quarterly Allocation
3/31/2009 6/30/2009 9/30/2009 12/31/2009
ASSOCIATION OF UNITY CHURCHES 403(B) PLAN
20
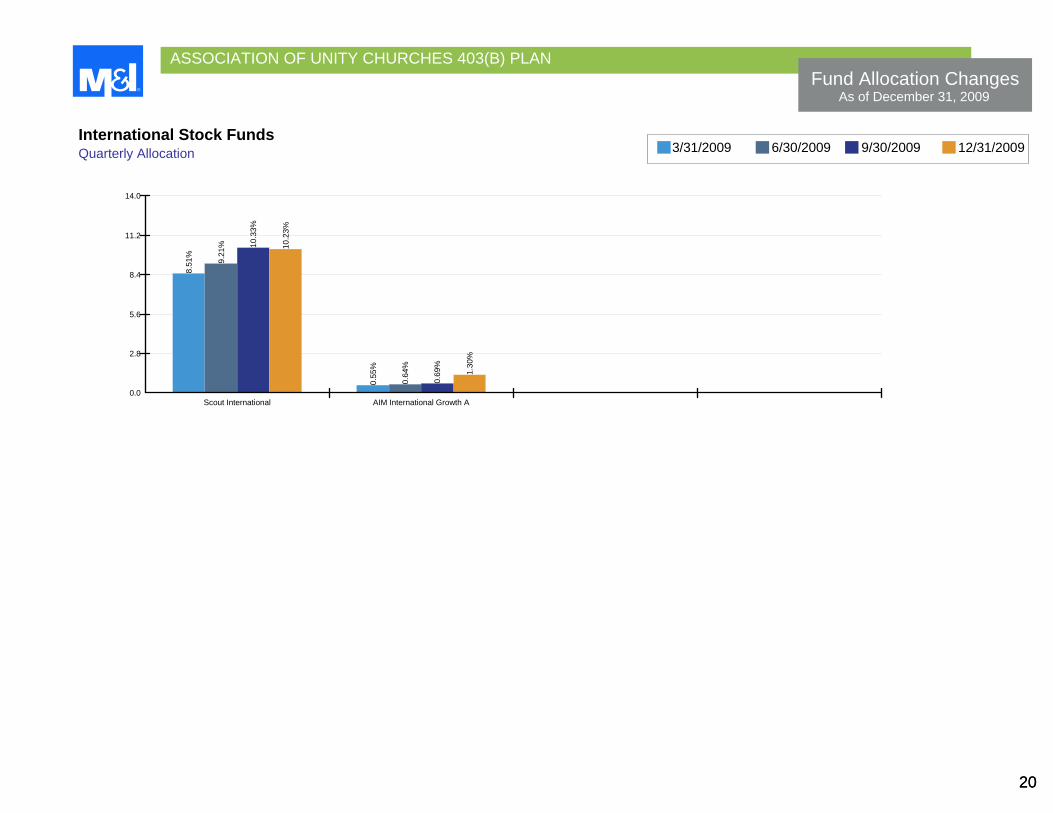
Fund Allocation Changes As of December 31, 2009
20
8.51
%
9.21
% 10.3
3%
10.2
3%
0.55
%
0.64
%
0.69
%
1.30
%
0.0
2.8
5.6
8.4
11.2
14.0
Scout International AIM International Growth A
International Stock Funds
Quarterly Allocation
3/31/2009 6/30/2009 9/30/2009 12/31/2009
21
Section IV: Performance Matrix4th Quarter, 2009
ASSOCIATION OF UNITY CHURCHES 403(B) PLAN
Performance Analysis As of December 31, 2009
22
Qtr Fund/Category/Benchmark MS %
Rank
Lipper%
Rank
MS%
Rank
Lipper%
Rank
1 Yr Ticker Symbol
MS%
Rank
Lipper%
Rank
3 Yr MS%
Rank
Lipper%
Rank
5 Yr MS%
Rank
Lipper%
Rank
10 Yr S.I.
Inception Date
Annualized Periods
Short-Term & Bond Funds
Short-Term
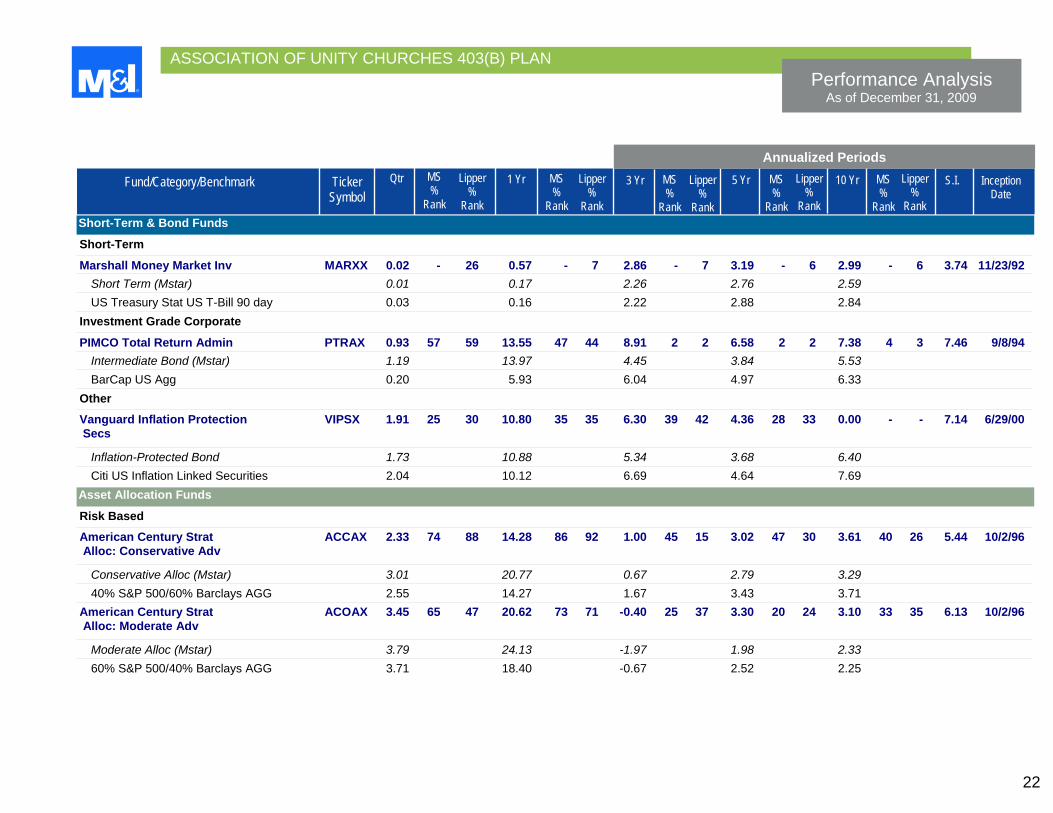
Marshall Money Market Inv MARXX 0.02 - 26 0.57 - 7 2.86 - 7 3.19 - 6 2.99 - 6 3.74 11/23/92 Short Term (Mstar) 0.01 0.17 2.26 2.76 2.59 US Treasury Stat US T-Bill 90 day 0.03 0.16 2.22 2.88 2.84
Investment Grade Corporate
PIMCO Total Return Admin PTRAX 0.93 57 59 13.55 47 44 8.91 2 2 6.58 2 2 7.38 4 3 7.46 9/8/94 Intermediate Bond (Mstar) 1.19 13.97 4.45 3.84 5.53 BarCap US Agg 0.20 5.93 6.04 4.97 6.33
Other
Vanguard Inflation Protection VIPSX 1.91 25 30 10.80 35 35 6.30 39 42 4.36 28 33 0.00 - - 7.14 6/29/00 Secs
Inflation-Protected Bond 1.73 10.88 5.34 3.68 6.40 Citi US Inflation Linked Securities 2.04 10.12 6.69 4.64 7.69
Asset Allocation Funds
Risk Based
American Century Strat ACCAX 2.33 74 88 14.28 86 92 1.00 45 15 3.02 47 30 3.61 40 26 5.44 10/2/96 Alloc: Conservative Adv
Conservative Alloc (Mstar) 3.01 20.77 0.67 2.79 3.29 40% S&P 500/60% Barclays AGG 2.55 14.27 1.67 3.43 3.71 American Century Strat ACOAX 3.45 65 47 20.62 73 71 -0.40 25 37 3.30 20 24 3.10 33 35 6.13 10/2/96 Alloc: Moderate Adv
Moderate Alloc (Mstar) 3.79 24.13 -1.97 1.98 2.33 60% S&P 500/40% Barclays AGG 3.71 18.40 -0.67 2.52 2.25
ASSOCIATION OF UNITY CHURCHES 403(B) PLAN
Performance Analysis As of December 31, 2009
23
Qtr Fund/Category/Benchmark MS %
Rank
Lipper%
Rank
MS%
Rank
Lipper%
Rank
1 Yr Ticker Symbol
MS%
Rank
Lipper%
Rank
3 Yr MS%
Rank
Lipper%
Rank
5 Yr MS%
Rank
Lipper%
Rank
10 Yr S.I.
Inception Date
Annualized Periods
Asset Allocation Funds
Risk Based
American Century Strat ACVAX 4.54 86 28 25.49 86 47 -1.63 31 36 3.09 17 18 2.24 8 42 6.27 10/2/96 Alloc: Aggressive Adv
Large Growth (Alloc) (Mstar) 6.68 35.68 -2.89 1.21 -2.11 Russell 1000 Growth 7.94 37.21 -1.89 1.63 -3.99
Balanced
Dodge & Cox Balanced DODBX 3.82 49 59 28.37 23 31 -4.62 87 86 1.04 76 74 6.20 3 2 0.00 6/26/31 MFS Total Return A MSFRX 2.92 83 72 18.18 86 81 -1.36 43 58 2.07 49 57 4.88 9 10 10.05 10/6/70 Moderate Allocation (Balanced) 3.79 24.13 -1.97 1.98 2.33 60% S&P 500/40% Barclays AGG 3.71 18.40 -0.67 2.52 2.25
Target Retirement
T. Rowe Price Rtmt 2010 TRRAX 3.78 18 19 27.95 9 10 0.00 32 31 3.70 6 5 - - - 8.02 9/30/02 Target Date 2000-2010 2.96 22.42 -0.97 2.19 2.76 T. Rowe Price Rtmt 2020 TRRBX 4.73 4 4 34.24 4 4 -1.59 24 24 3.21 2 4 - - - 8.52 9/30/02 Target Date 2016-2020 3.26 24.25 -3.09 1.52 1.04 T. Rowe Price Rtmt 2030 TRRCX 5.29 2 3 38.03 1 1 -2.84 13 14 2.87 1 3 - - - 8.82 9/30/02 Target Date 2026-2030 4.12 28.87 -4.46 1.17 0.39 T. Rowe Price Rtmt 2040 TRRDX 5.50 9 12 39.12 3 3 -3.16 7 8 2.69 1 3 - - - 8.72 9/30/02 Target Date 2036-2040 4.47 30.90 -5.07 1.01 -0.56 T. Rowe Price Rtmt 2050 TRRMX 5.41 16 18 38.90 5 5 -3.16 1 4 - - - - - - -3.16 12/29/06 Target Date 2050+ 4.63 32.21 -5.66 0.96 -
Domestic Stock Funds
Large Cap Blend
Fidelity Spartan US Equity Index FUSEX 6.01 29 25 26.51 54 12 -5.65 51 11 0.38 50 9 -1.04 59 12 9.14 2/17/88 Large Index (Lipper) 5.90 25.88 -6.07 -0.06 -1.42 S&P 500 6.04 26.46 -5.63 0.42 -0.95
ASSOCIATION OF UNITY CHURCHES 403(B) PLAN
Performance Analysis As of December 31, 2009
24
Qtr Fund/Category/Benchmark MS %
Rank
Lipper%
Rank
MS%
Rank
Lipper%
Rank
1 Yr Ticker Symbol
MS%
Rank
Lipper%
Rank
3 Yr MS%
Rank
Lipper%
Rank
5 Yr MS%
Rank
Lipper%
Rank
10 Yr S.I.
Inception Date
Annualized Periods
Domestic Stock Funds
Large Cap Value
Allianz NFJ Dividend Value A PNEAX 7.66 5 14 12.91 95 91 -9.12 78 88 0.76 33 60 - - - 5.45 10/31/01 Large Value (Mstar) 4.83 24.13 -7.32 0.02 2.54 Russell 1000 Value 4.22 19.69 -8.96 -0.25 2.47
Large Cap Growth
Calvert Social Investment CSIEX 4.50 87 94 33.41 56 57 -1.85 34 39 1.65 38 31 3.07 4 2 7.04 8/24/87 Equity A
Vanguard Morgan Growth Adm VMRAX 7.43 32 29 36.31 39 51 -3.79 63 57 1.62 38 49 -0.73 30 - 1.35 5/14/01 Large Growth (Mstar) 6.68 35.68 -2.89 1.21 -2.11 Russell 1000 Growth 7.94 37.21 -1.89 1.63 -3.99
Mid Cap Value
Goldman Sachs Mid Value A GCMAX 5.72 8 34 32.70 51 63 -4.76 33 37 2.35 28 39 9.65 10 10 7.37 8/15/97 Mid Value (Mstar) 5.21 35.41 -5.35 1.36 6.92 Russell Midcap Value 5.21 34.21 -6.62 1.98 7.58
Mid Cap Growth
American Century Heritage Adv ATHAX 4.91 66 70 36.51 63 69 2.15 7 7 8.70 1 1 3.65 20 17 6.44 7/11/97 Mid Growth (Mstar) 5.68 39.11 -3.09 1.76 0.34 Russell Midcap Growth 6.69 46.29 -3.18 2.40 -0.52
Small Cap Value
Allianz NFJ Small Cap Value A PCVAX 5.90 13 18 23.94 71 78 -1.10 7 14 4.82 9 13 11.57 11 5 9.72 1/20/97 Small Value (Mstar) 4.00 31.32 -6.13 0.67 8.64 Russell 2000 Value 3.63 20.58 -8.22 -0.01 8.27

ASSOCIATION OF UNITY CHURCHES 403(B) PLAN
Performance Analysis As of December 31, 2009
25
Qtr Fund/Category/Benchmark MS %
Rank
Lipper%
Rank
MS%
Rank
Lipper%
Rank
1 Yr Ticker Symbol
MS%
Rank
Lipper%
Rank
3 Yr MS%
Rank
Lipper%
Rank
5 Yr MS%
Rank
Lipper%
Rank
10 Yr S.I.
Inception Date
Annualized Periods
Domestic Stock Funds
Small Cap Growth
Marshall Small Cap Growth Inv MRSCX 8.60 2 3 46.81 13 16 0.09 7 7 4.58 8 6 3.07 26 17 7.09 9/4/96 Small Growth (Mstar) 4.79 35.46 -4.89 0.37 0.60 Russell 2000 Growth 4.14 34.47 -4.00 0.87 -1.37
International Stock Funds
Foreign Large Cap Blend
Scout International UMBWX 3.99 17 60 35.54 25 45 -0.37 2 4 7.52 8 6 4.50 8 10 9.27 9/14/93 Foreign Lg Blend (Mstar) 2.64 31.24 -6.15 3.58 0.62 MSCI EAFE 1.80 27.75 -8.66 0.85 -1.07
Foreign Large Cap Growth
AIM International Growth A AIIEX 6.00 14 11 34.93 60 48 -2.89 19 19 6.60 6 14 0.72 43 40 8.13 4/7/92 Foreign Lg Growth (Mstar) 4.48 38.02 -4.93 4.25 0.16 MSCI EAFE Growth 4.17 29.36 -4.78 3.65 -1.31
ASSOCIATION OF UNITY CHURCHES 403(B) PLAN
Performance Analysis As of December 31, 2009
26
CurrentYTD
Fund/Category/Benchmark 2008 2006 2005 2007 Ticker Symbol
2003 2002 2004 2000 2001 1999
Calendar Year Returns
Short-Term & Bond Funds
Short-Term
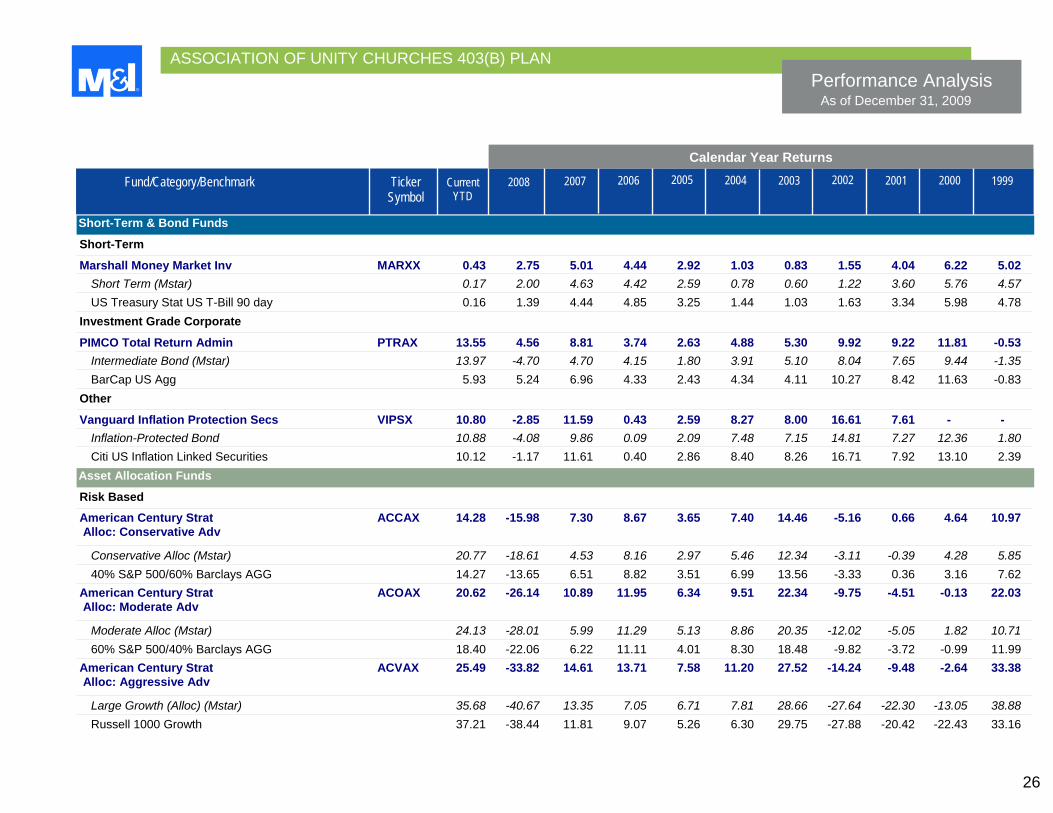
Marshall Money Market Inv MARXX 0.43 2.75 5.01 4.44 2.92 1.03 0.83 1.55 4.04 6.22 5.02 Short Term (Mstar) 0.17 2.00 4.63 4.42 2.59 0.78 0.60 1.22 3.60 5.76 4.57 US Treasury Stat US T-Bill 90 day 0.16 1.39 4.44 4.85 3.25 1.44 1.03 1.63 3.34 5.98 4.78
Investment Grade Corporate
PIMCO Total Return Admin PTRAX 13.55 4.56 8.81 3.74 2.63 4.88 5.30 9.92 9.22 11.81 -0.53 Intermediate Bond (Mstar) 13.97 -4.70 4.70 4.15 1.80 3.91 5.10 8.04 7.65 9.44 -1.35 BarCap US Agg 5.93 5.24 6.96 4.33 2.43 4.34 4.11 10.27 8.42 11.63 -0.83
Other
Vanguard Inflation Protection Secs VIPSX 10.80 -2.85 11.59 0.43 2.59 8.27 8.00 16.61 7.61 - - Inflation-Protected Bond 10.88 -4.08 9.86 0.09 2.09 7.48 7.15 14.81 7.27 12.36 1.80 Citi US Inflation Linked Securities 10.12 -1.17 11.61 0.40 2.86 8.40 8.26 16.71 7.92 13.10 2.39
Asset Allocation Funds
Risk Based
American Century Strat ACCAX 14.28 -15.98 7.30 8.67 3.65 7.40 14.46 -5.16 0.66 4.64 10.97 Alloc: Conservative Adv
Conservative Alloc (Mstar) 20.77 -18.61 4.53 8.16 2.97 5.46 12.34 -3.11 -0.39 4.28 5.85 40% S&P 500/60% Barclays AGG 14.27 -13.65 6.51 8.82 3.51 6.99 13.56 -3.33 0.36 3.16 7.62 American Century Strat ACOAX 20.62 -26.14 10.89 11.95 6.34 9.51 22.34 -9.75 -4.51 -0.13 22.03 Alloc: Moderate Adv
Moderate Alloc (Mstar) 24.13 -28.01 5.99 11.29 5.13 8.86 20.35 -12.02 -5.05 1.82 10.71 60% S&P 500/40% Barclays AGG 18.40 -22.06 6.22 11.11 4.01 8.30 18.48 -9.82 -3.72 -0.99 11.99 American Century Strat ACVAX 25.49 -33.82 14.61 13.71 7.58 11.20 27.52 -14.24 -9.48 -2.64 33.38 Alloc: Aggressive Adv
Large Growth (Alloc) (Mstar) 35.68 -40.67 13.35 7.05 6.71 7.81 28.66 -27.64 -22.30 -13.05 38.88 Russell 1000 Growth 37.21 -38.44 11.81 9.07 5.26 6.30 29.75 -27.88 -20.42 -22.43 33.16

ASSOCIATION OF UNITY CHURCHES 403(B) PLAN
Performance Analysis As of December 31, 2009
27
CurrentYTD
Fund/Category/Benchmark 2008 2006 2005 2007 Ticker Symbol
2003 2002 2004 2000 2001 1999
Calendar Year Returns
Asset Allocation Funds
Balanced
Dodge & Cox Balanced DODBX 28.37 -33.57 1.73 13.86 6.59 13.30 24.44 -2.94 10.05 15.14 12.06 MFS Total Return A MSFRX 18.18 -22.63 4.98 11.56 3.29 11.37 16.85 -5.56 -0.63 19.03 2.31 Moderate Allocation (Balanced) 24.13 -28.01 5.99 11.29 5.13 8.86 20.35 -12.02 -5.05 1.82 10.71 60% S&P 500/40% Barclays AGG 18.40 -22.06 6.22 11.11 4.01 8.30 18.48 -9.82 -3.72 -0.99 11.99
Target Retirement
T. Rowe Price Rtmt 2010 TRRAX 27.95 -26.72 6.65 12.84 6.25 11.11 23.75 - - - - Target Date 2000-2010 22.42 -22.47 5.22 8.58 3.68 6.82 13.67 -4.11 -0.54 2.70 9.09 T. Rowe Price Rtmt 2020 TRRBX 34.24 -33.48 6.73 14.66 7.17 12.82 27.41 - - - - Target Date 2016-2020 24.25 -29.46 6.02 11.95 5.80 9.61 21.84 -13.42 -9.85 -4.21 18.34 T. Rowe Price Rtmt 2030 TRRCX 38.03 -37.79 6.83 16.14 8.12 14.15 29.98 - - - - Target Date 2026-2030 28.87 -36.04 6.50 13.60 6.81 10.95 23.89 -14.20 -10.47 -5.93 18.32 T. Rowe Price Rtmt 2040 TRRDX 39.12 -38.85 6.77 16.24 8.14 14.11 29.99 - - - - Target Date 2036-2040 30.90 -37.94 6.21 14.67 7.41 11.71 26.65 -16.99 -13.81 -10.06 20.85 T. Rowe Price Rtmt 2050 TRRMX 38.90 -38.80 6.82 - - - - - - - - Target Date 2050+ 32.21 -38.86 5.94 15.51 8.76 12.60 25.73 -16.09 - - -
Domestic Stock Funds
Large Cap Blend
Fidelity Spartan US Equity Index FUSEX 26.51 -37.03 5.43 15.72 4.85 10.73 28.50 -22.21 -12.05 -9.18 20.66 Large Index (Lipper) 25.88 -37.29 4.92 15.19 4.36 10.25 27.87 -22.52 -12.39 -9.51 20.31 S&P 500 26.46 -37.00 5.49 15.79 4.91 10.88 28.68 -22.10 -11.88 -9.11 21.04
Large Cap Value
Allianz NFJ Dividend Value A PNEAX 12.91 -36.25 4.27 24.13 11.48 13.88 27.61 -7.06 16.03 - - Large Value (Mstar) 24.13 -37.09 1.42 18.15 5.95 12.97 28.44 -18.69 -4.99 7.87 6.72 Russell 1000 Value 19.69 -36.85 -0.17 22.25 7.05 16.49 30.03 -15.52 -5.59 7.02 7.35
ASSOCIATION OF UNITY CHURCHES 403(B) PLAN
Performance Analysis As of December 31, 2009
28
CurrentYTD
Fund/Category/Benchmark 2008 2006 2005 2007 Ticker Symbol
2003 2002 2004 2000 2001 1999
Calendar Year Returns
Domestic Stock Funds
Large Cap Growth
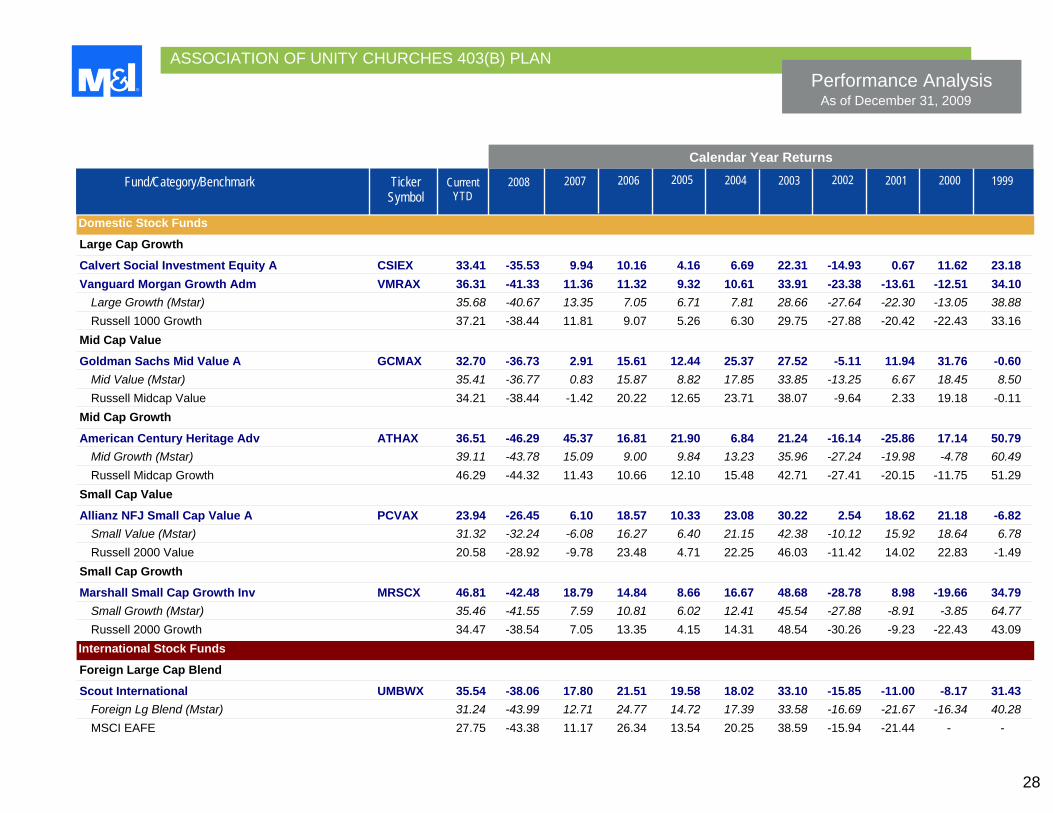
Calvert Social Investment Equity A CSIEX 33.41 -35.53 9.94 10.16 4.16 6.69 22.31 -14.93 0.67 11.62 23.18 Vanguard Morgan Growth Adm VMRAX 36.31 -41.33 11.36 11.32 9.32 10.61 33.91 -23.38 -13.61 -12.51 34.10 Large Growth (Mstar) 35.68 -40.67 13.35 7.05 6.71 7.81 28.66 -27.64 -22.30 -13.05 38.88 Russell 1000 Growth 37.21 -38.44 11.81 9.07 5.26 6.30 29.75 -27.88 -20.42 -22.43 33.16
Mid Cap Value
Goldman Sachs Mid Value A GCMAX 32.70 -36.73 2.91 15.61 12.44 25.37 27.52 -5.11 11.94 31.76 -0.60 Mid Value (Mstar) 35.41 -36.77 0.83 15.87 8.82 17.85 33.85 -13.25 6.67 18.45 8.50 Russell Midcap Value 34.21 -38.44 -1.42 20.22 12.65 23.71 38.07 -9.64 2.33 19.18 -0.11
Mid Cap Growth
American Century Heritage Adv ATHAX 36.51 -46.29 45.37 16.81 21.90 6.84 21.24 -16.14 -25.86 17.14 50.79 Mid Growth (Mstar) 39.11 -43.78 15.09 9.00 9.84 13.23 35.96 -27.24 -19.98 -4.78 60.49 Russell Midcap Growth 46.29 -44.32 11.43 10.66 12.10 15.48 42.71 -27.41 -20.15 -11.75 51.29
Small Cap Value
Allianz NFJ Small Cap Value A PCVAX 23.94 -26.45 6.10 18.57 10.33 23.08 30.22 2.54 18.62 21.18 -6.82 Small Value (Mstar) 31.32 -32.24 -6.08 16.27 6.40 21.15 42.38 -10.12 15.92 18.64 6.78 Russell 2000 Value 20.58 -28.92 -9.78 23.48 4.71 22.25 46.03 -11.42 14.02 22.83 -1.49
Small Cap Growth
Marshall Small Cap Growth Inv MRSCX 46.81 -42.48 18.79 14.84 8.66 16.67 48.68 -28.78 8.98 -19.66 34.79 Small Growth (Mstar) 35.46 -41.55 7.59 10.81 6.02 12.41 45.54 -27.88 -8.91 -3.85 64.77 Russell 2000 Growth 34.47 -38.54 7.05 13.35 4.15 14.31 48.54 -30.26 -9.23 -22.43 43.09
International Stock Funds
Foreign Large Cap Blend
Scout International UMBWX 35.54 -38.06 17.80 21.51 19.58 18.02 33.10 -15.85 -11.00 -8.17 31.43 Foreign Lg Blend (Mstar) 31.24 -43.99 12.71 24.77 14.72 17.39 33.58 -16.69 -21.67 -16.34 40.28 MSCI EAFE 27.75 -43.38 11.17 26.34 13.54 20.25 38.59 -15.94 -21.44 - -
ASSOCIATION OF UNITY CHURCHES 403(B) PLAN
Performance Analysis As of December 31, 2009
29
CurrentYTD
Fund/Category/Benchmark 2008 2006 2005 2007 Ticker Symbol
2003 2002 2004 2000 2001 1999
Calendar Year Returns
International Stock Funds
Foreign Large Cap Growth
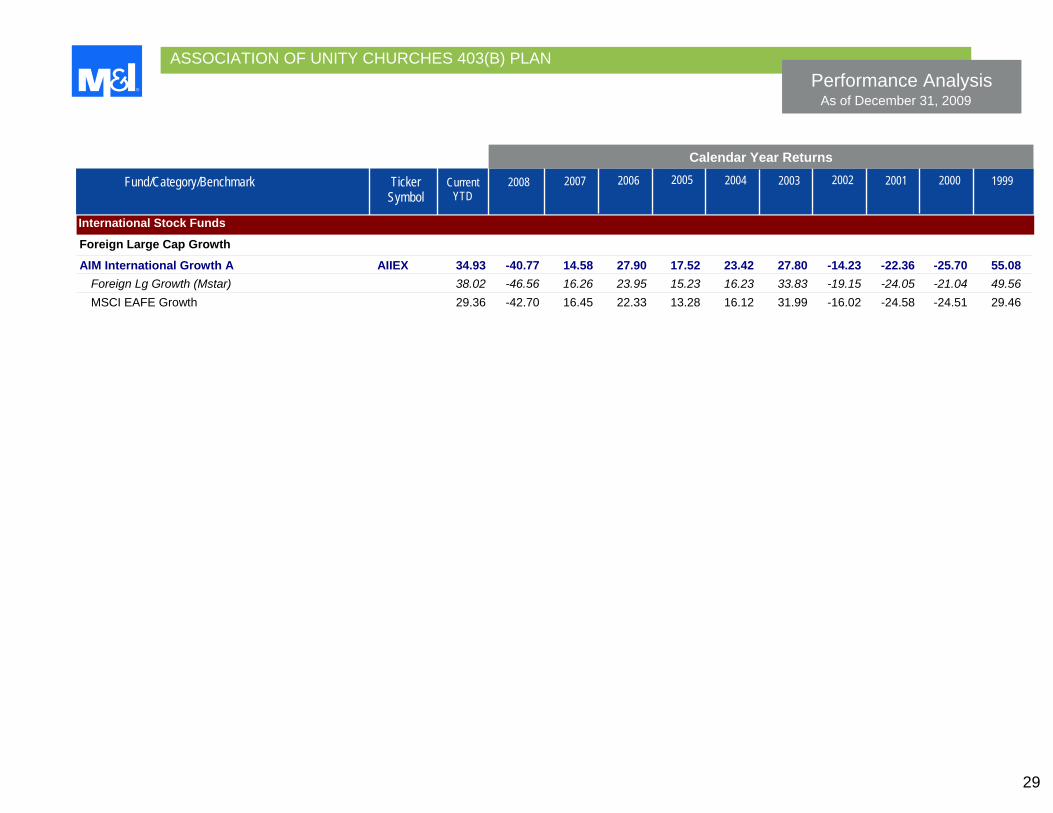
AIM International Growth A AIIEX 34.93 -40.77 14.58 27.90 17.52 23.42 27.80 -14.23 -22.36 -25.70 55.08 Foreign Lg Growth (Mstar) 38.02 -46.56 16.26 23.95 15.23 16.23 33.83 -19.15 -24.05 -21.04 49.56 MSCI EAFE Growth 29.36 -42.70 16.45 22.33 13.28 16.12 31.99 -16.02 -24.58 -24.51 29.46

ASSOCIATION OF UNITY CHURCHES 403(B) PLAN
30
Risk/Reward Analysis As of December 31, 2009
Sharpe Ratio 3-Year Data vs. Benchmark Standard Deviation Fund/Category/Benchmark Ticker 3-Year 5-Year Beta Alpha R-2 Batting Info 3-Year 5-Year Symbol Average Ratio
Short-Term & Bond Funds
Short-Term
Marshall Money Market Inv MARXX 0.55 0.49 - - - 88.89 3.77 3.70 1.73 Short Term (Mstar) - - - - - - US Treasury Stat US T-Bill 0.56 0.52 0.92 -0.76 90 day
Investment Grade Corporate
PIMCO Total Return Admin PTRAX 4.90 4.27 1.00 2.72 71.81 72.22 1.08 1.34 0.85 Intermediate Bond (Mstar) 5.13 4.27 0.99 -1.39 58.69 0.52 BarCap US Agg 4.17 3.70 0.92 0.57
Other
Vanguard Inflation Protection VIPSX 8.91 7.36 1.00 -0.35 99.19 52.78 -0.49 0.51 0.24 Secs
Inflation-Protected Bond 8.86 7.30 1.00 -1.25 94.49 0.41 Citi US Inflation Linked 8.90 7.38 0.55 0.28 Securities
Asset Allocation Funds
Risk Based
American Century Strat ACCAX 9.18 7.43 1.00 -0.66 97.79 50.00 -0.49 -0.06 0.07 Alloc: Conservative Adv
Conservative Alloc (Mstar) 10.10 8.02 1.08 -0.73 85.24 -0.05 40% S&P 500/60% Barclays AGG 9.07 7.30 -0.06 0.08 American Century Strat ACOAX 13.48 11.01 1.05 0.47 95.83 55.56 0.09 -0.11 0.10 Alloc: Moderate Adv
Moderate Alloc (Mstar) 14.52 11.67 1.11 0.20 93.03 -0.18 60% S&P 500/40% Barclays AGG 12.57 10.10 -0.23 -0.03
ASSOCIATION OF UNITY CHURCHES 403(B) PLAN
31
Risk/Reward Analysis As of December 31, 2009
Sharpe Ratio 3-Year Data vs. Benchmark Standard Deviation Fund/Category/Benchmark Ticker 3-Year 5-Year Beta Alpha R-2 Batting Info 3-Year 5-Year Symbol Average Ratio
Asset Allocation Funds
Risk Based
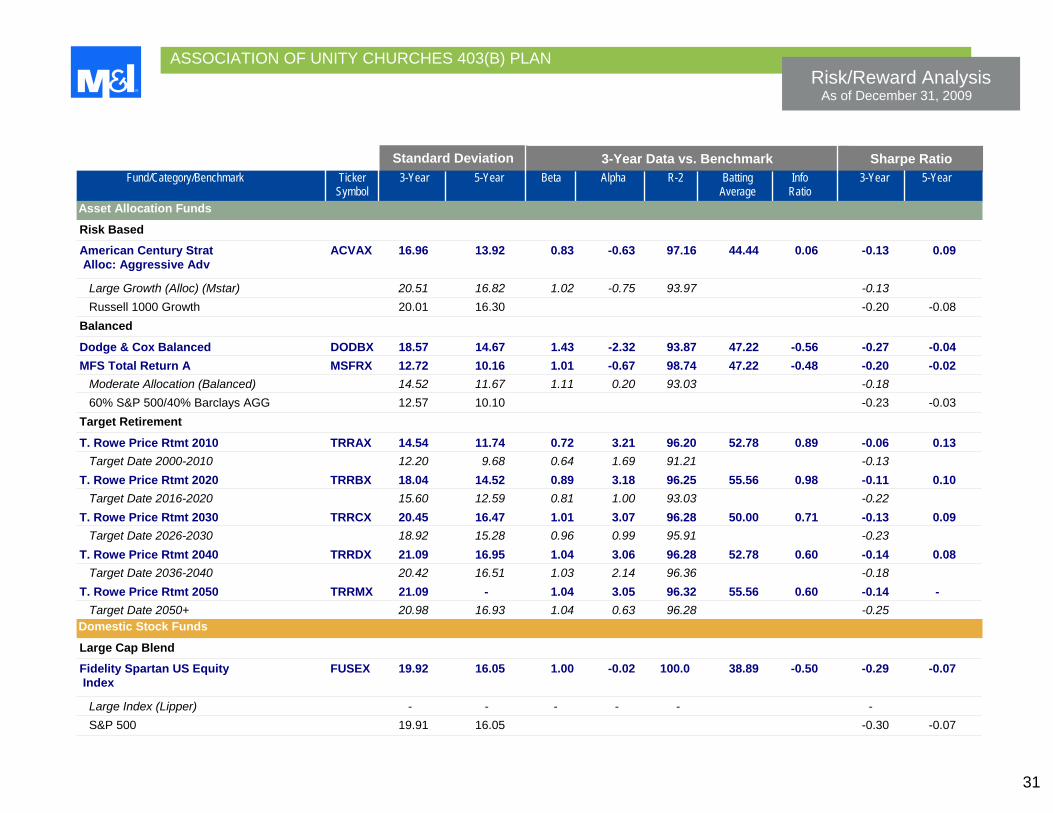
American Century Strat ACVAX 16.96 13.92 0.83 -0.63 97.16 44.44 0.06 -0.13 0.09 Alloc: Aggressive Adv
Large Growth (Alloc) (Mstar) 20.51 16.82 1.02 -0.75 93.97 -0.13 Russell 1000 Growth 20.01 16.30 -0.20 -0.08
Balanced
Dodge & Cox Balanced DODBX 18.57 14.67 1.43 -2.32 93.87 47.22 -0.56 -0.27 -0.04 MFS Total Return A MSFRX 12.72 10.16 1.01 -0.67 98.74 47.22 -0.48 -0.20 -0.02 Moderate Allocation (Balanced) 14.52 11.67 1.11 0.20 93.03 -0.18 60% S&P 500/40% Barclays AGG 12.57 10.10 -0.23 -0.03
Target Retirement
T. Rowe Price Rtmt 2010 TRRAX 14.54 11.74 0.72 3.21 96.20 52.78 0.89 -0.06 0.13 Target Date 2000-2010 12.20 9.68 0.64 1.69 91.21 -0.13 T. Rowe Price Rtmt 2020 TRRBX 18.04 14.52 0.89 3.18 96.25 55.56 0.98 -0.11 0.10 Target Date 2016-2020 15.60 12.59 0.81 1.00 93.03 -0.22 T. Rowe Price Rtmt 2030 TRRCX 20.45 16.47 1.01 3.07 96.28 50.00 0.71 -0.13 0.09 Target Date 2026-2030 18.92 15.28 0.96 0.99 95.91 -0.23 T. Rowe Price Rtmt 2040 TRRDX 21.09 16.95 1.04 3.06 96.28 52.78 0.60 -0.14 0.08 Target Date 2036-2040 20.42 16.51 1.03 2.14 96.36 -0.18 T. Rowe Price Rtmt 2050 TRRMX 21.09 - 1.04 3.05 96.32 55.56 0.60 -0.14 - Target Date 2050+ 20.98 16.93 1.04 0.63 96.28 -0.25
Domestic Stock Funds
Large Cap Blend
Fidelity Spartan US Equity FUSEX 19.92 16.05 1.00 -0.02 100.0 38.89 -0.50 -0.29 -0.07 Index
Large Index (Lipper) - - - - - - S&P 500 19.91 16.05 -0.30 -0.07
ASSOCIATION OF UNITY CHURCHES 403(B) PLAN
32
Risk/Reward Analysis As of December 31, 2009
Sharpe Ratio 3-Year Data vs. Benchmark Standard Deviation Fund/Category/Benchmark Ticker 3-Year 5-Year Beta Alpha R-2 Batting Info 3-Year 5-Year Symbol Average Ratio
Domestic Stock Funds
Large Cap Value
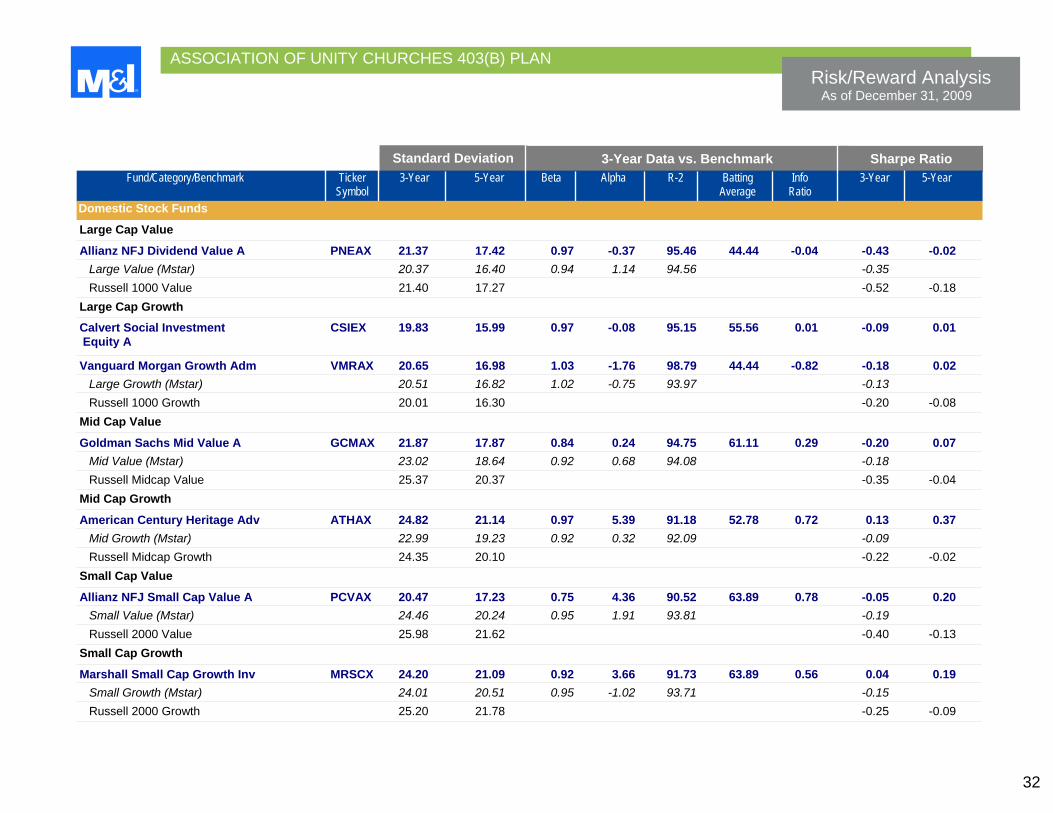
Allianz NFJ Dividend Value A PNEAX 21.37 17.42 0.97 -0.37 95.46 44.44 -0.04 -0.43 -0.02 Large Value (Mstar) 20.37 16.40 0.94 1.14 94.56 -0.35 Russell 1000 Value 21.40 17.27 -0.52 -0.18
Large Cap Growth
Calvert Social Investment CSIEX 19.83 15.99 0.97 -0.08 95.15 55.56 0.01 -0.09 0.01 Equity A
Vanguard Morgan Growth Adm VMRAX 20.65 16.98 1.03 -1.76 98.79 44.44 -0.82 -0.18 0.02 Large Growth (Mstar) 20.51 16.82 1.02 -0.75 93.97 -0.13 Russell 1000 Growth 20.01 16.30 -0.20 -0.08
Mid Cap Value
Goldman Sachs Mid Value A GCMAX 21.87 17.87 0.84 0.24 94.75 61.11 0.29 -0.20 0.07 Mid Value (Mstar) 23.02 18.64 0.92 0.68 94.08 -0.18 Russell Midcap Value 25.37 20.37 -0.35 -0.04
Mid Cap Growth
American Century Heritage Adv ATHAX 24.82 21.14 0.97 5.39 91.18 52.78 0.72 0.13 0.37 Mid Growth (Mstar) 22.99 19.23 0.92 0.32 92.09 -0.09 Russell Midcap Growth 24.35 20.10 -0.22 -0.02
Small Cap Value
Allianz NFJ Small Cap Value A PCVAX 20.47 17.23 0.75 4.36 90.52 63.89 0.78 -0.05 0.20 Small Value (Mstar) 24.46 20.24 0.95 1.91 93.81 -0.19 Russell 2000 Value 25.98 21.62 -0.40 -0.13
Small Cap Growth
Marshall Small Cap Growth Inv MRSCX 24.20 21.09 0.92 3.66 91.73 63.89 0.56 0.04 0.19 Small Growth (Mstar) 24.01 20.51 0.95 -1.02 93.71 -0.15 Russell 2000 Growth 25.20 21.78 -0.25 -0.09
ASSOCIATION OF UNITY CHURCHES 403(B) PLAN
33
Risk/Reward Analysis As of December 31, 2009
Sharpe Ratio 3-Year Data vs. Benchmark Standard Deviation Fund/Category/Benchmark Ticker 3-Year 5-Year Beta Alpha R-2 Batting Info 3-Year 5-Year Symbol Average Ratio
International Stock Funds
Foreign Large Cap Blend
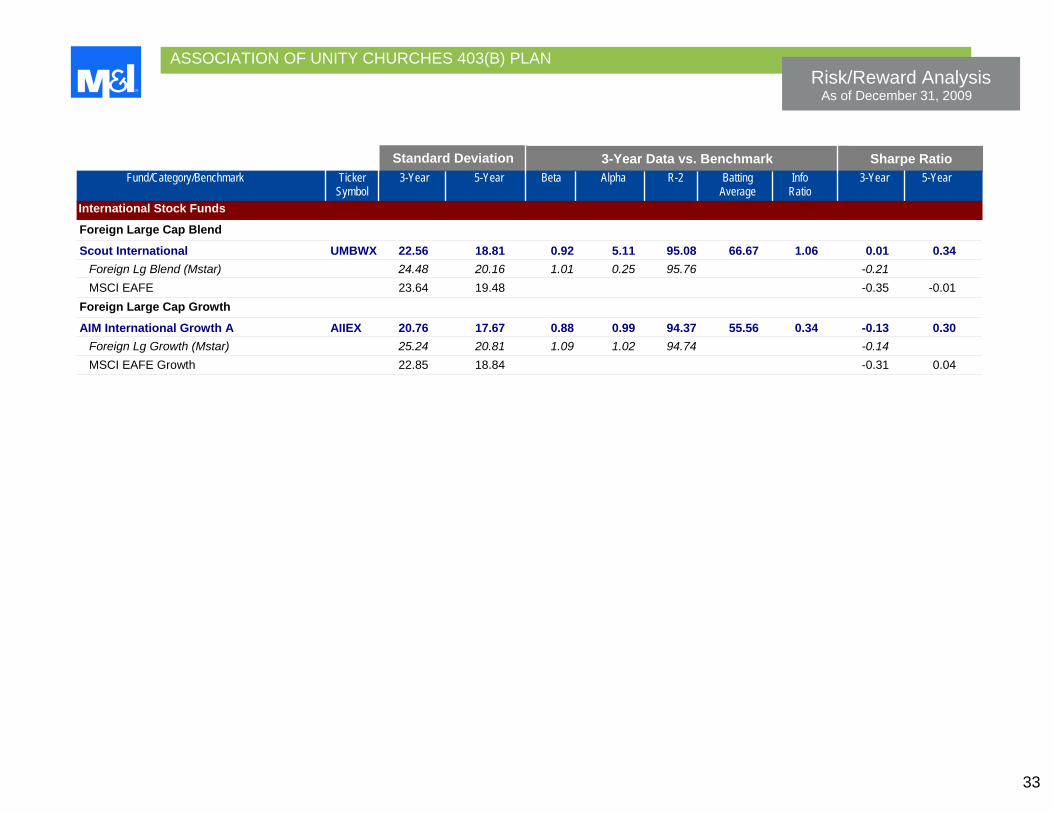
Scout International UMBWX 22.56 18.81 0.92 5.11 95.08 66.67 1.06 0.01 0.34 Foreign Lg Blend (Mstar) 24.48 20.16 1.01 0.25 95.76 -0.21 MSCI EAFE 23.64 19.48 -0.35 -0.01
Foreign Large Cap Growth
AIM International Growth A AIIEX 20.76 17.67 0.88 0.99 94.37 55.56 0.34 -0.13 0.30 Foreign Lg Growth (Mstar) 25.24 20.81 1.09 1.02 94.74 -0.14 MSCI EAFE Growth 22.85 18.84 -0.31 0.04

ASSOCIATION OF UNITY CHURCHES 403(B) PLAN
Fund Characteristics As of December 31, 2009
34
General Characteristics Bond Fund Characteristics
Fund/Category Ticker Symbol
Manager Name Manager Tenure
Net Assets ($MM)
Total # Holdings
% in Top 10
Holdings
Turnover Wtd Avg Qual
Wtd Avg Cpn
Wtd Avg YTM
Wtd Avg Mty
Wtd Avg Dur
Short-Term & Bond Funds
Marshall Money Market Inv MARXX Richard M. Rokus 16 4,952 62 34.18 0 - - 0.57 - - Short Term (Mstar) - - 531 7.56 82 - 1.83 - - - PIMCO Total Return Admin PTRAX Gross, William H. 23 199,462 18271 42.14 300 AA 5.33 5.20 5.80 4.79 Intermediate Bond (Mstar) 6 1,431 592 44.19 230 AA 5.22 4.32 5.91 4.37 Vanguard Inflation Protection VIPSX Volpert/Hollyer 10 27,579 26 60.05 28 AAA 2.24 1.71 9.10 4.24 Secs
Inflation-Protected Bond 3 1,201 419 76.38 224 AAA 2.74 1.51 7.02 6.15
General Characteristics Fund Characteristics
Fund/Category Ticker Symbol
Manager Name Manager Tenure
Net Assets ($MM)
Total # Holdings
% in Top 10
Holdings
Turnover % Cash % Bonds % US Stocks % Non-US Stocks
Asset Allocation Funds
American Century Strat ACCAX Chang/Tyler/Wittman/ 10 608 925 23.14 168 6.88 48.83 34.74 9.15 Alloc: Conservative Adv Torelli
Conservative Alloc (Mstar) 4 550 620 47.51 77 11.95 58.80 21.05 4.78 American Century Strat ACOAX Chang/Tyler/Torelli 10 1,619 1282 16.83 163 6.36 31.97 44.56 16.73 Alloc: Moderate Adv
Moderate Alloc (Mstar) 4 1,117 637 17.07 86 8.85 30.52 46.17 11.53 American Century Strat ACVAX Chang/Tyler/Wittman/ 10 980 1103 13.06 146 4.12 19.69 53.66 22.25 Alloc: Aggressive Adv Torelli
Large Growth (Alloc) (Mstar) 5 1,080 569 29.95 111 2.43 1.00 85.89 10.25
ASSOCIATION OF UNITY CHURCHES 403(B) PLAN
Fund Characteristics As of December 31, 2009
35
General Characteristics Fund Characteristics
Fund/Category Ticker Symbol
Manager Name Manager Tenure
Net Assets ($MM)
Total # Holdings
% in Top 10
Holdings
Turnover % Cash % Bonds % US Stocks % Non-US Stocks
Asset Allocation Funds
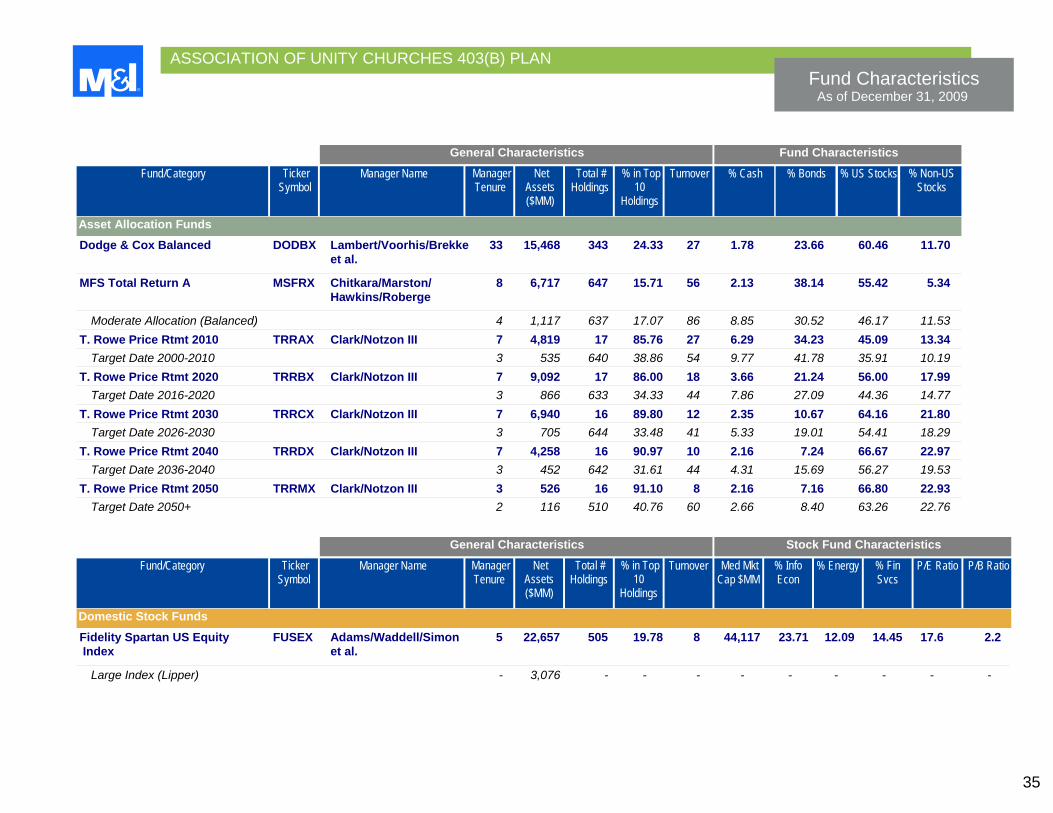
Dodge & Cox Balanced DODBX Lambert/Voorhis/Brekke 33 15,468 343 24.33 27 1.78 23.66 60.46 11.70 et al.
MFS Total Return A MSFRX Chitkara/Marston/ 8 6,717 647 15.71 56 2.13 38.14 55.42 5.34 Hawkins/Roberge
Moderate Allocation (Balanced) 4 1,117 637 17.07 86 8.85 30.52 46.17 11.53 T. Rowe Price Rtmt 2010 TRRAX Clark/Notzon III 7 4,819 17 85.76 27 6.29 34.23 45.09 13.34 Target Date 2000-2010 3 535 640 38.86 54 9.77 41.78 35.91 10.19 T. Rowe Price Rtmt 2020 TRRBX Clark/Notzon III 7 9,092 17 86.00 18 3.66 21.24 56.00 17.99 Target Date 2016-2020 3 866 633 34.33 44 7.86 27.09 44.36 14.77 T. Rowe Price Rtmt 2030 TRRCX Clark/Notzon III 7 6,940 16 89.80 12 2.35 10.67 64.16 21.80 Target Date 2026-2030 3 705 644 33.48 41 5.33 19.01 54.41 18.29 T. Rowe Price Rtmt 2040 TRRDX Clark/Notzon III 7 4,258 16 90.97 10 2.16 7.24 66.67 22.97 Target Date 2036-2040 3 452 642 31.61 44 4.31 15.69 56.27 19.53 T. Rowe Price Rtmt 2050 TRRMX Clark/Notzon III 3 526 16 91.10 8 2.16 7.16 66.80 22.93 Target Date 2050+ 2 116 510 40.76 60 2.66 8.40 63.26 22.76
General Characteristics Stock Fund Characteristics
Fund/Category Ticker Symbol
Manager Name Manager Tenure
Net Assets ($MM)
Total # Holdings
% in Top 10
Holdings
Turnover Med Mkt Cap $MM
% Info Econ
% Energy % Fin Svcs
P/E Ratio P/B Ratio
Domestic Stock Funds
Fidelity Spartan US Equity FUSEX Adams/Waddell/Simon 5 22,657 505 19.78 8 44,117 23.71 12.09 14.45 17.6 2.2 Index et al.
Large Index (Lipper) - 3,076 - - - - - - - - -

ASSOCIATION OF UNITY CHURCHES 403(B) PLAN
Fund Characteristics As of December 31, 2009
36
General Characteristics Stock Fund Characteristics
Fund/Category Ticker Symbol
Manager Name Manager Tenure
Net Assets ($MM)
Total # Holdings
% in Top 10
Holdings
Turnover Med Mkt Cap $MM
% Info Econ
% Energy % Fin Svcs
P/E Ratio P/B Ratio
Domestic Stock Funds
Allianz NFJ Dividend Value PNEAX Fischer/Mckinney/ 10 6,836 47 32.77 43 26,610 15.72 20.30 15.81 13.2 1.8 A Oliver/Magnuson
Large Value (Mstar) 5 1,065 639 23.78 70 42,375 17.31 14.62 19.66 15.3 1.7 Calvert Social Investment CSIEX England/Hackney, 11 1,189 74 37.94 38 33,655 28.35 9.33 10.99 20.3 2.6 Equity A III/Irvin
Vanguard Morgan Growth Adm VMRAX McCarragher/Marrkand/ 6 7,687 344 23.15 87 21,296 39.05 7.80 7.33 20.2 3.1 Knightly
Large Growth (Mstar) 5 1,080 569 29.95 111 41,116 31.23 8.36 10.47 20.8 2.9 Goldman Sachs Mid Value A GCMAX Carroll/Bamford/Butkus 9 5,704 116 19.48 104 5,706 12.81 11.86 27.94 17.2 1.6 et al.
Mid Value (Mstar) 5 523 562 19.25 107 5,791 13.13 8.67 23.80 17.1 1.4 American Century Heritage ATHAX Walsh/Hollond 3 2,133 115 17.63 172 5,271 26.24 6.23 9.35 21.7 3.1 Adv
Mid Growth (Mstar) 5 473 615 15.50 137 5,188 24.51 6.71 12.19 20.0 2.5 Allianz NFJ Small Cap PCVAX Magnuson/Mckinney/ 18 6,099 121 13.43 33 1,865 1.74 10.97 15.37 12.3 1.6 Value A Campbell/Fischer
Small Value (Mstar) 5 376 538 19.38 86 1,347 12.89 5.89 24.29 12.9 1.2 Marshall Small Cap Growth MRSCX Gundlach/Salmon 6 266 87 28.47 233 611 47.09 8.31 4.13 14.9 2.2 Inv
Small Growth (Mstar) 5 322 476 21.34 132 1,525 27.94 5.32 9.95 20.5 2.4

ASSOCIATION OF UNITY CHURCHES 403(B) PLAN
Fund Characteristics As of December 31, 2009
37
General Characteristics International Fund Characteristics
Fund/Category Ticker Symbol
Manager Name Manager Tenure
Net Assets ($MM)
Total # Holdings
% in Top 10
Holdings
Turnover Market Maturity % Developed
Market Maturity % Emerging
% Asia Dev
% Japan % Europe Dev
% United Kingdom
International Stock Funds
Scout International UMBWX Moffett/Anderson 16 4,952 96 15.95 16 89.80 10.20 6.06 10.97 47.77 9.57 Foreign Lg Blend (Mstar) 4 1,212 736 16.96 97 92.96 7.05 6.30 15.10 42.10 18.40 AIM International Growth A AIIEX Sides/Olsson/Dennis 15 3,279 79 27.51 38 90.61 9.39 9.26 6.33 36.67 23.49 et al.
Foreign Lg Growth (Mstar) 5 1,169 757 12.00 101 84.85 15.16 6.70 11.70 36.80 19.20
ASSOCIATION OF UNITY CHURCHES 403(B) PLAN
Up vs. Down Market Performance As of December 31, 2009
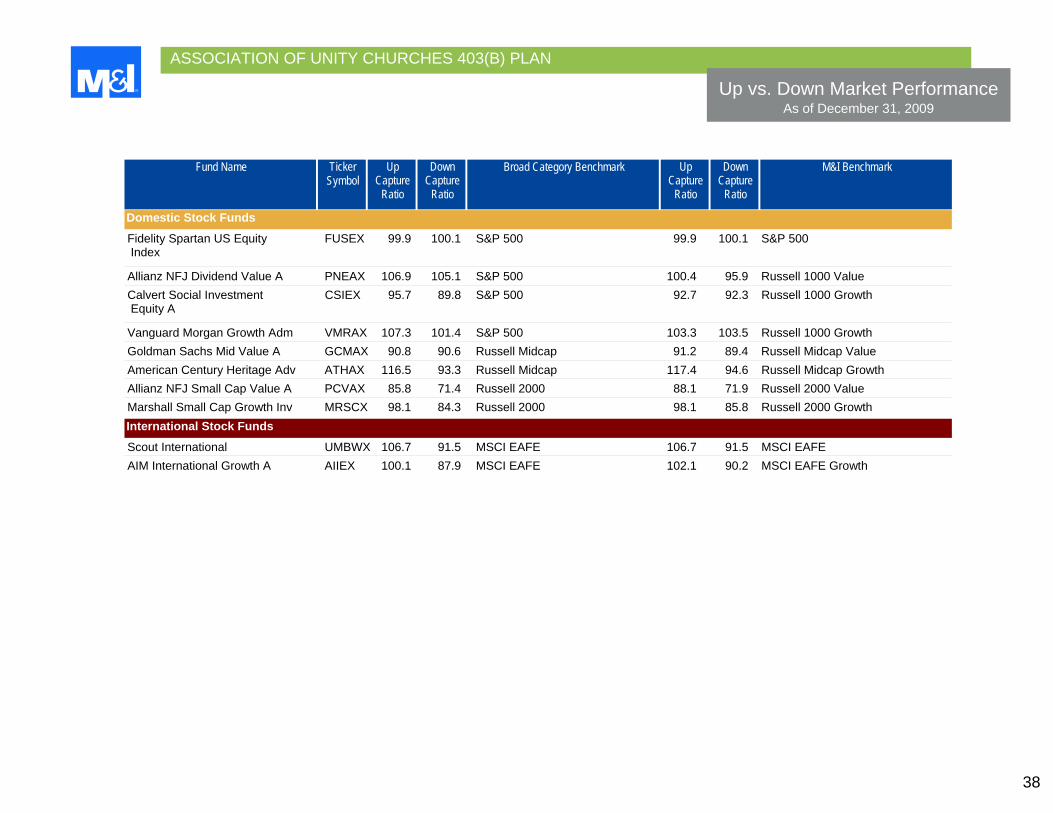
38
Fund Name Ticker Symbol
Up Capture
Ratio
Down Capture
Ratio
Broad Category Benchmark Up Capture
Ratio
Down Capture
Ratio
M&I Benchmark
Domestic Stock Funds
Fidelity Spartan US Equity FUSEX 99.9 100.1 S&P 500 99.9 100.1 S&P 500 Index
Allianz NFJ Dividend Value A PNEAX 106.9 105.1 S&P 500 100.4 95.9 Russell 1000 Value Calvert Social Investment CSIEX 95.7 89.8 S&P 500 92.7 92.3 Russell 1000 Growth Equity A
Vanguard Morgan Growth Adm VMRAX 107.3 101.4 S&P 500 103.3 103.5 Russell 1000 Growth Goldman Sachs Mid Value A GCMAX 90.8 90.6 Russell Midcap 91.2 89.4 Russell Midcap Value American Century Heritage Adv ATHAX 116.5 93.3 Russell Midcap 117.4 94.6 Russell Midcap Growth Allianz NFJ Small Cap Value A PCVAX 85.8 71.4 Russell 2000 88.1 71.9 Russell 2000 Value Marshall Small Cap Growth Inv MRSCX 98.1 84.3 Russell 2000 98.1 85.8 Russell 2000 Growth
International Stock Funds
Scout International UMBWX 106.7 91.5 MSCI EAFE 106.7 91.5 MSCI EAFE AIM International Growth A AIIEX 100.1 87.9 MSCI EAFE 102.1 90.2 MSCI EAFE Growth

Section V: Fees & Expenses4th Quarter, 2009
ASSOCIATION OF UNITY CHURCHES 403(B) PLAN
Fees & Expenses As of December 31, 2009
40
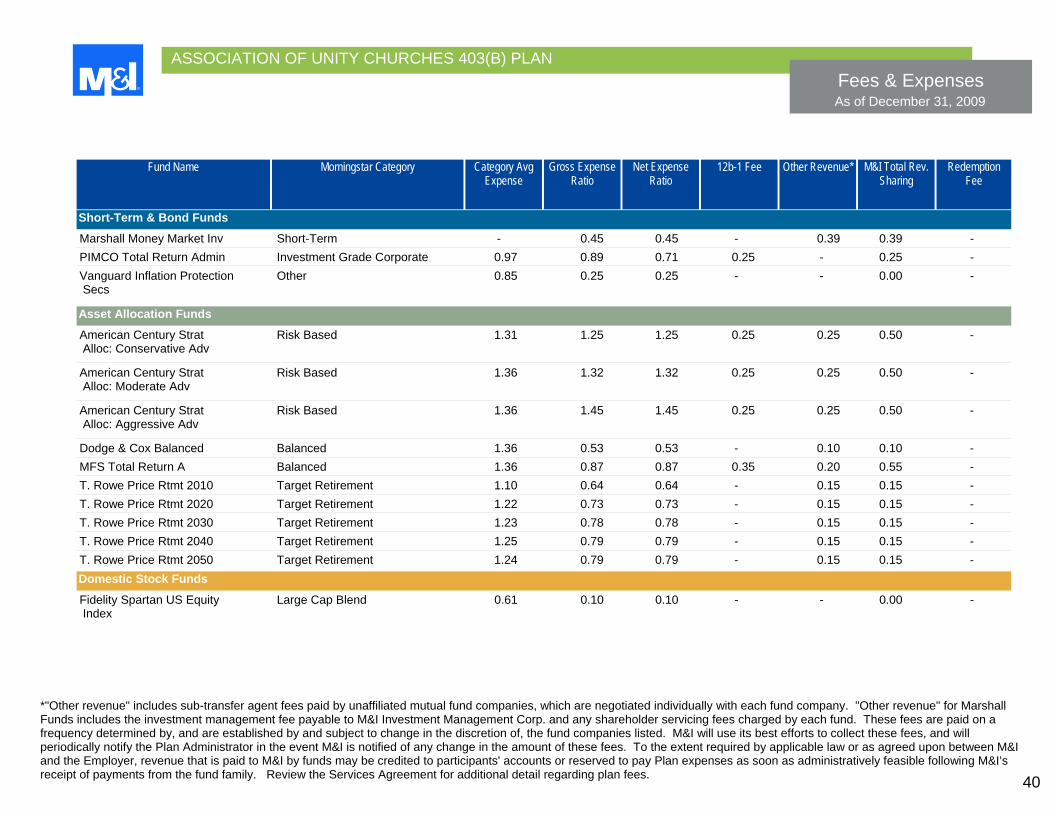
*"Other revenue" includes sub-transfer agent fees paid by unaffiliated mutual fund companies, which are negotiated individually with each fund company. "Other revenue" for Marshall Funds includes the investment management fee payable to M&I Investment Management Corp. and any shareholder servicing fees charged by each fund. These fees are paid on a frequency determined by, and are established by and subject to change in the discretion of, the fund companies listed. M&I will use its best efforts to collect these fees, and will periodically notify the Plan Administrator in the event M&I is notified of any change in the amount of these fees. To the extent required by applicable law or as agreed upon between M&I and the Employer, revenue that is paid to M&I by funds may be credited to participants' accounts or reserved to pay Plan expenses as soon as administratively feasible following M&I’s receipt of payments from the fund family. Review the Services Agreement for additional detail regarding plan fees.
Fund Name Morningstar Category Category Avg Expense
Gross Expense Ratio
Net Expense Ratio
12b-1 Fee Other Revenue* M&I Total Rev. Sharing
Redemption Fee
Short-Term & Bond Funds
Marshall Money Market Inv Short-Term - 0.45 0.45 - 0.39 0.39 - PIMCO Total Return Admin Investment Grade Corporate 0.97 0.89 0.71 0.25 - 0.25 - Vanguard Inflation Protection Other 0.85 0.25 0.25 - - 0.00 - Secs
Asset Allocation Funds
American Century Strat Risk Based 1.31 1.25 1.25 0.25 0.25 0.50 - Alloc: Conservative Adv
American Century Strat Risk Based 1.36 1.32 1.32 0.25 0.25 0.50 - Alloc: Moderate Adv
American Century Strat Risk Based 1.36 1.45 1.45 0.25 0.25 0.50 - Alloc: Aggressive Adv
Dodge & Cox Balanced Balanced 1.36 0.53 0.53 - 0.10 0.10 - MFS Total Return A Balanced 1.36 0.87 0.87 0.35 0.20 0.55 - T. Rowe Price Rtmt 2010 Target Retirement 1.10 0.64 0.64 - 0.15 0.15 - T. Rowe Price Rtmt 2020 Target Retirement 1.22 0.73 0.73 - 0.15 0.15 - T. Rowe Price Rtmt 2030 Target Retirement 1.23 0.78 0.78 - 0.15 0.15 - T. Rowe Price Rtmt 2040 Target Retirement 1.25 0.79 0.79 - 0.15 0.15 - T. Rowe Price Rtmt 2050 Target Retirement 1.24 0.79 0.79 - 0.15 0.15 -
Domestic Stock Funds
Fidelity Spartan US Equity Large Cap Blend 0.61 0.10 0.10 - - 0.00 - Index
ASSOCIATION OF UNITY CHURCHES 403(B) PLAN
Fees & Expenses As of December 31, 2009
41
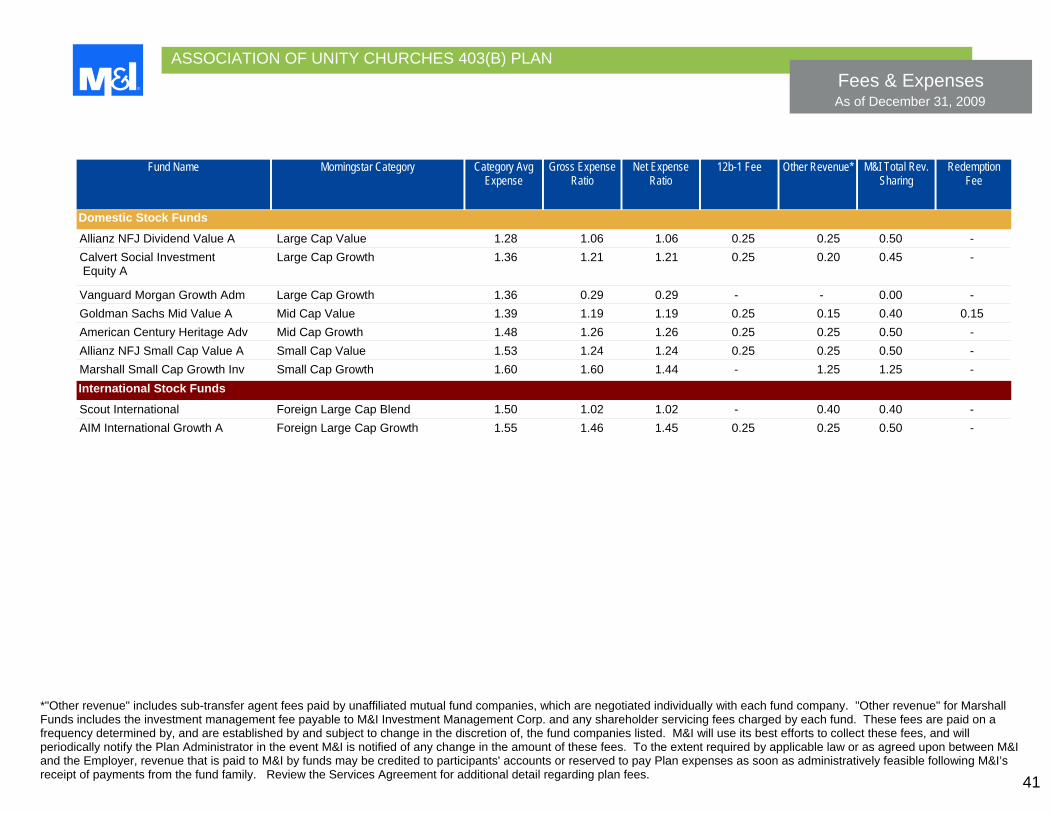
*"Other revenue" includes sub-transfer agent fees paid by unaffiliated mutual fund companies, which are negotiated individually with each fund company. "Other revenue" for Marshall Funds includes the investment management fee payable to M&I Investment Management Corp. and any shareholder servicing fees charged by each fund. These fees are paid on a frequency determined by, and are established by and subject to change in the discretion of, the fund companies listed. M&I will use its best efforts to collect these fees, and will periodically notify the Plan Administrator in the event M&I is notified of any change in the amount of these fees. To the extent required by applicable law or as agreed upon between M&I and the Employer, revenue that is paid to M&I by funds may be credited to participants' accounts or reserved to pay Plan expenses as soon as administratively feasible following M&I’s receipt of payments from the fund family. Review the Services Agreement for additional detail regarding plan fees.
Fund Name Morningstar Category Category Avg Expense
Gross Expense Ratio
Net Expense Ratio
12b-1 Fee Other Revenue* M&I Total Rev. Sharing
Redemption Fee
Domestic Stock Funds
Allianz NFJ Dividend Value A Large Cap Value 1.28 1.06 1.06 0.25 0.25 0.50 - Calvert Social Investment Large Cap Growth 1.36 1.21 1.21 0.25 0.20 0.45 - Equity A
Vanguard Morgan Growth Adm Large Cap Growth 1.36 0.29 0.29 - - 0.00 - Goldman Sachs Mid Value A Mid Cap Value 1.39 1.19 1.19 0.25 0.15 0.40 0.15 American Century Heritage Adv Mid Cap Growth 1.48 1.26 1.26 0.25 0.25 0.50 - Allianz NFJ Small Cap Value A Small Cap Value 1.53 1.24 1.24 0.25 0.25 0.50 - Marshall Small Cap Growth Inv Small Cap Growth 1.60 1.60 1.44 - 1.25 1.25 -
International Stock Funds
Scout International Foreign Large Cap Blend 1.50 1.02 1.02 - 0.40 0.40 - AIM International Growth A Foreign Large Cap Growth 1.55 1.46 1.45 0.25 0.25 0.50 -
Section VI: Proposed Investment Options4th Quarter, 2009
ASSOCIATION OF UNITY CHURCHES 403(B) PLAN
Performance Analysis As of December 31, 2009
43
Qtr Fund/Category/Benchmark MS %
Rank
Lipper%
Rank
MS%
Rank
Lipper%
Rank
1 Yr Ticker Symbol
MS%
Rank
Lipper%
Rank
3 Yr MS%
Rank
Lipper%
Rank
5 Yr MS%
Rank
Lipper%
Rank
10 Yr S.I.
Inception Date
Annualized Periods
Domestic Stock Funds
Mid Cap Blend
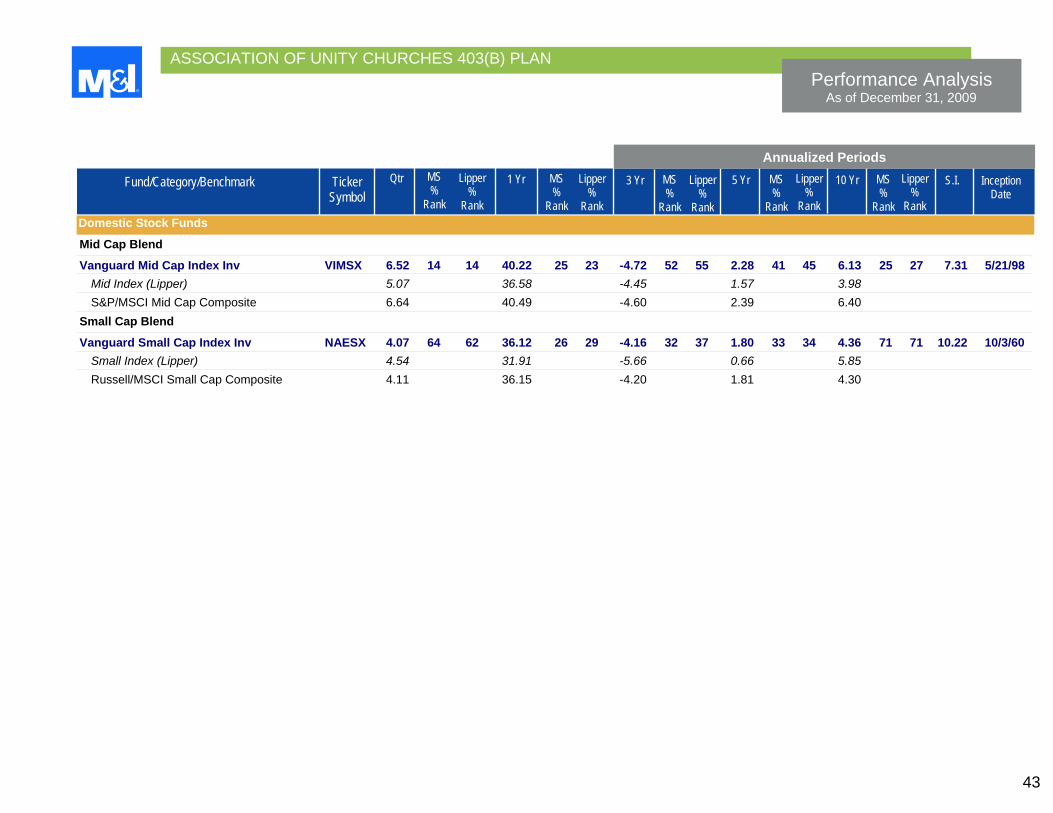
Vanguard Mid Cap Index Inv VIMSX 6.52 14 14 40.22 25 23 -4.72 52 55 2.28 41 45 6.13 25 27 7.31 5/21/98 Mid Index (Lipper) 5.07 36.58 -4.45 1.57 3.98 S&P/MSCI Mid Cap Composite 6.64 40.49 -4.60 2.39 6.40
Small Cap Blend
Vanguard Small Cap Index Inv NAESX 4.07 64 62 36.12 26 29 -4.16 32 37 1.80 33 34 4.36 71 71 10.22 10/3/60 Small Index (Lipper) 4.54 31.91 -5.66 0.66 5.85 Russell/MSCI Small Cap Composite 4.11 36.15 -4.20 1.81 4.30
ASSOCIATION OF UNITY CHURCHES 403(B) PLAN
Performance Analysis As of December 31, 2009
44
CurrentYTD
Fund/Category/Benchmark 2008 2006 2005 2007 Ticker Symbol
2003 2002 2004 2000 2001 1999
Calendar Year Returns
Domestic Stock Funds
Mid Cap Blend
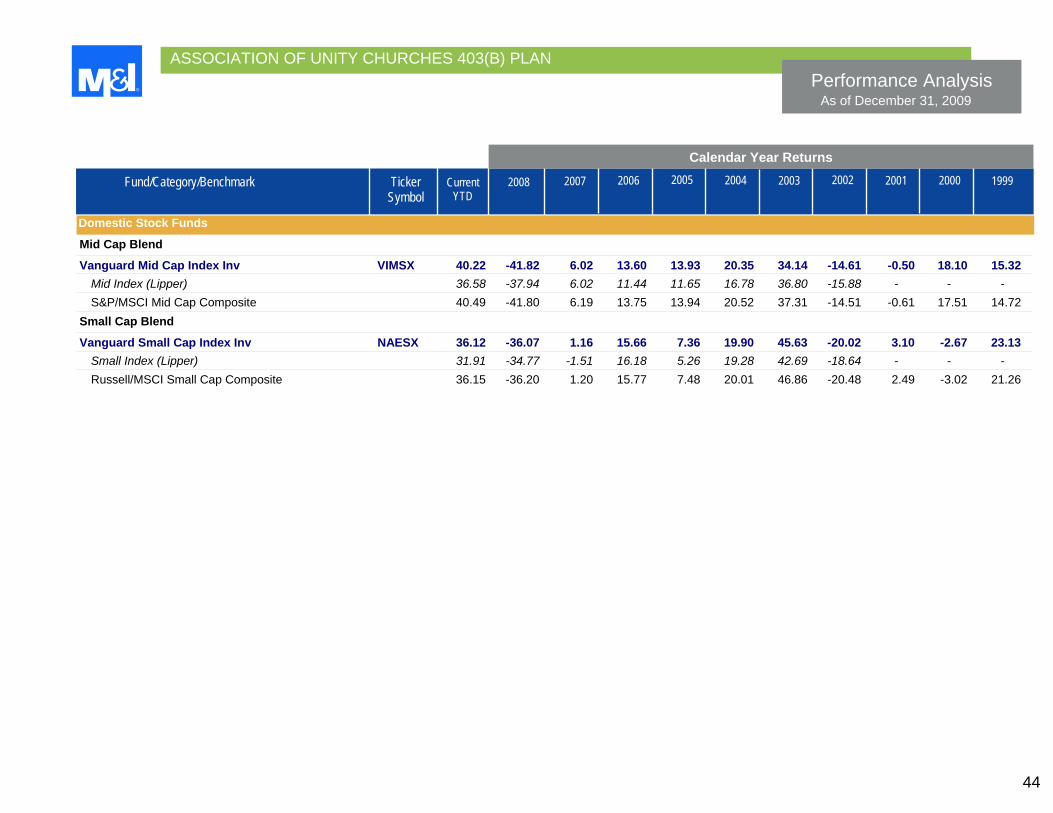
Vanguard Mid Cap Index Inv VIMSX 40.22 -41.82 6.02 13.60 13.93 20.35 34.14 -14.61 -0.50 18.10 15.32 Mid Index (Lipper) 36.58 -37.94 6.02 11.44 11.65 16.78 36.80 -15.88 - - - S&P/MSCI Mid Cap Composite 40.49 -41.80 6.19 13.75 13.94 20.52 37.31 -14.51 -0.61 17.51 14.72
Small Cap Blend
Vanguard Small Cap Index Inv NAESX 36.12 -36.07 1.16 15.66 7.36 19.90 45.63 -20.02 3.10 -2.67 23.13 Small Index (Lipper) 31.91 -34.77 -1.51 16.18 5.26 19.28 42.69 -18.64 - - - Russell/MSCI Small Cap Composite 36.15 -36.20 1.20 15.77 7.48 20.01 46.86 -20.48 2.49 -3.02 21.26

ASSOCIATION OF UNITY CHURCHES 403(B) PLAN
45
Risk/Reward Analysis As of December 31, 2009
Sharpe Ratio 3-Year Data vs. Benchmark Standard Deviation Fund/Category/Benchmark Ticker 3-Year 5-Year Beta Alpha R-2 Batting Info 3-Year 5-Year Symbol Average Ratio
Domestic Stock Funds
Mid Cap Blend
Vanguard Mid Cap Index Inv VIMSX 24.24 19.87 1.00 1.47 99.99 100.00 5.96 -0.16 0.08 Mid Index (Lipper) - - - - - - S&P/MSCI Mid Cap Composite 24.25 19.87 -0.28 -0.02
Small Cap Blend
Vanguard Small Cap Index Inv NAESX 26.16 21.70 1.00 1.50 99.99 100.00 6.83 -0.11 0.06 Small Index (Lipper) - - - - - - Russell/MSCI Small Cap 26.16 21.69 -0.25 -0.05 Composite
ASSOCIATION OF UNITY CHURCHES 403(B) PLAN
Fund Characteristics As of December 31, 2009
46
General Characteristics Stock Fund Characteristics
Fund/Category Ticker Symbol
Manager Name Manager Tenure
Net Assets ($MM)
Total # Holdings
% in Top 10
Holdings
Turnover Med Mkt Cap $MM
% Info Econ
% Energy % Fin Svcs
P/E Ratio P/B Ratio
Domestic Stock Funds
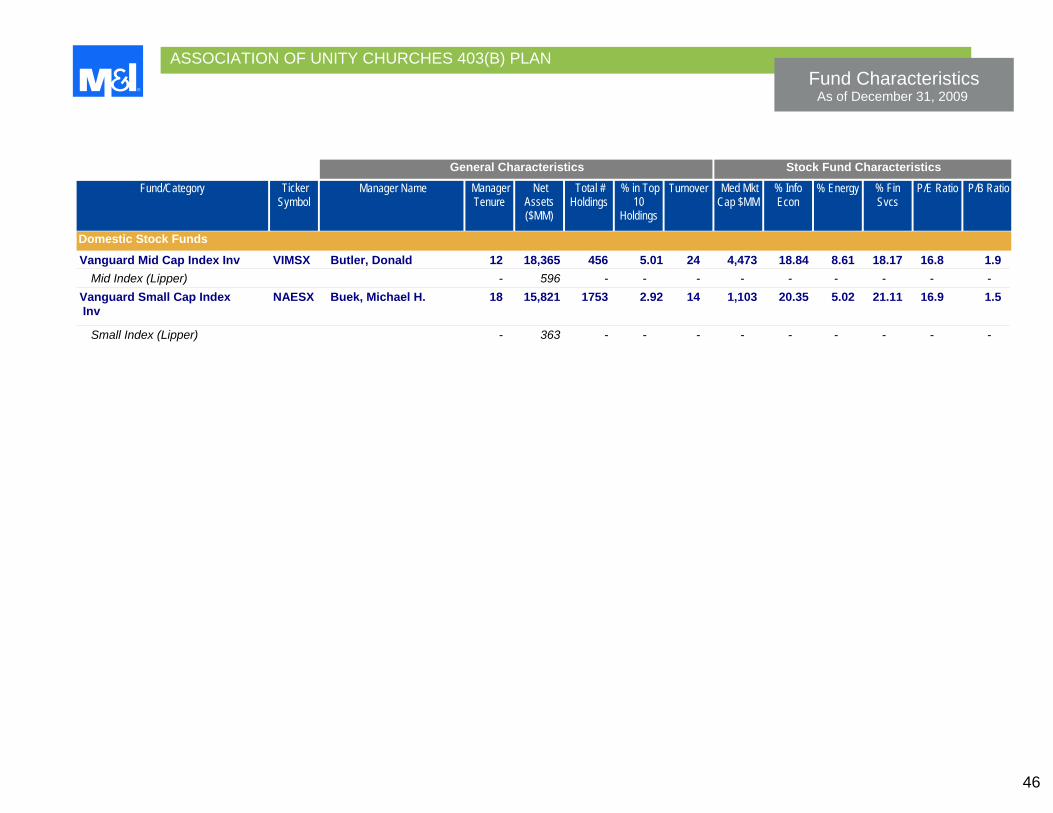
Vanguard Mid Cap Index Inv VIMSX Butler, Donald 12 18,365 456 5.01 24 4,473 18.84 8.61 18.17 16.8 1.9 Mid Index (Lipper) - 596 - - - - - - - - - Vanguard Small Cap Index NAESX Buek, Michael H. 18 15,821 1753 2.92 14 1,103 20.35 5.02 21.11 16.9 1.5 Inv
Small Index (Lipper) - 363 - - - - - - - - -
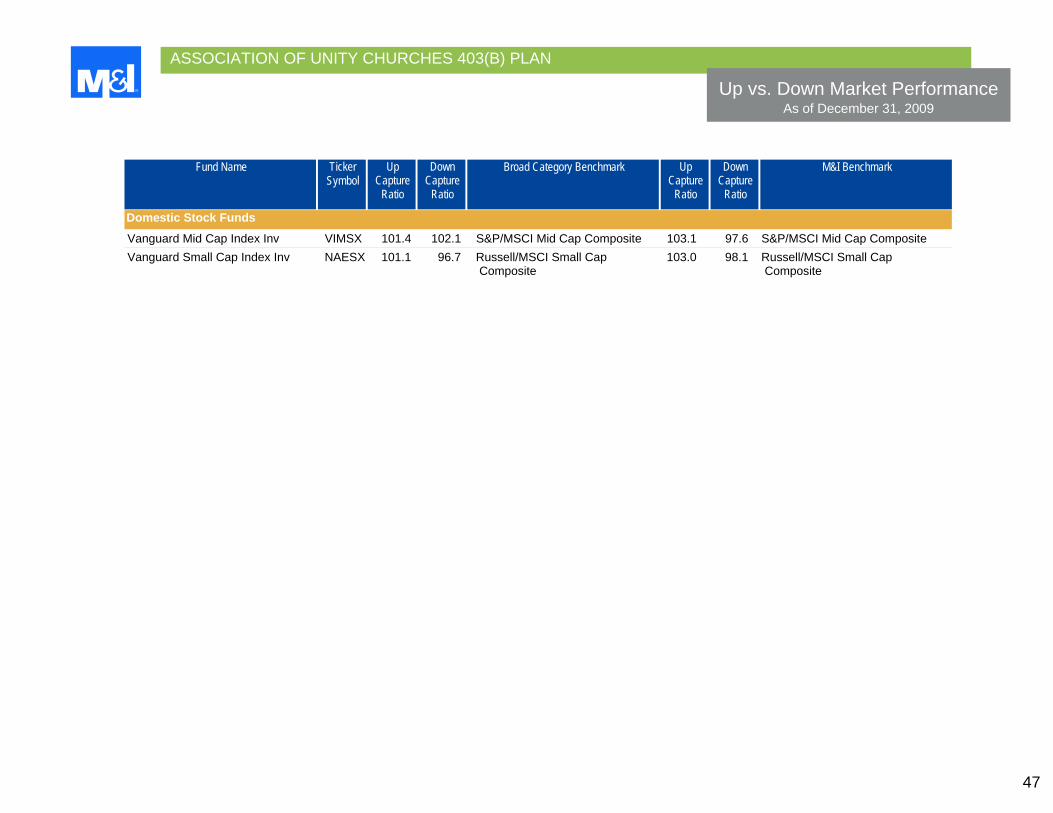
ASSOCIATION OF UNITY CHURCHES 403(B) PLAN
Up vs. Down Market Performance As of December 31, 2009
47
Fund Name Ticker Symbol
Up Capture
Ratio
Down Capture
Ratio
Broad Category Benchmark Up Capture
Ratio
Down Capture
Ratio
M&I Benchmark
Domestic Stock Funds
Vanguard Mid Cap Index Inv VIMSX 101.4 102.1 S&P/MSCI Mid Cap Composite 103.1 97.6 S&P/MSCI Mid Cap Composite Vanguard Small Cap Index Inv NAESX 101.1 96.7 Russell/MSCI Small Cap 103.0 98.1 Russell/MSCI Small Cap Composite Composite

ASSOCIATION OF UNITY CHURCHES 403(B) PLAN
Fees & Expenses As of December 31, 2009
48
*"Other revenue" includes sub-transfer agent fees paid by unaffiliated mutual fund companies, which are negotiated individually with each fund company. "Other revenue" for Marshall Funds includes the investment management fee payable to M&I Investment Management Corp. and any shareholder servicing fees charged by each fund. These fees are paid on a frequency determined by, and are established by and subject to change in the discretion of, the fund companies listed. M&I will use its best efforts to collect these fees, and will periodically notify the Plan Administrator in the event M&I is notified of any change in the amount of these fees. To the extent required by applicable law or as agreed upon between M&I and the Employer, revenue that is paid to M&I by funds may be credited to participants' accounts or reserved to pay Plan expenses as soon as administratively feasible following M&I’s receipt of payments from the fund family. Review the Services Agreement for additional detail regarding plan fees.
Fund Name Morningstar Category Category Avg Expense
Gross Expense Ratio
Net Expense Ratio
12b-1 Fee Other Revenue* M&I Total Rev. Sharing
Redemption Fee
Domestic Stock Funds
Vanguard Mid Cap Index Inv Mid Cap Blend 1.32 0.27 0.27 - - 0.00 - Vanguard Small Cap Index Inv Small Cap Blend 1.50 0.28 0.28 - - 0.00 -
Section VII: Market Commentary4th Quarter, 2009
ASSOCIATION OF UNITY CHURCHES 403(B) PLAN Market Review
50
Source: Bloomberg
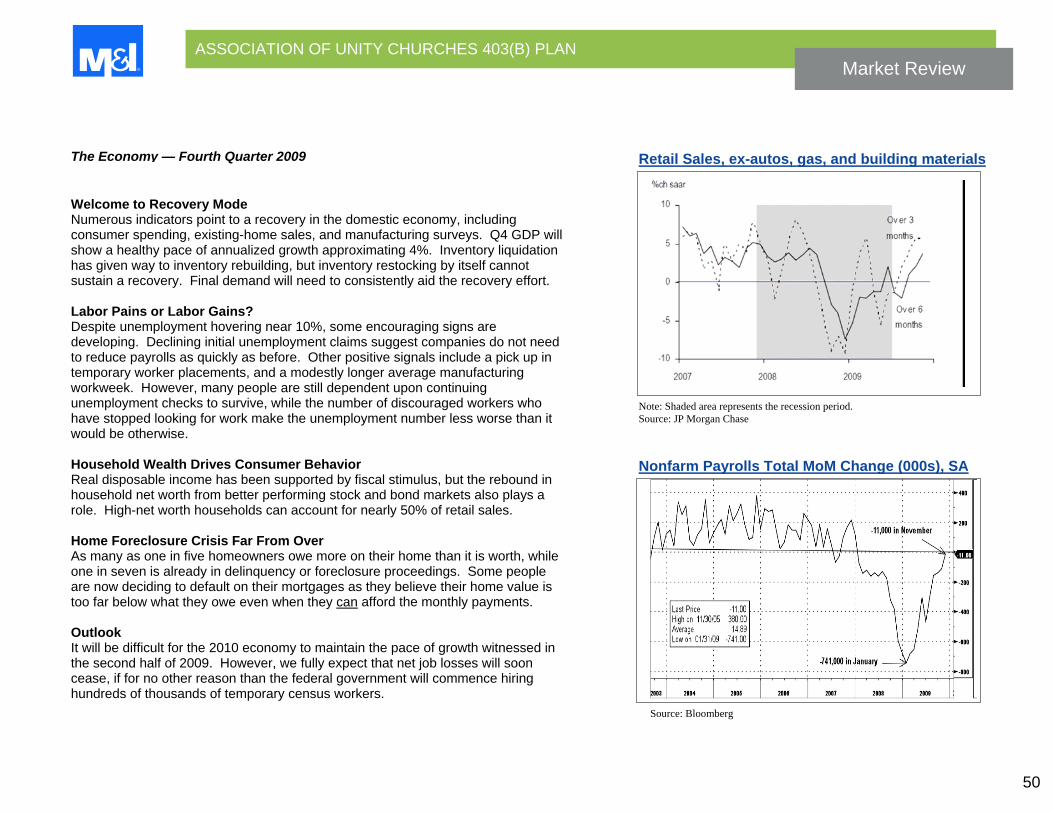
Retail Sales, ex-autos, gas, and building materials
Note: Shaded area represents the recession period. Source: JP Morgan Chase
Nonfarm Payrolls Total MoM Change (000s), SA
The Economy — Fourth Quarter 2009
Welcome to Recovery Mode Numerous indicators point to a recovery in the domestic economy, including consumer spending, existing-home sales, and manufacturing surveys. Q4 GDP will show a healthy pace of annualized growth approximating 4%. Inventory liquidation has given way to inventory rebuilding, but inventory restocking by itself cannot sustain a recovery. Final demand will need to consistently aid the recovery effort. Labor Pains or Labor Gains? Despite unemployment hovering near 10%, some encouraging signs are developing. Declining initial unemployment claims suggest companies do not need to reduce payrolls as quickly as before. Other positive signals include a pick up in temporary worker placements, and a modestly longer average manufacturing workweek. However, many people are still dependent upon continuing unemployment checks to survive, while the number of discouraged workers who have stopped looking for work make the unemployment number less worse than it would be otherwise. Household Wealth Drives Consumer Behavior Real disposable income has been supported by fiscal stimulus, but the rebound in household net worth from better performing stock and bond markets also plays a role. High-net worth households can account for nearly 50% of retail sales. Home Foreclosure Crisis Far From Over As many as one in five homeowners owe more on their home than it is worth, while one in seven is already in delinquency or foreclosure proceedings. Some people are now deciding to default on their mortgages as they believe their home value is too far below what they owe even when they can afford the monthly payments. Outlook It will be difficult for the 2010 economy to maintain the pace of growth witnessed in the second half of 2009. However, we fully expect that net job losses will soon cease, if for no other reason than the federal government will commence hiring hundreds of thousands of temporary census workers.
ASSOCIATION OF UNITY CHURCHES 403(B) PLAN Market Review
51
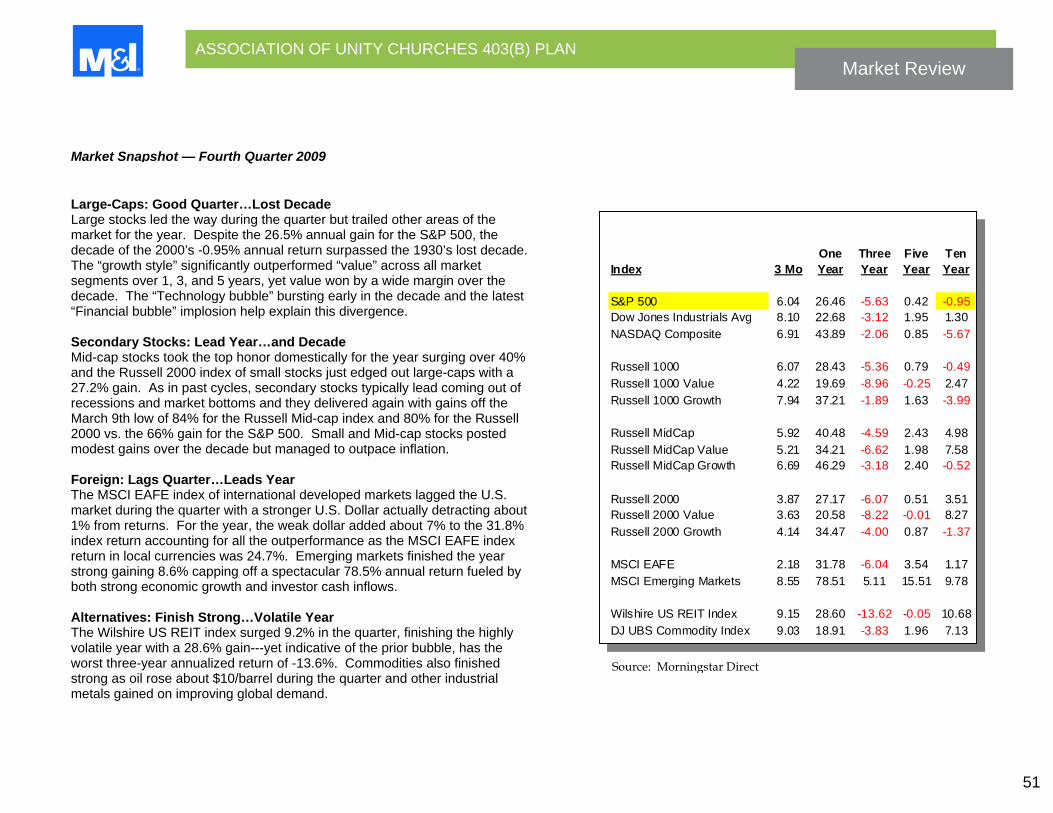
Source: Morningstar Direct
Index 3 MoOne Year
Three Year
Five Year
Ten Year
S&P 500 6.04 26.46 -5.63 0.42 -0.95Dow Jones Industrials Avg 8.10 22.68 -3.12 1.95 1.30NASDAQ Composite 6.91 43.89 -2.06 0.85 -5.67
Russell 1000 6.07 28.43 -5.36 0.79 -0.49Russell 1000 Value 4.22 19.69 -8.96 -0.25 2.47Russell 1000 Growth 7.94 37.21 -1.89 1.63 -3.99
Russell MidCap 5.92 40.48 -4.59 2.43 4.98Russell MidCap Value 5.21 34.21 -6.62 1.98 7.58Russell MidCap Growth 6.69 46.29 -3.18 2.40 -0.52
Russell 2000 3.87 27.17 -6.07 0.51 3.51Russell 2000 Value 3.63 20.58 -8.22 -0.01 8.27Russell 2000 Growth 4.14 34.47 -4.00 0.87 -1.37
MSCI EAFE 2.18 31.78 -6.04 3.54 1.17MSCI Emerging Markets 8.55 78.51 5.11 15.51 9.78
Wilshire US REIT Index 9.15 28.60 -13.62 -0.05 10.68DJ UBS Commodity Index 9.03 18.91 -3.83 1.96 7.13
Market Snapshot — Fourth Quarter 2009
Large-Caps: Good Quarter…Lost Decade Large stocks led the way during the quarter but trailed other areas of the market for the year. Despite the 26.5% annual gain for the S&P 500, the decade of the 2000’s -0.95% annual return surpassed the 1930’s lost decade. The “growth style” significantly outperformed “value” across all market segments over 1, 3, and 5 years, yet value won by a wide margin over the decade. The “Technology bubble” bursting early in the decade and the latest “Financial bubble” implosion help explain this divergence. Secondary Stocks: Lead Year…and Decade Mid-cap stocks took the top honor domestically for the year surging over 40% and the Russell 2000 index of small stocks just edged out large-caps with a 27.2% gain. As in past cycles, secondary stocks typically lead coming out of recessions and market bottoms and they delivered again with gains off the March 9th low of 84% for the Russell Mid-cap index and 80% for the Russell 2000 vs. the 66% gain for the S&P 500. Small and Mid-cap stocks posted modest gains over the decade but managed to outpace inflation. Foreign: Lags Quarter…Leads Year The MSCI EAFE index of international developed markets lagged the U.S. market during the quarter with a stronger U.S. Dollar actually detracting about 1% from returns. For the year, the weak dollar added about 7% to the 31.8% index return accounting for all the outperformance as the MSCI EAFE index return in local currencies was 24.7%. Emerging markets finished the year strong gaining 8.6% capping off a spectacular 78.5% annual return fueled by both strong economic growth and investor cash inflows. Alternatives: Finish Strong…Volatile Year The Wilshire US REIT index surged 9.2% in the quarter, finishing the highly volatile year with a 28.6% gain---yet indicative of the prior bubble, has the worst three-year annualized return of -13.6%. Commodities also finished strong as oil rose about $10/barrel during the quarter and other industrial metals gained on improving global demand.
ASSOCIATION OF UNITY CHURCHES 403(B) PLAN Market Review
52
Bond Market Performance
Source: Barclays
Index 1Mo 3Mo YTD 1Yr
Barclays Aggregate -1.56 0.20 5.93 5.93
Barclays Government -2.27 -1.00 -2.20 -2.20
Barclays Credit -1.00 1.03 16.04 16.04
Barclays Mortgage -1.41 0.57 5.89 5.89
Barclays High Yield Index 3.28 6.19 58.20 58.20
Barclays 1 - 10 Yr Muni -0.14 -0.09 7.18 7.18
Yield Curve Performance
Source: Barclays
Rate QuarterlyU.S. Treasury 09/30/09 12/31/09 Change Return
3 Month 0.11 0.05 -0.06 0.04
6 Month 0.17 0.18 0.01 0.072 Year 0.94 1.13 0.19 0.16
3 Year 1.42 1.67 0.25 0.06
5 Year 2.31 2.68 0.37 -0.6410 Year 3.30 3.83 0.53 -3.60
30 Year 4.05 4.63 0.58 -8.46
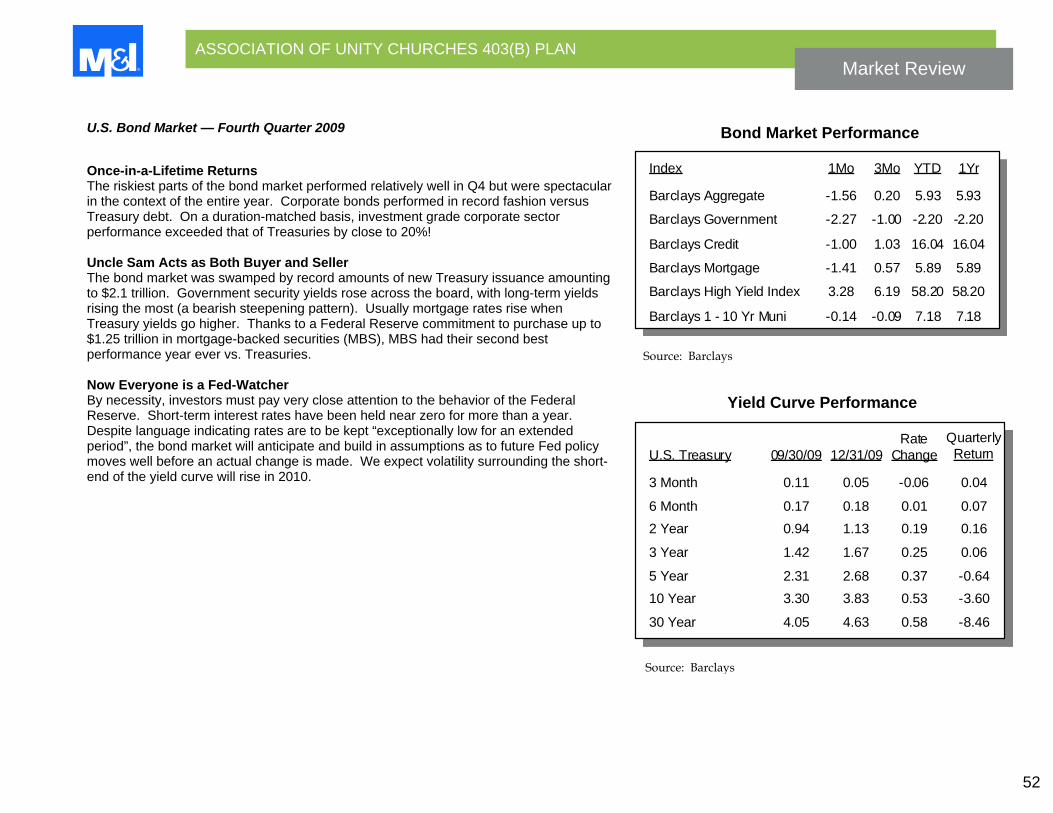
U.S. Bond Market — Fourth Quarter 2009
Once-in-a-Lifetime Returns The riskiest parts of the bond market performed relatively well in Q4 but were spectacular in the context of the entire year. Corporate bonds performed in record fashion versus Treasury debt. On a duration-matched basis, investment grade corporate sector performance exceeded that of Treasuries by close to 20%! Uncle Sam Acts as Both Buyer and Seller The bond market was swamped by record amounts of new Treasury issuance amounting to $2.1 trillion. Government security yields rose across the board, with long-term yields rising the most (a bearish steepening pattern). Usually mortgage rates rise when Treasury yields go higher. Thanks to a Federal Reserve commitment to purchase up to $1.25 trillion in mortgage-backed securities (MBS), MBS had their second best performance year ever vs. Treasuries. Now Everyone is a Fed-Watcher By necessity, investors must pay very close attention to the behavior of the Federal Reserve. Short-term interest rates have been held near zero for more than a year. Despite language indicating rates are to be kept “exceptionally low for an extended period”, the bond market will anticipate and build in assumptions as to future Fed policy moves well before an actual change is made. We expect volatility surrounding the short-end of the yield curve will rise in 2010.
ASSOCIATION OF UNITY CHURCHES 403(B) PLAN Market Review
53
Source: Baseline
Source: Baseline
S&P 500 Operating Earnings Thomson Baseline Survey of Analysts’ Estimates
2008 2009 2010Actual Estimates Estimates
Results as of 12/31/09
Q1 - -17% -31% 31% E
Q2 - -21% -13% 11% E
Q3 - -17% -5% 16% E
Q4 - -28% 36% E 22% E
-20% -15% E 27% E
E = Estimates
Yr to Yr -
S&P 500 Sector Performance Index 3 Mo YTD 1 Year Weight
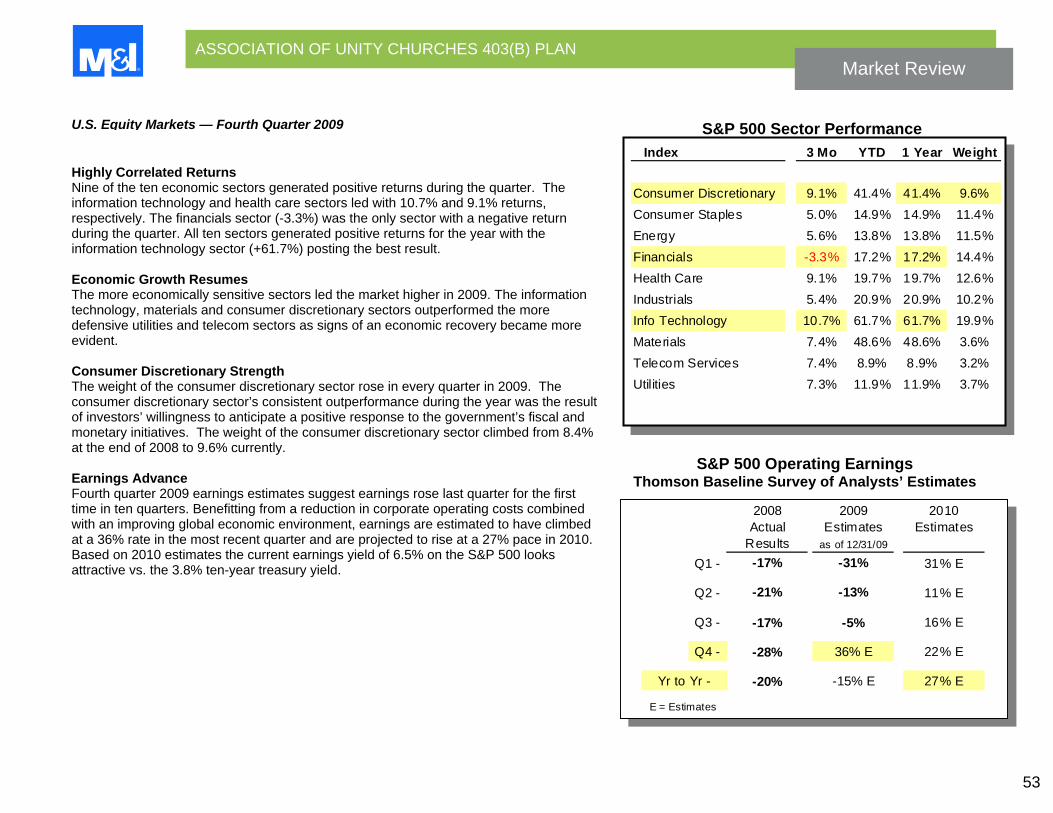
Consumer Discretionary 9.1% 41.4% 41.4% 9.6%Consumer Staples 5.0% 14.9% 14.9% 11.4%Energy 5.6% 13.8% 13.8% 11.5%Financials -3.3% 17.2% 17.2% 14.4%Health Care 9.1% 19.7% 19.7% 12.6%Industrials 5.4% 20.9% 20.9% 10.2%Info Technology 10.7% 61.7% 61.7% 19.9%Materials 7.4% 48.6% 48.6% 3.6%Telecom Services 7.4% 8.9% 8.9% 3.2%Utilities 7.3% 11.9% 11.9% 3.7%
U.S. Equity Markets — Fourth Quarter 2009
Highly Correlated Returns Nine of the ten economic sectors generated positive returns during the quarter. The information technology and health care sectors led with 10.7% and 9.1% returns, respectively. The financials sector (-3.3%) was the only sector with a negative return during the quarter. All ten sectors generated positive returns for the year with the information technology sector (+61.7%) posting the best result. Economic Growth Resumes The more economically sensitive sectors led the market higher in 2009. The information technology, materials and consumer discretionary sectors outperformed the more defensive utilities and telecom sectors as signs of an economic recovery became more evident. Consumer Discretionary Strength The weight of the consumer discretionary sector rose in every quarter in 2009. The consumer discretionary sector’s consistent outperformance during the year was the result of investors’ willingness to anticipate a positive response to the government’s fiscal and monetary initiatives. The weight of the consumer discretionary sector climbed from 8.4% at the end of 2008 to 9.6% currently. Earnings Advance Fourth quarter 2009 earnings estimates suggest earnings rose last quarter for the first time in ten quarters. Benefitting from a reduction in corporate operating costs combined with an improving global economic environment, earnings are estimated to have climbed at a 36% rate in the most recent quarter and are projected to rise at a 27% pace in 2010. Based on 2010 estimates the current earnings yield of 6.5% on the S&P 500 looks attractive vs. the 3.8% ten-year treasury yield.
ASSOCIATION OF UNITY CHURCHES 403(B) PLAN Market Review
54
13.21%
8.09%6.85%
5.44%
2.90%1.50% 1.45%
-0.50%-2.63%
-4.49%
-10.0%
-5.0%
0.0%
5.0%
10.0%
15.0%
Materials ConsStaples
Energy HealthCare
Cons.Disc.
Tech Industrials Utilities Info Tech Financials
Source: Trilogy Advisors
MSCI EAFE Regional Performance Best to Worst
8.55%
6.96%
5.16% 5.00%
1.56%
-2.76%
-5.0%
0.0%
5.0%
10.0%
Emerg. Mkts UK Pacific (ex. Japan) Canada Europe (ex. UK) Japan
Source: Trilogy Advisors
MSCI EAFE Sector Performance Best to Worst
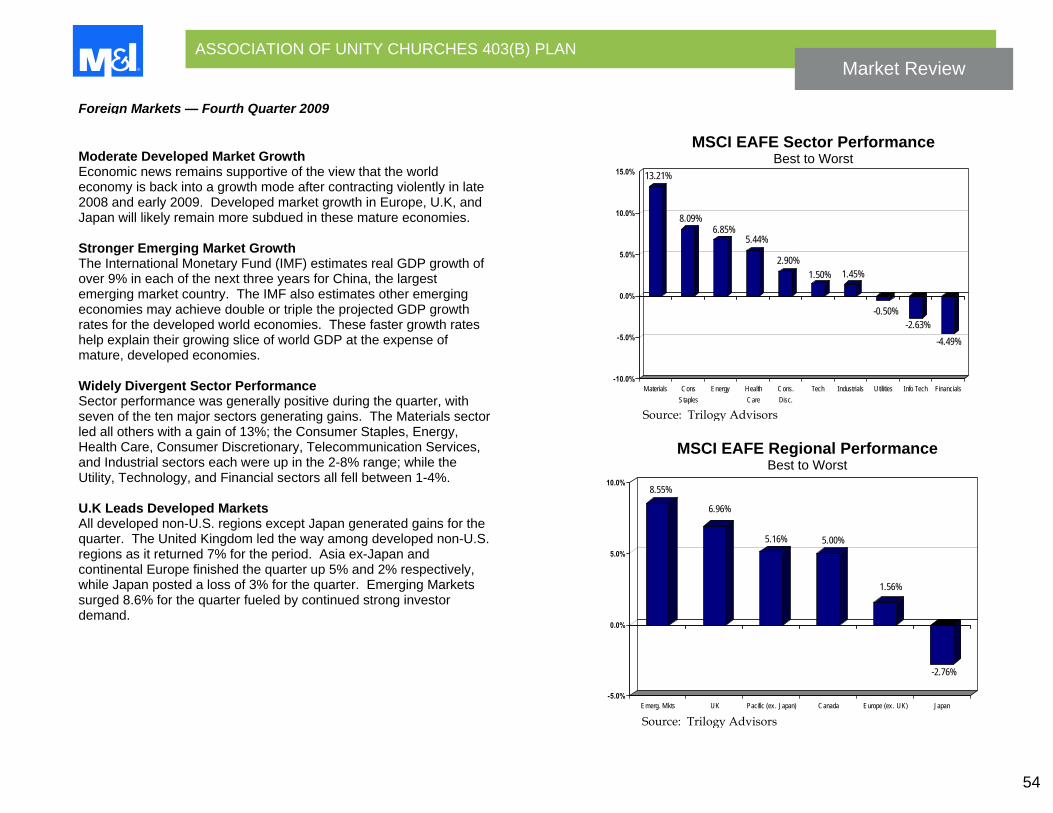
Foreign Markets — Fourth Quarter 2009
Moderate Developed Market Growth Economic news remains supportive of the view that the world economy is back into a growth mode after contracting violently in late 2008 and early 2009. Developed market growth in Europe, U.K, and Japan will likely remain more subdued in these mature economies. Stronger Emerging Market Growth The International Monetary Fund (IMF) estimates real GDP growth of over 9% in each of the next three years for China, the largest emerging market country. The IMF also estimates other emerging economies may achieve double or triple the projected GDP growth rates for the developed world economies. These faster growth rates help explain their growing slice of world GDP at the expense of mature, developed economies. Widely Divergent Sector Performance Sector performance was generally positive during the quarter, with seven of the ten major sectors generating gains. The Materials sector led all others with a gain of 13%; the Consumer Staples, Energy, Health Care, Consumer Discretionary, Telecommunication Services, and Industrial sectors each were up in the 2-8% range; while the Utility, Technology, and Financial sectors all fell between 1-4%. U.K Leads Developed Markets All developed non-U.S. regions except Japan generated gains for the quarter. The United Kingdom led the way among developed non-U.S. regions as it returned 7% for the period. Asia ex-Japan and continental Europe finished the quarter up 5% and 2% respectively, while Japan posted a loss of 3% for the quarter. Emerging Markets surged 8.6% for the quarter fueled by continued strong investor demand.
ASSOCIATION OF UNITY CHURCHES 403(B) PLAN Market Review
55
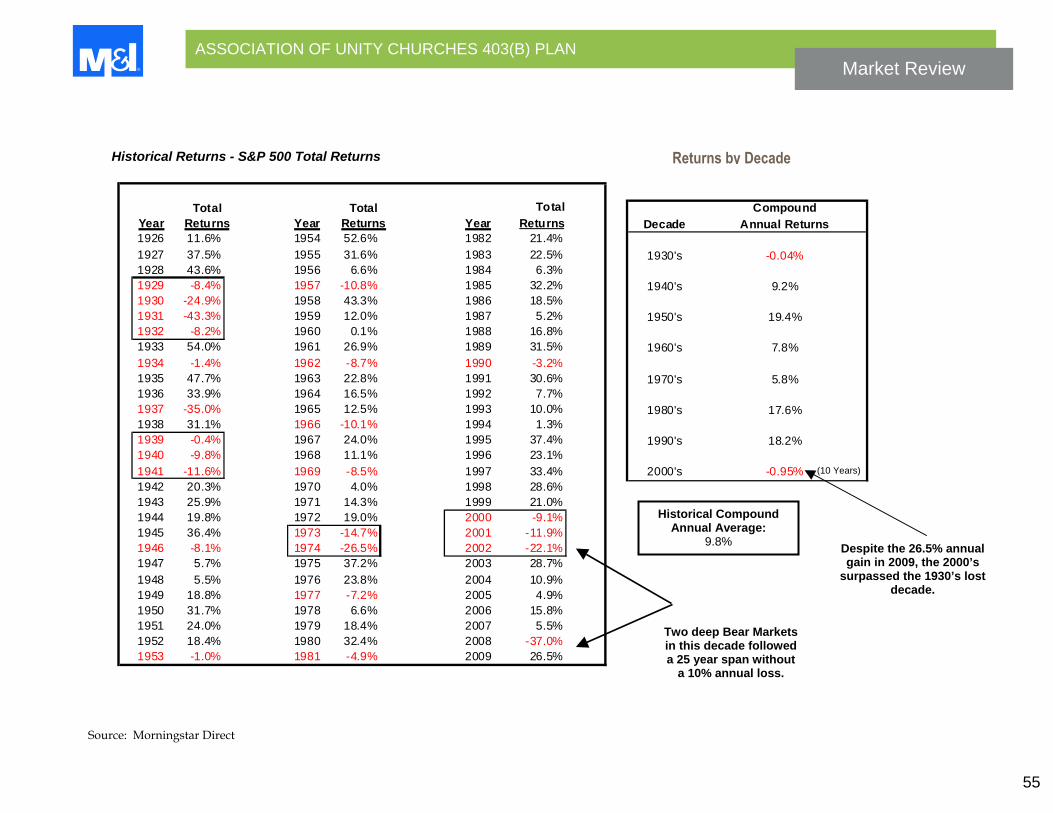
Historical Returns - S&P 500 Total Returns
Two deep Bear Markets in this decade followed a 25 year span without
a 10% annual loss.
Returns by Decade
Despite the 26.5% annual gain in 2009, the 2000’s
surpassed the 1930’s lost decade.
Historical CompoundAnnual Average:
9.8%
(10 Years)
Source: Morningstar Direct
Year Year YearTotal
Returns1926 11.6% 1954 52.6% 1982 21.4%1927 37.5% 1955 31.6% 1983 22.5%1928 43.6% 1956 6.6% 1984 6.3%1929 -8.4% 1957 -10.8% 1985 32.2%1930 -24.9% 1958 43.3% 1986 18.5%1931 -43.3% 1959 12.0% 1987 5.2%1932 -8.2% 1960 0.1% 1988 16.8%1933 54.0% 1961 26.9% 1989 31.5%1934 -1.4% 1962 -8.7% 1990 -3.2%1935 47.7% 1963 22.8% 1991 30.6%1936 33.9% 1964 16.5% 1992 7.7%1937 -35.0% 1965 12.5% 1993 10.0%1938 31.1% 1966 -10.1% 1994 1.3%1939 -0.4% 1967 24.0% 1995 37.4%1940 -9.8% 1968 11.1% 1996 23.1%1941 -11.6% 1969 -8.5% 1997 33.4%1942 20.3% 1970 4.0% 1998 28.6%1943 25.9% 1971 14.3% 1999 21.0%1944 19.8% 1972 19.0% 2000 -9.1%1945 36.4% 1973 -14.7% 2001 -11.9%1946 -8.1% 1974 -26.5% 2002 -22.1%1947 5.7% 1975 37.2% 2003 28.7%1948 5.5% 1976 23.8% 2004 10.9%1949 18.8% 1977 -7.2% 2005 4.9%1950 31.7% 1978 6.6% 2006 15.8%1951 24.0% 1979 18.4% 2007 5.5%1952 18.4% 1980 32.4% 2008 -37.0%1953 -1.0% 1981 -4.9% 2009 26.5%
Total Returns
Total Returns Decade
Compound Annual Returns
1930's -0.04%
1940's 9.2%
1950's 19.4%
1960's 7.8%
1970's 5.8%
1980's 17.6%
1990's 18.2%
2000's -0.95%
ASSOCIATION OF UNITY CHURCHES 403(B) PLAN Market Review
56
ASSOCIATION OF UNITY CHURCHES 403(B) PLAN Market Review
57
10 YearAnnual
Compound Return
10 YearAnnual
Compound Return
TotalReturn
Q1 1999 to Q1 2009 -4.54 WORST Q1 2009 to Q1 2019 ?? ??Q2 1929 to Q2 1939 -3.65 Q2 1939 to Q2 1949 8.62 128.54Q1 1929 to Q1 1939 -2.79 Q1 1939 to Q1 1949 9.12 139.36Q3 1929 to Q3 1939 -2.74 Q3 1939 to Q3 1949 7.74 110.79Q1 1928 to Q1 1938 -2.54 Q1 1938 to Q1 1948 11.76 203.87Q1 1930 to Q1 1940 -1.42 Q1 1940 to Q1 1950 9.65 151.31Q2 1930 to Q2 1940 -1.42 Q2 1940 to Q2 1950 12.19 215.88Q4 1928 to Q4 1938 -0.65 Q4 1938 to Q4 1948 7.21 100.63 WORSTQ3 1928 to Q3 1938 -0.10 Q3 1938 to Q3 1948 8.12 118.31Q3 1930 to Q3 1940 0.18 Q3 1940 to Q3 1950 12.57 226.85Q4 1927 to Q4 1937 0.20 Q4 1937 to Q4 1947 9.61 150.39Q4 1929 to Q4 1939 0.23 Q4 1939 to Q4 1949 9.09 138.67Q2 1928 to Q2 1938 0.44 Q2 1938 to Q2 1948 9.52 148.39Q3 1964 to Q3 1974 0.49 Q3 1974 to Q3 1984 15.58 325.30 BESTQ1 1931 to Q1 1941 0.71 Q1 1941 to Q1 1951 14.47 286.14Q4 1964 to Q4 1974 1.27 Q4 1974 to Q4 1984 14.76 296.23
Average 10.67 182.71
Past Ten Years Next Ten Years
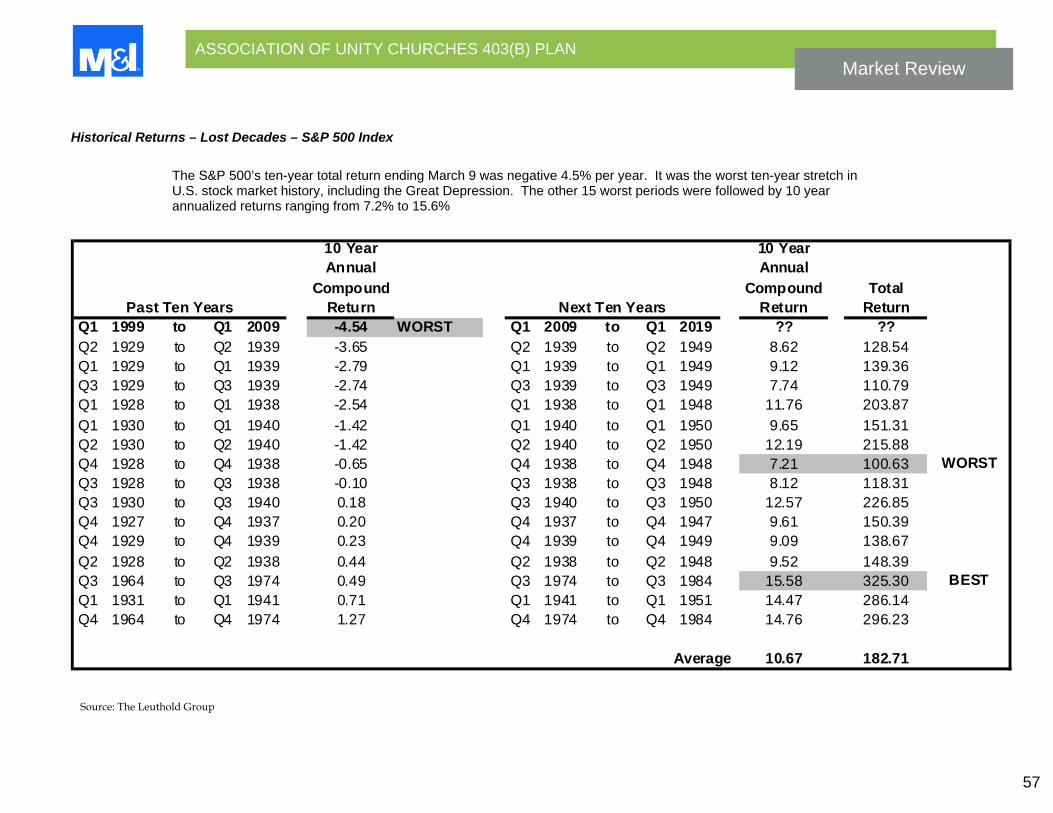
Historical Returns – Lost Decades – S&P 500 Index
The S&P 500’s ten-year total return ending March 9 was negative 4.5% per year. It was the worst ten-year stretch in U.S. stock market history, including the Great Depression. The other 15 worst periods were followed by 10 year annualized returns ranging from 7.2% to 15.6%
Source: The Leuthold Group
ASSOCIATION OF UNITY CHURCHES 403(B) PLAN Market Review
58
Disclosure
This is not intended to serve as a complete analysis of every material fact regarding any company, industry or security. The opinions expressed here reflect our judgment at this date and are subject to change. Information has been obtained from sources we consider to be reliable, but we cannot guarantee the accuracy. This publication is prepared for general information only. This material does not constitute investment advice and is not intended as an endorsement of any specific investment. It does not have regard to the specific investment objectives, financial situation and the particular needs of any specific person who may receive this report. Investors should seek advice regarding the appropriateness of investing in any securities or investment strategies discussed or recommended in this report and should understand that statements regarding future prospects may not be realized. Investment involves risk. Market conditions and trends will fluctuate. The value of an investment as well as income associated with investments may rise or fall. Accordingly, investors may receive back less than originally invested. Investments can not be made in an index. Past performance is not necessarily a guide to future performance. Investment products are: Not FDIC Insured | No Bank Guarantee | May Lose Value © 2010 Marshall & Ilsley Corporation

Section VIII: Definitions 4th Quarter, 2009
ASSOCIATION OF UNITY CHURCHES 403(B) PLAN
Definitions
60
12b-1 An extra fee charged by some mutual funds to cover promotion, distributions, marketing expenses, and sometimes commissions to brokers. 12b-1 fee information is disclosed in a fund’s prospectus, is included in the stated expense ratio, and is usually less than 1%. Alpha Alpha is a risk (beta adjusted) measurement. Officially, alpha measures the difference between a portfolio's actual returns and what it might be expected to deliver based on its level of risk. Higher risk generally means higher reward. A positive alpha means the fund has beaten expectations. A negative alpha means that the manager failed to match performance with risk. If two managers had the same return but one had a lower beta, that manager would have a higher alpha. Annualized Periods Adjusting an income or return to an annual basis. Also called annualized return. Asset Allocation The mix of investment classes – equities, fixed income and cash – for an investor’s portfolio. The appropriate balance is based on the anticipated return and relative risk of each asset category as well as the investor’s personal factors such as risk tolerance, age, current asset allocation and asset level. Asset Allocation Funds An investment strategy that aims to balance
risk and reward by apportioning a portfolio’s assets according to an individual’s goals, risk tolerance and investment horizon. Risk Based
“Risk-based” asset allocation funds usually have a mix of stocks, bonds and cash equivalent securities. At the inception of the portfolio, a static allocation is established based on an expected risk/return profile. Because the value of assets can change given market conditions, the portfolio periodically needs to be re-adjusted to meet the allocation policy.
Target-Date
“Life-cycle” or “target-date” funds, which are often used in retirement plans, usually have a mix of stocks, bonds and cash equivalent securities that starts out with a higher risk-return position and gradually become less risky as the investor ages and/or nears retirement.
Average Effective Duration A measure of a fund's interest-rate sensitivity--the longer a fund's duration, the more sensitive the fund is to shifts in interest rates. Duration is determined by a formula that includes coupon rates and bond maturities. Small coupons tend to increase duration, while shorter maturities and higher coupons shorten duration. The relationship between funds with different durations is straightforward: A fund with a duration of 10 years is twice as volatile as a fund with a five-
year duration. Morningstar prints an average effective duration statistic that incorporates call, put, and prepayment possibilities. Average Effective Maturity Average effective maturity is a weighted average of all the effective maturities of the bonds in a portfolio. Effective maturity takes into consideration mortgage prepayments, puts, calls, adjustable coupons, and other features of individual bonds and is thus a more accurate measure of interest-rate sensitivity. Longer-maturity funds are generally considered more interest-rate sensitive than their shorter counterparts. Average Credit Quality An average of all the credit quality positions for a fund’s bond holdings. For corporate-bond and municipal bond funds, Morningstar also shows the percentage of fixed-income securities that fall within each credit-quality rating, as assigned by Standard & Poor's or Moody's. Because it's rare to find individual bonds in a portfolio with a rating below B, the average credit quality of bond funds in Morningstar's database ranges from AAA (highest) to B (lowest). U.S. Government bonds carry the highest credit rating, while bonds issued by speculative or bankrupt companies usually carry the lowest credit ratings. Anything at or below BB is considered a high-yield or "junk" bond. Balanced A mutual fund that buys a combination of common stock, preferred stock, bonds, and

ASSOCIATION OF UNITY CHURCHES 403(B) PLAN
Definitions
61
short-term bonds, to provide both income and capital appreciation while avoiding excessive risk. The purpose of balanced funds (also sometimes called hybrid funds) is to provide investors with a single mutual fund that combines both growth and income objectives, by investing in both stocks (for growth) and bonds (for income). Batting Average The batting average of the manager vs. a benchmark is the ratio between the number of periods where the manager outperforms the benchmark and the total number of periods. Benchmark A market index typically used to measure relative performance of a mutual fund or investment strategy. Broad Category Benchmark
A market index representing a broad asset class, such as large cap, small cap, or international. This index does not reflect stylistic biases.
M&I Benchmark
A market index used to compare a fund’s performance based on both a similar asset class and style bias – e.g., small cap value, foreign large growth.
Beta Beta represents the systematic risk of a portfolio and measures its historical sensitivity to a benchmark. A portfolio with a beta of one
Category
Morningstar Morningstar, Inc. is a leading provider of independent investment research in North America, Europe, Australia, and Asia. Morningstar is a source for information on stocks, mutual funds, variable annuities, closed-end funds, exchange-traded funds, separate accounts, hedge funds, and 529 college savings plans. With operations in 18 countries, they currently provide data on more than 290,000 investment offerings worldwide.
Morningstar Classification In an effort to distinguish funds by what they own, as well as by their prospectus objectives and styles, Morningstar developed the Morningstar Categories. While the prospectus objective identifies a fund’s investment goals based on the wording in the fund prospectus, the Morningstar Category identifies funds based on their actual investment styles as measured by their underlying portfolio holdings (portfolio statistics and compositions over the past three years). If the fund is new and has no portfolio, Morningstar estimates where it will fall before assigning a more permanent category. When necessary, Morningstar may change a category assignment based on current information. Lipper Lipper, a Reuters company, is a global leader in supplying mutual fund information, analytical tools, and
is considered as risky as the benchmark and would therefore be expected to provide returns equal to those of the market during both up and down periods. A portfolio with a beta of two would be expected to move approximately twice as much as the benchmark during both up and down periods. Bonds/Fixed Income Securities Securities that pay a fixed rate of interest or a fixed dividend. There are many different types of fixed-income securities or bonds, the following lists many: Corporate Bonds or Notes, Mortgage-backed Securities, Asset-Backed Securities, Convertible Securities, Government Obligations, “Junk” or below investment grade Bonds, Investment Grade Securities, Foreign Bond Securities. Investments in bonds or fixed income within 401k plans are generally made through the use of mutual funds that invest in individual fixed income securities. Risks: Return of principal is not guaranteed. Bond funds have the same interest rate, inflation, and credit risks that are associated with the underlying bonds owned by the fund. Generally, the value of bond funds rises when prevailing interest rates fall and falls when interest rates rise. There are ongoing fees and expenses associated with owning shares of bond funds. Important note on Junk Bonds: Non-investment grade debt securities, commonly referred to as high-yield or “junk” bonds, may be subject to greater market fluctuations and risk of loss of income and principal than securities in higher rating categories.
ASSOCIATION OF UNITY CHURCHES 403(B) PLAN
Definitions
62
Government Bond Securities that pursue income by investing in a combination of Treasuries, agency securities and mortgage-backed securities. Growth Funds Growth Funds hold stocks of companies that the fund manager believes will have significantly better revenue and profit growth than the overall market. The growth style of investing is characterized by a view of a share of a company as a claim on the company's earnings. Growth investors attempt to find companies whose earnings growth will be greater than is reflected in their stock prices. High-Yield Bond Bond that has rating of BB or lower and pays higher yields to offset its greater risks. Holdings Based Analysis Holdings based style tools classify portfolios based on the characteristics of the underlying securities. For example, holdings-based analysis reveals the size and value/growth orientation of the underlying stocks in a fund. Inception Date Inception date of a mutual fund is the date that the fund manager began to buy securities and record investment performance. The Securities and Exchange Commission requires mutual funds to show rates of return for the lesser of 10 years or the inception date of the fund.
eggs into one basket.” Diversification does not ensure a profit nor protect against loss in declining markets, but diversification may have the effect of reduced volatility of return, potentially resulting in a higher portfolio dollar value over time. Expense Ratio The percentage of fund assets paid for operating expenses and management fees, including 12b-1 fees, administrative fees and all other asset-based costs incurred by the fund, except brokerage costs. Fund expenses are reflected in the fund’s NAV (Net Asset Value). Sales charges are not included in the expense ratio. Fees & Expenses Charges that may be incurred by investors who hold mutual funds. Managing a mutual fund involves costs, including shareholder transaction costs, investment advisory fees, and marketing and distribution expenses. Funds pass along these costs to investors in a number of ways. Foreign Equities Securities trading primarily in markets outside the United States that represent equity ownership in a company. Risks: Investments in foreign securities involve special risks, including foreign currency risk and the possibility of substantial volatility due to adverse political, economic or other developments. These risks are magnified for investments made in emerging markets.
commentary. With three decades of fund analysis experience, bolstered by the resources and knowledge of Reuters, the world's largest financial information and news provider, Lipper provides expertise and insight to the funds industry.
Lipper Classification Funds in the USDE classification model are classified based on portfolio practice rather than prospectus language. In summary, the process is to find a portfolio’s three-year weighted allocation among large-, mid-, and small-cap stocks; assign a large-, multi-, mid-, or small-cap designation; and compare all funds to their relevant Standard and Poor’s (S&P) index (using statistical methods) to determine style (growth, core, or value).
Core Investment Options Your core line-up provides you with a variety of investments from which to choose, ranging in objective from capital preservation to growth. Each of the core investments consists primarily of one of the different building blocks, which are usually referred to as asset classes (equities, bonds and cash equivalents). Diversification Investing in multiple investments to help limit risk. The concept of “not putting all your
ASSOCIATION OF UNITY CHURCHES 403(B) PLAN
Definitions
63
attempts to provide an accurate view of a manager’s investment style using either returns based or holdings based analysis. Manager Tenure The number of years that the current manager has been the portfolio manager for the investment product. For products with more than one manager, the tenure of the manager who has been with the product the longest is shown. If there is only one manager, who has been at the product for less than six months (and for whom we have biographical information available), a dash will appear. Market Capitalization* One way to classify equity funds is by market capitalization, which is the market value of the company. This is calculated by multiplying the total number of a company’s shares by the current price per share. Generally, market capitalization is associated with the size of the company. *Please note that the definitions of small, mid, and large cap companies illustrated here are generalizations only, and are subject to change. In addition, individual mutual fund managers may use different definitions for specific funds. You are encouraged to read the prospectus carefully to determine the market capitalization specifications of any individual mutual fund. Large Cap
This generally refers to the stock of companies with market capitalizations over $5 billion. These seasoned
Lipper Averages All active funds in the group for the period. Number of component fund always changes. Universes are dynamic due to revisions for new funds, mergers or liquidations, etc. Will be inaccurate if historical averages are linked. Long-Term Fixed Income Long-term bond portfolios invest primarily in corporate and other investment-grade U.S. fixed-income issues and have durations of more than six years (or, if duration is unavailable, average effective maturities greater than 10 years). Due to their long durations, these portfolios are exposed to greater interest rate risk. M&I Revenue Sharing M&I receives payments from mutual funds in return for providing transfer agent, shareholder servicing, and recordkeeping. M&I tracks share ownership at the plan and participant account level, conveys educational information about the fund to the plan and participants, and enforces trading policies established by the mutual fund companies. Payments made to M&I are part of the total expense ratio of the fund. Manager Style Graph The manager style graph is a two-dimensional graph displaying manager style against a style basis. A manager style graph
Index Funds A passively managed mutual fund that tries to mirror the performance of a specific index, such as the S&P 500. Information Ratio The Information Ratio of a manager series vs. a benchmark series is the quotient of the annualized excess return and the annualized standard deviation of excess return. The Information Ratio measures the consistency with which a manger beats a benchmark. Intermediate-Term Bond Intermediate-term bond portfolios invest primarily in corporate and other investment-grade U.S. fixed-income issues and have durations of 3.5 to six years (or, if duration is unavailable, average effective maturities of four to 10 years). These portfolios are less sensitive to interest rates, and therefore less volatile, than portfolios that have longer durations. International Funds A mutual fund that invests in stock and bonds of companies outside of the U.S. Investment Grade Corporate Bond A bond rated BBB or higher; generally, investment grade corporate bonds are viewed to be lower risk than lower-rated corporate bonds.
ASSOCIATION OF UNITY CHURCHES 403(B) PLAN
Definitions
64
Morningstar Category Average Expense The average of the audited expense ratios in the fund’s Morningstar category for each year. M&I calculates a geometric average of the expense ratios represented within each Morningstar category. Net Assets The month-end net assets of the mutual fund, recorded in millions of dollars. Net-asset figures are useful in gauging a fund’s size, agility, and popularity. They help determine whether a small company fund, for example, can remain in its investment-objective category if its asset base reaches an ungainly size. Other Revenue On financial reports, income derived from minor sources which do not form a significant part of the normal business activities. Same as other income. Percent in Top 10 Holdings The aggregate assets, expressed as a percentage, of the fund's top 10 portfolio holdings. This figure is meant to be a measure of portfolio risk. Specifically, the higher the percentage, the more concentrated the fund is in a few companies or issues, and the more the fund is susceptible to the market fluctuations in these few holdings. The figure is calculated from the most recent available fund holdings. Percentile (%) Rank The performance ranking relative to the
small-capitalization stocks is accompanied by higher risk.
Market Maturity Market Maturity shows the percentage of a holding's common stocks that are domiciled in developed and emerging markets. % Developed Markets
For purposes of this calculation, developed markets include Australia, Austria, Belgium, Canada, Denmark, Finland, France, Germany, Ireland, Italy, Japan, Luxembourg, the Netherlands, New Zealand, Norway, Singapore, Spain, Sweden, Switzerland, the United Kingdom, The United States, and a handful of smaller countries and territories (such as Gibraltar). % Emerging Markets All countries that are not developed markets are considered emerging markets. Emerging markets normally carry greater political and economic risk than developed countries, and stocks of companies located in them are normally less liquid and more volatile.
Median Market Cap Morningstar defines the overall "size" of a stock fund's portfolio as the geometric mean of the market capitalization for all of the stocks it owns.
companies, sometimes referred to as “blue-chips” in the U.S. often have long histories of solid returns. While large cap stocks tend to be relatively stable compared with other stocks, they do carry a degree of risk.
Mid Cap
With market capitalizations that generally range between $2 billion and $5 billion, these stocks can be more volatile than large cap stocks, but have the potential for higher relative returns. Because mid-capitalization stock prices have experienced a greater degree of market volatility than large-capitalization stock prices, investors should consider mid cap funds for long-term investment and should bear in mind that the higher return potential of mid-capitalization stocks is accompanied by additional business risk and, significant stock price fluctuations.
Small Cap
With market capitalizations of less than $2 billion, companies in this category often are new companies with short histories. Because small-capitalization stock prices have experienced a greater degree of market volatility than those of large-capitalization stocks, investors should consider funds that invest in small-cap stocks for long-term investment and should bear in mind that the higher return potential of
ASSOCIATION OF UNITY CHURCHES 403(B) PLAN
Definitions
65
Sector Morningstar uses an industry sector structure to help investors and investment professionals more easily compare and understand the sector exposures of mutual funds and portfolios. The sector classifications are also designed to create a more useful way to evaluate common stocks and to address the limitations of conventional sector analysis. Morningstar divides the economy into three new "Super Sectors"-- the Information Economy, the Service Economy, and the Manufacturing Economy -- each of which contains four sectors. Information Economy Software
Companies engaged in the design and marketing of computer operating systems and applications. Examples include Microsoft, Oracle, and Siebel Systems. Hardware Manufacturers of computer equipment, communication equipment, semiconductors, and components. Examples include IBM, Cisco Systems, and Intel. Media Companies that own and operate broadcast networks and those that create content or provide it to other media companies. Examples include AOL Time Warner, Walt Disney, and The Washington Post. Telecommunications Companies that provide communication services using fixed-line networks or those that provide wireless access and services.
movements that can be explained by movements in its benchmark index. An R-squared of 100 indicates that all movements of a fund can be explained by movements in the index. Thus, index funds that invest only in S&P 500 stocks will have an R-squared very close to 100. Conversely, a low R-squared indicates that very few of the fund’s movements can be explained by movements in its benchmark index. An R-squared measure of 35, for example, means that only 35% of the fund’s movements can be explained by movements in the benchmark index. Redemption Fee A sales or charge commission paid when an individual sells an investment, such as a mutual fund or an annuity, which is intended to discourage frequent or excessive trading. Unlike deferred fees, however, some redemption fees go back into the fund itself, rather than into the fund company’s pockets, and thus do not represent a net cost to shareholders. Returns Based Analysis Return-based style analysis draws from Nobel Laureate William Sharpe’s style analysis model, which stipulates that a manager’s investment style can be determined by comparing the returns on his portfolio with those of a certain number of selected indices. The oft-quoted words of Sharpe to justify his methodology are: “If it acts like a duck, assume it’s a duck.”
Morningstar or Lipper Category peer group. For instance, if a fund has a percentile rank of 55, the fund was in the 55th percentile of its peer group category. That means that 55% of funds in the same category performed better than it did during the same time period. Price-to-book ratio (P/B Ratio) The P/B ratio of a company relates the per-share market price of the company’s stock to its per-share book value, the historical accounting value of the company’s tangible assets. This figure may not always represent the real value of a company because it excludes such intangible assets as patents and trademarks. A high P/B ratio indicates that the price of the stock exceeds the actual worth of the company’s assets. A low P/B ratio would indicate that the stock is a bargain, priced below what the company’s assets could be worth if liquidated. Price-to-earnings ratio (P/E Ratio) The P/E ratio relates the price of the stock tothe per-share earnings of the company. A high P/E generally indicates that the market will pay more to obtain the company because it has confidence in the company’s ability to increase its earnings. Conversely, a low P/E indicates that the market has less confidence that the company’s earnings will increase, and therefore will not pay as much for its stock. R-Squared Reflects the percentage of a fund’s
ASSOCIATION OF UNITY CHURCHES 403(B) PLAN
Definitions
66
performance. It can be used to compare two portfolios directly on how much excess return each portfolio achieved for a certain level of risk. Short-Term Bond Short-term bond portfolios invest primarily in corporate and other investment-grade U.S. fixed-income issues and have durations of one to 3.5 years (or, if duration is unavailable, average effective maturities of one to four years). These portfolios are attractive to fairly conservative investors, because they are less sensitive to interest rates than portfolios with longer durations. Stable Value Stable-value portfolios seek to provide income while preventing price fluctuations. The most common stable-value portfolios invest in a diversified portfolio of bonds and enter into wrapper agreements with financial companies to guarantee against fluctuations in their share prices. These wrapper agreements typically provide price stability on a day-to-day basis, thereby insulating each portfolio's net asset value from interest-rate volatility. Therefore, their true overall durations are effectively zero. Standard Deviation Standard deviation is the statistical measurement of dispersion about an average, which depicts how widely a stock or portfolio’s returns varied over a certain period of time. Investors use the standard deviation of historical performance to try to predict the range of returns that is most likely for a given
Manufacturing Economy Consumer Goods Companies that manufacture or provide food, beverages, household and personal products, apparel, shoes, textiles, autos, consumer electronics, luxury goods, packaging, and tobacco. Examples include PepsiCo, Ford Motor Co., and Kraft Foods. Industrial Materials Includes aerospace and defense firms, and companies that provide or manufacture chemicals, machinery, auto parts, building materials, and commodities. Examples include Boeing, DuPont, and Alcoa. Energy Companies that produce or refine oil and gas, oilfield services and equipment companies, and pipeline operators. Examples include Exxon Mobil, Schlumberger, and BP Amoco. Utilities Electric, gas, and water utilities.
Examples include Duke Energy, Exelon, and El Paso. Sharpe Ratio The Sharpe Ratio is a risk-adjusted measure developed by Nobel Laureate William Sharpe. It is calculated by using standard deviation and excess return to determine reward per unit of risk. It is a portfolio's excess return over the risk-free rate divided by the portfolio's standard deviation. The portfolio's excess return is its geometric mean return minus the geometric mean return of the risk-free instrument (by default, t-bills). The higher the Sharpe Ratio, the better the portfolio’s historical risk-adjusted
Examples include SBC Communications, AT&T, and Alltel. Service Economy Healthcare Includes biotechnology, pharmaceuticals, research services, HMOs, home health, hospitals, medical equipment and supplies, and assisted living companies. Examples include Abbott Laboratories, Merck, and Cardinal Health. Consumer Services Includes retail stores, personal services, home builders, home supply, travel and entertainment companies, and educational providers. Examples include Wal-Mart, Home Depot, and Expedia. Business Services Includes advertising, printing, publishing, business support, consultants, employment, engineering and construction, security services, waste management, distributors, and transportation companies. Examples include Manpower, R. H. Donnelley, and Southwest Airlines. Financial Services Includes banks, finance companies, money management firms, savings and loans, securities brokers, and insurance companies. Examples include Citigroup, Washington Mutual, and Fannie Mae.

ASSOCIATION OF UNITY CHURCHES 403(B) PLAN
Definitions
67
A portfolio manager with a 120% down capture ratio captured 120% more than the index’s return when it declined (20% worse than the index). Value Funds Value funds concentrate on stocks of companies that the fund manager believes to be currently undervalued in the markets. The value style of investing is characterized by a view of a share of a company as a claim on the company's assets. Value investors attempt to find companies whose net asset value is greater than is reflected in their stock prices.
Sources: Morningstar, Inc. Zephyr Associates, Inc. M&I Investment Management Corporation Investopedia ULC InvestorWords.com
In practical terms, the resulting percentage loosely represents the percentage of the portfolio’s holdings that have changed over the past year. Weighted Average Coupon (Wtd Avg Cpn) This figure is calculated by weighting each bond's coupon by its relative size in the portfolio. Weighted Average Yield to Maturity (Wtd Avg YTM) The average annual yield of a fully amortized loan that is held by an investor for the life of the loan. The average rate takes into the account the fact that the outstanding principal, and consequently the amount of interest, declines each year until the loan is fully paid. When the term is used in reference to a bond or other security, it means the average annual rate of return of the security when held to maturity, taking into account discounts or premiums paid when the security is purchased and capital gains or losses. Up and Down Capture Ratio The up and down capture is a measure of how well a manager was able to replicate or improve on phases of positive benchmark returns, and how badly the manager was affected by phases of negative benchmark returns. For example, a portfolio manager with a 120% up capture ratio captured 120% of the index’s return when it appreciated (a 20% higher return than the index).
investment. When a stock or portfolio has a high standard deviation, the predicted range of performance is wide, implying greater volatility. Stocks An instrument that signifies an ownership position (called equity) in a corporation, and represents a claim on its proportional share in the corporation's assets and profits. Ticker Symbol The NASDAQ assigned symbol commonly used to locate the fund on electronic price-quoting systems. Total # of Holdings The total number of different holdings of a fund. This figure is meant to be a measure of portfolio risk. Specifically, the lower the figure, the more concentrated the fund is in a few companies or issues, and the more the fund is susceptible to the market fluctuations in these few holdings. Turnover This is a measure of the fund’s trading activity which is computed by taking the lesser of purchases or sales (excluding all securities with maturities of less than one year) and dividing by average monthly net assets. A turnover ratio of 100% or more does not necessarily suggest that all securities in the portfolio have been traded.
Section IX: Disclosure 4th Quarter, 2009
ASSOCIATION OF UNITY CHURCHES 403(B) PLAN
Disclosure
69
This evaluation was prepared by M&I Institutional Trust using information from sources believed to be reliable; however, there is no guarantee as to the accuracy or completeness of the data included in this evaluation. Neither the information nor any opinion expressed herein constitutes a solicitation to purchase or sell any securities. For complete information about any fund included in this report, please see the fund’s prospectus and consider the investment objectives, risks, charges and expenses of the investment company. The prospectus contains this and other important information related to the funds and the investment company. Please read the prospectus carefully before investing. Investment Advice: Unless M&I has separately contracted with the plan administrator to provide investment advisory or investment management services to the plan, this report is not intended to and should not be construed as a recommendation for or against any particular firm, fund, or investment manager. M&I is not offering investment advice and is not acting as a fiduciary with respect to plan investments, as those terms are defined by the Employee Retirement Income Security Act of 1974, as amended. Specifically, this report is not intended to and does not constitute regular or specific recommendations that could be the primary basis for the plan administrator's investment decisions, including what investment options to offer under the Plan. The plan administrator has sole authority and responsibility for any decision whether to change or retain any fund alternatives available to participants. Data Sources: Performance and peer group rankings included in this report are from Morningstar Principia Pro, MorningstarDirect, and Lipper LANA. Morningstar and Lipper are third party mutual fund rating agencies. Risk/reward characteristics are calculated in Zephyr StyleAdvisor. Definitions of Morningstar and Lipper are included in the “Glossary” section of this report. Performance: Past performance is no guarantee of future returns; all investments are subject to risk. Investment return and principal value will fluctuate so that shares, when redeemed, may be worth more or less than their original cost. Current performance may be lower or higher than the performance data quoted. All total returns assume the reinvestment of all dividend and capital gain distributions at net asset value when paid. Generally, investments offering higher potential for return are accompanied by a higher degree of risk. Stocks and other equities representing an ownership interest in a corporation have historically outperformed other asset class over the long-term, but have historically had higher short-term volatility than investments with lower potential for return. Fees and Expenses: There are ongoing fees and expenses associated with any investment fund; detailed information on the funds in this report is included in the “Fees and Expenses” section. Please note that there are other charges and expenses that apply to the investment options, such as management fees, which are reflected in their net investment return. For certain investment options, the returns reflect subsidies and waivers, without which the results would have been lower than noted. These subsidies and waivers may not continue to remain in effect. Please consult the prospectus for more detailed information. Please be aware that certain funds will charge redemption fees for short-term trading, which are imposed by the mutual fund companies. The returns for these funds will not reflect such fees, and if they had been reflected, results would have been lower than shown. For more complete information on the investment options, including their management fees and other charges and expenses, please consult the prospectuses and other comparable documents. The fee information included in this report refers only to fund level fees; for specific information on plan level fees, see the Service Level Agreement. Money Market Funds: An investment in a money market fund is not insured or guaranteed by the Federal Deposit Insurance Corporation (FDIC) or any other government agency. However, some money market funds may be participating in a temporary governmental insurance program originated in September 2008.
ASSOCIATION OF UNITY CHURCHES 403(B) PLAN
Disclosure
70
Although money market funds seek to preserve the principal of an investment at $1.00 per share, there is no guarantee that the money market fund will accomplish its objective. Stable Principal Funds: Stable principal funds seek to maintain a stable value per share of $1.00; however, there is no guarantee that the stable principal fund will accomplish its objective. Stable principal funds typically invest in securities that have longer-term maturities in an effort to capture a higher yield than traditional money market funds. Stable principal funds may have direct investments in insurance companies, and may utilize synthetic contract investments partnering with insurance companies or other financial entities. Bond Funds: Return of principal is not guaranteed within a bond fund investment. Bond funds have the same interest rate, inflation, and credit risks that are associated with the underlying bonds owned by the fund. High Yield Bond Funds: Non-investment grade debt securities, commonly referred to as high-yield or “junk” bonds, may be subject to greater market fluctuations and risk of loss of income and principal than higher rated investment grade securities. Small Cap Stock Funds: Stocks of smaller companies may be subject to above-average market price fluctuations. Foreign Stock Funds: Foreign investments typically involve greater risks and potential rewards than US investments, and investment return and principal value of the Fund will fluctuate with market conditions, currencies, and economic, social and political climates of the countries where the Fund invests. Emerging markets may have heightened risks related to the same factors; smaller and less liquid markets may have additional risk. Non-Diversified Funds: Non-diversified funds invest more of their assets in fewer industries, sectors, and/or companies than diversified funds. Concentration in a specific area of the market or in a few companies increases the risk in the Fund because each investment has a magnified effect on the Fund’s performance. Sector/Specialty Funds: Funds that invest exclusively in one sector of the economy carry additional risk and the possibility of substantial volatility due to adverse political, economic, or other developments. Affiliation with Investment Options. M&I is not affiliated with any investment options other than the Marshall Funds family of mutual funds and the collective investment trusts trusteed by Marshall & Ilsley Trust Company N.A. (including, as of the date of this report, the Personal Strategy Portfolios, Target Retirement Portfolios, the Fundamental Index Fund and the Stable Principal Fund). The Marshall Funds and M&I collective investment trusts are managed and advised by M&I Investment Management Corp. This report and commentary provided by UpTick Data Technologies. www.uptickdata.com