Embed Size (px)
Citation preview

The world's leading sustainability consultancy
Corning Diesel Manufacturing Facility Steuben County, NY
Prepared For: Air Quality Modeling Analysis Modeling Report May 2015 Environmental Resources Management 75 Valley Stream Parkway Suite 200, Malvern, PA 19355 www.erm.com
ERM i CORNING: DIESEL – MAY 2015
TABLE OF CONTENTS
INTRODUCTION 1 1.0
1.1 OVERVIEW OF MODELING METHODOLOGY 2
PROJECT DESCRIPTION 4 2.0
2.1 FACILITY LOCATION 4
2.2 SOURCE PARAMETERS AND EMISSION RATES 6
AIR QUALITY DISPERSION MODELING APPLICABILITY 13 3.0
3.1 PSD NOX MODELING ANALYSIS AND CLASS I AREA IMPACT ANALYSIS 13
3.2 CO MODELING ANALYSIS 14
3.3 HF MODELING ANALYSIS 14
MODELING METHODOLOGY AND ANALYSIS 15 4.0
4.1 AIR QUALITY MODEL SELECTION 15
4.2 METEOROLOGICAL DATA 15
4.3 BACKGROUND CONCENTRATIONS 19
4.4 RECEPTOR GRID 20
4.5 GOOD ENGINEERING PRACTICE (GEP) STACK HEIGHT ANALYSIS 22
4.6 AIR QUALITY STANDARDS 23
MODELING RESULTS 26 5.0
5.1 RESULTS OF SIL MODELING FOR NO2 14
5.2 BACKGROUND SOURCE INVENTORY 14
5.3 OVERALL RESULTS 15
6.0 SUMMARY AND CONCLUSIONS 17
ERM ii CORNING: DIESEL – MAY 2015
LIST OF APPENDICES
APPENDIX A AMBIENT RATIO METHOD 2 (ARM2) JUSTIFICATION AND PROTOCOL
APPENDIX B SMALLER SOURCES FOR MULTI-SOURCE MODELING APPENDIX C UPDATED PLOT PLAN APPENDIX D MODEL INPUTS FOR THE MULTI-SOURCE INVENTORY
LIST OF FIGURES
Figure 2-1 Location of Diesel Facility
Figure 2-2 Terrain Elevations in Project Vicinity; 1 km Land Use
Figure 2-3 Location of Small Combustion Source Volume Sources
Figure 4-1 Land Use Features within 1 km of the Elmira Anemometer
Figure 4-2 Wind Roses: Elmira Airport (2009 – 2013)
Figure 4-3 Receptor Grid for the Diesel Facility: Small Scale
Figure 4-4 Receptor Grid for the Diesel Facility: Medium Scale
Figure 4-5 Stack Locations, Structure Heights, Fenceline
Figure 5-1 Location of New York and Pennsylvania NOx Sources
Figure 5-2 Concentration Contours: NO2 1-hour
Figure 5-3 Concentration Contours: CO 1-hour
Figure 5-4 Concentration Contours: HF Monthly
LIST OF TABLES
Table 2-1 Modeling Analysis Source Stack Parameters
Table 2-2 Modeling Analysis Emission Rates
Table 2-3 Volume Source Parameters and Emission Rates
Table 4-1 AERSURFACE Analysis: Seasonal Zo Values (in meters)
Table 4-2 EPA and NYSDEC Standards
Table 4-3 VISCREEN Model Input Data
Table 4-4 VISCREEN Model Results
Table 5-1 Overall Model Results Summary

ERM 1 CORNING: DIESEL – MAY 2015
INTRODUCTION 1.0
Environmental Resources Management, Inc. (ERM) is assisting the Corning Incorporated Diesel Manufacturing Facility (“Diesel,” “Corning,” or “Facility”) with evaluating the air quality impacts of the Diesel Facility’s proposed modifications as described fully in the permit application submitted to NYSDEC. Several PSD-regulated air pollutants including carbon monoxide (CO), oxides of nitrogen (NOx), sulfur dioxide (SO2), particulate matter less than 10 and 2.5 microns (PM10 and PM2.5), and fluorides (including hydrogen fluoride – HF) will be emitted from the Project; however, based on the results of a PSD regulatory applicability review, NOx is the only PSD pollutant that triggers the significant emission rate threshold, thus requiring an air quality analysis. At NYSDEC’s request, emissions of CO and HF were also modeled and compared against applicable state and/or federal standards. Following the protocol submittal, Corning Diesel submitted a justification and protocol for using ARM2 for NOx sources at the Diesel facility to NYSDEC and EPA Region II on July 25, 2014. The present report was prepared in anticipation that the methodology outlined in the protocol will be approved with some enhancements that were made in response to EPA Region II and NYSDEC comments.
Subsequently, EPA presented a webinar (August 14, 2014) on guidance for justifying ARM2 that was under development. Corning Diesel submitted additional information on September 11, 2014 that addressed issues that were raised in the webinar. On September 30, 2014, EPA issued a clarification memorandum as a follow-on to the webinar, that provided additional guidance on justifying the use of ARM21. EPA Region II continued to review Corning’s submittals, along with NYSDEC and EPA OAQPS, and had a question regarding individual source contributions to high predicted NOx ambient levels. Corning conducted additional modeling and provided results and modeling files to NYSDEC and EPA Region II. An additional question was posed by EPA Region II to Corning that indicated that approval of ARM2 in this case would be facilitated by preparing a demonstration that ensures that the proposed ARM2 approach is at least as conservative as the applicable Tier 3 methodology. Appendix A of this document addresses all of the questions and comments on ARM2 provided by NYSDEC and EPA Region II, including a demonstration that with a higher minimum ratio than originally proposed, ARM2 is shown to be at least as conservative as OLM for several future emissions scenarios. The present report has been updated to reflect design changes, including additional small
1 “Clarification on the Use of AERMOD Dispersion Modeling for Demonstrating Compliance with the NO2 National
Ambient Air Quality Standard” From: R. Chris Owen and Roger Brode To: Regional Dispersion Modeling Contacts. September 30, 2014.

ERM 2 CORNING: DIESEL – MAY 2015
combustion sources, and updates to physical characteristics of sources and downwash structures at the facility.
1.1 OVERVIEW OF MODELING METHODOLOGY
The methodology and procedures that were used in this analysis are based on policies and procedures contained in the U.S. EPA Guideline on Air Quality Models (GAQM, 40 CFR Appendix W) and New York State’s Department of Environmental Conservation (NYSDEC) DAR-10 modeling guidelines.
The steps that were involved in this modeling analysis are summarized below:
Compile information on the stack parameters for all air emission point sources;
Compile data on the potential to emit (PTE) for NOx, CO, and HF;
Develop a comprehensive receptor grid to capture the maximum off-site impacts from the facility sources – using the latest version of AERMAP (version 11103) to develop an elevation and hill scale for each receptor;
Obtain and process five years of validated, model-ready meteorological files (as available from a local, representative, meteorological station) processed with the AERMET processor (version 14134);
Conduct an air quality modeling analysis using EPA’s regulatory dispersion model, AERMOD (version 14134) for Diesel emissions of NOx, CO, and HF and other sources as applicable;
Utilize the Ambient Ratio Method-2 “ARM2” methodology for the conversion of NOx to NO2. This methodology is available in the current version of AERMOD as a “beta” option and thus requires justification to ensure that its use for the Diesel modeling is appropriate; the justification and methodology are presented in Appendix A;
The expectation is that modeled Project increased emissions will exceed the interim SIL for NO2 1-hour and the SIL for NO2 annual average, thus the analysis identifies an appropriate representative background data set for NO2;
Develop a background source inventory of NOx emissions for the NO2 NAAQS analysis; conduct multi-source modeling to address compliance with the 1-hour and annual NAAQS for NO2;
Model CO and HF emissions (non-PSD) based on NYSDEC’s request; and

ERM 3 CORNING: DIESEL – MAY 2015
Summarize the results in graphical and tabular format and compare the results with applicable air quality standards.

ERM 4 CORNING: DIESEL – MAY 2015
PROJECT DESCRIPTION 2.0
Corning is planning the addition of new firing cycles and changes to existing firing cycles in the periodic kilns (DP1-4) and tunnel kilns (DT1-4) at the Diesel facility. The proposed changes will improve process efficiencies, enable new product development and establish new shorter firing cycles and associated equipment upgrades to allow for larger throughput of product. For long term operational flexibility, Corning will require the approval of its Non-attainment New Source Review (NA-NSR) significant modification permit application to replace the facility’s existing U-00001 to U-00005, 99 tons per year (tpy) and U-00006, 39 tpy, NOx caps with a 247.4 tpy emission unit U-00001 to U-00006 NOx cap. For the purpose of relating these unit designations to NOx sources modeled to address NO2 ambient requirements, U-00004 includes the periodic kilns and tunnel kilns 1 and 2; U-00006 includes tunnel kilns 3 and 4 which include several small combustion sources; and the balance of the small combustion sources are included in U-00005. The NA-NSR application also proposes LAER limits for affected sources.
2.1 FACILITY LOCATION
Corning is proposing a series of modifications at its Diesel facility in Steuben County, New York. The proposed site is situated in a rural area in southeast Steuben County, approximately 8 miles from the border with Pennsylvania.
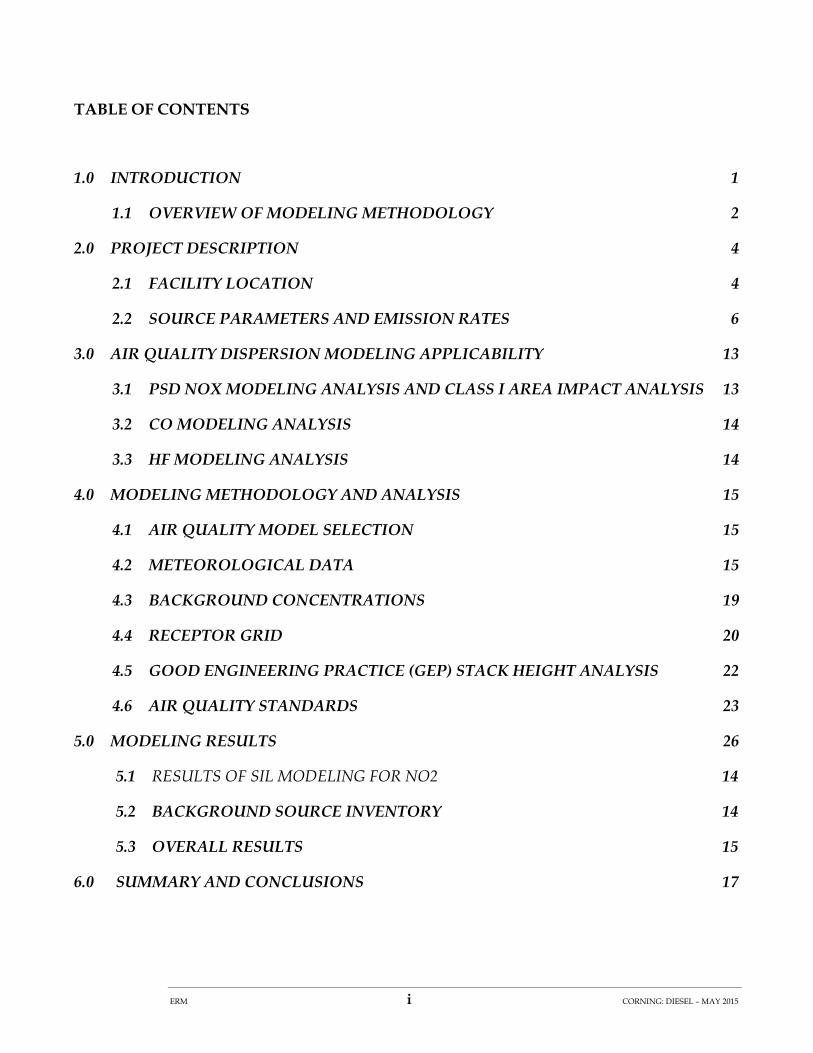
Diesel lies approximately at the intersection of Highways 417 and 15 in a valley region surrounded by elevated terrain. Topography surrounding the site contains elevated, complex terrain features generally to the north, south and west of the Facility. Figure 2-1 shows the location of the Diesel facility; Figure 2-2 displays terrain elevations within a few kilometers of the facility and land use within 1 kilometer of facility. Universal Transverse Mercator (UTM) coordinates of the center of the proposed sites shown in these figures are approximately 321768E, 4664556N (Zone 18).
ERM 5 CORNING: DIESEL – MAY 2015
Figure 2-1 Diesel Facility Location

ERM 6 CORNING: DIESEL – MAY 2015
Figure 2-2 Terrain Elevations in Project Vicinity; 1 km Land Use
2.2 SOURCE PARAMETERS AND EMISSION RATES
As presented in the Project Description, modifications are planned at the Diesel facility. These modifications will affect the following emission sources that are currently permitted:
E0019 – Periodic Kiln #1 E0020 – Periodic Kiln #2 E0021 – Periodic Kiln #3 E0022 – Periodic Kiln #4 E023A – Tunnel Kiln #1, POC1

ERM 7 CORNING: DIESEL – MAY 2015
E023B – Tunnel Kiln #1, POC2 E023D – Tunnel Kiln #1, Ware Cool E024A – Tunnel Kiln #2, POC1 E024B – Tunnel Kiln #2, POC2 E024D – Tunnel Kiln #2, Ware Cool E620A – Tunnel Kiln #3, POC1 E620B – Tunnel Kiln #3, POC2 E620C – Tunnel Kiln #3, Ware Cool E621A – Tunnel Kiln #4, POC1 E621B – Tunnel Kiln #4, POC2 E621C – Tunnel Kiln #4, Ware Cool
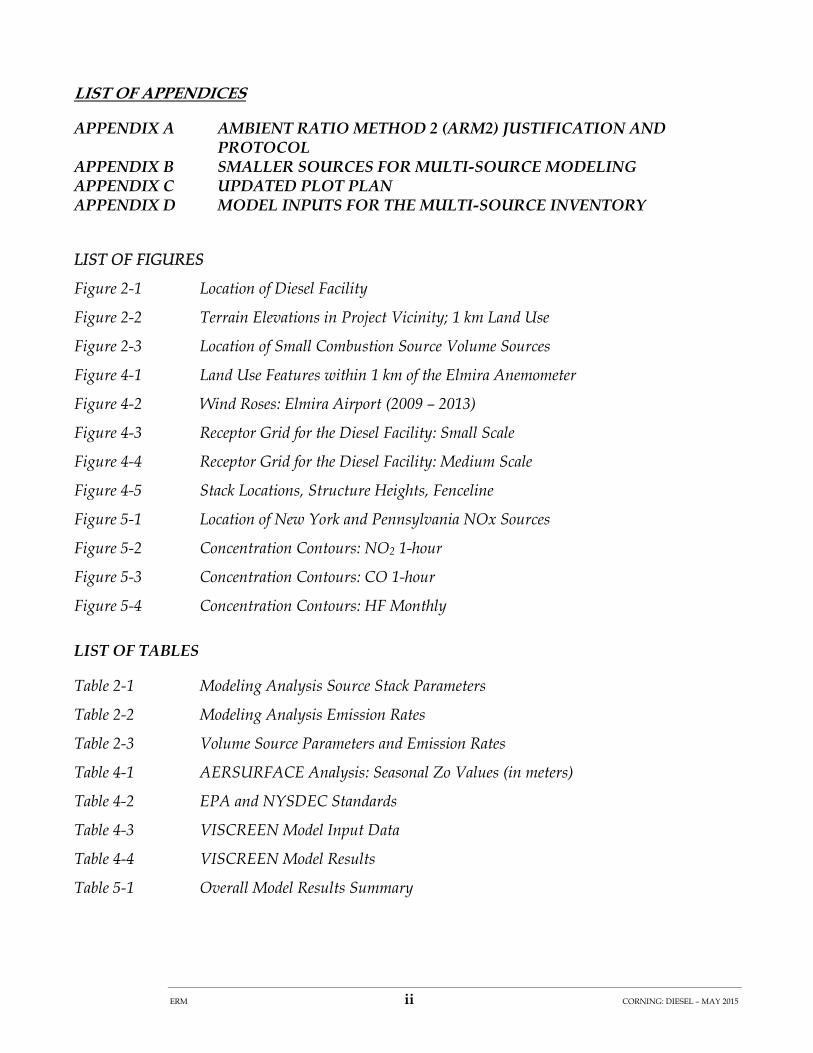
Emission rates, exit velocities, and exit temperatures within the model are based on existing facility parameters, and extensive emissions testing on Corning’s kiln processes. Table 2-1 provides a summary of the stack parameters for emission sources at the Facility; Table 2-2 shows the emission rates that were modeled for the full facility. For the periodic kilns, the emission rate shown in Table 2-2 was modeled as though this rate occurs continuously. An alternative scenario was modeled that allows for an increase in the emission rate of one periodic kiln to 8.42 lbs/hr, as long as the total over all four kilns is less than or equal to 22.44 lbs/hr. This alternative scenario was also modeled as though it occurs continuously, in order to demonstrate compliance with the NO2 1-hour NAAQS. Two sources included on these tables (the N2 Pad Evaporators) are now modeled as individual point sources. In previous modeling analyses these sources were included in the small source volume configuration; however, since they are now located away from the main building (see Figure 4-5 later in this report) the individual stack configuration is the preferred method. The area of impact modeling was based on emission rates representing the difference between baseline emissions and future potential emissions.
It should be noted that unlike typical stationary combustion sources, emissions of various pollutants from the Periodic Kiln processes are not steady-state. As the product moves through the various manufacturing cycles in the kiln, different pollutants are released; this means that the worst case short term emissions are experienced under different exit temperature and operational scenarios for each of the pollutants emitted by the Periodic Kilns. For each of the pollutants analyzed here, the parameter combination (i.e., exit temperature, flow rate, and emission rate) resulting in the maximum impact scenario has been assumed on a pollutant by pollutant basis for each of the Periodic Kilns, based on facility experience and available testing data.

ERM 8 CORNING: DIESEL – MAY 2015
Table 2-1 Modeling Analysis Source Stack Parameters
English Units
AERMOD Source Exit Vel. TempStack
Height
Stack
DiameterUTME UTMN Base El
i.d. i.d. fpm ° F ft ft m m ft
Periodic Kiln No. 1 TO#1 E0019 DP1 681.3 108.8 85.0 6.00 321751.5 4664590.7 970.00
Periodic Kiln No. 2 TO#1 E0020 DP2 681.3 108.8 85.0 6.00 321766.5 4664591.0 970.00
Periodic Kiln No. 3 TO#1 E0021 DP3 681.3 108.8 85.0 6.00 321782.4 4664591.4 970.00
Periodic Kiln No. 4 TO#1 E0022 DP4 681.3 108.8 85.0 6.00 321797.1 4664592.2 970.00
Tunnel Kiln No. 1 TO#1 E023A DT1 POC1 3,139.2 326.0 77.0 3.92 321860.2 4664556.7 970.00
Tunnel Kiln No. 1 TO#2 E023B1 DT1 POC2 2,999.4 537.0 85.0 4.11 321897.4 4664558.8 970.00
Tunnel Kiln No. 1 Ware Cool E023D DT1 WC 1,374.2 607.0 50.0 4.08 321940.6 4664561.3 970.00
Tunnel Kiln No. 2 TO#1 E024A DT2 POC1 3,155.7 379.0 77.0 3.92 321832.5 4664555.8 970.00
Tunnel Kiln No. 2 TO#2 E023B2 DT2 POC2 2,874.1 555.0 85.0 4.11 321897.4 4664558.8 970.00
Tunnel Kiln No. 2 Ware Cool E024D DT2 WC 1,592.2 594.0 50.0 4.08 321975.1 4664562.8 970.00
Tunnel Kiln No. 3 TO#1 E620A DT3 POC1 827.9 262.0 77.0 3.16 321930.6 4664589.6 970.00
Tunnel Kiln No. 3 TO#2 E620B DT3 POC2 2,850.9 730.0 85.0 7.00 321893.4 4664626.5 970.00
Tunnel Kiln No. 3 Ware Cool E620C DT3 WC 3,482.2 183.0 50.0 4.33 321826.3 4664565.7 970.00
Tunnel Kiln No. 4 TO#1 E621A DT4 POC1 1,526.6 219.2 77.0 3.17 321893.5 4664599.3 970.00
Tunnel Kiln No. 4 TO#2 E621B DT4 POC2 1,908.7 699.8 85.0 6.33 321906.5 4664626.5 970.00
Tunnel Kiln No. 4 Ware Cool E621C DT4 WC 3,020.5 246.2 58.5 5.67 321977.2 4664597.4 970.00
N2 Pad Evaporator #1 PADS E0104 12,911.8 450.0 11.0 0.67 321488.5 4664529.5 973.00
N2 Pad Evaporator #2 PADN E0105 12,911.8 450.0 11.0 0.67 321488.5 4664538.2 973.00
Model Units
AERMOD Source Exit Vel. TempStack
Height
Stack
DiameterUTME UTMN Base El
i.d. i.d. m/s K m m m m m
Periodic Kiln No. 1 TO#1 E0019 DP1 3.461 315.818 25.908 1.829 321751.5 4664590.7 295.66
Periodic Kiln No. 2 TO#1 E0020 DP2 3.461 315.818 25.908 1.829 321766.5 4664591.0 295.66
Periodic Kiln No. 3 TO#1 E0021 DP3 3.461 315.818 25.908 1.829 321782.4 4664591.4 295.66
Periodic Kiln No. 4 TO#1 E0022 DP4 3.461 315.818 25.908 1.829 321797.1 4664592.2 295.66
Tunnel Kiln No. 1 TO#1 E023A DT1 POC1 15.947 436.483 23.470 1.195 321860.2 4664556.7 295.66
Tunnel Kiln No. 1 TO#2 E023B1 DT1 POC2 15.237 553.706 25.908 1.253 321897.4 4664558.8 295.66
Tunnel Kiln No. 1 Ware Cool E023D DT1 WC 6.981 592.594 15.240 1.245 321940.6 4664561.3 295.66
Tunnel Kiln No. 2 TO#1 E024A DT2 POC1 16.031 465.928 23.470 1.195 321832.5 4664555.8 295.66
Tunnel Kiln No. 2 TO#2 E023B2 DT2 POC2 14.601 563.706 25.908 1.253 321897.4 4664558.8 295.66
Tunnel Kiln No. 2 Ware Cool E024D DT2 WC 8.088 585.372 15.240 1.245 321975.1 4664562.8 295.66
Tunnel Kiln No. 3 TO#1 E620A DT3 POC1 4.206 400.928 23.470 0.963 321930.6 4664589.6 295.66
Tunnel Kiln No. 3 TO#2 E620B DT3 POC2 14.482 660.928 25.908 2.134 321893.4 4664626.5 295.66
Tunnel Kiln No. 3 Ware Cool E620C DT3 WC 17.689 357.039 15.240 1.320 321826.3 4664565.7 295.66
Tunnel Kiln No. 4 TO#1 E621A DT4 POC1 7.755 377.150 23.470 0.966 321893.5 4664599.3 295.66
Tunnel Kiln No. 4 TO#2 E621B DT4 POC2 9.696 644.150 25.908 1.929 321906.5 4664626.5 295.66
Tunnel Kiln No. 4 Ware Cool E621C DT4 WC 15.344 392.150 17.831 1.728 321977.2 4664597.4 295.66
N2 Pad Evaporator #1 PADS E0104 65.592 505.372 3.353 0.203 321488.5 4664529.5 296.57
N2 Pad Evaporator #2 PADN E0105 65.592 505.372 3.353 0.203 321488.5 4664538.2 296.57
Source Name
Source Name
ERM 9 CORNING: DIESEL – MAY 2015
Table 2-2 Modeling Analysis Emission Rates
English UnitsAERMOD Source
i.d. i.d. NOx CO HF
Periodic Kiln No. 1 TO#1 E0019 DP1 5.610 74.00 0.067
Periodic Kiln No. 2 TO#1 E0020 DP2 5.610 48.80 0.067
Periodic Kiln No. 3 TO#1 E0021 DP3 5.610 48.80 0.044
Periodic Kiln No. 4 TO#1 E0022 DP4 5.610 45.63 0.044
Total Periodic Kilns 22.440 217.23 0.221
Tunnel Kiln No. 1 TO#1 E023A DT1 POC1 2.280 2.580 ‐
Tunnel Kiln No. 1 TO#2 E023B1 DT1 POC2 4.890 14.590 0.007
Tunnel Kiln No. 1 Ware Cool E023B1w DT1 WC 1.180 0.030 ‐
Total Tunnel Kiln No. 1 8.350 17.200 0.007
Tunnel Kiln No. 2 TO#1 E024A DT2 POC1 2.280 1.020 ‐
Tunnel Kiln No. 2 TO#2 E023B2 DT2 POC2 4.890 2.350 0.183
Tunnel Kiln No. 2 Ware Cool E023B2w DT2 WC 1.180 0.030 ‐
Total Tunnel Kiln No. 1 8.350 3.400 0.183
Tunnel Kiln No. 3 TO#1 E620A DT3 POC1 2.280 0.170 ‐
Tunnel Kiln No. 3 TO#2 E620B1 DT3 POC2 4.890 4.560 0.033
Tunnel Kiln No. 3 Ware Cool E620Bw DT3 WC 1.180 0.160 ‐
Total Tunnel Kiln No. 1 8.350 4.890 0.033
Tunnel Kiln No. 4 TO#1 E4A DT4 POC1 2.280 1.400 ‐
Tunnel Kiln No. 4 TO#2 E4B2 DT4 POC2 4.890 2.700 0.292
Tunnel Kiln No. 4 Ware Cool E4B2W DT4 WC 1.180 0.400 ‐
Total Tunnel Kiln No. 1 8.350 4.500 0.292
N2 Pad Evaporator #1 PADS E0104 1.393 ‐ ‐
N2 Pad Evaporator #2 PADN E0105 1.393 ‐ ‐
Model UnitsAERMOD Source
i.d. i.d. NOx CO HF
Periodic Kiln No. 1 TO#1 E0019 DP1 0.707 9.324 0.008
Periodic Kiln No. 2 TO#1 E0020 DP2 0.707 6.149 0.008
Periodic Kiln No. 3 TO#1 E0021 DP3 0.707 6.149 0.005
Periodic Kiln No. 4 TO#1 E0022 DP4 0.707 5.749 0.005
Tunnel Kiln No. 1 TO#1 E023A DT1 POC1 0.287 0.325 ‐
Tunnel Kiln No. 1 TO#2 E023B1 DT1 POC2 0.616 1.838 0.001
Tunnel Kiln No. 1 Ware Cool E023B1w DT1 WC 0.149 0.004 ‐
Tunnel Kiln No. 2 TO#1 E024A DT2 POC1 0.287 0.129 ‐
Tunnel Kiln No. 2 TO#2 E023B2 DT2 POC2 0.616 0.296 0.023
Tunnel Kiln No. 2 Ware Cool E023B2w DT2 WC 0.149 0.004 ‐
Tunnel Kiln No. 3 TO#1 E620A DT3 POC1 0.287 0.021 ‐
Tunnel Kiln No. 3 TO#2 E620B1 DT3 POC2 0.616 0.575 0.004
Tunnel Kiln No. 3 Ware Cool E620Bw DT3 WC 0.149 0.020 ‐
Tunnel Kiln No. 4 TO#1 E4A DT4 POC1 0.287 0.176 ‐
Tunnel Kiln No. 4 TO#2 E4B2 DT4 POC2 0.616 0.340 0.037
Tunnel Kiln No. 4 Ware Cool E4B2W DT4 WC 0.149 0.050 ‐
N2 Pad Evaporator #1 PADS E0104 0.175 ‐ ‐
N2 Pad Evaporator #2 PADN E0105 0.175 ‐ ‐
Source NameEmissions Modeled lbs/hr
Source NameEmissions Modeled g/s

ERM 10 CORNING: DIESEL – MAY 2015
Numerous smaller sources of NOx including boilers and heaters were included in the multi-source modeling. Appendix B contains a detailed listing of all of the small combustion sources and their emission rates. The majority of these sources operate intermittently, primarily in colder months for heating purposes. The current model includes these smaller combustion sources operating at their maximum rated capacity for all hours during the colder months (October through March). For the warmer months (April through September) the model includes the GUHs, MUAUs, and boilers operating at 66% of their maximum rated capacity and all other small combustion units at maximum rated capacity. This is an extremely conservative modeling approach for these sources as the modeled emissions translate to annual natural gas usage of approximately 1,330 MMCF for all U00005 and U00006 small combustion sources. The historical 2011 – 2014 actual annual natural gas consumption for the existing small combustion sources ranges from 93 MMCF to 134 MMCF. Similarly, annual gas consumption for new sources is anticipated to be approximately 47 MMCF as these sources will be operated in a similar manner as the existing U-00005 small combustion sources. In conclusion, the modeled natural gas consumption for the small combustion sources is over 7 times greater than historical and projected actual usage during typical operations – supporting the conservative nature of the modeling.
Previous modeling analyses grouped the small combustion sources into two volume sources. With the addition of new small combustion sources in the building to the northeast of the facility, and to more accurately reflect the location and relative magnitude of emissions from these sources, a new configuration has been developed for the present modeling. Seven volume sources have been configured as shown in Figure 2-3. The release heights for these volume sources have been set equal to the height of the structure where the source is located, or the average height of nearby structures. Since the temperature of the exhaust from these sources provides some buoyancy, setting the release height to a constant value is conservative. Initial sigma-z is scaled to the release height (divided by 2.13); initial sigma z has been set to a uniform value of Table 2-3 lists the parameters and NOx emission rates for all of the volume sources modeled. As shown in this table, the sources have been divided into “winter” and “summer” sources. This is to provide insights into seasonal impacts, but the emission rates are constant and equal to all sources operating at the maximum rating.

ERM 11 CORNING: DIESEL – MAY 2015
Figure 2-3 Location of Small Combustion Source Volume Sources

ERM 12 CORNING: DIESEL – MAY 2015
Table 2-3 Volume Source Parameters and Emission Rates
AERMODRelease
Height
Initial
sigma‐y
Initial
sigma‐zUTME UTMN Base El
i.d. m m m m m m lbs/hr g/s
V1_Wnt 16.383 20.339 7.620 321651 4664527 295.7 2.526 0.3183
V2_Wnt 8.534 20.339 3.969 321719 4664476 295.7 0.206 0.0260
V3_Wnt 8.534 20.339 3.969 321775 4664525 295.7 0.180 0.0227
V4_Wnt 10.668 20.339 4.962 321855 4664477 295.7 0.697 0.0878
V5_Wnt 12.802 20.339 5.954 321861 4664570 295.7 0.139 0.0176
V6_Wnt 8.230 20.339 3.828 321957 4664568 295.7 0.291 0.0367
V7_Wnt 17.678 20.339 8.223 321963 4664638 295.7 2.882 0.3631
V1_Sum 16.383 20.339 7.620 321651 4664527 295.7 1.878 0.2366
V2_Sum 8.534 20.339 3.969 321719 4664476 295.7 0.204 0.0257
V3_Sum 8.534 20.339 3.969 321775 4664525 295.7 0.148 0.0186
V4_Sum 10.668 20.339 4.962 321855 4664477 295.7 0.581 0.0732
V5_Sum 12.802 20.339 5.954 321861 4664570 295.7 0.098 0.0123
V6_Sum 8.230 20.339 3.828 321957 4664568 295.7 0.246 0.0310
V7_Sum 17.678 20.339 8.223 321963 4664638 295.7 1.743 0.2196
Total Winter: 6.922 0.872
Total Summer: 4.897 0.617
NOx Emissions
ERM 13 CORNING: DIESEL – MAY 2015
AIR QUALITY DISPERSION MODELING APPLICABILITY 3.0
The purpose of the modeling analysis is to demonstrate that PSD-affected pollutants (NOx) emitted from the proposed project will not cause or significantly contribute to a violation of applicable PSD increments and National Ambient Air Quality Standards (NAAQS) for NO2. Although the proposed project does not exceed any other PSD-pollutant significance threshold, the NYSDEC has requested the addition of carbon monoxide (CO) and hydrogen fluoride (HF) modeling analyses.
3.1 PSD NOX MODELING ANALYSIS
The analysis to satisfy the PSD modeling requirements includes three steps:
A significance impact analysis for applicable pollutants; A NAAQS compliance analysis; and A PSD increment analysis.
The significance impact analysis compares initial modeled, ground-level concentrations for applicable pollutants that are associated with the Project to the Significant Impact Level (SIL) values on a pollutant/averaging period-specific basis. For those modeled Project emissions that exceed their respective SILs, the NAAQS compliance and PSD increment analysis steps are performed, commonly referred to as the multisource analysis. The multisource analysis considers background concentrations and emissions from regional sources expected to cause a significant concentration gradient in the vicinity of thee Diesel facility. The PSD applicability analysis completed for the Project determined that only NOx triggers PSD review, thus the SIL, NAAQS, and increment analysis focuses on the impacts of NOx emissions on ambient levels of NO2. Based on the SIL modeling, NO2 impacts exceed the interim SIL for 1 hour concentrations and the SIL for annual concentrations at off-site receptors, requiring the more refined, multisource modeling. The results of the multisource model are combined with representative background concentrations from an existing monitoring station for comparison to the corresponding 1-hr and annual NO2 NAAQS and the annual PSD increment as described later in this report.
The closest PSD Class I area to the Diesel facility is the Lye Brook Wilderness Area in Vermont, more than 350 km from Diesel. Because this distance is beyond 300 km, no additional analysis is required to assess impacts on Class I areas.
ERM 14 CORNING: DIESEL – MAY 2015
3.2 CO MODELING ANALYSIS
CO modeling was conducted at the request of NYSDEC. Since CO does not trigger PSD and the intention of the CO modeling is to ensure that Diesel does not cause a violation of the NAAQS for CO, the analysis focuses on Diesel emissions only (primary emissions units) and adds a measured background to the facility’s maximum impact for both the 1-hour and 8-hour averaging periods.
3.3 HF MODELING ANALYSIS
Hydrogen Fluoride (HF) air toxics modeling was conducted at the request of NYSDEC to evaluate compliance with the ambient standards contained in 6 NYCRR Part 257-8.3 AAQS for Gaseous Fluorides.
ERM 15 CORNING: DIESEL – MAY 2015
MODELING METHODOLOGY AND ANALYSIS 4.0
4.1 AIR QUALITY MODEL SELECTION
ERM used AERMOD (version 14134), the EPA-preferred regulatory refined dispersion model, to estimate the ambient concentrations resulting from NOx, CO, and HF emissions. Meteorological data for use in AERMOD have been processed using the AERMET (version 14134) meteorological pre-processor. The base elevation and hill scale parameters for receptors to be used in the modeling analysis have been assigned using AERMAP (version 11103), based on data obtained from the U.S. Geological Survey (USGS) National Elevation Dataset (NED) website.
There are several options available for estimating the atmospheric transformation of NOx emissions to NO2 for comparison the 1-hour and annual NAAQS for NO2. EPA guidance identifies three “Tiers” for estimating this transformation. Tier 1 is the most conservative approach, which assumes that all NOx is converted to NO2. The Tier 2 ambient ratio method uses a constant factor (0.8 for 1-hour, 0.75 for annual) applied to the modeled NOx concentration. Tier 3 is the most advanced option, using information on ozone concentrations and in-stack NO2/NOx ratios. Two procedures are available within AERMOD as Tier 3 options, namely, the Ozone Limiting Method (OLM) and the Plume Volume Molar Ratio Method (PVMRM). Recent versions of AERMOD (starting with version 12345) have incorporated a new ambient ratio method (“ARM2”) as a beta (non-default) option. The ARM2 option appears to be ideally suited to model NOx to NO2 transformation for Diesel sources due in part to the in-stack ratios for the periodic kilns, which change as a function of time throughout the production cycle. Since ARM2 is designated as a “beta” option in AERMOD it is not recognized as being approvable without further justification. Appendix A to this proposal provides a full discussion of the reasons and justification for using ARM2 for Diesel sources. The discussion includes an overview of the documentation provided by the developers of ARM2, and also includes further independent evaluation of ARM2 and discussion of the applicability of ARM2 to the unique features of Diesel sources.
4.2 METEOROLOGICAL DATA
EPA guidelines on air quality modeling recommend the use of five consecutive years of representative meteorological data. The meteorological data was processed using the meteorological pre-processor AERMET (version 14134) by ERM. Five years of meteorological data (2009-2013) from the Elmira Airport (Wban: 14748) was used to provide the surface data; upper air data from the Buffalo International Airport (Wban: 14733) was used to provide the required morning sounding profiles. Buffalo is the closest upper air sounding station to the Diesel site. AERMET is the recommended processor for developing inputs

ERM 16 CORNING: DIESEL – MAY 2015
to AERMOD. AERMET requires, at a minimum, hourly surface data and once-daily upper air sounding profiles.
The processing program produces two files for input to AERMOD: 1) a surface file containing calculated micrometeorological variables (heat flux, stability, and turbulence parameters) that represent the dispersive potential of the atmosphere, and 2) a profile file that provides vertical profiles of wind speed, wind direction, and temperature. In the case of meteorological data files developed from National Weather Service (NWS) data, the profiles contain only one level (the surface level) and a meteorological interface within AERMOD generates profiles of wind, temperature, and turbulence from the input data files.
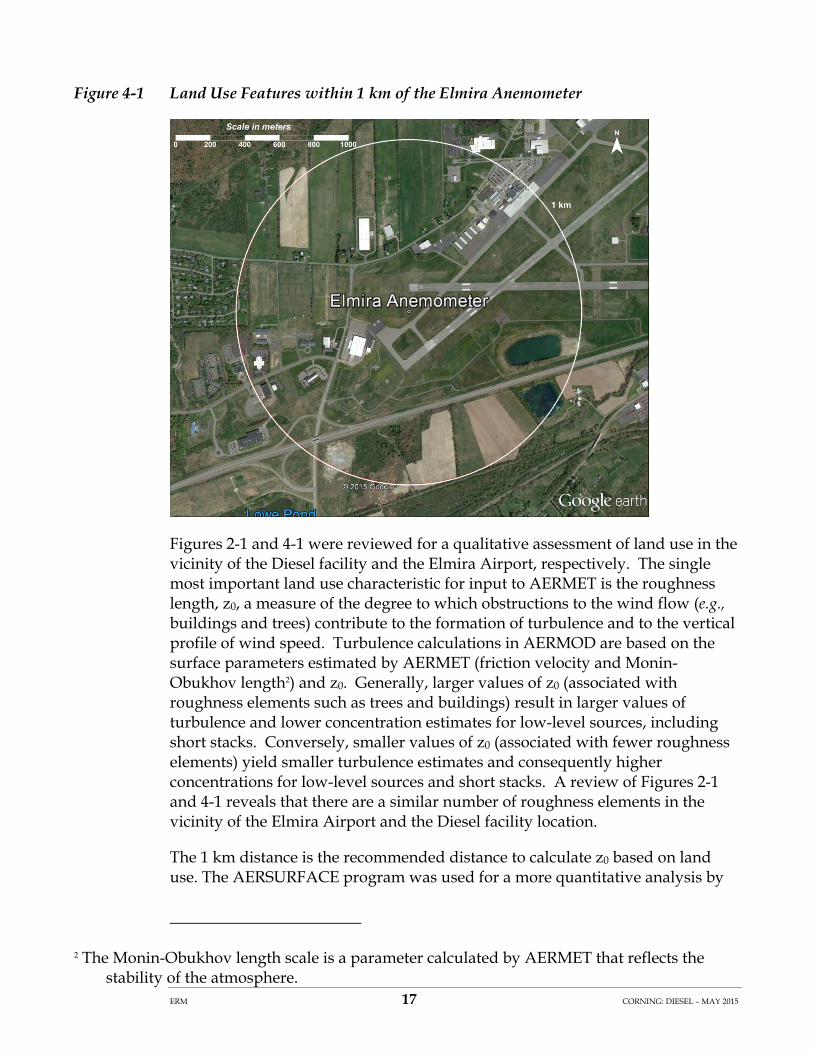
Both EPA and NYSDEC guidelines for determining meteorological inputs to AERMOD require that the user evaluate data representativeness for the site being modeled. This representativeness is a function of land use and terrain near the measurement site (Elmira Airport) compared to land use and terrain in the vicinity of the application site (Diesel facility). Differences are expected between airport land use and land use surrounding almost any application site, and frequently, there are differences in terrain between measurement and application sites. Neither EPA nor NYSDEC have established quantitative criteria for assessing whether differences are significant; therefore, this comparison is based on a qualitative assessment and consideration of the importance of the land use and terrain differences to the analysis. An additional comparison is made between the calculated roughness length (z0) using EPA’s AERSURFACE program (version 13016) for both the facility and airport locations. Figure 4-1 shows an aerial image of the land use within 1 kilometer of the anemometer.
ERM 17 CORNING: DIESEL – MAY 2015
Figure 4-1 Land Use Features within 1 km of the Elmira Anemometer
Figures 2-1 and 4-1 were reviewed for a qualitative assessment of land use in the vicinity of the Diesel facility and the Elmira Airport, respectively. The single most important land use characteristic for input to AERMET is the roughness length, z0, a measure of the degree to which obstructions to the wind flow (e.g., buildings and trees) contribute to the formation of turbulence and to the vertical profile of wind speed. Turbulence calculations in AERMOD are based on the surface parameters estimated by AERMET (friction velocity and Monin-Obukhov length2) and z0. Generally, larger values of z0 (associated with roughness elements such as trees and buildings) result in larger values of turbulence and lower concentration estimates for low-level sources, including short stacks. Conversely, smaller values of z0 (associated with fewer roughness elements) yield smaller turbulence estimates and consequently higher concentrations for low-level sources and short stacks. A review of Figures 2-1 and 4-1 reveals that there are a similar number of roughness elements in the vicinity of the Elmira Airport and the Diesel facility location.
The 1 km distance is the recommended distance to calculate z0 based on land use. The AERSURFACE program was used for a more quantitative analysis by
2 The Monin-Obukhov length scale is a parameter calculated by AERMET that reflects the stability of the atmosphere.

ERM 18 CORNING: DIESEL – MAY 2015
calculating z0 for both locations. Table 4-1 displays the seasonal values of z0 resulting from this analysis. The airport AERSURFACE analysis was run with and without the “airport” option, since AERSURFACE analysis treats “airport” land use as flat to account for runways, however some of the developed land within 1 km is associated with buildings and structures that would increase the estimate of z0. Table 4-1 illustrates larger values of z0 for the Diesel site for Summer and Fall and similar values for Winter and Spring, which results in similar seasonal patterns for the two sites.
Table 4-1 AERSURFACE Analysis: Seasonal Zo Values (in meters)
Figure 4-2 depicts wind roses based on measured wind speeds and directions from 2009-2013 at the Elmira Airport. These wind roses show that plumes from the Diesel facility stacks will be transported most frequently towards the northeast due to the prevailing winds from the southwest.
Season
Elmira Airport
(Airport Option)
Elmira Airport
(No Airport Option) Diesel Site
Winter 0.071 0.104 0.077
Spring 0.101 0.148 0.114
Summer 0.138 0.202 0.321
Fall 0.126 0.184 0.318

ERM 19 CORNING: DIESEL – MAY 2015
Figure 4-2 Wind Roses: Elmira Airport (2009 – 2013)
In conclusion, although differences in land use and terrain exist between the measurement site (Elmira Airport) and the application site (Diesel facility), it appears that those differences result in similar land use characteristics, in particular, the similar seasonal z0 trend. Also, the smaller z0 values for the measurement site will likely tend towards a conservative bias in the model results. For these reasons, ERM used the Elmira meteorological data, as processed by AERMET and provided by NYSDEC, from 2009-2013, as a representative data set for the modeling analysis for the Diesel facility.
4.3 BACKGROUND CONCENTRATIONS
The background monitoring data used in the NO2 and CO modeling analysis was obtained from EPA’s Air Quality Systems (AQS) database and compared with data available from NYS’s Ambient Air Monitoring Program Network Assessment for representative monitoring stations in the vicinity of the facility. For CO and NO2, monitored data collected from the Pinnacle State Park site (Site ID 36-101-0003) was used for the air impact assessment. This monitoring station is approximately 4.5 kilometers to the southwest of the Diesel facility. The “design value” for this site, the three year average of the 98th percentile of the maximum daily 1-hour NO2 concentration, is 14 ppb or 26.3 micrograms/cubic meter. The Pinnacle State Park site no longer monitors NO2; this design value
Wind Speed (m/s)
0.0 1.5 3.0 4.5 6.0 >1.5 3.0 4.5 6.0 8.0 8.0
Circles representfollowing frequencies:2.8 5.6 8.4 11.2 14.0 %
Percent <0.5 m/sPercent <1.0 m/sAverage Speed m/s
0.546.60
0.665.61
0.454.80
0.304.16
0.132.33
0.414.70
0.0014.052.71
0.0012.032.89
0.0014.202.74
0.0014.802.77
0.0014.252.85
0.0013.872.79
2009
2010
2011
2012
2013
5 Year
Elmira NWS2009-2013
Percent MissingPercent Calm

ERM 20 CORNING: DIESEL – MAY 2015
represents the years 2009-2011. The suggestion in EPA’s March 1, 2011 memorandum was followed, namely, that a season/hour-of-day matrix was developed that represents a refinement to the use of the design concentration. The maximum annual average NO2 concentration for the period 2009-2011 (4.2 micrograms/cubic meter) was used for the annual averaging period for NO2. The max daily 1-hour CO concentration from the Pinnacle site, during 2011-2013, is 0.5 ppm or 570 micrograms/cubic meter; max daily 8-hour CO concentration from the Pinnacle site, during 2011-2013, is 0.4 ppm or 456 micrograms/cubic meter.
4.4 RECEPTOR GRID
A comprehensive receptor grid expanding out to twenty-five kilometers around the facility was developed for this analysis. A Cartesian plant boundary was created representing the fence line, excluding public access, from which receptors were created in a fence line receptor grid. A multi-tier Cartesian grid extending approximately twenty-five kilometers in each direction was used with the following spacing criteria:
50 meter spacing along the fenceline 70 meter spacing from the fenceline out to 500 m 100 meter spacing 500 m to 1 km 200 meter spacing 1 to 2 km 300 meter spacing 2 to 4 km 400 meter spacing 4 to 6 km 600 meter spacing 6 to 10 km 800 meter spacing 10 to 15 km 1000 meter spacing 15 to 25 km
Terrain elevations were assigned to each receptor, and a hill scale was calculated with the AERMAP terrain processor. AERMAP is a companion program to AERMOD that uses digitized NED files to assign elevations and hill scales to receptors. The hill scale assigned to each receptor is used by AERMOD to determine the appropriate terrain algorithm to use for the receptor. AERMOD calculates a critical dividing streamlined height, based on the hill scale that divides the approach flow towards the hill into two parts: 1) one that rises over the terrain obstacle, and 2) one that passes around the side of the obstacle. Based on the plume height relative to the terrain and relative to the receptor, AERMOD calculates concentration contributions from different parts of the plume following the different flow regimes. The receptor elevations were assigned using the NED files for UTM Zone 18, North American Datum of 1983 (NAD83). Figures 4-3 and 4-4 display receptor locations at two different scales; receptor elevations are also shown.

ERM 21 CORNING: DIESEL – MAY 2015
Figure 4-3 Receptor Grid for the Diesel Facility: Small Scale
Figure 4-4 Receptor Grid for the Diesel Facility: Medium Scale

ERM 22 CORNING: DIESEL – MAY 2015
4.5 GOOD ENGINEERING PRACTICE (GEP) STACK HEIGHT ANALYSIS
Aerodynamic downwash has the potential to increase ground-level concentrations from stack sources above the concentrations that would be predicted in the absence of these effects. Downwash is handled in air quality models through the use of arrays of direction-specific building dimensions, determined through the use of EPA’s Building Profile Input Program – Plume Rise Enhancement Model (BPIP-PRIME). BPIP-PRIME generates direction-specific building heights and widths for a given stack. BPIP-PRIME also calculates a Good Engineering Practice (GEP) stack height above which the downwash from the buildings do not have any impact on the emissions from the stack. A BPIP-PRIME analysis was performed for each stack. Figure 4-5 shows the locations of all stacks, the outline and heights of all structures entered into BPIP, and the facility fenceline. Figure 4-5 also displays elevation contours that were derived from the NED files.
Figure 4-5 Stack Locations, Structure Heights, Fenceline

ERM 23 CORNING: DIESEL – MAY 2015
4.6 AIR QUALITY STANDARDS
The impacts of emissions of NO2, CO and HF from the facility were evaluated using AERMOD. Modeling was conducted for NOx initially to evaluate the effect of the project alone on the significant impact levels for NO2 1-hour (7.5 ug/m3) and annual averages (1.0 ug/m3). This initial modeling was conducted with the default ARM option within AERMOD. As discussed in Section 5, the project exceeds the SIL for NO2 for both averaging periods. Subsequent modeling was conducted to take into account nearby sources of NOx and measured concentrations for NO2 and CO. The results of the analysis are compared to the EPA National Ambient Air Quality Standards (NAAQS) and 6 NYCRR Part 257-8.3 AAQS for Gaseous Fluorides. The applicable EPA and NYSDEC standards are summarized in Table 4-2.
Table 4-2 EPA and NYSDEC Standards
Values are provided in micrograms/cubic meter, except as noted.
4.7 EFFECTS ON SOILS, VEGETATION, AND VISIBILITY; EFFECTS OF GROWTH
The PSD regulations require an evaluation of the air quality effects of commercial, residential, industrial and other growth due to a project, and an evaluation of the effects of project emissions on soils, vegetation, and visibility. Corning has performed this review for NOx emissions as required. The impacts of the Project on growth will not be significant, since the changes will occur at an existing manufacturing facility with no changes in the overall footprint. As discussed in Section 5, modeling shows that the project is in compliance with the NAAQS for NO2, which are protective of potential secondary effects on soils and vegetation.
Pollutant Averaging PeriodEPA / NYSDEC
Standard
1-hour 188 (100 ppb)
Annual 100 (53 ppb)
8-hour 10,000 (9 ppm)
1-hour 40,000 (35 ppm)
12-hour 3.7
24-hour 2.85
1 Week 1.65
1 Month 0.8
HF - AAQS
NO2 - NAAQS
CO - NAAQS
ERM 24 CORNING: DIESEL – MAY 2015
Corning has evaluated potential visibility related effects due to project-related emissions of NOX on regional Class II state parks. The USEPA VISCREEN (Version 1.01, dated 13190) model was used, with default Level-1 screening assumptions described in USEPA guidance3. The closest State Park to the Diesel facility, Pinnacle State Park, located approximately 4.5 km southwest of Diesel, was evaluated with this methodology. The VISCREEN model results are presented here.
The screening procedure determines the light scattering impacts of particulates, including sulfates and nitrates, with a mean diameter of two micrometers (μm) and a standard deviation of two (2) μm. The VISCREEN model evaluates both plume perceptibility and contrast against two backgrounds, sky and terrain. The VISCREEN model provides three (3) levels of analysis, the first two (2) of which are screening approaches. The Level-1 VISCREEN analysis was selected for this analysis. The Level-1 VISCREEN assessment uses a series of default criteria values to assess the visible impacts. If the source passes the criteria defined for a Level-1 VISCREEN assessment (ΔE<2.0 and Cp<0.05), potential for visibility impairment is not expected to be significant and no further analysis is necessary. If a source fails the Level-1 criteria, more refined assumptions would be necessary.
The Level-1 VISCREEN analysis was performed for the Pinnacle State Park, using the project increases of NOX. The emissions of primary NO2, soot, and SO4 were set equal to the Level-1 VISCREEN default of 0.00 grams per second (g/s). The emission rates and other VISCREEN input assumptions are summarized in Table 4-3; VISCREEN results are summarized in Table 4-4. As shown in Table 4-4, the screening criteria are met.
3 USEPA, Workbook for Plume Visual Impact Screening and Analysis (Revised), EPA-454/R-92-023, 1992.

ERM 25 CORNING: DIESEL – MAY 2015
Table 4-3 VISCREEN Model Input Data
Table 4-4 VISCREEN Model Results
Parameter Value
Total NOx as NO2 27
Primary NO2 0
PM10 0
Soot (elemental C) 0
Primary SO4 0
Background Ozone (ppm) 0.04
Background visual range (km) 20
Source‐observer distance (km) 5
Minimum source distance (km) 4.5
Maximum source distance (km) 6
Stability 6
Wind Speed (m/s) 1
Project Emission Rates (Total Project
Emissions, lbs/hr)
VISCREEN Output a
Thetab Azimuthc Distance Alphad
(degrees) (degrees) (km) (degrees) Criteria Plume Criteria Plume
Sky 10 127 6 42 2.44 1.964 0.05 -0.006Sky 140 127 6 42 2 0.612 0.05 -0.006Terrain 10 56 4.5 112 2 0.647 0.05 0.001Terrain 140 56 4.5 112 2 0.201 0.05 0.001
c Azimuth is the angle between the line connecting the source, observer and the line of sight d Alpha is the angle between the line of sight and the plume centerlinee Plume perceptibility parameter (dimensionless)f Visual contrast against background parameter (dimensionless)
a Based on emissions increaseb Theta is the vertical angle subtended by the plume
Contrast (C)f
Inside Surrounding Area
Background
Perceptibility (ΔE)e

ERM 26 CORNING: DIESEL – MAY 2015
MODELING RESULTS 5.0
ERM has conducted modeling with the meteorological, source and receptor information described in this protocol. Maximum predicted results for the respective averaging periods over all years and receptors have been identified for comparison to applicable air quality standards – NAAQS and NYSDEC AAQS. Model results for 1-hour NO2 reflect averages over 5 years to be consistent with the form of the standard. Model results for annual NO2, and for all averaging periods for CO and HF, reflect maximum values over 5 years to be consistent with the form of the applicable standard. Results are presented in both graphical and tabular format in the following sections.
5.2 RESULTS OF SIL MODELING FOR NO2
The sources listed in Table 2-1 were modeled with the “net change” emissions reflecting an increase over baseline of approximately 157 tons per year to determine the extent of the Project impacts on annual NO2 concentrations. The comparison to the SIL for 1-hour NO2 was conducted by considering the impacts of the new small combustion sources at the facility. The default ARM approach (that applies a factor of 0.8 to 1-hour concentrations and a factor of 0.75 to annual concentrations) was used with AERMOD to provide a conservative estimate of impacts. The maximum predicted 1-hour concentration (highest daily maximum, averaged over 5 years) was 92.3 micrograms/cubic meter, greater than the interim SIL of 7.5 micrograms/cubic meter. The maximum annual average over 5 years was 22.5 micrograms/cubic meter, above the SIL of 1.0 micrograms/cubic meter. Receptors as far away as 25 kilometers from Diesel show impacts greater than the 1-hour SIL; these impacts are associated with low wind-speed, stable atmospheric conditions and terrain elevations in a narrow band at predicted plume heights. Impacts at these distances represent a conservative estimate due to plume travel time (nearly 8 hours at a wind speed of 1.0 m/s); nonetheless, all receptors within the 25 km radius were included in the multisource modeling.
5.3 BACKGROUND SOURCE INVENTORY
An inventory of major NOx sources within the impact area of the Diesel facility was requested from NYSDEC. ERM reviewed the information provided, including source permits, and evaluated whether these sources have the potential to create a significant concentration gradient in the vicinity of Diesel. Most sources identified were more than 25 kilometers from Diesel; based on distance alone, it is highly unlikely that these sources would cause a significant 1-hour concentration gradient in the vicinity of Diesel. An examination of meteorological conditions associated with high predicted concentrations from Diesel sources reveals that for the top 1000 hours, the wind speed is an average of 1.2 m/s. At this transport speed, it would take nearly 6 hours for emissions to
ERM 27 CORNING: DIESEL – MAY 2015
travel 25 kilometers. This supports a conclusion that sources beyond 25 kilometers would not cause a significant concentration gradient in the vicinity of Diesel, and are therefore not included in the multisource modeling inventory. This approach is consistent with the recommendations in the March 1, 2011 EPA memorandum dealing with modeling to show compliance with the NO2 1-hour NAAQS:
Even accounting for some terrain influences on the location and gradients of maximum 1-hour concentrations, these considerations suggest that the emphasis on determining which nearby sources to include in the modeling analysis should focus on the area within about 10 kilometers of the project location in most cases. The routine inclusion of all sources within 50 kilometers of the project location, the nominal distance for which AERMOD is applicable, is likely to produce an overly conservative result in most cases.
There is one facility with a greater potential to cause a significant 1-hour concentration gradient in the vicinity of Diesel, namely the Erwin manufacturing complex, located approximately 1 kilometer to the east of Diesel. Erwin was included in the multisource modeling; model inputs for Erwin are presented in Appendix C.
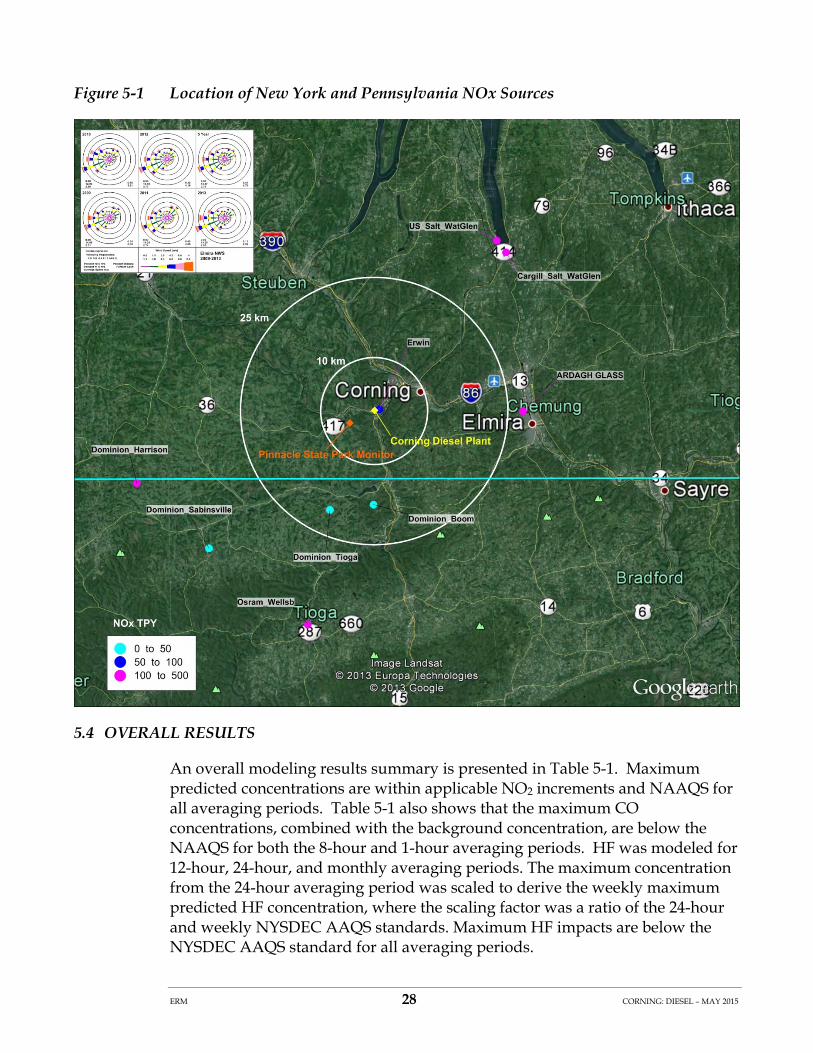
The Pennsylvania Department of Environmental Protection (PADEP) also provided an inventory of NOx sources in Pennsylvania, within 50 kilometers of Diesel. None of the Pennsylvania sources are likely to create a significant concentration gradient in the vicinity of Diesel. This is based on the location of the sources to the south and southwest of Diesel, the magnitude of the emissions, and the fact that the monitoring station selected for determining background concentrations is in between the source locations and Diesel. The background monitoring station is therefore likely to reflect impacts from these Pennsylvania sources. Figure 5-1 shows the locations the Diesel facility relative to other NOx sources considered and the background monitoring station.
ERM 28 CORNING: DIESEL – MAY 2015
Figure 5-1 Location of New York and Pennsylvania NOx Sources
5.4 OVERALL RESULTS
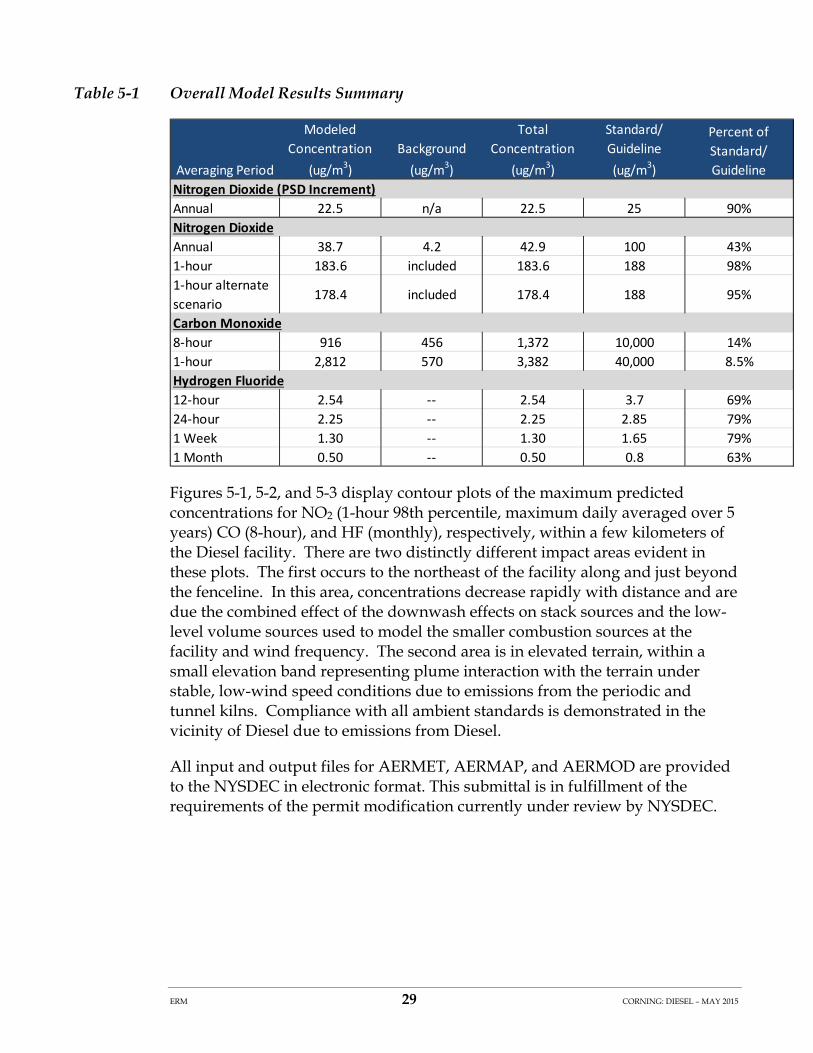
An overall modeling results summary is presented in Table 5-1. Maximum predicted concentrations are within applicable NO2 increments and NAAQS for all averaging periods. Table 5-1 also shows that the maximum CO concentrations, combined with the background concentration, are below the NAAQS for both the 8-hour and 1-hour averaging periods. HF was modeled for 12-hour, 24-hour, and monthly averaging periods. The maximum concentration from the 24-hour averaging period was scaled to derive the weekly maximum predicted HF concentration, where the scaling factor was a ratio of the 24-hour and weekly NYSDEC AAQS standards. Maximum HF impacts are below the NYSDEC AAQS standard for all averaging periods.
ERM 29 CORNING: DIESEL – MAY 2015
Table 5-1 Overall Model Results Summary
Figures 5-1, 5-2, and 5-3 display contour plots of the maximum predicted concentrations for NO2 (1-hour 98th percentile, maximum daily averaged over 5 years) CO (8-hour), and HF (monthly), respectively, within a few kilometers of the Diesel facility. There are two distinctly different impact areas evident in these plots. The first occurs to the northeast of the facility along and just beyond the fenceline. In this area, concentrations decrease rapidly with distance and are due the combined effect of the downwash effects on stack sources and the low-level volume sources used to model the smaller combustion sources at the facility and wind frequency. The second area is in elevated terrain, within a small elevation band representing plume interaction with the terrain under stable, low-wind speed conditions due to emissions from the periodic and tunnel kilns. Compliance with all ambient standards is demonstrated in the vicinity of Diesel due to emissions from Diesel.
All input and output files for AERMET, AERMAP, and AERMOD are provided to the NYSDEC in electronic format. This submittal is in fulfillment of the requirements of the permit modification currently under review by NYSDEC.
Averaging Period
Modeled
Concentration
(ug/m3)
Background
(ug/m3)
Total
Concentration
(ug/m3)
Standard/
Guideline
(ug/m3)
Percent of
Standard/
Guideline
Annual 22.5 n/a 22.5 25 90%
Annual 38.7 4.2 42.9 100 43%
1‐hour 183.6 included 183.6 188 98%
1‐hour alternate
scenario178.4 included 178.4 188 95%
8‐hour 916 456 1,372 10,000 14%
1‐hour 2,812 570 3,382 40,000 8.5%
12‐hour 2.54 ‐‐ 2.54 3.7 69%
24‐hour 2.25 ‐‐ 2.25 2.85 79%
1 Week 1.30 ‐‐ 1.30 1.65 79%
1 Month 0.50 ‐‐ 0.50 0.8 63%
Nitrogen Dioxide (PSD Increment)
Nitrogen Dioxide
Carbon Monoxide
Hydrogen Fluoride

ERM 30 CORNING: DIESEL – MAY 2015
Figure 5-2 Concentration Contours: NO2 1-hour

ERM 31 CORNING: DIESEL – MAY 2015
Figure 5-3 Concentration Contours: CO 1-hour

ERM 32 CORNING: DIESEL – MAY 2015
Figure 5-4 Concentration Contours: HF Monthly
6.0 SUMMARY AND CONCLUSIONS
A modeling analysis to evaluate ambient impacts due to emissions from the modifications at the Diesel facility was performed. To show compliance for this PSD modification, Corning conducted modeling to demonstrate compliance with the NAAQS and PSD increments for NO2. Modeling was also conducted for CO and HF at the request of NYSDEC. Emissions from these pollutants were modeled to determine off-site impacts surrounding the facility. The dispersion modeling results document:
Maximum impacts of increased emissions comply with the PSD increment for NO2;

ERM 33 CORNING: DIESEL – MAY 2015
Maximum predicted impacts comply with the 1-hour and annual NAAQS for NO2;
Maximum predicted impacts due to emissions from the Diesel facility comply with ambient standards for CO and HF.

ERM CORNING: DIESEL – MAY 2015
APPENDIX A
ARM2 JUSTIFICATION AND PROTOCOL
Corning Diesel Modeling Report Appendix A Page A-1
Justification and Protocol for Application of the Ambient Ratio Method 2 (ARM2) for the Corning Diesel Facility NO2 Ambient Impact Analysis (Corning, NY) Summary and Conclusions: Application of ARM2 for Corning Diesel Corning Diesel submitted a justification and protocol for using ARM2 for NOx sources at the Diesel facility to NYSDEC and EPA Region II on July 25, 2014. Subsequently, EPA presented a webinar (August 14, 2014) on guidance for justifying ARM2 that was under development. Corning Diesel submitted additional information on September 11, 2014 that addressed issues raised in the webinar. On September 30, 2014, EPA issued a clarification memorandum1 as a follow-on to the webinar, that provided additional guidance on justifying the use of ARM2. EPA Region II continued to review Corning’s submittals, along with NYSDEC and EPA OAQPS, and had a question regarding individual source contributions to high predicted NOx ambient levels. Corning conducted additional modeling and provided results and modeling files to NYSDEC and EPA Region II. An additional question was posed by EPA Region II to Corning that indicated that approval of ARM2 in this case would also need a demonstration to ensure that the ARM2 approach is at least as conservative as the applicable Tier 3 methodology. This document addresses all of the questions and comments on ARM2 provided by NYSDEC and EPA Region II, and concludes the following:
Based on the variability of the NO2/NOx ratio for the periodic kilns, and the lack of a capability to specifically account for this variability with Tier 3 methods (OLM and PVMRM), Corning proposes to use the ARM2 methodology to model the atmospheric transformation of NOx emissions to NO2.
Conservative values for stack parameters and emission rates are being used as AERMOD inputs. For example, the smaller sources at the facility are being modeled as though they operate year-round, 8760 hours per year at the rated capacity when in fact actual operations will be less frequent; the periodic kilns are being modeled using the lower exhaust flow and temperature from the projected cycles.
An independent evaluation of the basis for development of ARM2 shows that the method is conservative with respect to measured ratios for sites with surroundings similar to Diesel, and that recent measurements (2009-
1 “Clarification on the Use of AERMOD Dispersion Modeling for Demonstrating Compliance with the NO2 National Ambient Air Quality Standard” From: R. Chris Owen and Roger Brode To: Regional Dispersion Modeling Contacts. September 30, 2014.

Corning Diesel Modeling Report Appendix A Page A-2
2012) show that ARM2 is more conservative than indicated based on earlier measurements (prior to 2009). NO2/NOx ratios and NOx comparisons for the 2009-2012 time period were based on over 2 million data points.
An independent evaluation of the travel time (plume age) and diurnal patterns of Diesel NOx predictions are consistent with expected lower conversion rates due to small travel times, and the diurnal patterns are consistent with the diurnal patterns reflected in the measurements.
Ozone and background NO2 concentrations are at levels that would support the use of ARM2 according to EPA guidance. NO2 background concentrations are typically less than 20 micrograms/cubic meter (ug/m3); ozone concentrations only rarely exceed 80 ppb.
Modeling shows that the periodic kilns and the small miscellaneous sources contribute the highest NOx concentrations (periodic kilns with a higher in-stack ratio, small sources with a low ratio).
An upper bound for the ARMRATIO has been calculated based on the use of OLM with several projected future scenarios, including some with emissions for the periodic kilns that are higher than the proposed rates. Corning proposes to use a ratio of 0.54 in the compliance modeling.
The additional modeling and analyses performed in response to questions and comments from NYSDEC and EPA Region II are documented here, and are aimed at addressing the criteria for approval discussed in the OAQPS clarification memo.
Corning believes that the ARM2 technique as described in this document is justified for use for Diesel NOx sources and will provide conservative estimates of future potential impacts for demonstrating compliance with the 1-hour NAAQS for NO2. Introduction The U.S. EPA promulgated a new 1-hour National Ambient Air Quality Standard (NAAQS) for NO2 with an effective date of April 12, 2010. The 1-hour NAAQS must be addressed along with the existing annual NO2 NAAQS in PSD analyses to address compliance with the NAAQS and with the PSD increment (annual only). Air quality modeling for NO2 requires special consideration since emissions that affect ambient NO2 concentrations are predominantly in the form of nitrogen oxide (NO), which converts in the atmosphere to NO2 in the presence of ozone. The ambient ratio method 2 (ARM2) is an option within EPA’s preferred guideline air quality model AERMOD that directly addresses the conversion, and is proposed for use in the NO2 modeling to be conducted for the Diesel facility. The ARM2 option is currently a “beta” (non-default) option within AERMOD, and thus requires justification in order to apply it for a specific

Corning Diesel Modeling Report Appendix A Page A-3
setting. The justification presented here is focused on the NO2/NOx ratios inherent in ARM2, not the underlying dispersion techniques embodied in AERMOD which is an EPA preferred model. EPA published a clarification memorandum on September 30, 2014 that addressed requirements for justifying the use of ARM2 in AERMOD. The memorandum made the following recommendations with respect to the use of ARM2:
The EPA testing and evaluation of the ARM2 method indicates that ARM2 appears to be an appropriate Tier 2 NO2 modeling method in some cases and should be approved for usage as an alternative modeling option in these cases. These cases are:
1. The primary source/facility has made a demonstration that the source/facility has a NO2/NOx in-stack ratio (ISR) of less than 0.2 (for 95% or more of the short-term NOx emissions);
2. The primary source/facility has made a demonstration that the total modeled NOx from the source/facility is less than 150-200 ppb.
3. The background ozone is not persistently above approximately 80-90 ppb.
If these conditions are not met, then ARM2 may underestimate ambient NO2/NOx ratios and so either a Tier III approach should be utilized or ARM2 should be applied with additional caution/considerations.
The EPA clarification memorandum states further:
If the source has a known ISR greater than 0.2, then ARM2 may be used, but the minimum ARM2 ratio should be adjusted to match the source’s ISR. If a source has multiple stacks with varying ISRs, then nominally, the minimum ARM2 ratio should be set to the maximum source ISR. However, the sensitivity tests indicate that there could be some leeway with the minimum ARM2 ratio based on the relative locations of the stacks and the receptors with the maximum modeled impact and the prevailing wind directions.
As shown by stack testing, some of the NOx sources at Diesel have measured in-stack ratios greater than 0.2. Furthermore, total modeled NOx from the facility is shown to be greater than the 150 – 200 ppb range for a limited number of hours. Nonetheless, Corning believes that the ARM2 methodology is justified for use at the Diesel facility with an appropriately set minimum ratio. This document

Corning Diesel Modeling Report Appendix A Page A-4
describes the development of the proposed minimum ratio and justification for its use. The ARM2 justification is different than the justification typically prepared for the non-regulatory “Tier 3” options for modeling the conversion of NOx to NO2, namely the Ozone Limiting Method (OLM) and the Plume Volume Molar Ratio Method (PVMRM). Two memoranda issued by EPA’s Office of Air Quality Planning and Standards (OAQPS) provide guidance on the justification for using OLM and PVMRM2,3. According to these memoranda, OLM and PVMRM are non-regulatory “Tier 3” options that require justification and approval by the Regional Office on a case-by-case basis. Notwithstanding the need for this justification, EPA believes generally that Tier 3 approaches should be approved, based on evaluations conducted by the agency. In the March 1, 2011 memorandum EPA states that “We believe that these additional model evaluation results lend further credence to the use of these Tier 3 options in AERMOD for estimating hourly NO2 concentrations, and we recommend that their use should be generally accepted provided some reasonable demonstration can be made of the appropriateness of the key inputs for these options, the in-stack NO2/NOx ratio and the background ozone concentrations.” Tier 3 approaches are not directly appropriate for the Corning NOx sources, primarily due to the fact that for one group of sources, the periodic kilns, measured in-stack ratios vary widely (maximum approximately 0.9, minimum approximately 0.1) over the course of production cycles that can last for several days. The additional caution/considerations mentioned in the clarification memo revolve mainly around defining an appropriate minimum ARM2 ratio for input to AERMOD. Corning’s original proposal for developing this minimum ratio involved the calculation of an “emissions-weighted” ratio. Subsequent questions and concerns raised by NYSDEC and EPA indicated that further justification would be required. The further justification should include a demonstration regarding specific source contributions, and a demonstration is needed to compare the ARM2 approach with an appropriate Tier 3 method with the goal of showing that ARM2 is at least as conservative as the Tier 3 method. Corning has conducted additional modeling to investigate source contributions, and has conducted additional modeling using OLM. The model version and options, meteorology, and receptors for all subsequent modeling discussions are
2 “Additional Clarification Regarding Application of Appendix W Modeling Guidance for the 1-hour NO2 National Ambient Air Quality Standard” From: Tyler Fox, Leader, Air Quality Modeling Group; To: Regional Air Division Directors. March 1, 2011. 3 “Guidance Concerning the Implementation of the 1-hour NO2 NAAQS for the Prevention of Significant Deterioration Program” From: Stephen D. Page, Director, Office of Air Quality Planning and Standards; To: Regional Air Division Directors. June 29, 2010.

Corning Diesel Modeling Report Appendix A Page A-5
identical to those that are described in the main report, with the exception of the NOx to NO2 approach as described below. Source Contributions Modeling was conducted with full conversion for all sources to determine which source or group of sources contribute most significantly to maximum concentrations. This analysis was conducted in part to address the clarification memo guidance:
If the source has a known ISR greater than 0.2, then ARM2 may be used, but the minimum ARM2 ratio should be adjusted to match the source’s ISR. If a source has multiple stacks with varying ISRs, then nominally, the minimum ARM2 ratio should be set to the maximum source ISR. However, the sensitivity tests indicate that there could be some leeway with the minimum ARM2 ratio based on the relative locations of the stacks and the receptors with the maximum modeled impact and the prevailing wind directions.
The results of this analysis are presented here:
A series of figures is also presented, to illustrate the spatial patterns of NOx 1-hour concentrations for the three largest contributing groups of sources (periodic kilns, tunnel kilns, volume sources), for the overall NOx concentrations, and for the overall NO2 1-hour concentrations (a figure that is also presented in the main body of the report). For each of these figures, the values displayed in the
Source/Group
1st High 8th High 1st High 8th High 1st High 8th High 1st High 8th High
ALL (Includes background) 426 328 227 175 341 263 181 140
ALL (No background) 408 315 217 168 327 252 174 134
All Periodic 283 218 151 116 227 175 121 93
PK_19 80 61 42 33 64 49 34 26
PK_20 73 57 39 30 58 46 31 24
PK_21 73 59 39 31 59 47 31 25
PK_22 90 79 48 42 72 63 38 34
All Tunnel Kilns 198 180 105 96 158 144 84 76
Tunnel Kiln 1 76 70 41 37 61 56 32 30
Tunnel Kiln 2 67 50 36 26 54 40 28 21
Tunnel Kiln 3 65 57 34 30 52 46 28 24
Tunnel Kiln 4 64 52 34 28 51 41 27 22
N2 Pad Evaporators 161 120 86 64 129 96 68 51
Volume Sources 276 206 147 110 220 165 117 88
Full Conversion ARM Conversion (80%)
ug/m3 ppb ug/m3 ppb

Corning Diesel Modeling Report Appendix A Page A-6
contours represent the “design value”, i.e. the 98th percentile of the maximum daily concentration, averaged over five years. Figure 1: NOx Concentrations Periodic Kiln Sources 1-hr 98th Percentile

Corning Diesel Modeling Report Appendix A Page A-7
Figure 2: NOx Concentrations Tunnel Kiln Sources 1-hr 98th Percentile

Corning Diesel Modeling Report Appendix A Page A-8
Figure 3: NOx Concentrations Volume Sources 1-hr 98th Percentile

Corning Diesel Modeling Report Appendix A Page A-9
Figure 4: NOx Concentrations All Sources 1-hr 98th Percentile

Corning Diesel Modeling Report Appendix A Page A-10
Figure 5: NOx Concentrations All Sources 1-hr 98th Percentile >235 ug/m3

Corning Diesel Modeling Report Appendix A Page A-11
Figure 6: NO2 Concentrations All Sources 1-hr 98th Percentile
This summary and the figures show that no single group of sources dominates the overall maximum concentrations. Each of the larger impact groups - periodic kilns, tunnel kilns, and small combustion (volume) sources – are shown individually to meet the 1-hour NO2 NAAQS with the default ARM ratio of 0.8. Figure 5 shows the limited extent of NOx impacts where the potential exists to exceed the 1-hr NO2 NAAQS using the conservative ARM ratio. These areas include an area immediately to the north in elevated terrain (primarily periodic kilns with some contribution from the tunnel kilns and small combustion sources); an area to the northeast with the highest overall concentrations

Corning Diesel Modeling Report Appendix A Page A-12
(primarily small combustion sources with some contribution from the periodic and tunnel kilns); and areas close to the fenceline to the east and further away on terrain (these areas have contributions from all sources). Impacts to the east and northeast are generally in the predominant wind direction (west to southwest). Since the maximum impacts are not dominated by the sources with the highest in-stack ratios (occasionally for the periodic kilns, and some of the tunnel kilns), an alternative minimum ratio is justified.
Corning Diesel Modeling Report Appendix A Page A-13
Modeling with OLM OLM was selected as the Tier 3 method for conducting a series of sensitivity tests. This selection of OLM was made based on the nature of the sources at Corning Diesel, following guidance contained in the clarification memo:
Both PVMRM and OLM Tier 3 methods may be used for non-point sources, including roadways. However, PVMRM is most appropriate with relatively isolated and elevated sources, while OLM is more appropriate for area sources, near-surface releases, or scenarios with multiple sources where plume overlap is likely to occur. In these cases, the OLMGROUP ALL option is recommended to better account for competition of ozone.
The OLMGROUP ALL option was used in this analysis. Hourly ozone concentrations for the years 2009-2013, from the Pinnacle State Park monitor (the closest measurement site to Diesel) were used as input to OLM. Use of the single highest value of the in-stack ratio for the periodic kilns is problematic in that it would result in over-estimation of the impacts – the kilns are operated in a manner such that no more than two kilns are in the high ratio part of the cycle simultaneously. To address concerns that ARM2 may not be as conservative as OLM, a number of scenarios involving emissions and in-stack ratios were developed. The tunnel kilns were modeled at constant rates and ratios, as were the volume sources. The periodic kilns were modeled initially with a “realistic future actual” scenario – 2 kilns at the high ratio part of the cycle, 2 kilns at the low ratio part of the cycle, with a NOx emission rate set at the highest average value over future projected cycles. The results of this first scenario showed that the NAAQS would be met with room to spare. Several additional scenarios were then tested based on potential future operating scenarios, intended to represent a range of operations. For each one, modeling was conducted with both OLM and ARM2. The ARM2 minimum ratio was set at 0.54, a value that was developed to ensure a reasonable degree of conservativeness over all of these scenarios as displayed in the table below. An examination of the results of these tests indicate that the higher concentrations predicted by OLM occur at a very limited number of receptors. An additional metric was calculated that represents the average prediction, for any initial NOx concentration greater than 188 ug/m3, for both OLM and ARM2. As shown below, ARM2 concentration calculated in this manner is always higher than the OLM concentration. The results of this analysis are presented here:

Corning Diesel Modeling Report Appendix A Page A-14
OLM has thus been used to establish an appropriate minimum ratio for use in AERMOD with ARM2; Corning proposes to use a minimum ratio of 0.54, in conjunction with ARM2, in the modeling analysis for compliance with the NO2 NAAQS. Background and additional analyses for the API study The ARM2 method has been thoroughly evaluated, as presented in a document prepared for the American Petroleum Institute (API)4. However, EPA to-date has not produced guidance or statements regarding these evaluations, or any independent evaluations analogous to the evaluations performed for OLM and PVMRM. Thus a justification for the use of ARM2 must provide additional analyses to ensure that the technique is appropriate for a specific application. The purpose of this protocol is to provide specific analyses and documentation that ARM2 is applicable for the NO2 modeling to be conducted for the Diesel NOx emissions.
4 “Ambient Ratio Method Version 2 (ARM2) for use with AERMOD for 1-hr NO2 Modeling - Development and Evaluation Report”. Prepared for American Petroleum Institute, 1220 L Street NW, Washington, DC 20005. Prepared by RTP Environmental Associates, Inc., 2031 Broadway, Suite 2, Boulder, Colorado 80302. September 2013.
A B C D E FMax one PK lbs/hr 2.57 5.22 4.29 4.29 4.70 5.61
Sum over PK lbs/hr 10.28 15.58 16.33 16.33 18.80 22.44
OLM Result 161.30 173.13 187.77 184.12 177.83 161.60
OLM Average 192.73 195.35 198.53 198.26 196.24 192.68
ARM2 Min. Ratio 0.540 0.540 0.540 0.540 0.540 0.540
ARM2 Result 168.05 178.11 175.21 173.97 177.94 183.55ARM2 Average 204.69 205.22 204.80 205.10 204.70 200.71
Sources: ISR lbs/hr ISR lbs/hr ISR lbs/hr ISR lbs/hr ISR lbs/hr ISR lbs/hr
Periodic Kilns n/a n/a n/a n/a n/a n/a
E0019 0.840 2.570 0.840 2.570 0.840 3.873 0.200 4.294 0.840 4.700 0.200 5.610
E0020 0.840 2.570 0.840 2.570 0.840 3.873 0.200 4.294 0.200 4.700 0.200 5.610
E0021 0.200 2.570 0.200 5.220 0.200 4.294 0.840 3.873 0.200 4.700 0.200 5.610
E0022 0.200 2.570 0.200 5.220 0.200 4.294 0.840 3.873 0.200 4.700 0.200 5.610
Tunnel Kilns
E023A 0.740 2.280 0.740 2.280 0.740 2.280 0.740 2.280 0.740 2.280 0.740 2.280
E023B1 0.010 4.890 0.010 4.890 0.010 4.890 0.010 4.890 0.010 4.890 0.010 4.890
E023D 0.056 1.180 0.056 1.180 0.056 1.180 0.056 1.180 0.056 1.180 0.056 1.180
E024A 0.545 2.280 0.545 2.280 0.545 2.280 0.545 2.280 0.545 2.280 0.545 2.280
E023B2 0.006 4.890 0.006 4.890 0.006 4.890 0.006 4.890 0.006 4.890 0.006 4.890
E024D 0.062 1.180 0.062 1.180 0.062 1.180 0.062 1.180 0.062 1.180 0.062 1.180
E620A 0.343 2.280 0.343 2.280 0.343 2.280 0.343 2.280 0.343 2.280 0.343 2.280
E620B 0.136 4.890 0.136 4.890 0.136 4.890 0.136 4.890 0.136 4.890 0.136 4.890
E620C 0.271 1.180 0.271 1.180 0.271 1.180 0.271 1.180 0.271 1.180 0.271 1.180
E621A 0.543 2.280 0.543 2.280 0.543 2.280 0.543 2.280 0.543 2.280 0.543 2.280
E621B 0.050 4.890 0.050 4.890 0.050 4.890 0.050 4.890 0.050 4.890 0.050 4.890
E621C 0.130 1.180 0.130 1.180 0.130 1.180 0.130 1.180 0.130 1.180 0.130 1.180
Misc Combustion Sources
PADS 0.100 1.393 0.100 1.393 0.100 1.393 0.100 1.393 0.100 1.393 0.100 1.393
PADN 0.100 1.393 0.100 1.393 0.100 1.393 0.100 1.393 0.100 1.393 0.100 1.393
Volume Sources ‐ Cold Months 0.100 6.922 0.100 6.922 0.100 6.922 0.100 6.922 0.100 6.922 0.100 6.922Volume Sources ‐ Warm Months 0.100 4.897 0.100 4.897 0.100 4.897 0.100 4.897 0.100 4.897 0.100 4.897
Projected Future
Case
Projected Future
Case
Realistic Case
Actual Future
Projected Future
Case
Projected Future
Case
Projected Future
Case

Corning Diesel Modeling Report Appendix A Page A-15
Generally, the justification for using a non-default approach should be developed in accordance with 40 CFR part 51, Appendix W (Section 3.2.2.e) which states that “an alternative refined model may be used provided that: 1. The model has received a scientific peer review; 2. The model can be demonstrated to be applicable to the problem on a
theoretical basis; 3. The databases which are necessary to perform the analysis are available and
adequate; 4. Appropriate performance evaluations of the model have shown that the
model is not biased toward underestimates; and, 5. A protocol on methods and procedures to be followed has been established.” These five conditions may not apply directly to the use of a beta technique embedded in a model that is a preferred model (as opposed to literally using a different model), but they are being addressed by Corning as part of the overall justification for using ARM2. The rest of this protocol/justification is organized in three parts. The first part presents information on the unique characteristics of the Diesel NOx sources; part 2 presents analyses and evaluations of ARM2 with respect to those characteristics and applicability of ARM2 to Corning sources; and part 3 addresses each of the five conditions for approval of ARM2 as an alternative modeling approach for Diesel. PART 1: Characteristics of Diesel NOx emissions Corning has evaluated measurement data and the theoretical aspect of the formation of NO vs. NO2 in the kilns at the Diesel plant. The results of this evaluation are described here. When nitrogen, which normally exists as the stable molecule N2, is split into the unstable elemental form N and then oxidized (combined with oxygen), compounds referred to as oxides of nitrogen (NOx) are formed. These include primarily nitric oxide (NO), nitrogen dioxide (NO2) and nitrous oxide (N2O). In each case, gaseous nitrogen has been combined with oxygen to form NOx. The formation of NOx requires the presence of nitrogen, the presence of oxygen and a source of energy (usually in the form of heat) to drive the reaction. A description of how each constituent contributes to NOx formation is as follows:
Nitrogen makes up approximately 79% of ambient air. In any type of process using air as an atmosphere, nitrogen will be present in abundance.
Oxygen is present at approximately 21% in ambient air. Similar to nitrogen, in any type of process using air as an atmosphere, oxygen will be present.

Corning Diesel Modeling Report Appendix A Page A-16
Energy as elevated temperature needs to be present to split the normally stable N2 molecule into atomic nitrogen to allow for oxidation. Oxidation of the N molecule will occur at temperatures greater than approximately 1100° F (approximately 590°C) and is exponential with peak temperature.
NOx formed from nitrogen present in the combustion fuel is called “fuel NOx.” Liquid and solid fuels contain fuel-bound nitrogen; however, natural gas does not. The Corning Diesel kilns are fired with natural gas, therefore no fuel NOx is formed in the firing process. Thermal NOx is formed by a series of chemical reactions in which oxygen and nitrogen present at high temperatures dissociate and react to form NOx. Thermal NOx is composed primarily of NO molecules. The Corning Diesel kilns operate at temperatures exceeding 1400°C. Therefore, the majority of the NOx formed in the Corning Diesel kilns is characterized as thermal NOx. The Corning Diesel kilns represent a unique source of NOx. The ceramic firing process requires a complex recipe of high temperatures at various holding times in an environment of air (nitrogen and oxygen). This time/temperature profile cannot be modified – it is required to fuse and give strength to the ceramic catalyst product. Therefore, the proprietary kiln processes must operate with prescribed temperature in an atmosphere containing both nitrogen and oxygen. Both the Diesel Periodic and Tunnel kilns are designed with numerous small gas burners to ensure even and thorough heating and holding. These burners operate with relatively low temperature, transparent blue flames – conditions favorable to minimize NOx formation. Such small, distributed and controlled heating sources are characterized as low NOx emission burners. Larger, hotter, luminous yellow flame burners (those that produce more NOx), are not used in the kilns as they would not be capable of providing the even heat required for the firing process. Unlike other common combustion sources, the Corning Diesel kilns are specifically designed to maintain a high, even temperature for a prescribed time. The kilns are refractory insulation lined to ensure even holding temperatures and to retain heat. Unlike boilers, the kilns do not contain heat transfer surfaces designed to absorb heat and cool the combustion gases. Rather, the Corning Diesel kilns are designed specifically to maintain and hold the desired high temperatures needed for the process – creating ideal conditions for thermal NOx formation. The two important steps in the formation of thermal NOx are the following:
2 → 2 2

Corning Diesel Modeling Report Appendix A Page A-17
→ Thermal NOx consists primarily of NO molecules. Engineering studies completed by Corning in December 2011 support the theoretical conclusion that NOx formed in the high temperature zones of the tunnel kilns is primarily thermal NOx and thus primarily composed of NO molecules. The engineering studies were conducted to understand process atmosphere within the different zones of the kiln and included the speciation of NOx. The majority of the NOx emissions from the high temperature (POC2) and ware cool zones of the kilns consisted of NO molecules. The same studies showed that in the lower temperature zones of the kilns (POC1) a larger percentage of the NOx emissions are in the form of NO2. Stack tests conducted in 2012 confirmed these findings. Tests conducted in 2012 and 2014 also revealed that the periodic kilns display a distinct temporal pattern of NO2/NOx ratios, from a high of approximately 0.9 to a low of approximately 0.1. The variability of the in-stack ratios presents a challenge when specifying appropriate in-stack ratios and emissions for input to OLM or PVMRM, since AERMOD does not have the capability to vary the in-stack ratio based on timing within a cycle. In order to project future potential emissions from the periodic kilns, a constant value of 5.61 lbs./hour is used for all four kilns simultaneously. This rate is higher than any projected rate, and is used in the context of defining worst-case impacts. It would be possible to simply use the maximum NO2/NOx ratio with this constant emission rate in a Tier 3 analysis, however this would result in unrealistically high impacts for the periodic kilns – it is anticipated that no more than 2 kilns would be operating in this part of the cycle at any one time, and it is also likely that the NOx emissions will be lower than 5.61 lbs./hour during this part of the cycle. Based on the variability of the NO2/NOx ratio for the periodic kilns, and the lack of a capability to specifically account for this variability, Corning proposes to use the ARM2 methodology to model the atmospheric transformation of NOx emissions to NO2. PART 2: ARM2 Evaluation/Applicability The development and evaluation of the ARM2 methodology is documented in the API report (reference 3). Corning recognizes that EPA has not issued
guidance or statements regarding these evaluations; nonetheless it is useful to summarize the evaluations contained in the API report and to provide additional analyses and evaluations related specifically to the application of ARM2 to Diesel sources.
Corning Diesel Modeling Report Appendix A Page A-18
Summary of ARM2 evaluations contained in the API Report The development of ARM2 relied on an analysis of NOx and NO2 concentrations collected at several hundred monitoring stations across the U.S., supplemented by plots of NO2/NOx ratios from four measurement locations. The measurements display a consistent pattern of decreasing ratios with increasing NOx concentrations, and an empirical formula was developed to provide an upper-bound estimate of the NO2/NOx ratio based on the initial NOx concentration. The data sets were further analyzed to examine the effect on the NO2/NOx ratio for subsets of the full data set. Subsets were developed by time period, by region of the country, by land use type, and by location of major NOx sources in proximity to the monitor. Analysis of these subsets concluded that the ratios are consistent and conservative across all of the subsets. The report on ARM2 also presented information on evaluations of ARM2 using three data sets, which have previously been used to evaluate OLM and PVMRM. The Empire Abo data set was collected at a site in New Mexico in 1993-1994. Two monitors recorded a total of 457 hours used in the performance evaluation. The Palau data set was collected at a site in Hawaii, where a single monitor recorded 441 hours that were used in the performance evaluation. And finally, the Wainwright data set was collected at a power plant site in Wainwright, Alaska, recording 97 hours of data that were used in the performance evaluation. All of these measurement data sets were screened to select hours when the sources were upwind of the monitoring station and nominal values (>20 micrograms/cubic meter – ug/m3) of NO2 and NOx were recorded. Each data set was evaluated against OLM, PVMRM, and ARM2 by creating scatterplots of NO2/NOx ratios; by creating plots of NO2/NOx ratios by NOx concentration; by developing Quantile/Quantile (Q/Q) plots of predicted and observed concentrations; and by calculating robust high concentrations (RHC) of predicted and observed concentrations to create numerical predicted to observed ratios. These evaluations demonstrated that: 1) none of the approaches (OLM, PVMRM, ARM2) show any skill in predicting NO2/NOx rations paired in time (not an unexpected outcome); 2) that ARM2 predicts ratios that are conservative over the range of observed NOx concentrations (up to 400-600 ug/m3, depending on the data set); and 3) that all three approaches over predict the highest NO2 concentrations, as illustrated by the Q/Q plots and numerically based on the RHC comparisons. The RHC analysis showed over prediction ratios of 1.8, 1.7, and 2.0 for ARM2, OLM and PVMRM respectively. The ARM2 report also contains the results of several sensitivity studies, where comparisons between the three techniques were made based on different source types and settings, including some multi-source analyses, without comparing results to ambient measurements. Although some cases resulted in ARM2-

Corning Diesel Modeling Report Appendix A Page A-19
predicted NO2 concentrations lower than PVMRM, for the most part the ARM2 predictions were similar to the predictions based on OLM and PVMRM. Application of ARM2 for Corning Diesel The results documented in the ARM2 development report support the conclusion that ARM2 conservatively predicts ambient transformation from NOx emissions to NO2, and thus it can be considered to produce results that are not biased towards under prediction. Given the nature of the technique embedded in AERMOD (i.e., as a beta test version), additional evaluations and analyses were performed to support the conclusion that ARM2 is not biased towards under prediction for application at the Corning Diesel facility in accordance with EPA guidance. These evaluations and analyses consist of three elements: first, an independent look at NO2/NOx ratios measured at stations across the country, in settings similar to the surroundings at Diesel with an update to 2012; second, an examination of the patterns of predicted concentrations from Diesel sources to ensure that these characteristics support lower NO2/NOx ratios at higher NOx concentrations; and finally, development of a lower bound ratio for use with ARM2. Hourly concentrations of NOx and NO2 for the period 2001 through 2012 were obtained from EPA’s web site5. Sites were filtered to exclude those located in a city, to focus on sites that are similar to the area surrounding the Diesel facility. A total of more than 4 million hourly data points (from 274,000 in 2001 to 609,000 in 2012) were available with valid values of both NOx and NO2. The data points were converted to ug/m3 and arranged in plots showing the relationship between NOx concentration and NO2/NOx ratios. The plots were modified to display colors indicating the number of points in each “bin” where bins were defined every 10 ug/m3 for NOx concentrations and every increment of 0.01 for the NO2/NOx ratios. The ARM2 ratio was calculated independently using the formulas obtained from AERMOD and verified through the use of a spreadsheet containing the ARM2 formulation, and the ARM2 ratios are displayed on the plot. Figure 1 displays resulting plots for three time periods: 2001-2004; 2005-2008; and 2009-2012.
5 http://www.epa.gov/ttn/airs/airsaqs/detaildata/downloadaqsdata.htm

Corning Diesel Modeling Report Appendix A Page A-20
Figure 1: NOx to NO2/NOx Ratio Plots
The patterns displayed in Figure 1 are similar to the patterns presented in the ARM2 report. There is also a noticeable decrease in the NO2/NOx ratios between the earlier time periods and the period 2009-2012. This is due possibly to NOx emissions reductions that occurred during the intervening years, and
Corning Diesel Modeling Report Appendix A Page A-21
also possibly to decreases in ozone concentrations for the later period. The pattern of decreasing ratios compared to NOx concentrations over time, and the visibly conservative nature of the ARM2 ratios for settings similar to Corning Diesel, provides evidence that the ARM2 method of modeling the atmospheric conversion of NOx to NO2 should not be biased towards under prediction for application at Diesel. The conversion of NOx to NO2 is governed principally by the presence of ozone. Both of the Tier 3 methods (PVMRM and OLM) are based on this assumption. OLM estimates the amount of conversion by comparing ground-level concentrations of NOx to ground-level concentrations of ozone, and limiting the amount of NO2 formed to the amount of available ozone. PVMRM estimates the amount of conversion by first estimating a plume volume, then assuming that ambient ozone is entrained into the plume volume. An estimate of the total molar mass of both NOx and ozone in the plume is then made, followed by assuming that all ozone entrained into the plume converts NOx to NO2 on a molecule-by-molecule basis. Both methods have inherent shortcomings. OLM relies on a ground-level NOx concentration that is not representative of the NOx mass for comparison to ozone mass available for conversion. PVMRM in theory addresses this shortcoming by making an estimate of the plume volume; however, estimates of the plume volume are subject to considerable uncertainty for the steady-state AERMOD model. This is especially true for situations where multiple plumes interact that are separated horizontally and vertically as they are with the Diesel sources. Both methods can use ozone concentrations supplied through an hourly input file or by matrices representing any of several different ways to organize the data – e.g. by hour of day, season, day of the week, or by month. Specifying representative ozone data can represent a challenge. Both of these methods also require an in-stack NO2/NOx ratio that can vary by source but not temporally. Despite the shortcomings, both OLM and PVMRM have been demonstrated to produce conservative results when applied to model NOx to NO2 conversion and have been used widely for this purpose. ARM2 is not intended to overcome the shortcomings. It is an alternative to OLM and PVMRM that does not require specification of ozone concentrations or in-stack ratios. It is also a useful approach for situations where in-stack ratios vary with time and using a “worst-case” approach with in-stack ratios with OLM or PVMRM would result in an estimate of ambient NO2 impacts that is overly conservative. The plot presented in Figure 1 demonstrates the conservative nature of ARM2 over a substantial number of actual measured data points. The next part of this protocol takes a closer look at some of the characteristics of the predicted concentrations from Diesel sources to further demonstrate the conservative nature of the application of ARM2 for Diesel.
Corning Diesel Modeling Report Appendix A Page A-22
Atmospheric transformation of NOx emissions into NO2 concentration is a function of ozone concentrations but also of travel time. The longer a plume travels from a source, the larger it grows – allowing for more ozone to be entrained – but also the more time is available for the transformation to take place. Thus while ARM2 does not account explicitly for ozone concentrations, plume volume, or travel time, the patterns displayed by the measurements are likely due to the presence or absence of ozone and the travel time, i.e. age of the air parcel containing NOx and NO2 that is being measured. Furthermore, although travel time (atmospheric residence time) cannot be deduced from the available measurements, it is reasonable to assume that a large number of the measurement data points are associated with a mix of different source types and locations that are not likely in many cases to be close to the monitor. It is therefore useful to examine the nature of the travel time associated with high NOx impacts and the diurnal cycle of high NOx impacts from Diesel sources, to ensure that the predicted NOx patterns associated with Diesel sources are consistent with the characteristics of the measurements that ARM2 is based on. Figure 2 displays the travel time, in minutes, calculated on the basis of wind speed for each hour and distance to the receptor, plotted against the modeled NOx concentration (assuming full conversion) for all Diesel NOx sources. This figure also has a color coding to indicate how many hours, on average over five years, are associated with certain travel time and concentration ranges. Note that the number of hours displayed in this plot indicate the number of hours over many receptors; the number of hours at the levels indicated by any single receptor is considerably lower than shown.

Corning Diesel Modeling Report Appendix A Page A-23
Figure 2: Travel Time Analysis
This plot illustrates that the majority of the predicted concentrations occur at receptors after less than five minutes travel time from the source; most are less than 10 minutes, and all are less than 23 minutes. These are relatively short travel times, and this information provides evidence for reasonably concluding that the modeled concentrations are likely to be associated with the lower NO2/NOx ratios displayed in the data, i.e. lower than the ratios predicted by ARM2. The Tier 1 concentrations for Diesel NOx sources do exceed the guideline of 150-200 ppb under some conditions (due to the low background, the higher value – 200 ppb – is appropriate to use here). Figure 3 presents predicted concentrations by time of day. Concentrations greater than the guideline occur primarily during the nighttime hours. Furthermore, the maximum number of hours (using the Tier 1 approach) greater than 200 ppb at any receptor – average per year over five years - was 93 (i.e. 99% of the time at all receptors concentrations were less than 200 ppb). The concentrations presented in Figure 3 were developed using five years of meteorological data and the source and receptor setup that was described in the modeling protocol submitted along with the ARM2 justification document.

Corning Diesel Modeling Report Appendix A Page A-24
Figure 3: Diurnal Patterns of Predicted NOx Concentrations
It is also possible to arrange the measurement data by time of day; this plot is shown in Figure 4 for two time periods: 2001-2004 and 2009-2012.
Mo
del
ed C
on
cen
trat
ion
PP
B -
Fu
ll C
on
vers
ion

Corning Diesel Modeling Report Appendix A Page A-25
Figure 4: Diurnal Patterns of Measured NOx Concentrations
These concentration patterns reveal a distinct decrease in NOx concentrations during the daytime hours, for both predicted and measured values. The consistency in both predicted and measured diurnal patterns suggests that NO2/NOx ratios developed and shown to be conservative with respect to measurements at stations with similar surroundings to Diesel are also conservative with respect to the predicted values. Ozone concentration characteristics An evaluation of background ozone concentrations was carried out. There are two ozone monitors in the vicinity of Diesel: Elmira (i.d. 36-015-0003), approximately 30 km to the east of Diesel and in a more urbanized area; and

Corning Diesel Modeling Report Appendix A Page A-26
Pinnacle State Park (i.d. 36-101-0003), located approximately 5 km to the southwest of Diesel in a rural area. Hourly concentrations from these two monitors were obtained and processed to create diurnal plots of ozone concentration presented in Figures 5 and 6. Figure 5: Diurnal Patterns of Measured Ozone Concentrations: Elmira

Corning Diesel Modeling Report Appendix A Page A-27
Figure 6: Diurnal Patterns of Measured Ozone Concentrations: Pinnacle State Park
Figures 5 and 6 illustrate that higher ozone concentrations occur during the daytime (more so for Elmira than Pinnacle State Park), the opposite of the pattern for predicted NOx concentrations. The figures also illustrate that ozone at these two monitors is not particularly high, with concentrations at both stations in the range of 40 ppb or lower during the hours when Tier 1 NOx concentrations exceed 200 ppb. In terms of EPA guidance on the use of ARM2, “..the background ozone is not persistently above approximately 80-90 ppb”. Part 3: Five Appendix W Conditions As noted previously, the justification for using a non-default approach should generally be developed in accordance with 40 CFR part 51, Appendix W (Section 3.2.2.e) which states that “an alternative refined model may be used provided that:
1. The model has received a scientific peer review; 2. The model can be demonstrated to be applicable to the problem on a
theoretical basis; 3. The databases which are necessary to perform the analysis are available
and adequate; 4. Appropriate performance evaluations of the model have shown that the
model is not biased toward underestimates; and,

Corning Diesel Modeling Report Appendix A Page A-28
5. A protocol on methods and procedures to be followed has been established.”
Also as noted previously, these five conditions may not apply directly to the use of a beta technique embedded in a model that is a preferred model (as opposed to literally using a different model), but they are being addressed by Corning as part of the overall justification for using ARM2. Condition 1: The model has received a scientific peer review The ARM2 methodology has not been published yet in a peer-reviewed journal. The Tier 3 approaches (OLM and PVMRM) were developed over a decade ago and were the subject of peer-reviewed papers referenced in the EPA memoranda, including the following:
Cole, B.S. and J.E. Summerhays, 1979. A Review of Techniques Available for Estimation of Short-Term NO2 Concentrations. Journal of the Air Pollution Control Association, 29(8): 812-817. Hanrahan, P.L., 1999a. The Plume Volume Molar Ratio Method for Determining NO2/NOx Ratios in Modeling - Part I: Methodology. Journal of the Air & Waste Management Association, 49, 1324-1331. Hanrahan, P.L., 1999b. The Plume Volume Molar Ratio Method for Determining N02/NOx Ratios in Modeling - Part II: Evaluation Studies. Journal of the Air & Waste Management Association, 49,1332-1338. MACTEC, 2004. Sensitivity Analysis of PVMRM and OLM in AERMOD. Final Report, Alaska DEC Contract No. 18-8018-04. MACTEC Federal Programs, Inc., Research Triangle Park, NC.
MACTEC, 2005. Evaluation of Bias in AERMOD-PVMRM. Final Report, Alaska DEC Contract No. 18-9010-12. MACTEC Federal Programs, Inc., Research Triangle Park, NC. Hendrick, E.M, Tino, V.R, Hanna, S.R, Hanrahan, P.L., and Egan, B.A., 2013. Evaluation of NO2 predictions by the plume volume molar ratio method (PVMRM) and ozone limiting method (OLM) in AERMOD using new field observations. Journal of the Air & Waste Management Association, 63, 844-854.
Comparisons of ARM2 with OLM and PVMRM reported in the ARM2 document show similarity between ARM2 and the Tier 3 methods across a number of data

Corning Diesel Modeling Report Appendix A Page A-29
sets and model input scenarios. Additionally, the analyses presented in this protocol provide an independent verification of the basis of ARM2. Corning recognizes that these factors do not constitute a scientific peer review, but taken together Corning believes that this condition is met for ARM2 as implemented within AERMOD. Condition 2: The model can be demonstrated to be applicable to the problem on a theoretical basis The reason for seeking approval of the ARM2 method is to properly account for the conversion of NOx emissions to ambient NO2 concentrations due to impacts from sources at the Corning Diesel facility. The large quantity of data used to develop ARM2 is derived from actual measurements of this conversion, thus the ARM2 method is applicable to the Corning Diesel modeling analysis for NO2. Condition 3: The databases which are necessary to perform the analysis are available and adequate The necessary data for implementing ARM2 within AERMOD include the standard model inputs related to source release characteristics and NOx emission rates, and consideration of the ARMRATIO values for the particular application. All of these data have been developed and, in the case of the ARMRATIO, discussed in this justification. Meteorological data and receptor information needed to run AERMOD have also been developed as described in the main protocol. Condition 4: Appropriate performance evaluations of the model have shown that the model is not biased toward underestimates The performance evaluations discussed elsewhere in this document, and the analysis of characteristics of Diesel NOx predictions, demonstrate that application of AERM2 within AERMOD will not be biased towards underestimates. Condition 5: A protocol on methods and procedures to be followed has been established A modeling protocol has been developed for this analysis, including this appendix. The protocol is being submitted to NYSDEC and to EPA Region II for review and approval.

ERM CORNING: DIESEL – MAY 2015
APPENDIX B
SMALLER SOURCES FOR MULTI-SOURCE MODELING
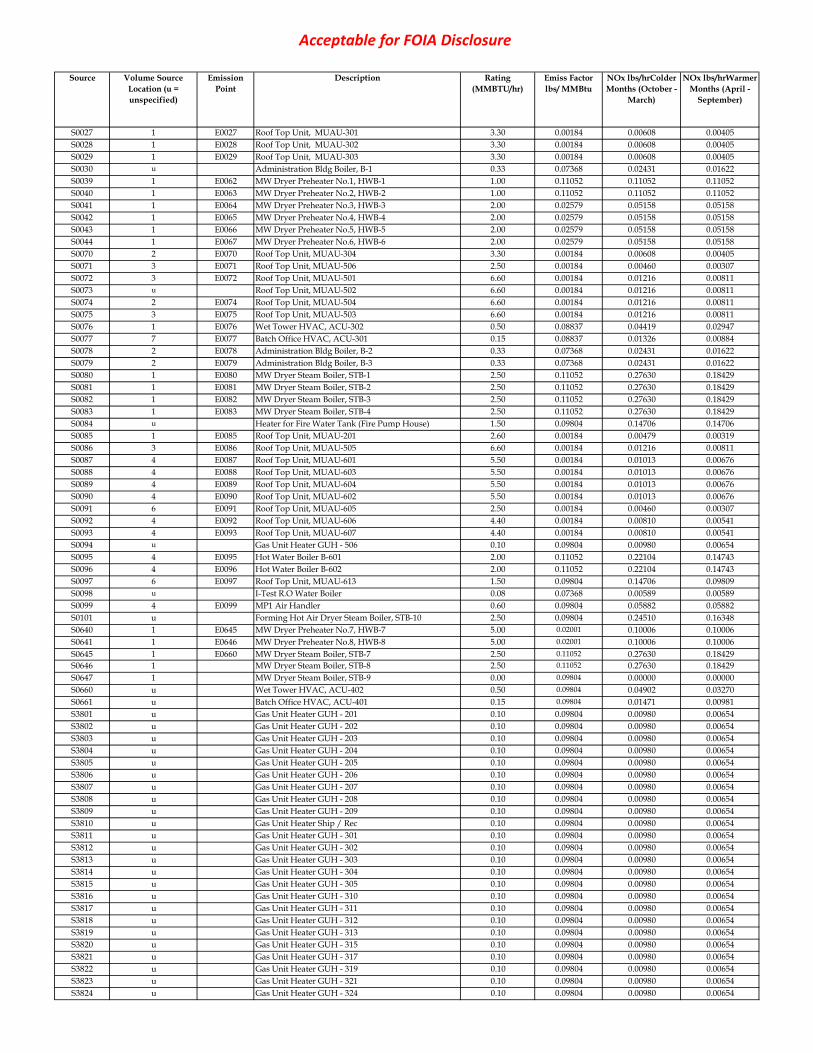
Acceptable for FOIA Disclosure
Source Volume Source Location (u = unspecified)
Emission Point
Description Rating(MMBTU/hr)
Emiss Factor lbs/ MMBtu
NOx lbs/hrColder Months (October -
March)
NOx lbs/hrWarmer Months (April -
September)
S0027 1 E0027 Roof Top Unit, MUAU-301 3.30 0.00184 0.00608 0.00405S0028 1 E0028 Roof Top Unit, MUAU-302 3.30 0.00184 0.00608 0.00405S0029 1 E0029 Roof Top Unit, MUAU-303 3.30 0.00184 0.00608 0.00405S0030 u Administration Bldg Boiler, B-1 0.33 0.07368 0.02431 0.01622S0039 1 E0062 MW Dryer Preheater No.1, HWB-1 1.00 0.11052 0.11052 0.11052S0040 1 E0063 MW Dryer Preheater No.2, HWB-2 1.00 0.11052 0.11052 0.11052S0041 1 E0064 MW Dryer Preheater No.3, HWB-3 2.00 0.02579 0.05158 0.05158S0042 1 E0065 MW Dryer Preheater No.4, HWB-4 2.00 0.02579 0.05158 0.05158S0043 1 E0066 MW Dryer Preheater No.5, HWB-5 2.00 0.02579 0.05158 0.05158S0044 1 E0067 MW Dryer Preheater No.6, HWB-6 2.00 0.02579 0.05158 0.05158S0070 2 E0070 Roof Top Unit, MUAU-304 3.30 0.00184 0.00608 0.00405S0071 3 E0071 Roof Top Unit, MUAU-506 2.50 0.00184 0.00460 0.00307S0072 3 E0072 Roof Top Unit, MUAU-501 6.60 0.00184 0.01216 0.00811S0073 u Roof Top Unit, MUAU-502 6.60 0.00184 0.01216 0.00811S0074 2 E0074 Roof Top Unit, MUAU-504 6.60 0.00184 0.01216 0.00811S0075 3 E0075 Roof Top Unit, MUAU-503 6.60 0.00184 0.01216 0.00811S0076 1 E0076 Wet Tower HVAC, ACU-302 0.50 0.08837 0.04419 0.02947S0077 7 E0077 Batch Office HVAC, ACU-301 0.15 0.08837 0.01326 0.00884S0078 2 E0078 Administration Bldg Boiler, B-2 0.33 0.07368 0.02431 0.01622S0079 2 E0079 Administration Bldg Boiler, B-3 0.33 0.07368 0.02431 0.01622S0080 1 E0080 MW Dryer Steam Boiler, STB-1 2.50 0.11052 0.27630 0.18429S0081 1 E0081 MW Dryer Steam Boiler, STB-2 2.50 0.11052 0.27630 0.18429S0082 1 E0082 MW Dryer Steam Boiler, STB-3 2.50 0.11052 0.27630 0.18429S0083 1 E0083 MW Dryer Steam Boiler, STB-4 2.50 0.11052 0.27630 0.18429S0084 u Heater for Fire Water Tank (Fire Pump House) 1.50 0.09804 0.14706 0.14706S0085 1 E0085 Roof Top Unit, MUAU-201 2.60 0.00184 0.00479 0.00319S0086 3 E0086 Roof Top Unit, MUAU-505 6.60 0.00184 0.01216 0.00811S0087 4 E0087 Roof Top Unit, MUAU-601 5.50 0.00184 0.01013 0.00676S0088 4 E0088 Roof Top Unit, MUAU-603 5.50 0.00184 0.01013 0.00676S0089 4 E0089 Roof Top Unit, MUAU-604 5.50 0.00184 0.01013 0.00676S0090 4 E0090 Roof Top Unit, MUAU-602 5.50 0.00184 0.01013 0.00676S0091 6 E0091 Roof Top Unit, MUAU-605 2.50 0.00184 0.00460 0.00307S0092 4 E0092 Roof Top Unit, MUAU-606 4.40 0.00184 0.00810 0.00541S0093 4 E0093 Roof Top Unit, MUAU-607 4.40 0.00184 0.00810 0.00541S0094 u Gas Unit Heater GUH - 506 0.10 0.09804 0.00980 0.00654S0095 4 E0095 Hot Water Boiler B-601 2.00 0.11052 0.22104 0.14743S0096 4 E0096 Hot Water Boiler B-602 2.00 0.11052 0.22104 0.14743S0097 6 E0097 Roof Top Unit, MUAU-613 1.50 0.09804 0.14706 0.09809S0098 u I-Test R.O Water Boiler 0.08 0.07368 0.00589 0.00589S0099 4 E0099 MP1 Air Handler 0.60 0.09804 0.05882 0.05882S0101 u Forming Hot Air Dryer Steam Boiler, STB-10 2.50 0.09804 0.24510 0.16348S0640 1 E0645 MW Dryer Preheater No.7, HWB-7 5.00 0.02001 0.10006 0.10006S0641 1 E0646 MW Dryer Preheater No.8, HWB-8 5.00 0.02001 0.10006 0.10006S0645 1 E0660 MW Dryer Steam Boiler, STB-7 2.50 0.11052 0.27630 0.18429S0646 1 MW Dryer Steam Boiler, STB-8 2.50 0.11052 0.27630 0.18429S0647 1 MW Dryer Steam Boiler, STB-9 0.00 0.09804 0.00000 0.00000S0660 u Wet Tower HVAC, ACU-402 0.50 0.09804 0.04902 0.03270S0661 u Batch Office HVAC, ACU-401 0.15 0.09804 0.01471 0.00981S3801 u Gas Unit Heater GUH - 201 0.10 0.09804 0.00980 0.00654S3802 u Gas Unit Heater GUH - 202 0.10 0.09804 0.00980 0.00654S3803 u Gas Unit Heater GUH - 203 0.10 0.09804 0.00980 0.00654S3804 u Gas Unit Heater GUH - 204 0.10 0.09804 0.00980 0.00654S3805 u Gas Unit Heater GUH - 205 0.10 0.09804 0.00980 0.00654S3806 u Gas Unit Heater GUH - 206 0.10 0.09804 0.00980 0.00654S3807 u Gas Unit Heater GUH - 207 0.10 0.09804 0.00980 0.00654S3808 u Gas Unit Heater GUH - 208 0.10 0.09804 0.00980 0.00654S3809 u Gas Unit Heater GUH - 209 0.10 0.09804 0.00980 0.00654S3810 u Gas Unit Heater Ship / Rec 0.10 0.09804 0.00980 0.00654S3811 u Gas Unit Heater GUH - 301 0.10 0.09804 0.00980 0.00654S3812 u Gas Unit Heater GUH - 302 0.10 0.09804 0.00980 0.00654S3813 u Gas Unit Heater GUH - 303 0.10 0.09804 0.00980 0.00654S3814 u Gas Unit Heater GUH - 304 0.10 0.09804 0.00980 0.00654S3815 u Gas Unit Heater GUH - 305 0.10 0.09804 0.00980 0.00654S3816 u Gas Unit Heater GUH - 310 0.10 0.09804 0.00980 0.00654S3817 u Gas Unit Heater GUH - 311 0.10 0.09804 0.00980 0.00654S3818 u Gas Unit Heater GUH - 312 0.10 0.09804 0.00980 0.00654S3819 u Gas Unit Heater GUH - 313 0.10 0.09804 0.00980 0.00654S3820 u Gas Unit Heater GUH - 315 0.10 0.09804 0.00980 0.00654S3821 u Gas Unit Heater GUH - 317 0.10 0.09804 0.00980 0.00654S3822 u Gas Unit Heater GUH - 319 0.10 0.09804 0.00980 0.00654S3823 u Gas Unit Heater GUH - 321 0.10 0.09804 0.00980 0.00654S3824 u Gas Unit Heater GUH - 324 0.10 0.09804 0.00980 0.00654

Acceptable for FOIA Disclosure
Source Volume Source Location (u = unspecified)
Emission Point
Description Rating(MMBTU/hr)
Emiss Factor lbs/ MMBtu
NOx lbs/hrColder Months (October -
March)
NOx lbs/hrWarmer Months (April -
September)
S3825 u Gas Unit Heater GUH - 325 0.10 0.09804 0.00980 0.00654S3826 u Gas Unit Heater GUH - 326 0.10 0.09804 0.00980 0.00654S3827 u Gas Unit Heater Ship/Rec Man Door 0.10 0.09804 0.00980 0.00654S3828 u Gas Unit Heater Ship/Rec Door 1 0.30 0.09804 0.02941 0.01962S3829 u Gas Unit Heater Ship/Rec Door 2 0.30 0.09804 0.02941 0.01962S3830 u Gas Unit Heater Ship/Rec Door 3 0.30 0.09804 0.02941 0.01962S3831 u Gas Unit Heater GUH - 331 0.10 0.09804 0.00980 0.00654S3832 u Gas Unit Heater GUH - 332 0.10 0.09804 0.00980 0.00654
Additional Sources: 0.000007 9 MUAU in Northeast building 45.00 0.05452 2.45353 1.636507 24 GHU IN NE building 0.72 0.09804 0.07059 0.047087 2 AHU in NE building 0.69 0.09804 0.06765 0.045127 4 Dock Heaters in NE building 1.40 0.09804 0.13725 0.091551 new ahu in wet tower 0.35 0.09804 0.03431 0.02289u add 1 MUAU 1.69 0.05452 0.09231 0.06157u add 1 GHU 0.03 0.09804 0.00294 0.00196
Total NOx (lbs/hr) 6.92 4.90

ERM CORNING: DIESEL – MAY 2015
APPENDIX C - UPDATED PLOT PLAN
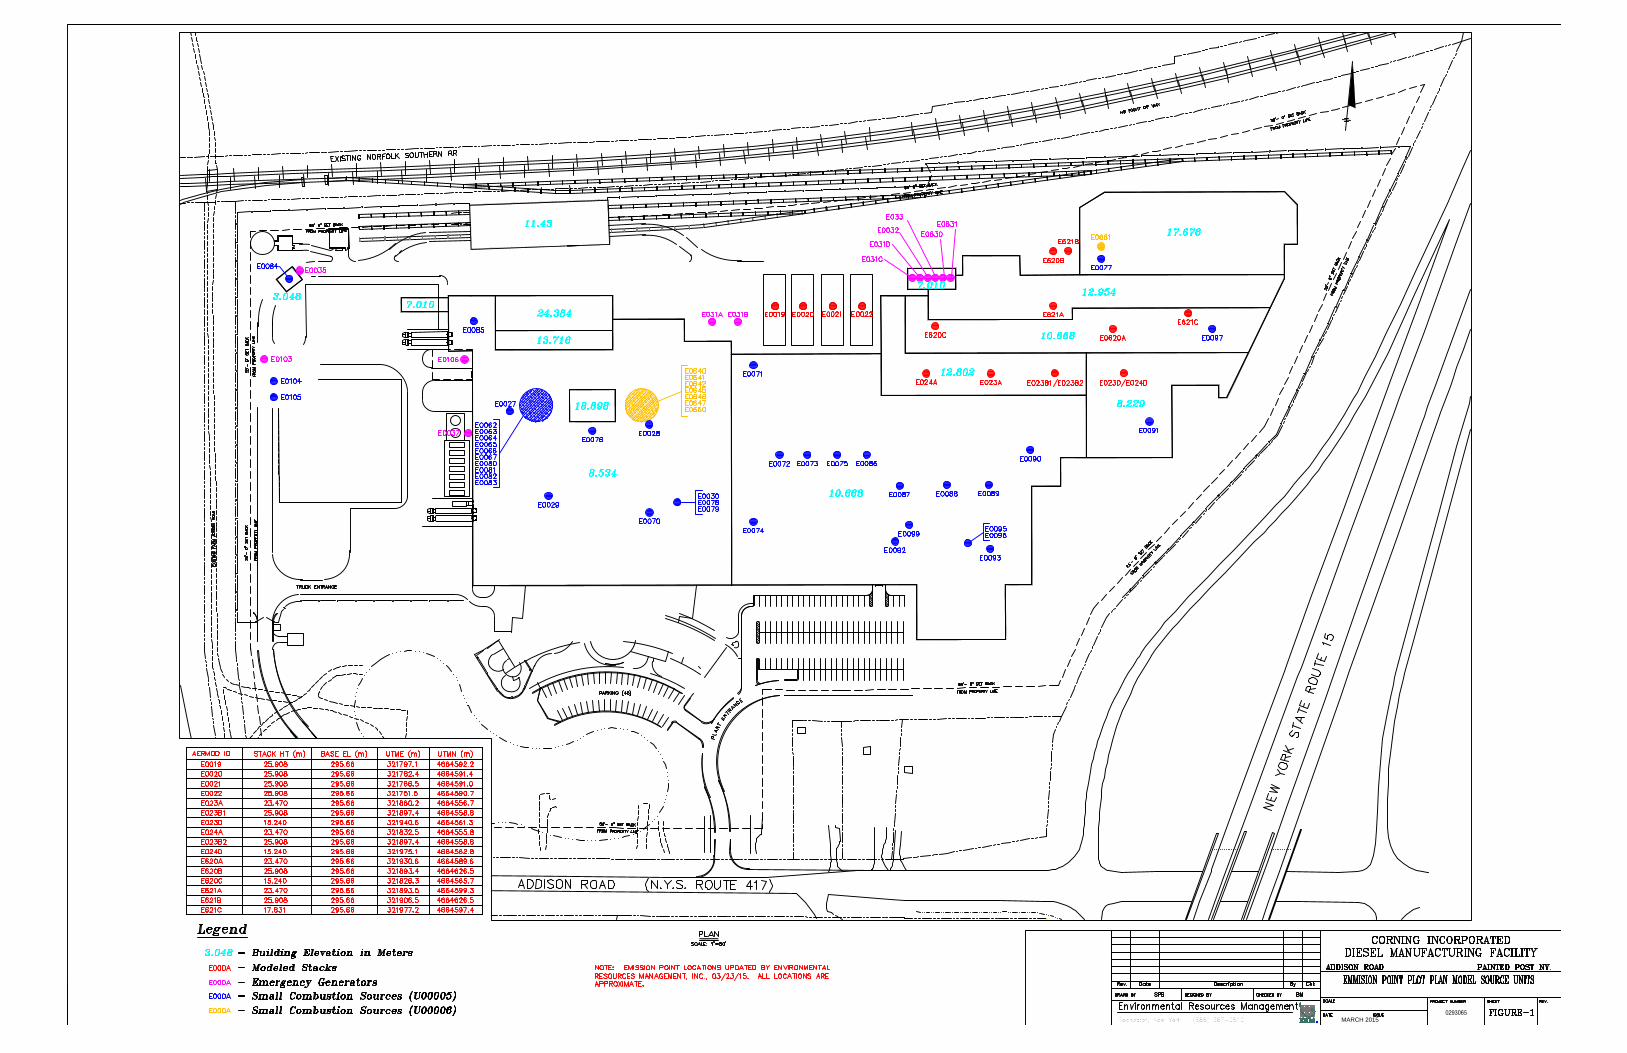
MARCH 2015

ERM CORNING: DIESEL – MAY 2015
APPENDIX D
MODEL INPUTS FOR THE MULTI-SOURCE INVENTORY
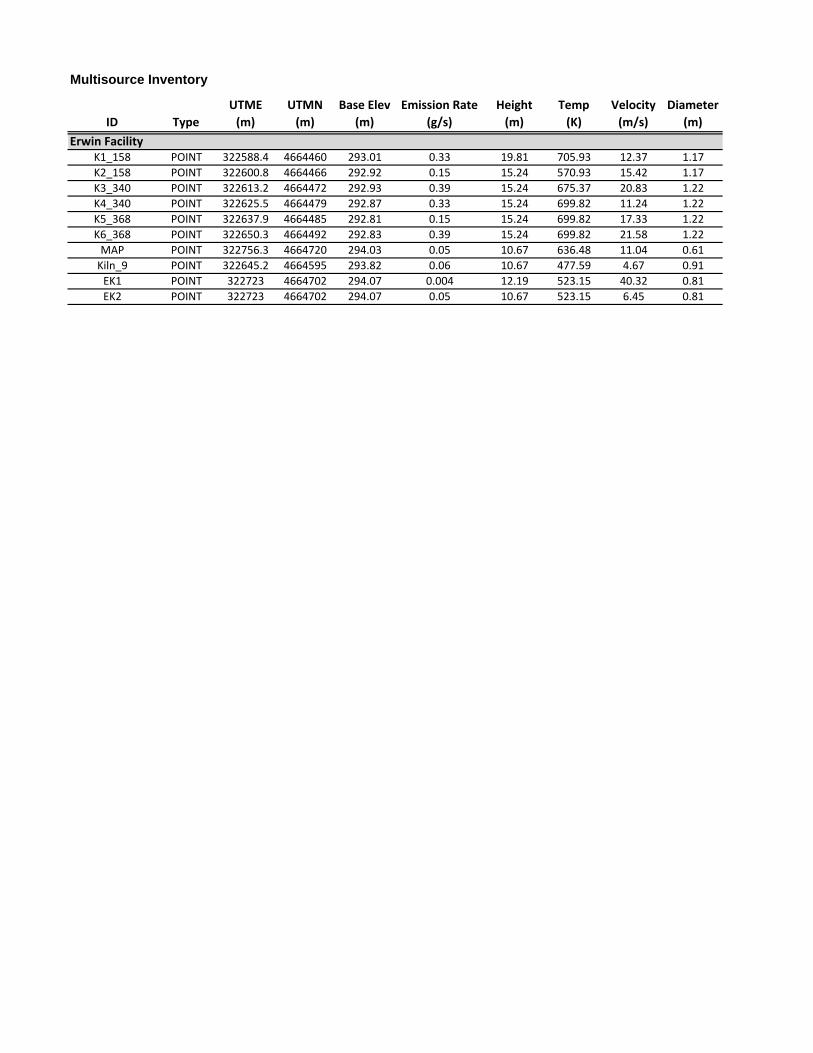
Multisource Inventory
ID Type
UTME
(m)
UTMN
(m)
Base Elev
(m)
Emission Rate
(g/s)
Height
(m)
Temp
(K)
Velocity
(m/s)
Diameter
(m)
Erwin FacilityK1_158 POINT 322588.4 4664460 293.01 0.33 19.81 705.93 12.37 1.17
K2_158 POINT 322600.8 4664466 292.92 0.15 15.24 570.93 15.42 1.17
K3_340 POINT 322613.2 4664472 292.93 0.39 15.24 675.37 20.83 1.22
K4_340 POINT 322625.5 4664479 292.87 0.33 15.24 699.82 11.24 1.22
K5_368 POINT 322637.9 4664485 292.81 0.15 15.24 699.82 17.33 1.22
K6_368 POINT 322650.3 4664492 292.83 0.39 15.24 699.82 21.58 1.22
MAP POINT 322756.3 4664720 294.03 0.05 10.67 636.48 11.04 0.61
Kiln_9 POINT 322645.2 4664595 293.82 0.06 10.67 477.59 4.67 0.91
EK1 POINT 322723 4664702 294.07 0.004 12.19 523.15 40.32 0.81
EK2 POINT 322723 4664702 294.07 0.05 10.67 523.15 6.45 0.81