Embed Size (px)
Citation preview

Prepared for““Creating operating and capital efficiencies that generate strong Creating operating and capital efficiencies that generate strong cash flow to fund dividends, strategic acquisitions, capital cash flow to fund dividends, strategic acquisitions, capital
investment and technology development.”investment and technology development.”
March 24th 2004
Supply Chain Management
Presentation to Emerson
2
Executive Summary
Benefits of a single source supply chain provider for Emerson’s international logistics
Establish enterprise wide visibility Divisions have visibility to tracking and exception management Ability to capture shipping data (volume by trade lane and sourcing patterns)
Shift from Multi Country Consolidation to Single Country Consolidation to increase supply chain efficiency and lower cost
Increase supply chain efficiency Lower consolidation cost Compressing cycle time
Achieve goal of ocean freight savings and cost reduction APLL to target lowering freight cost by 15% by offering tier 2 options
3
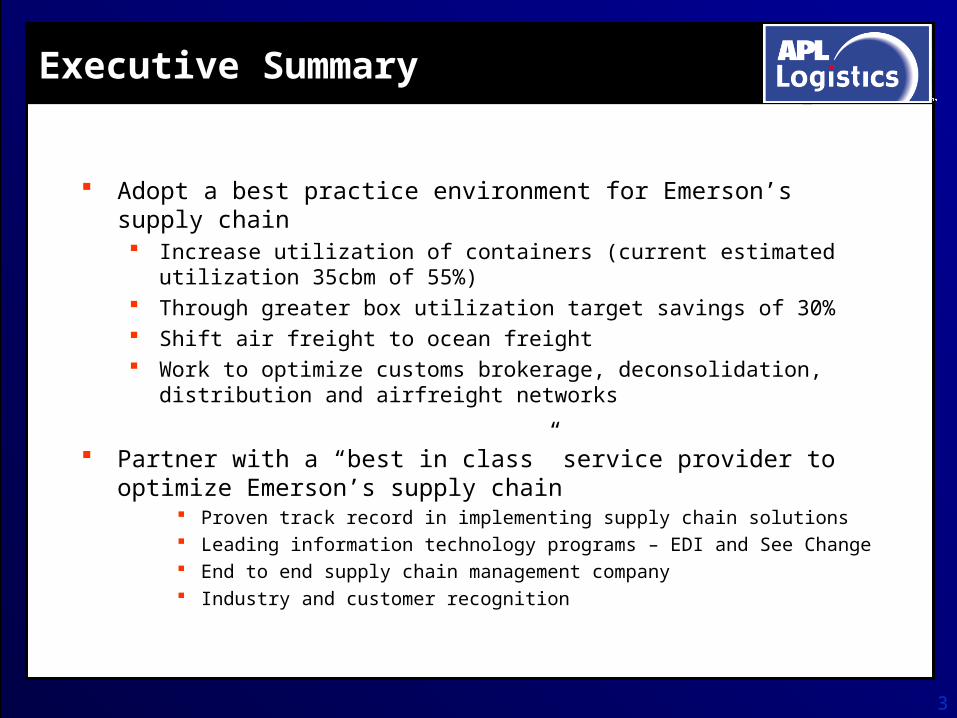
Executive Summary
Adopt a best practice environment for Emerson’s supply chain Increase utilization of containers (current estimated utilization 35cbm of
55%) Through greater box utilization target savings of 30% Shift air freight to ocean freight Work to optimize customs brokerage, deconsolidation, distribution and
airfreight networks
Partner with a “best in class” service provider to optimize Emerson’s supply chain
Proven track record in implementing supply chain solutions Leading information technology programs – EDI and See Change End to end supply chain management company Industry and customer recognition
4
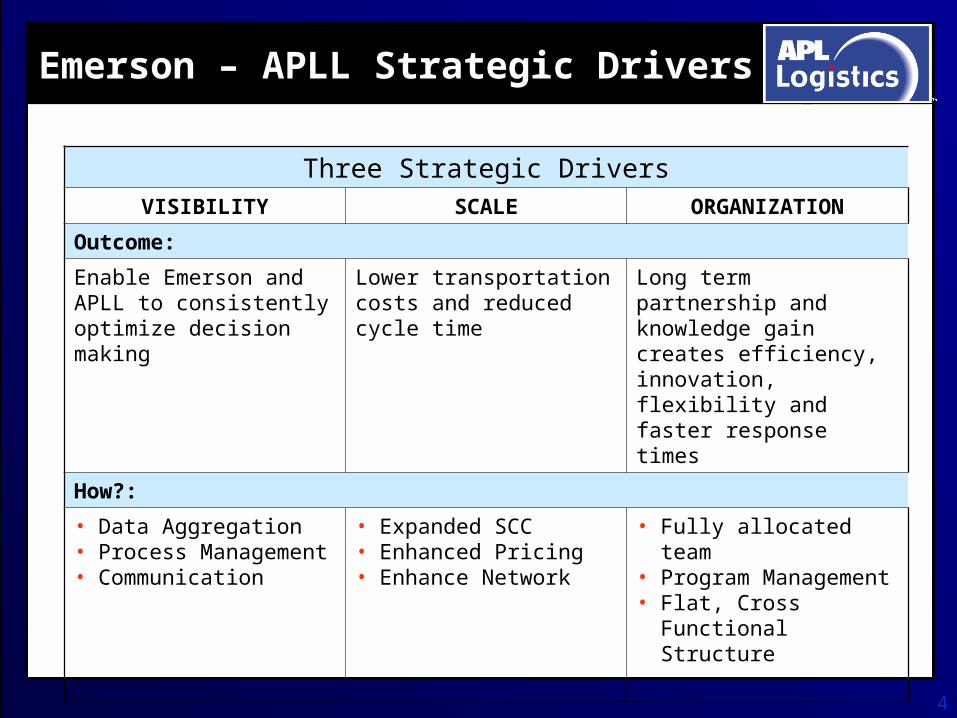
Emerson – APLL Strategic Drivers
Three Strategic DriversVISIBILITY SCALE ORGANIZATION
Outcome:
Enable Emerson and APLL to consistently optimize decision making
Lower transportation costs and reduced cycle time
Long term partnership and knowledge gain creates efficiency, innovation, flexibility and faster response times
How?:
• Data Aggregation• Process Management• Communication
• Expanded SCC • Enhanced Pricing• Enhance Network
• Fully allocated team• Program Management• Flat, Cross Functional
Structure
5
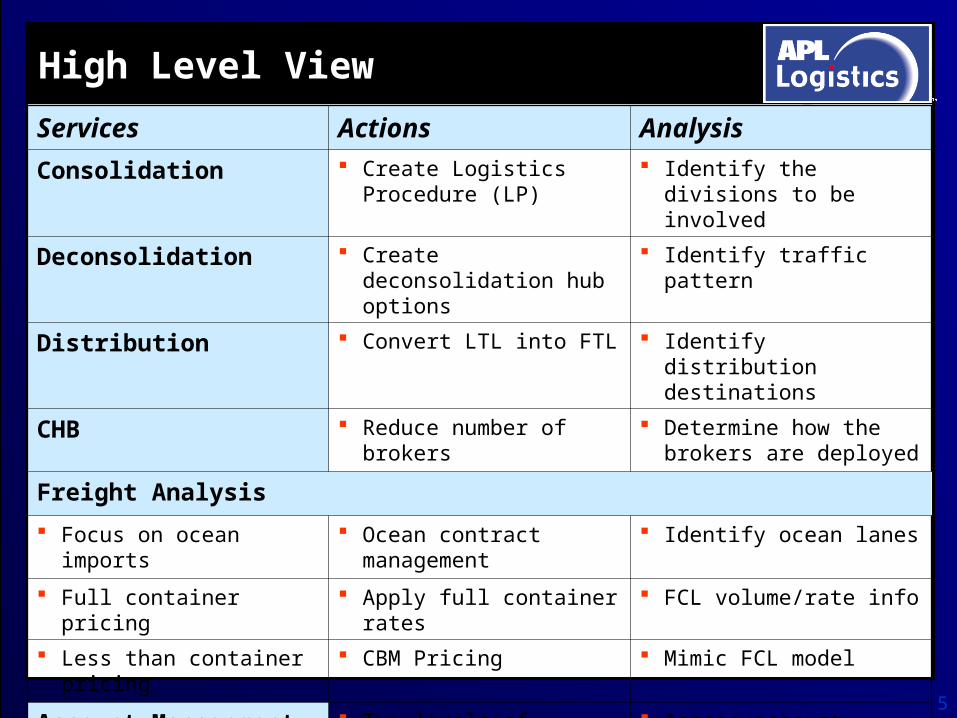
High Level View
Services Actions Analysis
Consolidation Create Logistics Procedure (LP)
Identify the divisions to be involved
Deconsolidation Create deconsolidation hub options
Identify traffic pattern
Distribution Convert LTL into FTL Identify distribution destinations
CHB Reduce number of brokers Determine how the brokers are deployed
Freight Analysis
Focus on ocean imports Ocean contract management
Identify ocean lanes
Full container pricing Apply full container rates FCL volume/rate info
Less than container pricing CBM Pricing Mimic FCL model
Account Management Two levels of management planned
Assess account management structure

6
Supplier & Division Origin Portsqingdao
shanghaipusan
shenzhen
taiwanhong kong memphis
manila san diego
bangkok
kualal lumpur
singapore
Deconsolidation Cross DockFCL Carriers: APL, Maersk, P&O, ZIM (NVOCC unknown)MCC Carrier: APL
Distribution: Overnight ExpressMCC flowSCC flow or groupage US Customs Broker: Menlo Worldwide
kuala lumpur
Current Product Flow
APLL/Emerson achieved savings of over 35% with current consolidation program
7
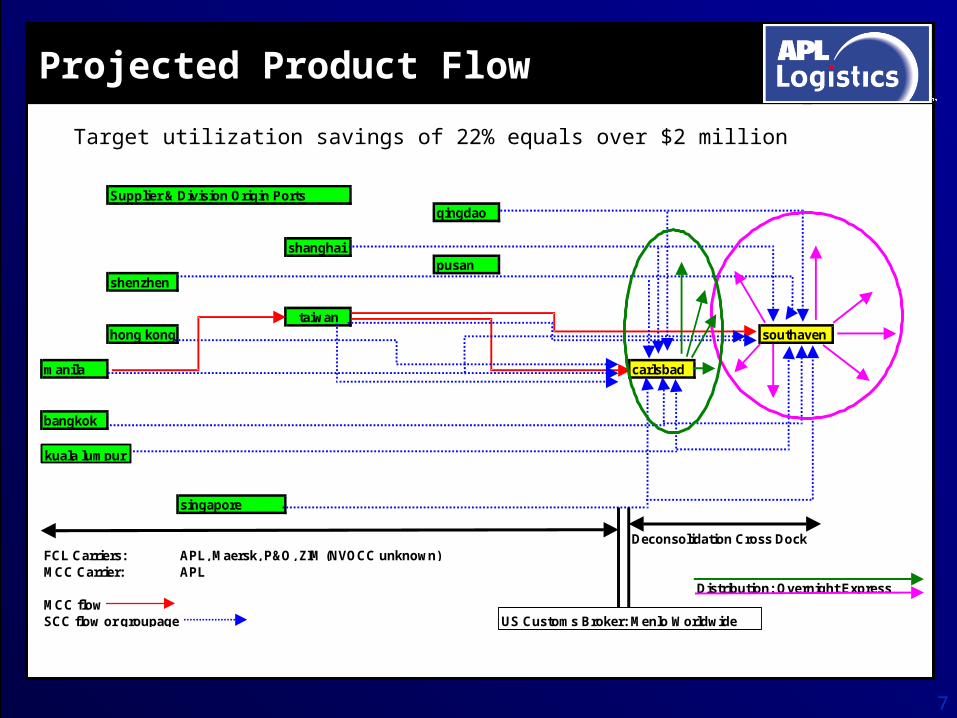
Supplier & Division Origin Portsqingdao
shanghaipusan
shenzhen
taiwanhong kong southaven
manila carlsbad
bangkok
kualal lumpur
singapore
Deconsolidation Cross DockFCL Carriers: APL, Maersk, P&O, ZIM (NVOCC unknown)MCC Carrier: APL
Distribution: Overnight ExpressMCC flowSCC flow or groupage US Customs Broker: Menlo Worldwide
kuala lumpur
Projected Product Flow
Target utilization savings of 22% equals over $2 million
8
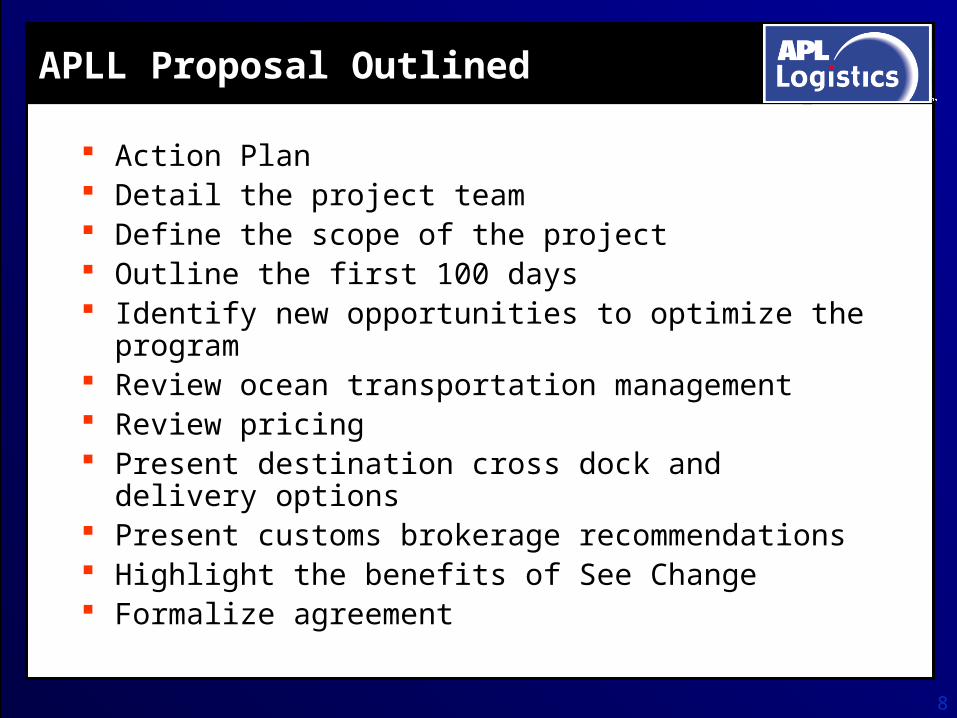
APLL Proposal Outlined
Action Plan Detail the project team Define the scope of the project Outline the first 100 days Identify new opportunities to optimize the program Review ocean transportation management Review pricing Present destination cross dock and delivery options Present customs brokerage recommendations Highlight the benefits of See Change Formalize agreement

9
Action PlanActions Status Need Phase Who Due dateReview/confirm APL rates In progress I Dave Hill, Rick
Moradian
Monday, Mar 15
Provide Carrier rate options Completed I Dave Hill Monday, Mar 15
Provide LCL per CBM rates CFS-CFS Completed I Dave Hill, Chris
Nalbantyan
Project Management assignment - define org structure/support (US & Asia/cust. Svc.)
Completed I Brigitte Wagner,
Rick Moradian
Monday, Mar 15
Initial EDI/PO upload In progress I Brigitte Wagner Monday, Mar 15
Asia to Europe: Engage Emerson Europe contacts Completed Consol/SCC, LCL II Jesper Nielsen,
Dave Hill, Bob
Bodee
Tuesday, Mar 16
Deconsol - Torrance, meet with Cat Logistics re: Southaven I Chris Corrado Apr 12
SCT: review SOW and implementation I Brigitte Wagner,
Rob Haney
Mar 22
EDI/PO uploads develop plan by division and training manual II Brigitte Wagner Phase II Aug 1
Analyze current and alternative DCs, review TMS options Need LTL/DC shipping History (weight,dims,carrier)
II Cliff Wright, Chris
Corrado, Bob
Bodee
Aug 1 (tentative)
Set up airfreight process (import and export) II Dave Hill, Kevin
Jones
May 1
Asia to Europe: Manage Consol/SCC, LCL II Jesper Nielsen,
Dave Hill
TBD
Review SCT capability for 4PL foreign-foreign, Europe-US II Brigitte Wagner,
Dave Hill
Aug 1
Meet with Carmichael re: managing broker design/plan Broker list, entry volume, rates
II or IIIDave Hill, Paul
Woolley, Bob
Bodee, Jorge
Longa
Aug 11 (tentative)
10
APLL Project Team
APLL has nominated Will Warne as Deployment Manager and will be supported by leads in operations, IT, engineering and analysis to create the master Logistics Procedure (LP), interface with divisions and discover process improvements
The Deployment Manager will be positioned in St. Louis
11
APLL Account Management
Two levels of account management
Deployment Manager to oversee the implementation and on-boarding
Origin customer service will coordinate shipments based on the LP and coordinate vendor edification
Destination customer service will manage the flow of information, interface with divisions and provide exception management

12
APLL / Emerson Project Team
Jorge Longa
Project Manager
Larry KremerVice President
Raymond Choy
APLL North Asia
Cliff Wright
APLL Solutions Engineer
Carlos Camara
See Change Services
Pam Evans
APLL Customer Support
Tracy Wong
APLL South Asia
Chris Nalbantyan
Transportation Analyst
Maria McCafferty
EDI Implementation
TBD
APLL Customer Support
Will Warne
Client Manager
Bob Bodee
Business Development
Rick MoradianVice President
13
Expand Current Program
Drive more freight through the consolidation network Multi country consolidation (MCC) Single country consolidation (SCC) Less than container shipments
Focus on managing the area of greatest impact. Asia to North America Asia to Europe
Target divisions to participate Design LP template to apply to the new divisions Begin mapping Purchase orders (850’s) into APLL
operating system (ACS123)

14
Gantt Chart: 100 Day PlanID Task Name Duration
1 Emerson Electric 100 day Implementation Plan 100 days
2 Formalize Agreement 16 days
3 Review contract 15 days
4 Sign contract 1 day
5
6 Standardized On-Boarding Documents 15 days
7 Standard Logistics Procedures 5 days
8 Standard Purchase Order Upload Format 5 days
9 Training Manual 5 days
10
11 Prioritize the implementation of remaining divisions 10 days
12 Analyze origin destination volumes, other factors 3 days
13 Preliminary ranking of div isions 2 days
14 Discuss with div isions, assess readiness 3 days
15 Develop schedule for on-boarding 2 days
16
17 Deliver recommendations for supply chain improvement 32 days
18 Analyze shipment data 10 days
19 Visit division HQ & DCs 10 days
20 Present interim report 1 day
21 Model and compare scenarios 10 days
22 Present final recommendations 1 day
23
24 On-board division 1 30 days
25 Review current logistics procedures 1 day
26 Establish report criteria 2 days
27 Exchange mapping documents & define components 1 day
28 Complete APLL IT request for services 4 hrs
29 Reaffirm onboarding parameters 6 hrs
30 Notify trading partners 6 hrs
31 Review LP with origins and customer support and customer 5 days
32 Amend Letters of Credit 2 days
33 Origin review with Emerson overseas personnel 5 days
34 Establish consensus on operational requirements 3 days
35 Identify process improvements 2 days
36 Draft APLL Final LP version 3 days
37 Draft AIS update instructions 3 days
38 Origin sign off on final LP version 1 day
39 Upload LP to APL Intranet 4 hrs
40 Distribute final LP to client 4 hrs
41 Obtain Emerson vendor list & overseas contacts 1 day
42 Contact vendors, set VEP schedule for vendors and Emerson personnel5 days
43 Conduct Origin Manufacturer Conference 2 days
44 Commence Operations 3 days
45 Repeat for 2 more divisions 60 days
3/28 4/4 4/11 4/18 4/25 5/2 5/9 5/16 5/23 5/30 6/6 6/13 6/20 6/27 7/4 7/11 7/18 7/25 8/1 8/8 8/15 8/22April May June July August
15
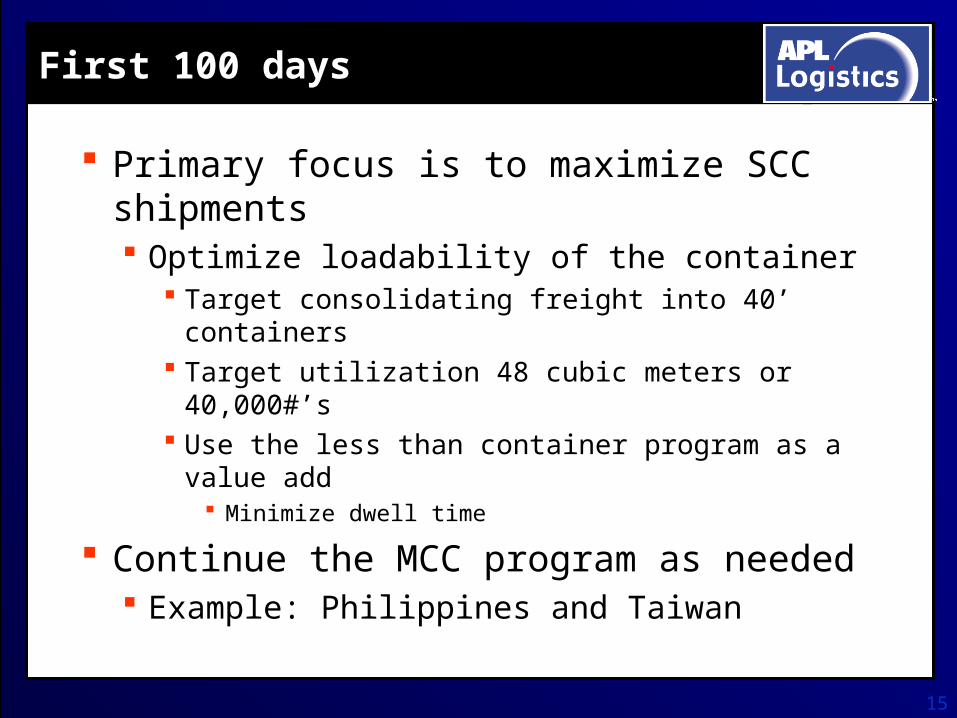
First 100 days
Primary focus is to maximize SCC shipments Optimize loadability of the container
Target consolidating freight into 40’ containers Target utilization 48 cubic meters or 40,000#’s Use the less than container program as a value
add Minimize dwell time
Continue the MCC program as needed Example: Philippines and Taiwan
16
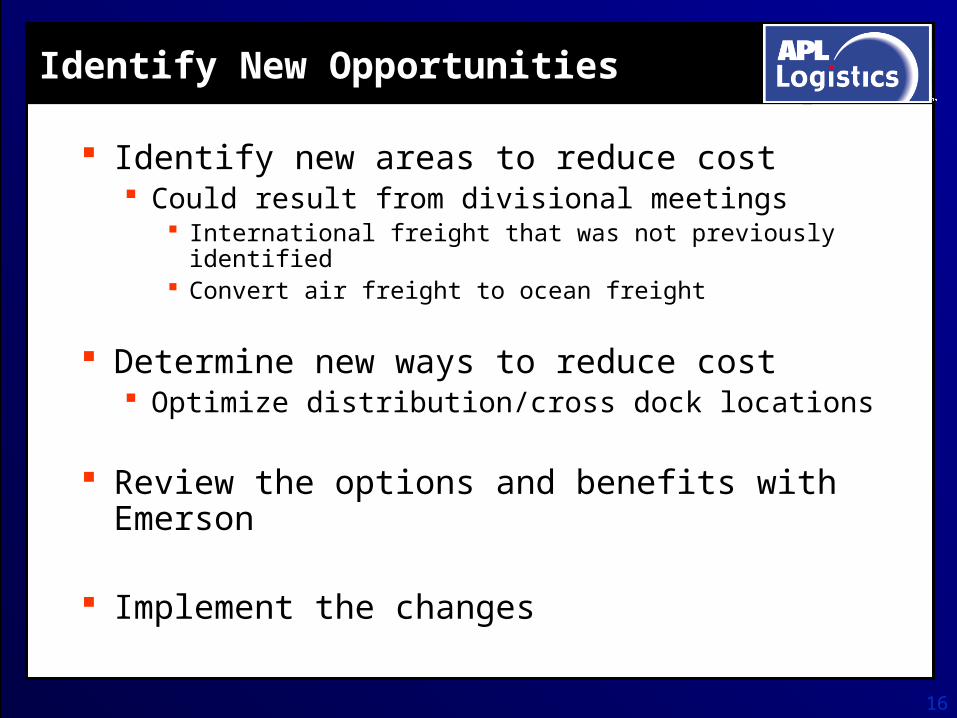
Identify New Opportunities
Identify new areas to reduce cost Could result from divisional meetings
International freight that was not previously identified Convert air freight to ocean freight
Determine new ways to reduce cost Optimize distribution/cross dock locations
Review the options and benefits with Emerson
Implement the changes
17
Review Emerson Ocean Contracts
Reviewed the ocean contract information provided by Emerson
Reviewed the port pairings and volumes provided
Compared Emerson contracts with APLL carrier contracts

18
Origin City Destination City
CHIWAN LOS ANGELES
MEMPHIS
FUZHOU MEMPHIS
HONG KONG CARLSBAD
LOS ANGELES
MEMPHIS
KAOHSIUNG LOS ANGELES
MEMPHIS
KEELUNG LOS ANGELES
MEMPHIS
SOUTHAVEN
LAT KRABANG MEMPHIS
MANILA NORTH HARBOR CARLSBAD
LOS ANGELES
MEMPHIS
SHANGHAI CHICAGO
LOS ANGELES
MEMPHIS
SOUTHAVEN
SHENZHEN CARLSBAD
MEMPHIS
SINGAPORE MEMPHIS
TAOYUAN MEMPHIS
YANTIAN CARLSBAD
LOS ANGELES
MEMPHIS
HONG KONG MEMPHIS
LAEM CHABANG MEMPHIS
QINGDAO MEMPHIS
SHANGHAI CHICAGO
MEMPHIS
YANTIAN MEMPHIS
KAOHSIUNG MEMPHIS
Analysis of Data Provided
Sample Data Summary
Size 20’ 40’ 40HC 45’
Units 644 869 358 117
Tier 1 Tier 2
Emerson ocean spend $2,638,666 $2,638,666
APLL contract rates $2,576,622 $2,379,293
Immediate Savings $62,042 $259,372
Percentage 2% 9%
Observations: Good potential to reduce the number
of 20’ containers Increase savings by APLL negotiating
future Tier 2 contracts
19
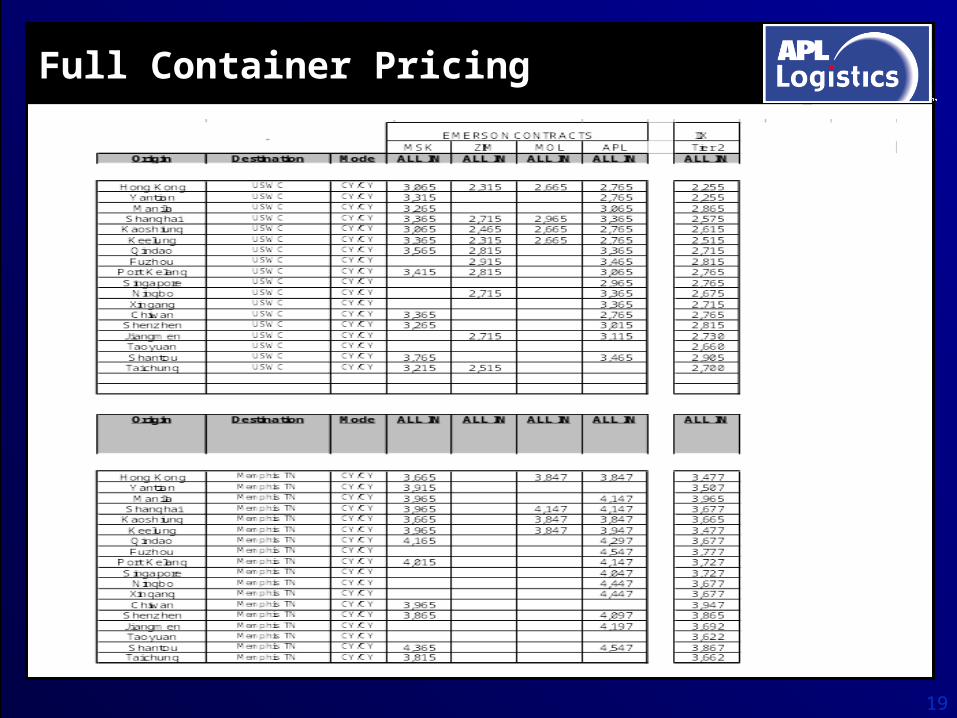
Full Container Pricing

20
Develop Predictable CBM Pricing
Consolidation and ocean freight combined
Price by lane - container freight station to distribution center door
Quicker transit than MCC Loadability variables
Heavy weight commodities Service and transit requirements Division specific packaging
21
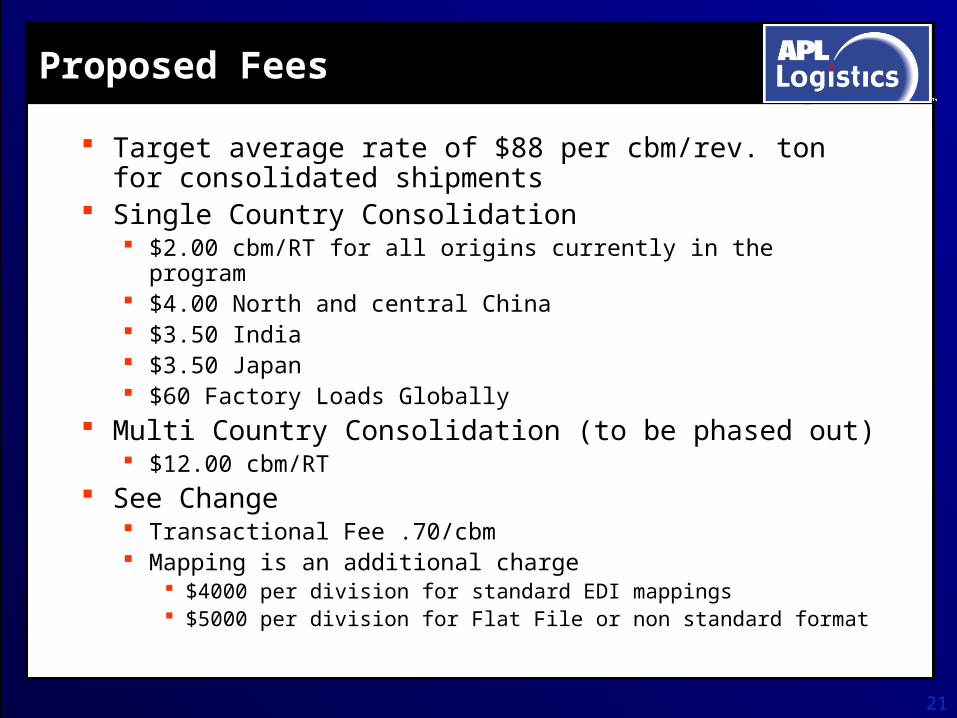
Proposed Fees
Target average rate of $88 per cbm/rev. ton for consolidated shipments
Single Country Consolidation $2.00 cbm/RT for all origins currently in the program $4.00 North and central China $3.50 India $3.50 Japan $60 Factory Loads Globally
Multi Country Consolidation (to be phased out) $12.00 cbm/RT
See Change Transactional Fee .70/cbm Mapping is an additional charge
$4000 per division for standard EDI mappings $5000 per division for Flat File or non standard format

22
Cubic Meter Pricing - Overflow

23
Destination Cross Dock and Delivery
Continue to cross dock in Carlsbad and Southaven
Propose improved cross docking strategy First priority is to shift Carlsbad to LA (Torrance)
Add additional cross dock destinations Need better understanding of volumes to
destinations for best pricing
24
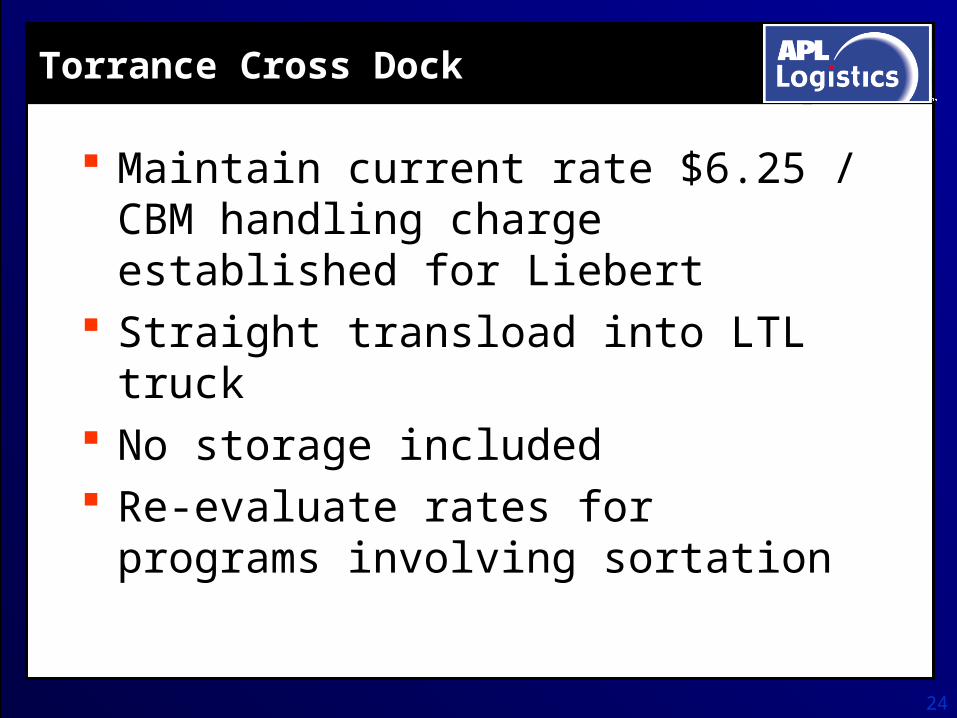
Torrance Cross Dock
Maintain current rate $6.25 / CBM handling charge established for Liebert
Straight transload into LTL truck No storage included Re-evaluate rates for programs
involving sortation
25
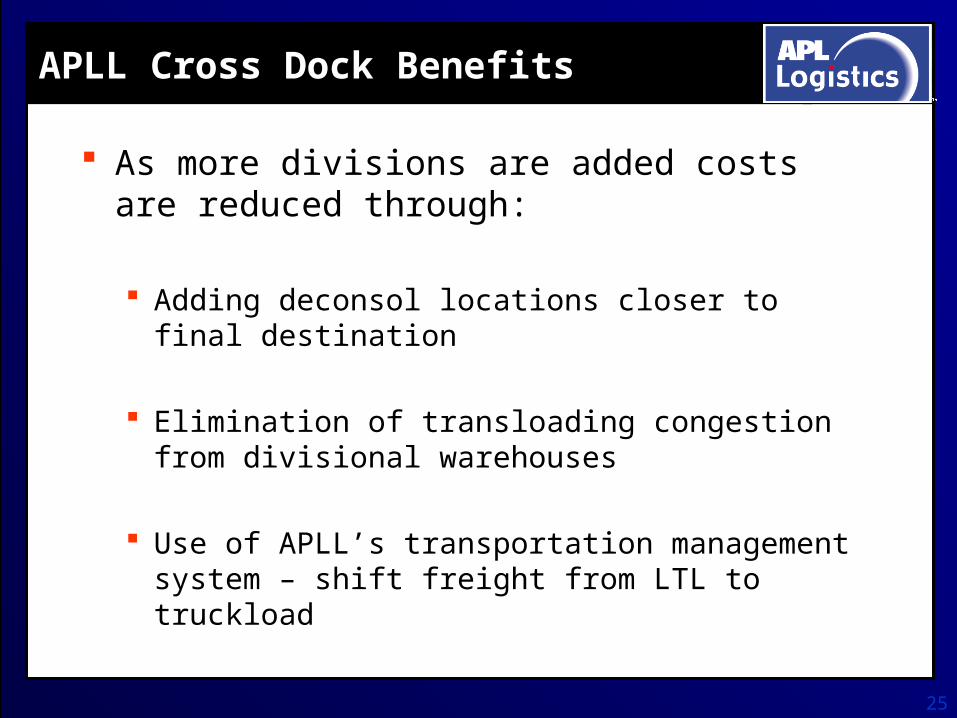
APLL Cross Dock Benefits
As more divisions are added costs are reduced through:
Adding deconsol locations closer to final destination
Elimination of transloading congestion from divisional warehouses
Use of APLL’s transportation management system – shift freight from LTL to truckload
26
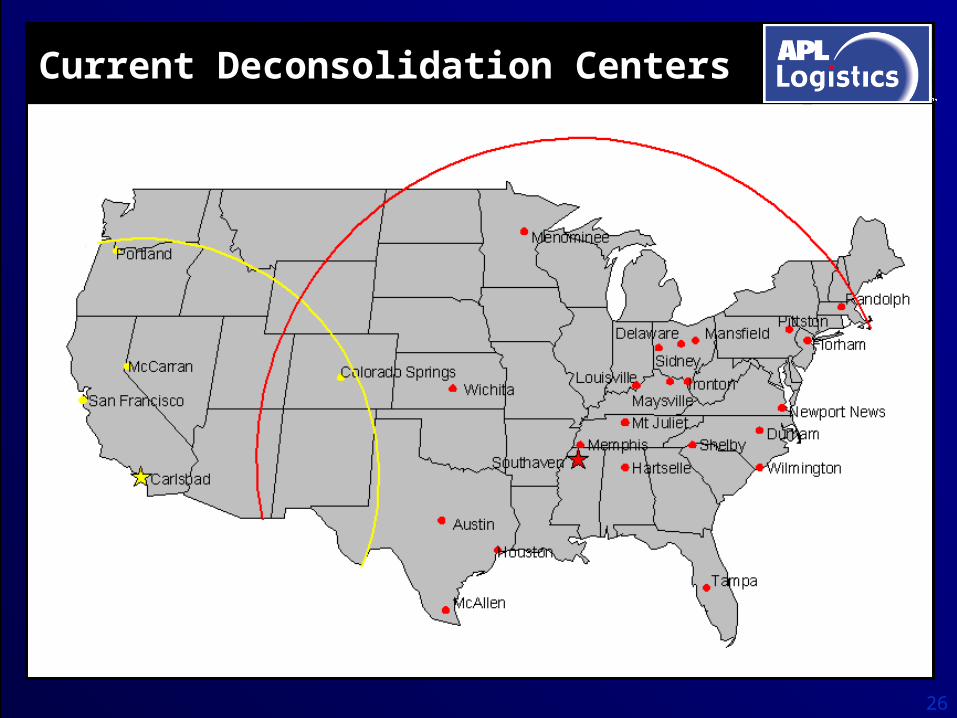
Current Deconsolidation Centers

27
Potential Deconsolidation Network
28
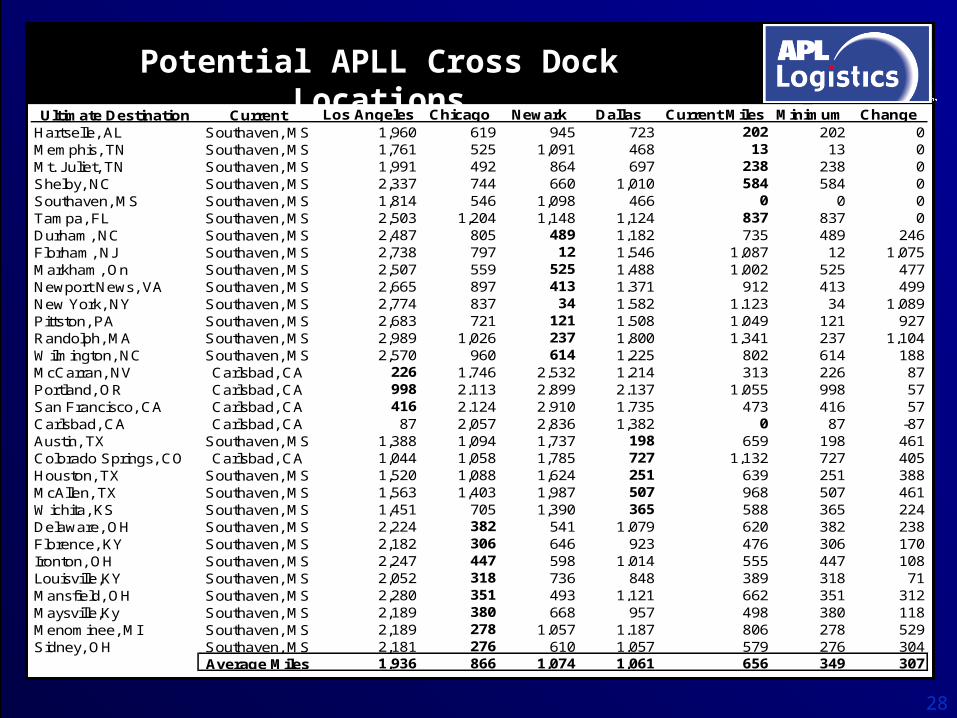
Potential APLL Cross Dock Locations
Ultimate Destination Current Los Angeles Chicago Newark Dallas Current Miles Minimum ChangeHartselle, AL Southaven, MS 1,960 619 945 723 202 202 0Memphis, TN Southaven, MS 1,761 525 1,091 468 13 13 0Mt. Juliet, TN Southaven, MS 1,991 492 864 697 238 238 0Shelby, NC Southaven, MS 2,337 744 660 1,010 584 584 0Southaven, MS Southaven, MS 1,814 546 1,098 466 0 0 0Tampa, FL Southaven, MS 2,503 1,204 1,148 1,124 837 837 0Durham, NC Southaven, MS 2,487 805 489 1,182 735 489 246Florham, NJ Southaven, MS 2,738 797 12 1,546 1,087 12 1,075Markham, On Southaven, MS 2,507 559 525 1,488 1,002 525 477Newport News, VA Southaven, MS 2,665 897 413 1,371 912 413 499New York, NY Southaven, MS 2,774 837 34 1,582 1,123 34 1,089Pittston, PA Southaven, MS 2,683 721 121 1,508 1,049 121 927Randolph, MA Southaven, MS 2,989 1,026 237 1,800 1,341 237 1,104Wilmington, NC Southaven, MS 2,570 960 614 1,225 802 614 188McCarran, NV Carlsbad, CA 226 1,746 2,532 1,214 313 226 87Portland, OR Carlsbad, CA 998 2,113 2,899 2,137 1,055 998 57San Francisco, CA Carlsbad, CA 416 2,124 2,910 1,735 473 416 57Carlsbad, CA Carlsbad, CA 87 2,057 2,836 1,382 0 87 -87Austin, TX Southaven, MS 1,388 1,094 1,737 198 659 198 461Colorado Springs, CO Carlsbad, CA 1,044 1,058 1,785 727 1,132 727 405Houston, TX Southaven, MS 1,520 1,088 1,624 251 639 251 388McAllen, TX Southaven, MS 1,563 1,403 1,987 507 968 507 461Wichita, KS Southaven, MS 1,451 705 1,390 365 588 365 224Delaware, OH Southaven, MS 2,224 382 541 1,079 620 382 238Florence, KY Southaven, MS 2,182 306 646 923 476 306 170Ironton, OH Southaven, MS 2,247 447 598 1,014 555 447 108Louisville,KY Southaven, MS 2,052 318 736 848 389 318 71Mansfield, OH Southaven, MS 2,280 351 493 1,121 662 351 312Maysville,Ky Southaven, MS 2,189 380 668 957 498 380 118Menominee, MI Southaven, MS 2,189 278 1,057 1,187 806 278 529Sidney, OH Southaven, MS 2,181 276 610 1,057 579 276 304
Average Miles 1,936 866 1,074 1,061 656 349 307
29
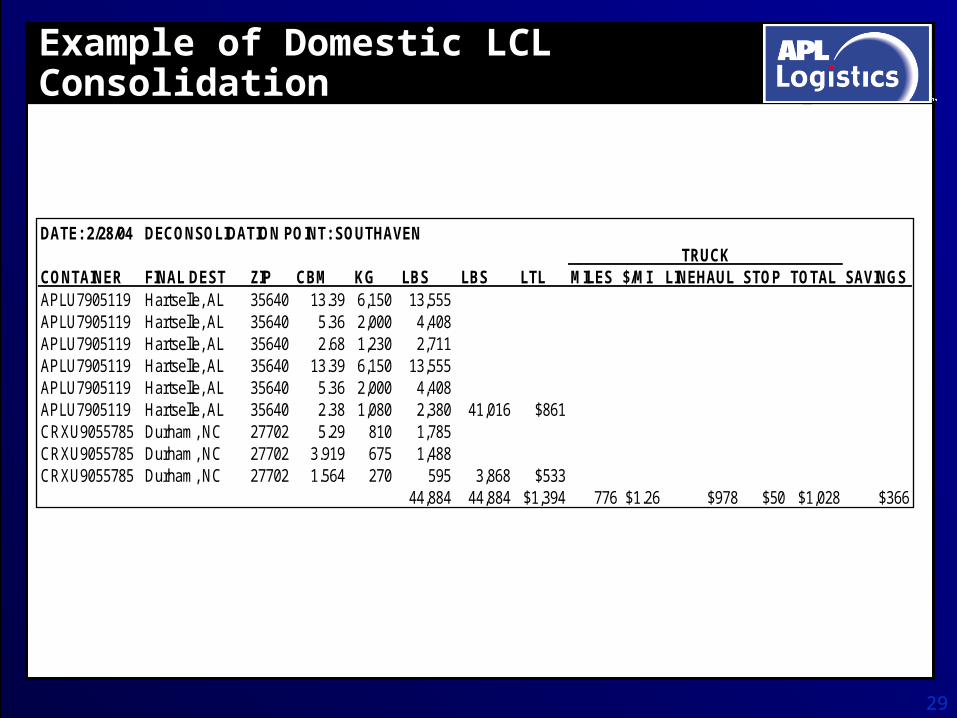
Example of Domestic LCL Consolidation
DATE: 2/28/04 DECONSOLIDATION POINT: SOUTHAVEN
CONTAINER FINAL DEST ZIP CBM KG LBS LBS LTL MILES $/MI LINEHAUL STOP TOTAL SAVINGSAPLU7905119 Hartselle, AL 35640 13.39 6,150 13,555 APLU7905119 Hartselle, AL 35640 5.36 2,000 4,408 APLU7905119 Hartselle, AL 35640 2.68 1,230 2,711 APLU7905119 Hartselle, AL 35640 13.39 6,150 13,555 APLU7905119 Hartselle, AL 35640 5.36 2,000 4,408 APLU7905119 Hartselle, AL 35640 2.38 1,080 2,380 41,016 $861CRXU9055785 Durham, NC 27702 5.29 810 1,785 CRXU9055785 Durham, NC 27702 3.919 675 1,488 CRXU9055785 Durham, NC 27702 1.564 270 595 3,868 $533
44,884 44,884 $1,394 776 $1.26 $978 $50 $1,028 $366
TRUCK

30
Brokerage Plan
Managing broker to coordinate other brokers
Scope of brokerage includes US, Europe & Asia
Move towards fewer brokers Encourage cross division shipping
Issues Currently 70+ brokers Resistance to change
31
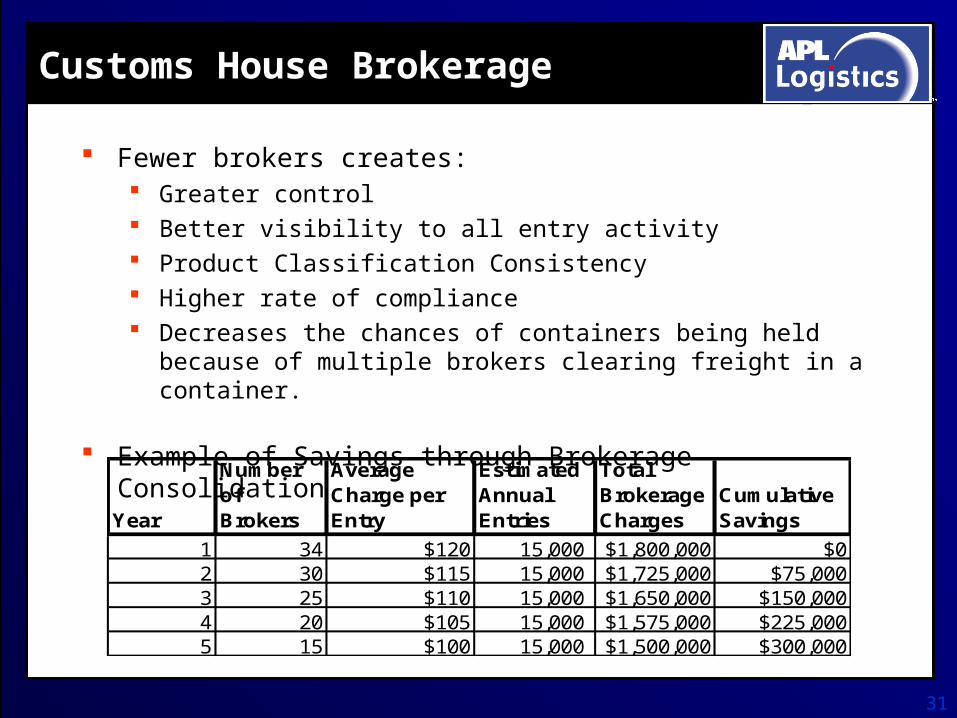
Customs House Brokerage
Fewer brokers creates: Greater control Better visibility to all entry activity Product Classification Consistency Higher rate of compliance Decreases the chances of containers being held because of
multiple brokers clearing freight in a container.
Example of Savings through Brokerage Consolidation
Year
Number of Brokers
Average Charge per Entry
Estimated Annual Entries
Total Brokerage Charges
Cumulative Savings
1 34 $120 15,000 $1,800,000 $02 30 $115 15,000 $1,725,000 $75,0003 25 $110 15,000 $1,650,000 $150,0004 20 $105 15,000 $1,575,000 $225,0005 15 $100 15,000 $1,500,000 $300,000

32
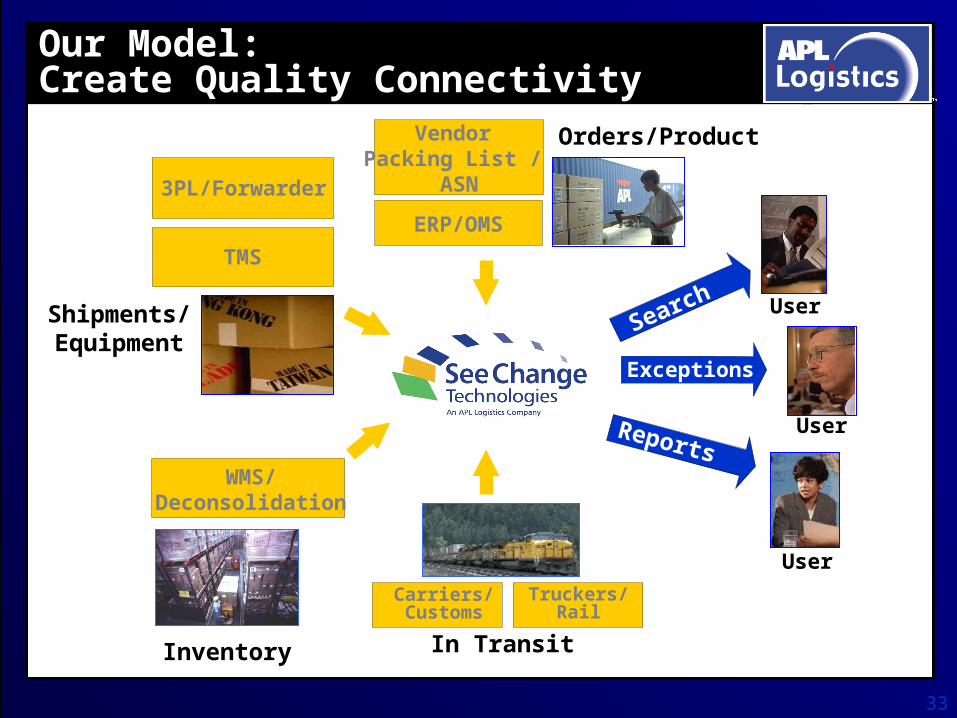
See Change - Adding Value
Multi level supply chain visibility For tracking shipment status
Ocean, air, CHB, deconsolidation, delivery
Unique internal visibility Visibility at the divisional level Exclusive visibility at the corporate level
Provides customized exceptions mgmt Exceptions set based on specific KPI’s
33
Exceptions
TMS
3PL/Forwarder
ERP/OMS
Vendor Packing List /
ASN
User
User
UserReports
Search
WMS/Deconsolidation
Orders/Product
Inventory
Our Model: Create Quality Connectivity
Shipments/Equipment
Carriers/Customs
Truckers/Rail
In Transit

34
Formalize Agreement
Upon agreement of the 100 day plan, create a contract to formalize the details
Incorporate 100 day plan into the agreement
Create master agreement which defines Relationship Terms and Conditions KPI’s 5 year term


![Main St Loan Program and Non Profits and Dividends and Capital … · 2020-07-01 · Main St Loan Program and Non Profits and Dividends and Capital Distributions Lloyd Lewis [llewis@arcthrift.com]](https://img.pdfslide.net/doc/110x75/5fa787377052481d527c588b/main-st-loan-program-and-non-profits-and-dividends-and-capital-2020-07-01-main.jpg)