Embed Size (px)
Citation preview
Prepared for:
205 South 17th AvenuePhoenix, Arizona 85007
Prepared by:
101 North 1st Avenue, Suite 2600Phoenix, Arizona 85003
Federal No.: 010-E(210)AProject No.: 010 PM 260 H7825 01 L
Tucson District – Pima County
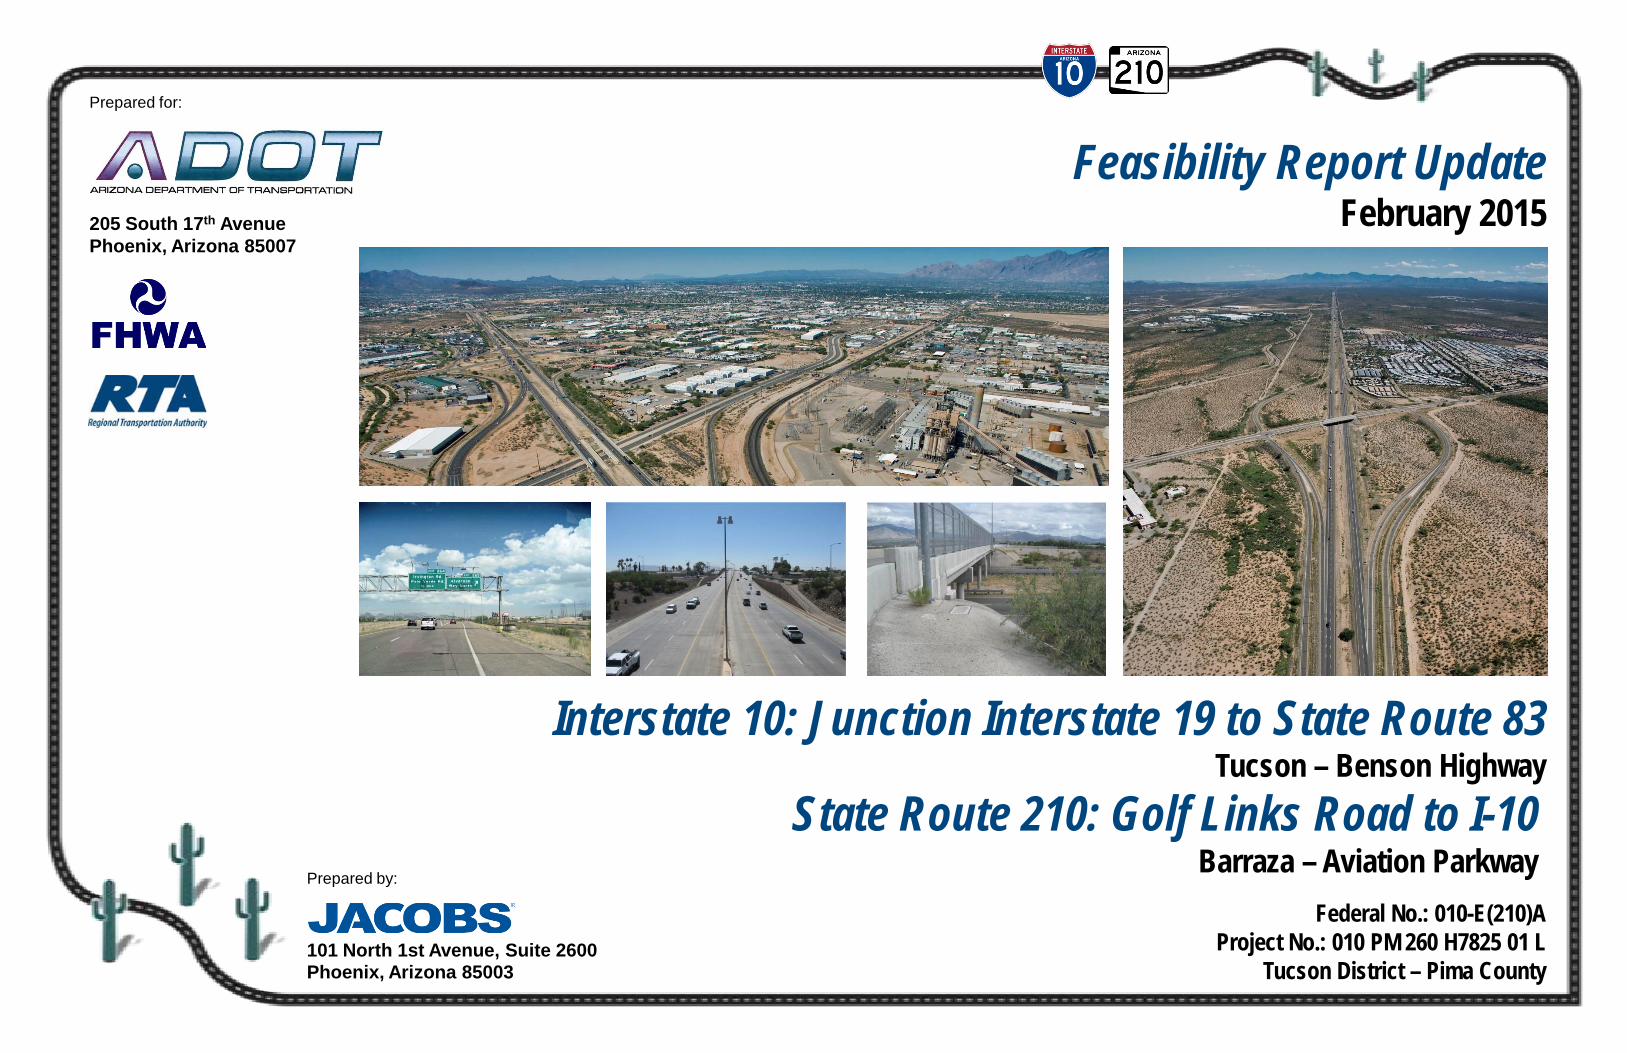
Interstate 10: Junction Interstate 19 to State Route 83Tucson – Benson Highway
Feasibility Report UpdateFebruary 2015
State Route 210: Golf Links Road to I-10Barraza – Aviation Parkway
I-10; Jct. I-19 to SR 83 & SR 210; Golf Links Road to I-10 Feasibility Report Update
i
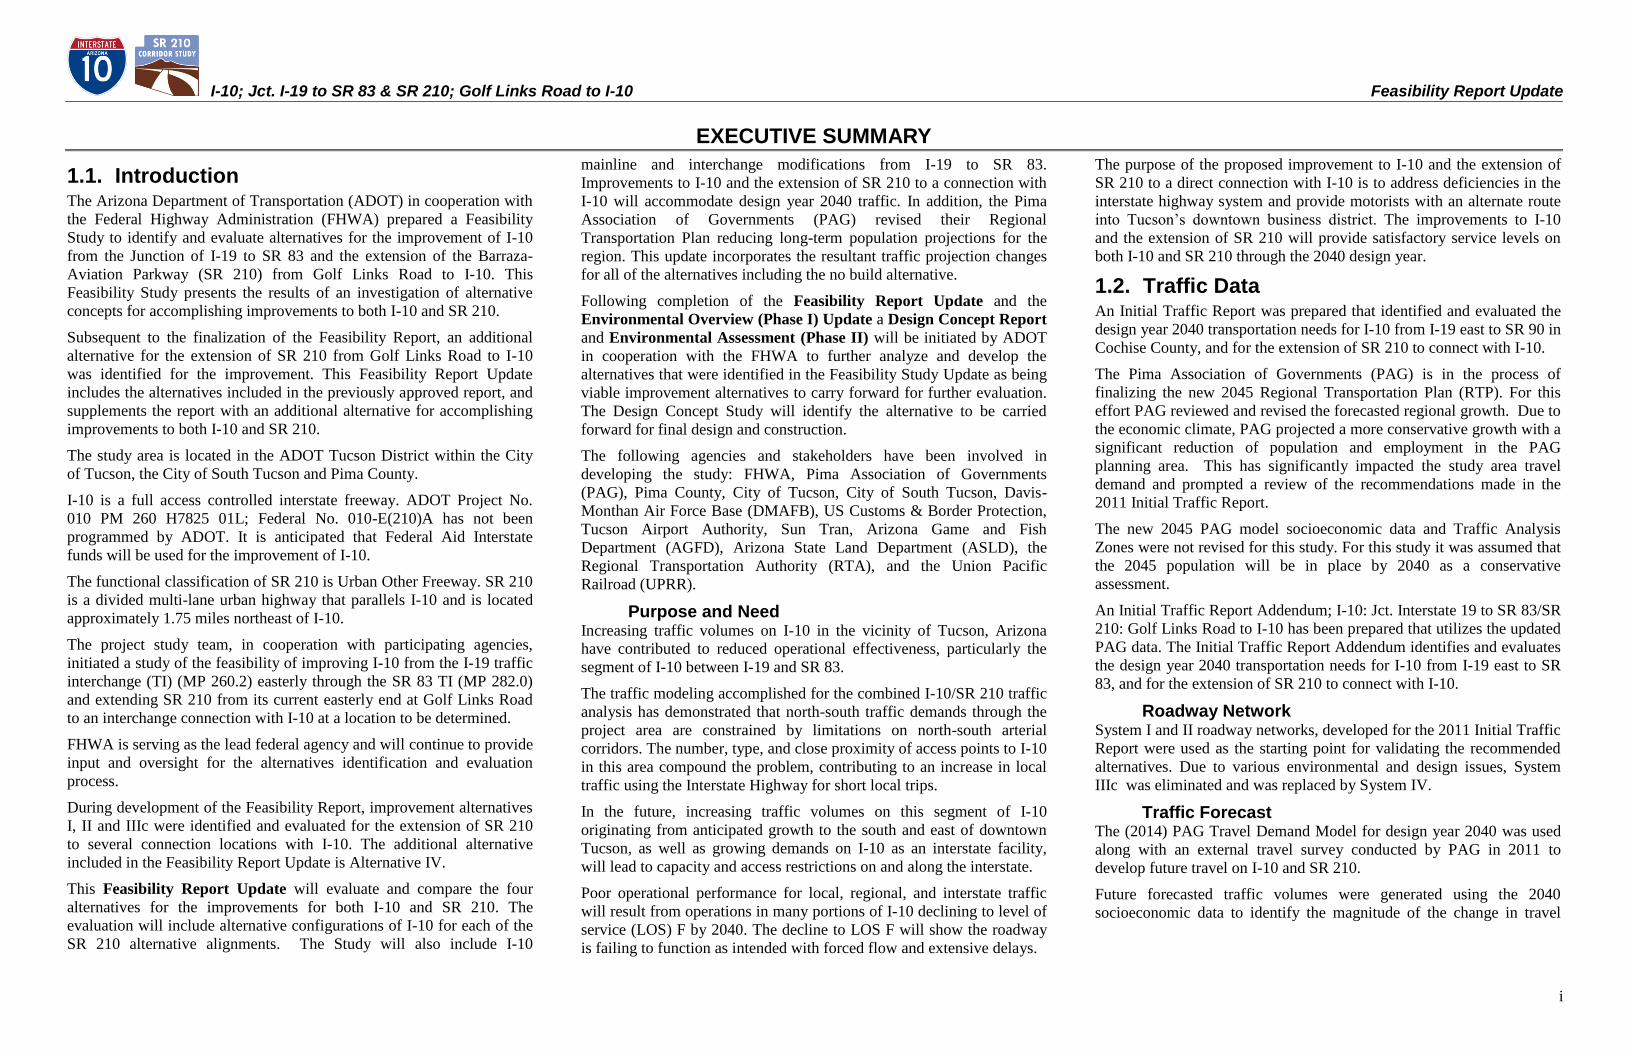
EXECUTIVE SUMMARY
1.1. Introduction The Arizona Department of Transportation (ADOT) in cooperation with
the Federal Highway Administration (FHWA) prepared a Feasibility
Study to identify and evaluate alternatives for the improvement of I-10
from the Junction of I-19 to SR 83 and the extension of the Barraza-
Aviation Parkway (SR 210) from Golf Links Road to I-10. This
Feasibility Study presents the results of an investigation of alternative
concepts for accomplishing improvements to both I-10 and SR 210.
Subsequent to the finalization of the Feasibility Report, an additional
alternative for the extension of SR 210 from Golf Links Road to I-10
was identified for the improvement. This Feasibility Report Update
includes the alternatives included in the previously approved report, and
supplements the report with an additional alternative for accomplishing
improvements to both I-10 and SR 210.
The study area is located in the ADOT Tucson District within the City
of Tucson, the City of South Tucson and Pima County.
I-10 is a full access controlled interstate freeway. ADOT Project No.
010 PM 260 H7825 01L; Federal No. 010-E(210)A has not been
programmed by ADOT. It is anticipated that Federal Aid Interstate
funds will be used for the improvement of I-10.
The functional classification of SR 210 is Urban Other Freeway. SR 210
is a divided multi-lane urban highway that parallels I-10 and is located
approximately 1.75 miles northeast of I-10.
The project study team, in cooperation with participating agencies,
initiated a study of the feasibility of improving I-10 from the I-19 traffic
interchange (TI) (MP 260.2) easterly through the SR 83 TI (MP 282.0)
and extending SR 210 from its current easterly end at Golf Links Road
to an interchange connection with I-10 at a location to be determined.
FHWA is serving as the lead federal agency and will continue to provide
input and oversight for the alternatives identification and evaluation
process.
During development of the Feasibility Report, improvement alternatives
I, II and IIIc were identified and evaluated for the extension of SR 210
to several connection locations with I-10. The additional alternative
included in the Feasibility Report Update is Alternative IV.
This Feasibility Report Update will evaluate and compare the four
alternatives for the improvements for both I-10 and SR 210. The
evaluation will include alternative configurations of I-10 for each of the
SR 210 alternative alignments. The Study will also include I-10
mainline and interchange modifications from I-19 to SR 83.
Improvements to I-10 and the extension of SR 210 to a connection with
I-10 will accommodate design year 2040 traffic. In addition, the Pima
Association of Governments (PAG) revised their Regional
Transportation Plan reducing long-term population projections for the
region. This update incorporates the resultant traffic projection changes
for all of the alternatives including the no build alternative.
Following completion of the Feasibility Report Update and the
Environmental Overview (Phase I) Update a Design Concept Report
and Environmental Assessment (Phase II) will be initiated by ADOT
in cooperation with the FHWA to further analyze and develop the
alternatives that were identified in the Feasibility Study Update as being
viable improvement alternatives to carry forward for further evaluation.
The Design Concept Study will identify the alternative to be carried
forward for final design and construction.
The following agencies and stakeholders have been involved in
developing the study: FHWA, Pima Association of Governments
(PAG), Pima County, City of Tucson, City of South Tucson, Davis-
Monthan Air Force Base (DMAFB), US Customs & Border Protection,
Tucson Airport Authority, Sun Tran, Arizona Game and Fish
Department (AGFD), Arizona State Land Department (ASLD), the
Regional Transportation Authority (RTA), and the Union Pacific
Railroad (UPRR).
Purpose and Need Increasing traffic volumes on I-10 in the vicinity of Tucson, Arizona
have contributed to reduced operational effectiveness, particularly the
segment of I-10 between I-19 and SR 83.
The traffic modeling accomplished for the combined I-10/SR 210 traffic
analysis has demonstrated that north-south traffic demands through the
project area are constrained by limitations on north-south arterial
corridors. The number, type, and close proximity of access points to I-10
in this area compound the problem, contributing to an increase in local
traffic using the Interstate Highway for short local trips.
In the future, increasing traffic volumes on this segment of I-10
originating from anticipated growth to the south and east of downtown
Tucson, as well as growing demands on I-10 as an interstate facility,
will lead to capacity and access restrictions on and along the interstate.
Poor operational performance for local, regional, and interstate traffic
will result from operations in many portions of I-10 declining to level of
service (LOS) F by 2040. The decline to LOS F will show the roadway
is failing to function as intended with forced flow and extensive delays.
The purpose of the proposed improvement to I-10 and the extension of
SR 210 to a direct connection with I-10 is to address deficiencies in the
interstate highway system and provide motorists with an alternate route
into Tucson‟s downtown business district. The improvements to I-10
and the extension of SR 210 will provide satisfactory service levels on
both I-10 and SR 210 through the 2040 design year.
1.2. Traffic Data An Initial Traffic Report was prepared that identified and evaluated the
design year 2040 transportation needs for I-10 from I-19 east to SR 90 in
Cochise County, and for the extension of SR 210 to connect with I-10.
The Pima Association of Governments (PAG) is in the process of
finalizing the new 2045 Regional Transportation Plan (RTP). For this
effort PAG reviewed and revised the forecasted regional growth. Due to
the economic climate, PAG projected a more conservative growth with a
significant reduction of population and employment in the PAG
planning area. This has significantly impacted the study area travel
demand and prompted a review of the recommendations made in the
2011 Initial Traffic Report.
The new 2045 PAG model socioeconomic data and Traffic Analysis
Zones were not revised for this study. For this study it was assumed that
the 2045 population will be in place by 2040 as a conservative
assessment.
An Initial Traffic Report Addendum; I-10: Jct. Interstate 19 to SR 83/SR
210: Golf Links Road to I-10 has been prepared that utilizes the updated
PAG data. The Initial Traffic Report Addendum identifies and evaluates
the design year 2040 transportation needs for I-10 from I-19 east to SR
83, and for the extension of SR 210 to connect with I-10.
Roadway Network System I and II roadway networks, developed for the 2011 Initial Traffic
Report were used as the starting point for validating the recommended
alternatives. Due to various environmental and design issues, System
IIIc was eliminated and was replaced by System IV.
Traffic Forecast The (2014) PAG Travel Demand Model for design year 2040 was used
along with an external travel survey conducted by PAG in 2011 to
develop future travel on I-10 and SR 210.
Future forecasted traffic volumes were generated using the 2040
socioeconomic data to identify the magnitude of the change in travel
I-10; Jct. I-19 to SR 83 & SR 210; Golf Links Road to I-10 Feasibility Report Update
ii
demand between the old model assumptions used in the original traffic
forecast and the assumptions used in the new model.
The No Build Scenario was used to create a benchmark against which
the System Alternatives were compared.
Future forecasted traffic volumes were generated using the new 2040
socioeconomic data and future System I, II and IV roadway network
alternatives. The roadway configurations needed to achieve acceptable
levels of service for the alternatives.
Traffic Operational Analysis The traffic operational analysis evaluates the peak hour traffic volumes
obtained from the regional modeling efforts to refine and ensure that the
improvement alternatives are operationally feasible. This iterative
process includes roadway characteristics, traffic volumes, traffic control
measures, and access spacing.
A traffic operational analysis was conducted using the VISSIM
microsimulation model for the following scenarios.
1. Year 2010: Existing Conditions I-10 and SR 210.
The existing roadway network within the study area was evaluated
using traffic data collected in year 2010.
2. Year 2040: No-Build
The existing roadway network within the study area was evaluated
with the updated projected year 2040 traffic volumes. Under this
scenario there were no proposed improvements made to either I-10
or SR 210.
3. Year 2040: System Alternative I. See Figure 3.1 System
Alternative I.
An improved roadway network was evaluated with the updated
projected year 2040 traffic volumes. In the System Alternative I
roadway improvement alternative, SR 210 is extended as a freeway
along the Alvernon Way alignment to connect to I-10 at a system
interchange.
4. Year 2040: System Alternative II. See Figure 3.2 System
Alternative II.
An improved roadway network was evaluated with the updated
projected year 2040 traffic volumes. In the System Alternative II
roadway improvement alternative, the freeway connection from I-10
to SR 210 begins just west of Valencia Road and continues parallel
to the DMAFB before tying into the existing SR 210.
5. Year 2040: System Alternative IV. See Figure 3.5 System
Alternative IV.
An improved roadway network was evaluated with the updated
projected year 2040 traffic volumes. The System Alternative IV
roadway improvement alternative will extend SR 210 as a freeway
along the Alvernon Way alignment and connect to I-10 with a
system interchange. The improvement of I-10 will include the
addition of Collector Distributor lanes both eastbound and
westbound between the I-10/SR 210 System Interchange and Kolb
Road.
Per ADOT Roadway Design Guidelines, for I-10 and SR 210 mainline
and ramp roadways, and for intersections of ramps and crossroads, LOS
D is acceptable for urban conditions. The section of I-10 between I-19
and SR 83 as well as SR 210 within the study area is considered urban in
character for design year 2040.
Results of Operational Analysis The operational analysis showed that System Alternative I, System
Alternative II and System Alternative IV will operate with satisfactory
service levels. However, additional iterations to modify traffic
movements, primarily at traffic interchange (TI) ramps and crossroads,
will be required for some traffic movements during the Phase II Design
Concept Study.
1.3 Alternatives Considered Improvements to I-10 and the extension of SR 210 to a connection with
I-10 will be based primarily on developing the capacity to carry the
projected 2040 design year traffic demand as identified via macro-level
traffic modeling. This will require determining the minimum number of
lanes in each direction needed for mainline I-10 with the SR 210
extension. Improvements will include improving existing conditions,
such as; short weaving distances (especially regarding successive loop
ramps), TIs spaced closer than the desirable one mile spacing, and short
driver decision-making distances.
A two level analysis is used to identify alternatives to be carried forward
to the Phase II Design Concept Study.
Level 1 examines alternatives for fatal flaws that render the alternative
unusable. Alternatives that have no fatal flaws identified are then
evaluated under Level 2.
Level 2 analysis includes:
A determination of the traffic handling capability of each
alternative, using design year traffic projections.
Identification of impacts to surrounding area resulting from each
alternative.
A rough estimate of cost based on conceptual configuration of the
roadway.
Other factors as identified during the study process.
Level 1 Alternative Identification The Level 1 process identifies alternative locations along I-10 for the
connection of the SR 210 extension. Alternative alignments for the
extension of SR 210 are then identified and both SR 210 and I-10 are
evaluated to determine fatal flaws that may eliminate some of the
connection points. The fatal flaws consist of factors that prohibit
locating the SR 210 roadway in particular areas.
Only those alternatives that are feasible will be carried forward.
Evaluation criteria include, but are not limited to:
Support the major interchange of SR 210 with Alvernon Way/Golf
Links Road.
Avoid major impacts to DMAFB.
Avoid major environmental, social and economic impacts identified
along the alignment.
Support the system interchange with I-10.
Support local interchanges adjacent to the system interchange.
Six initial connection locations to I-10 were identified and evaluated
using the criteria listed above.
System Alternative I I-10/SR 210 connection at Alvernon Way: There were no fatal flaws
identified for the I-10/SR 210 connection at Alvernon Way. An
alternative identified as System Alternative I will be carried
forward for Level 2 analysis. See Figure 3.1 System Alternative I.
System Alternative II I-10/SR 210 connection west of Valencia Road: There were no fatal
flaws identified for the I-10/SR 210 connection west of Valencia
Road. An alternative identified as System Alternative II will be
carried forward for Level 2 analysis. See Figure 3.2 System
Alternative II.
System Alternatives III, IIIa & IIIb I-10/SR 210 connections east of Wilmot Road: Three alignment
alternatives were investigated to connect SR 210 with I-10 east of
Wilmot Road. See Figure 3.3 System Alternative III, IIIa and
IIIb.
– System Alternative III impacts the Thomas Jay Regional Park,
the Craycroft Elementary School and the Lauffer Middle School.
System Alternative III was eliminated from consideration.
– Concerns with System Alternatives IIIa and IIIb:
I-10; Jct. I-19 to SR 83 & SR 210; Golf Links Road to I-10 Feasibility Report Update
iii
System Alternatives IIIa and IIIb have the same horizontal
alignment. The alignment of both alternatives impact DMAFB:
o The alignment would pass within the restricted radius of a
hazardous object pad that is located within DMAFB.
o The alignments cross the corner of the runway Clear Zone,
which is not allowed.
o The alignments are within the Accident Potential Zone.
o The alignments are located within Military Munitions
Response Program areas.
– The possibility of realigning System Alternatives IIIa and/or IIIb
was reviewed. However, no satisfactory alignment for these
alternatives could be developed. System Alternatives IIIa and
IIIb were eliminated from consideration.
System Alternative IIIc System Alternative IIIc would connect the extension of SR 210 to I-
10 at Wilmot Road. This alternative was identified after it was
determined that System Alternatives III, IIIa and IIIb were not
acceptable. See Figure 3.4 System Alternative IIIc.
System Alternative IIIc was eliminated because:
The estimated cost of System Alternative IIIc, not including the
costs of right-of-way, utilities, hazardous material protection, or
relocation, significantly higher than either System Alternative I
or II.
System Alternative IIIc would require relocation of
approximately 50 more residences than either System Alternative
I or II.
There would be numerous conflicts with utilities located within
local streets that would be crossed by System Alternative IIIc.
The vertical alignment would be depressed for much of the route
including a portion under a major wash.
Right-of-way acquisition would be required from DMAFB.
The alignment of System Alternative IIIc passes near areas on
DMAFB where explosive ordinance is removed from aircraft,
creating a likely danger to users of the roadway if accidental
explosions occurred.
The alignment of the roadway near DMAFB would need to be
checked for unexploded ordinance.
System Alternative IV
System Alternative IV is the extension of SR 210 south along the
Alvernon Way alignment to I-10 and the addition of collector-
distributor (CD) roadways adjacent to both the eastbound and
westbound I-10 mainline roadway from Alvernon Way easterly
through the Kolb Road TI.
System Alternative IV will be carried forward for Level 2 analysis.
Other I-10/SR 210 Connection Locations:
Craycroft Road: The I-10/SR 210 connection at Craycroft Road was
eliminated because:
– It bisected the community of Littletown and impacted both
Lauffer Middle School and Craycroft Elementary School.
– The system interchange ramps would conflict with the Valencia
Road/I-10 TI, which would require the removal of the Valencia
Road/I-10 TI ramps.
Kolb Road and Rita Road: The I-10/SR 210 connections at both
Kolb Road and Rita Road were eliminated because they shared the
same alignment through the environmentally sensitive areas as the
connection east of Wilmot Road identified above as System
Alternative III.
Analysis of projected traffic on I-10 in the design year 2040 showed
there would be only marginal improvements in I-10 traffic if the SR 210
connection with I-10 was extended to the east of Wilmot Road. This
analysis reduces the value of alternative connections of SR 210 to I-10
east of Wilmot Road. See the Initial Traffic Report for further details.
Level 2 Alternative Analysis The Level 2 further evaluates alternatives that were found to have no
fatal flaws. Alternatives are developed to the extent that the traffic
handling capability is identified and impacts to the adjacent properties
are identified. The evaluation includes an estimate of cost based on the
conceptual configuration. Other factors identified during the study
process are also included in the evaluation of the alternatives.
System Alternative I This alternative extends SR 210 southerly along the existing Alvernon
Way alignment to I-10. See Figure 3.1 System Alternative I.
SR 210 between Golf Links Road and I-10 is a minimum of four lanes
in each direction to accommodate both SR 210 through traffic and local
traffic.
The SR 210/Alvernon Way/Golf Links TI provides all traffic
movements except access to Contractors Way. Access to Contractors
Way is provided from SR 210 via the Ajo Way TI.
The I-10/SR 210 system interchange lies on top of and incorporates the
existing diamond TI at Alvernon Way and I-10.
System Alternative II This alternative extends SR 210 southerly through the Alvernon
Way/Golf Links TI, where it turns to the east along the southern edge of
Davis-Monthan AFB, and then south along the Swan Road alignment to
I-10. See Figure 3.2 System Alternative II.
SR 210 is a minimum of two lanes in each direction. The SR
210/Alvernon Way/Golf Links TI provides all traffic movements except
access to Contractors Way. Access to Contractors Way is provided from
SR 210 via a TI at Irvington Road.
Because of the proximity of the proposed system interchange to the
existing diamond TI at Valencia Road, the westbound Valencia Road
and Craycroft Road ramps will be incorporated into the system
interchange to provide access to/from both I-10 and SR 210.
System Alternative IV System Alternative IV is the extension of SR 210 south along the
Alvernon Way alignment to I-10 and the addition of collector-distributor
(CD) roadways adjacent to both the eastbound and westbound I-10
mainline roadway from Alvernon Way easterly through the Kolb Road
TI. See Figure 3.5 System Alternative IV.
A system interchange will provide access between SR 210 and the
eastbound and westbound I-10 CD roadways.
The eastbound CD roadway is a continuation of the southbound SR
210 roadway.
A ramp will be provided to allow vehicles on eastbound I-10 to exit
I-10 and enter the eastbound CD roadway.
The westbound CD roadway will curve to the north approaching
Alvernon Way and become the northbound SR 210 roadway.
Traffic interchanges will provide access between the CD roadways
and major cross streets at Valencia Road, Craycroft Road, Wilmot
Road and Kolb Road within the limits of the CD roadways.
Modifications to Existing I-10 Modifications to existing I-10 from I-19 to SR 83 are required to
provide an acceptable LOS for design year 2040. The modifications
include improvements to both the I-10 mainline roadway and to the
existing I-10 TIs within the project limits.
I-10 Traffic Interchanges (TI) In urban conditions, TIs should nominally be one mile apart.
However, the location of some major cross-roads that intersect I-10 with
TIs results in distances between TIs of less than one mile.
I-10; Jct. I-19 to SR 83 & SR 210; Golf Links Road to I-10 Feasibility Report Update
iv
Park Avenue TI is approximately 0.7 miles from both 6th
Avenue TI
and Kino Parkway TI.
Craycroft Road TI is approximately 0.85 miles from the Valencia
Road TI.
Palo Verde Road TI is approximately 0.6 miles from the Alvernon
Way TI.
Elimination of these TIs is not practical, as they provide needed access
to local businesses and governmental services. Therefore,
reconfiguration of TI ramps is needed to maintain access, yet maximize
weaving distances and safety for the traveling public. The Palo Verde
Road TI can be removed and a new TI at Country Club Road is needed
and will be added. Country Club Road is located approximately 1.2
miles from Kino Boulevard TI and Alvernon Way TI.
All other TIs meet or exceed the minimum one mile spacing criteria.
Each of the existing TIs within the project limits was evaluated from a
capacity and safety standpoint to determine needed improvements. The
evaluation process involved:
Using the projected 2040 peak hour traffic volumes and micro-
modeling software to identify problem areas or movements that have
unacceptable levels of service.
Identifying solutions.
Testing solutions by re-running the micro-model with the proposed
solutions coded into the software.
Repeating the iterative process until adequate solutions are
produced.
A description of improvements for each existing and new TI is included
in Section 3.3 of this report. Improvements meet the capacity and
operational requirements, but are not necessarily the final recommended
solution. That is to be determined in the Phase II Design Concept Study.
Alternatives for Further Consideration Three alternatives will be carried forward to the Phase II Design
Concept Study for further consideration:
I-10/SR 210 System Alternative I
I-10/SR 210 System Alternative II
I-10/SR 210 System Alternative IV
Section 3.3 identifies items that will require additional analysis during
the Phase II Design Concept Study.
Evaluation Criteria As a result of input from the Study Team, Performance Measures have
been developed for evaluating the impact of alternative transportation
improvements during the Phase II Design Concept Study. The
Performance Measure Ranking percentages are as follows:
30% Transportation Performance
25% Financial/Economic Performance
15% Social Impact
15% Land Use/Economic Development Impacts
15% Environmental Impacts
1.4 Environmental Overview The Environmental Overview is summarized in Section 5 of this report.
The entire Environmental Overview is in Appendix H of this report.
A Public Information Meeting was held October 6, 2011. The meeting is
summarized in the Environmental Overview Summary.
1.5 Cost Estimates The total estimated costs for System Alternative I and II are listed
below. The costs exclude the cost of utilities and ROW. The amount of
ROW to be acquired, in acres, is listed separately.
System Alternative I
I-10 $691,100,000
SR 210 $194,940,000
System Alternative I Total $886,040,000
System Alternative I ROW – 196 acres
System Alternative II
I-10 $671,270,000
SR 210 $171,200,000
System Alternative II Total $842,470,000
System Alternative II ROW – 337 acres
System Alterative IV
I-10 $761,590,000
SR 210 $193,650,000
System Alternative IV Total $955,240,000
System Alternative IV ROW - 192 acres
I-10; Jct. I-19 to SR 83 & SR 210; Golf Links Road to I-10 Feasibility Report Update
vi
LIST OF FIGURES Figure 1.1 Project Location Map ............................................................ 1
Figure 1.2 Vicinity Map .......................................................................... 3
Figure 2.1 Influence Area and Study Map .............................................. 7
Figure 2.2 2040 LOS Depiction .............................................................. 9
Figure 2.3 2040 Number of Lanes – System I ...................................... 10
Figure 2.4 2040Number of Lanes – System II ...................................... 11
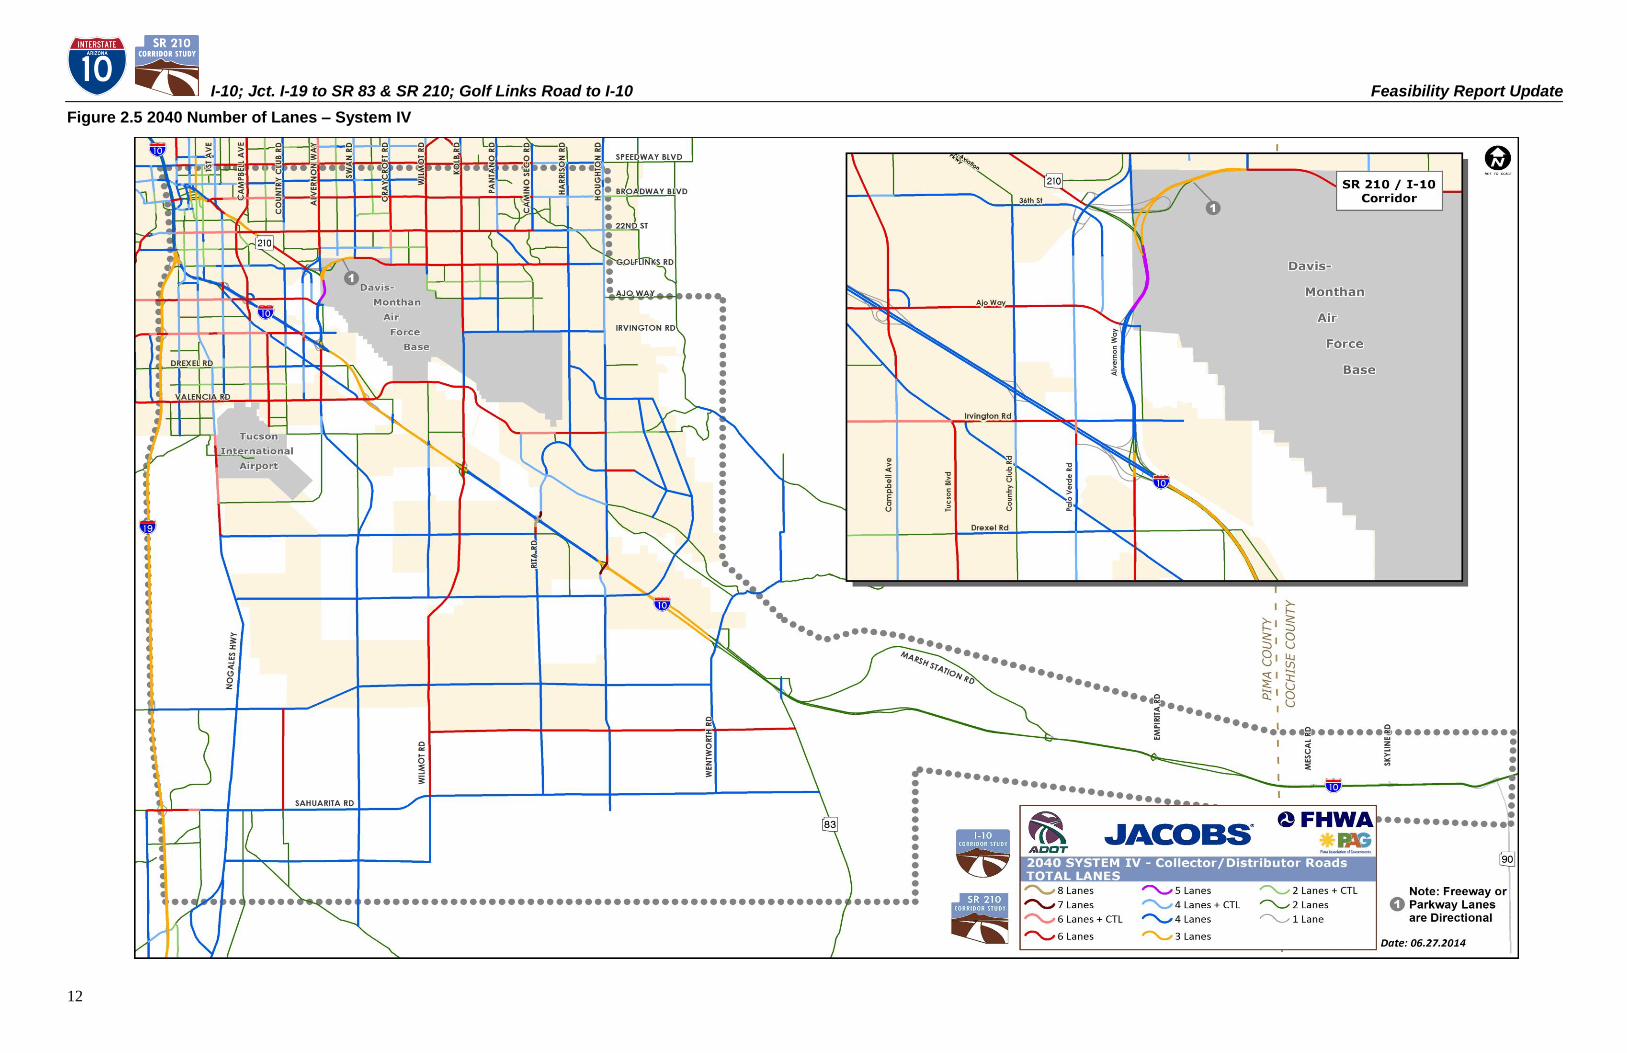
Figure 2.5 2040 Number of Lanes – System IV ................................... 12
Figure 2.6 Screenlines ........................................................................... 13
Figure 2.7 I-10 Existing Conditions 2010 – Mainline Lanes & LOS
Summary ................................................................................................ 18
Figure 2.8 I-10 No-Build Alternative 2040 - Mainline Lanes & LOS
Summary……………………………………………………………….19
Figure 2.9 I-10 System Alternative I - 2040 Build - Mainline Lanes &
LOS Summary…………………………………………………………20
Figure 2.10 I-10 System Alternative II - 2040 Build - Mainline Lanes &
LOS Summary………………………………………………………....21
Figure 2.11 I-10 System Alternative IV - 2040 Build - Mainline Lanes &
LOS Summary…………………………………………………………22
Figure 3.1 System Alternative I ............................................................. 33
Figure 3.2 System Alternative II 33
Figure 3.3 System Alternative III, IIIa and IIIb.....................................33
Figure 3.4 System Alternative IIIc.........................................................34
Figure 3.5 System Alternative IV…………………………………….34
LIST OF TABLES Table 1.1 Previous Projects Within the I-10 Study Area 4
Table 1.2 Existing I-10 Structures 5
Table 1.3 Previous Projects within the SR 210 Study Area 6
Table 1.4 Existing Structures - SR 210 Study Area 6
Table 2.1 2010 and 2040 Socioeconomic Summary 8
Table 2.2 V/C and LOS 9
Table 2.3 Summary of Findings by System Alternatives – I-10 13
Table 2.4 Summary of Findings by System Alternative – SR 210 13
Table 2.5 2040 System Alternatives Screenline Analysis 14
Table 2.6 VMT and VHT System Alternatives I, II and IV 14
Table 2.7 I-10 Ramps LOS Summary Table 23
Table 2.8 SR 210 Ramps LOS Summary Table 25
Table 2.9 I-10 Intersection LOS Summary Table 26
Table 2.10 SR 210 Intersection LOS Summary Table 27
Table 2.11 Summary of Crashes 2005-2009 28
Table 2.12 I-10 TIs 5-Year Crash Summary (2005-2009) 29
Table 2.13 I-10 Mainline 5-Year Crash Summary (2005-2009) 30
Table 2.14 SR 210 Mainline 5-Year Crash Summary (2005-2009) 31
Table 2.15 SR 210 Intersections 5-Year Crash
Summary (2005-2009) 31
Table 4.1 Utility and Railroad Contacts 48
Table 6.1 I-10/SR 210; System Alternative I (I-10 Improvements)
Estimated Cost 52
Table 6.2 I-10/SR 210; System Alternative I (SR 210 Extension)
Estimated Cost 52
Table 6.3 I-10/SR 210; System Alternative II (I-10 Improvements)
Estimated Cost 53
Table 6.4 I-10/SR 210; System Alternative II (SR 210 Extension)
Estimated Cost 53
Table 6.5 I-10/SR 210; System Alternative IV (I-10 Improvements)
Estimated Cost 54
Table 6.6 I-10/SR-210; System Alternative IV (SR 210 Extension)
Estimated Cost 54
APPENDICES APPENDIX A: EXISTING CONDITIONS 55
APPENDIX B: TRAFFIC MODELING 77
APPENDIX C: SYSTEM ALTERNATIVE I
(Typical Sections and Plan Sheets) 85
APPENDIX D: SYSTEM ALTERNATIVE II
(Typical Sections and Plan Sheets) 125
APPENDIX E: SYSTEM ALTERNATIVE IV
(Typical Sections and Plan Sheets) 167
APPENDIX F: ACCESS CONTROL STRATEGIES
AT CROSSROADS 207
APPENDIX G: TRANSIT OPPORTUNITIES (OCTOBER 2011) 215
APPENDIX H: ENVIRONMENTAL OVERVIEW 227
APPENDIX I: MEETING NOTES 291
APPENDIX J: SUMMARY OF COMMENTS 337
I-10; Jct. I-19 to SR 83 & SR 210; Golf Links Road to I-10 Feasibility Report Update
1
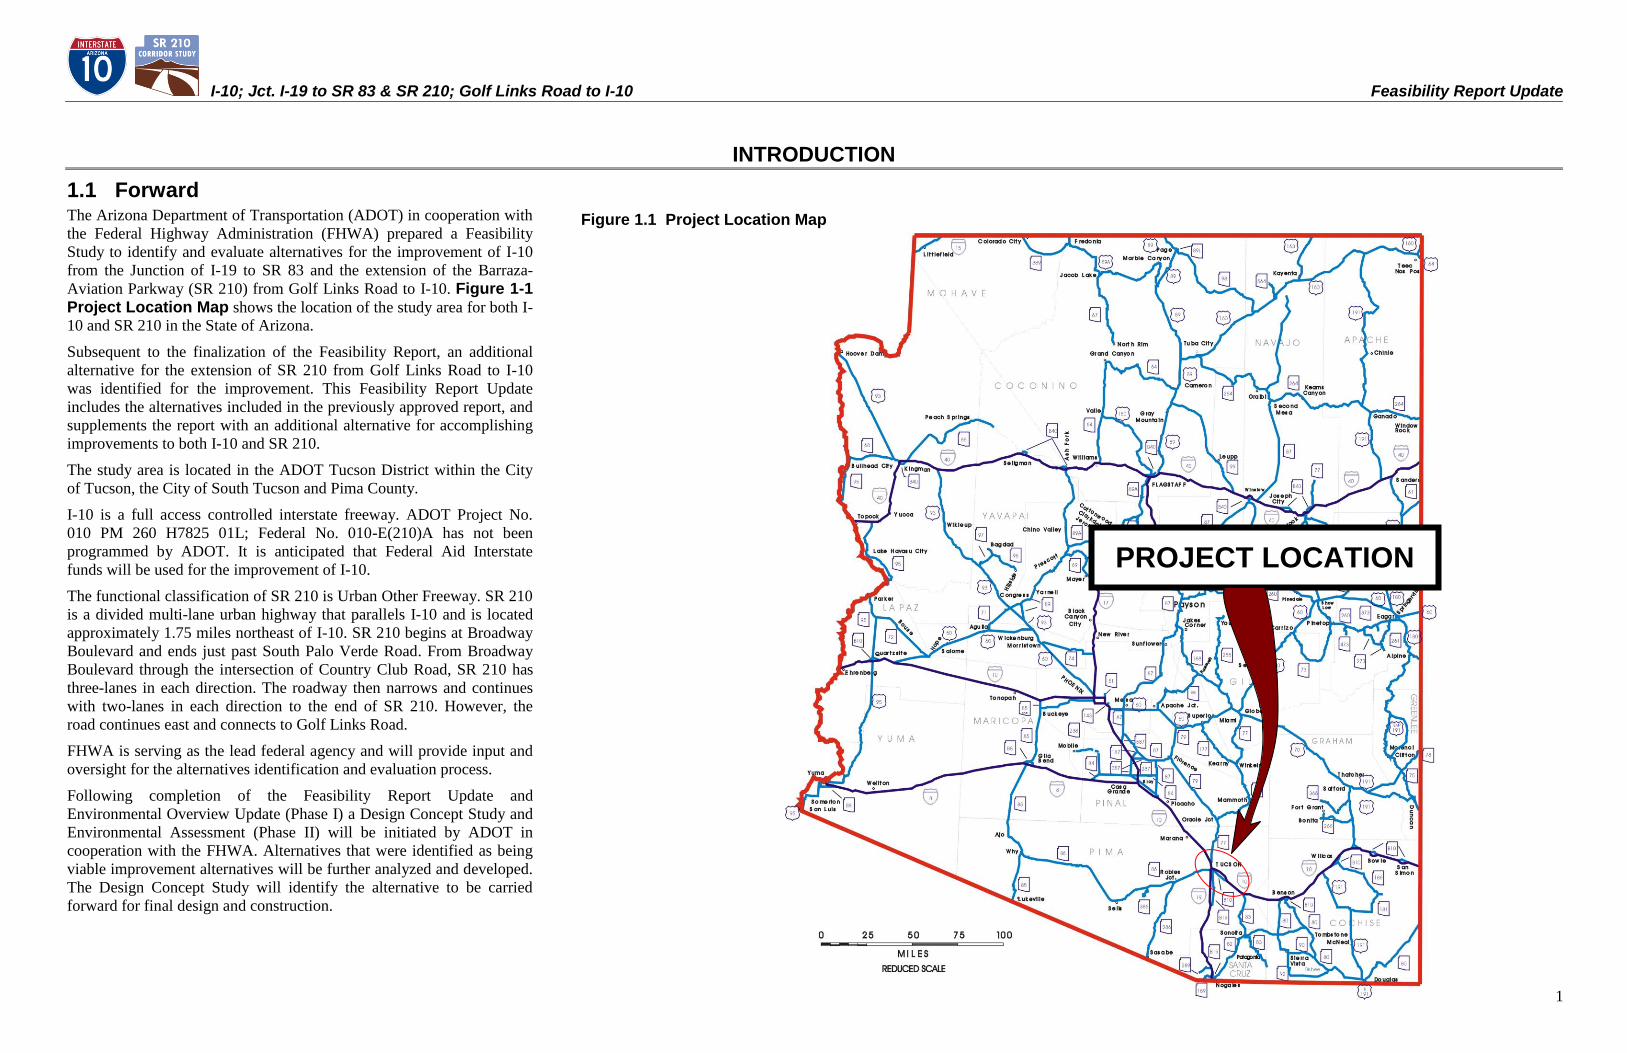
INTRODUCTION1.1 Forward The Arizona Department of Transportation (ADOT) in cooperation with
the Federal Highway Administration (FHWA) prepared a Feasibility
Study to identify and evaluate alternatives for the improvement of I-10
from the Junction of I-19 to SR 83 and the extension of the Barraza-
Aviation Parkway (SR 210) from Golf Links Road to I-10. Figure 1-1 Project Location Map shows the location of the study area for both I-
10 and SR 210 in the State of Arizona.
Subsequent to the finalization of the Feasibility Report, an additional
alternative for the extension of SR 210 from Golf Links Road to I-10
was identified for the improvement. This Feasibility Report Update
includes the alternatives included in the previously approved report, and
supplements the report with an additional alternative for accomplishing
improvements to both I-10 and SR 210.
The study area is located in the ADOT Tucson District within the City
of Tucson, the City of South Tucson and Pima County.
I-10 is a full access controlled interstate freeway. ADOT Project No.
010 PM 260 H7825 01L; Federal No. 010-E(210)A has not been
programmed by ADOT. It is anticipated that Federal Aid Interstate
funds will be used for the improvement of I-10.
The functional classification of SR 210 is Urban Other Freeway. SR 210
is a divided multi-lane urban highway that parallels I-10 and is located
approximately 1.75 miles northeast of I-10. SR 210 begins at Broadway
Boulevard and ends just past South Palo Verde Road. From Broadway
Boulevard through the intersection of Country Club Road, SR 210 has
three-lanes in each direction. The roadway then narrows and continues
with two-lanes in each direction to the end of SR 210. However, the
road continues east and connects to Golf Links Road.
FHWA is serving as the lead federal agency and will provide input and
oversight for the alternatives identification and evaluation process.
Following completion of the Feasibility Report Update and
Environmental Overview Update (Phase I) a Design Concept Study and
Environmental Assessment (Phase II) will be initiated by ADOT in
cooperation with the FHWA. Alternatives that were identified as being
viable improvement alternatives will be further analyzed and developed.
The Design Concept Study will identify the alternative to be carried
forward for final design and construction.
Figure 1.1 Project Location Map
PROJECT LOCATION
I-10; Jct. I-19 to SR 83 & SR 210; Golf Links Road to I-10 Feasibility Report Update
2
During Phase II the Design Concept Study will be extended on I-10
through the SR 90 interchange in Benson, AZ. The Environmental
Assessment will end just beyond the I-10 /SR 83 interchange.
The following were involved in developing the study: FHWA, Pima
Association of Governments (PAG), Pima County, Davis- Monthan Air
Force Base (DMAFB), City of Tucson, City of South Tucson, US
Customs & Border Protection (CBP), Tucson Airport Authority, Sun
Tran, Arizona Game and Fish Department (AGFD), Arizona State Land
Department (ASLD), the Regional Transportation Authority (RTA), and
the Union Pacific Railroad (UPRR).
1.1.1 Project Objectives The project study team, in cooperation with participating agencies,
initiated a study of the feasibility of improving I-10 from the I-19 traffic
interchange (TI) (MP 260.2) easterly through the SR 83 TI (MP 282.0)
and extending SR 210 from its current easterly end at Golf Links Road
to an interchange connection with I-10 at a location to be determined.
This Feasibility Report Update will identify the improvements for each
of the highways. The updated report will identify and evaluate
alternative alignments for extending SR 210 and connecting SR 210 to I-
10 with a System Interchange. The evaluation will include alternative
configurations of I-10 for each of the SR 210 alternative alignments.
The Study will also include I-10 mainline and interchange modifications
from I-19 to SR 83. Improvements to I-10 and the extension of SR 210
to a connection with I-10 will accommodate design year 2040 traffic.
1.1.2 Study Process for Update The purpose of the I-10/SR 210 Feasibility Study is to develop and
evaluate alternatives for improvement of I-10 between I-19 and SR 83
and for the extension of SR 210 to a connection with I-10 to meet future
traffic demands for Design Year 2040. The Feasibility Study presents
various alternatives for accomplishing the necessary improvements and
evaluates each alternative with recommendations for alternatives to be
retained and carried forward for further study.
During development of the Feasibility Report, improvement alternatives
I, II and IIIc were identified and evaluated for the extension of SR 210
to several connection locations with I-10. The alternatives included
incorporation of a system interchange where SR 210 would connect to I-
10. Improvement of the I-10 mainline and existing interchanges from I-
19 to SR 83 was included in the alternative evaluations. Traffic
modeling of the alternatives was done for design year 2040 traffic
projections to identify alternatives that would provide acceptable levels
of service on both I-10 and SR 210.
The additional alternative included in the Feasibility Report Update is
Alternative IV.
The Feasibility Report Update for I-10; Jct. I-19 to SR 83 & SR 210;
Golf Links Road to I-10 was initiated with a Kickoff Meeting that
included representatives from participating agencies. The meeting was
held January 27, 2014 at the ADOT Tucson District Conference Room.
See Meeting Notes, Appendix H.
Progress Meetings for the Feasibility Report Update were held
beginning in June 2014 to inform team members and agencies of
progress and to obtain input relative to ongoing tasks on both I-10 and
SR 210. See Meeting Notes, Appendix H.
1.2 Purpose and Need for the Project 1.2.1 Purpose and Need for the Improvement of I-10
The Interstate Highway System was intended to relieve congestion,
improve safety, and enhance the economy by facilitating the movement
of people and goods throughout the nation. Increasing traffic volumes on
I-10 in the vicinity of Tucson, Arizona have contributed to reduced
operational effectiveness, particularly the segment of I-10 between I-19
and SR 83.
The traffic modeling accomplished for the combined I-10/SR 210 traffic
analysis has demonstrated that north-south traffic demands through the
project area are constrained by limitations on north-south arterial
corridors. The UPRR switching yard located parallel to SR 210, north of
I-10 prohibits any north-south arterials between Kino Parkway and
Alvernon Way. The Davis-Monthan Air Force Base (AFB) prohibits any
north-south arterials between Alvernon Way and Kolb Road. Traffic
along I-10 concentrates at certain TIs where major north-south arterials
exist.
The number, type, and close proximity of access points to I-10 in this
area compound the problem, contributing to an increase in local traffic
using the Interstate Highway for short local trips. Conflicting interaction
between local and regional/interstate traffic has led to a reduction in the
capacity of I-10 to accommodate through–travel. The numerous access
points on I-10 present additional performance issues because they
typically have their own operational limitations associated with location,
proximity, design, and capacity. These limitations further slow travel on
the I-10 mainline and lead to more conflict between local and regional
traffic. The resulting combination of factors contributes to a growing
degradation of the primary purpose and operational characteristics of I-
10 as originally designed, and compromises the purposes of the overall
roadway network in the study area.
Analysis of existing 2010 traffic shows that I-10 in the study area still
operates at level of service (LOS) D or better in the AM and PM peak
hours except for isolated areas where AM or PM peak hour LOS is less
than LOS D, as discussed in Section 2.3, Traffic Operational Analysis,
in this report.
In the future, increasing traffic volumes on this segment of I-10
originating from anticipated growth to the south and east of downtown
Tucson, as well as growing demands on I-10 as an interstate facility,
will lead to capacity and access restrictions on and along the interstate.
Poor operational performance for local, regional, and interstate traffic
will result from operations on this portion of I-10 declining to LOS D
then to LOS F by 2040. The decline from LOS D to LOS F will show
the roadway is failing to function as intended with forced flow and
extensive delays. The combination of demand exceeding capacity and
poor access along I-10 will restrict and compromise the primary
functions of the roadway network in the study area.
The purpose of the proposed improvement to I-10 is to address
deficiencies in the Interstate highway system through the study area and
ultimately develop improvements that will provide satisfactory service
levels on the Interstate highway through the 2040 design year.
1.2.2 Purpose and Need for the Extension of SR 210 to a Connection with I-10
SR 210 in the City of Tucson, Arizona, was built as an urban highway
subsequent to the construction of I-10. SR 210 is approximately 3.4-
miles long and is oriented in a northwest to southeast direction,
extending southeast from West Broadway Boulevard at North 1st
Avenue, with intersections at Kino Parkway, East 22nd
Street, South
Country Club Road, East 34th
Street, and South Palo Verde Road, before
terminating at Alvernon Way / Golf Links Road.
Much of SR 210 was constructed adjacent to the Union Pacific Railroad
(UPRR); they share a number of grade separations from the City‟s street
network. This proximity to the railroad minimizes the number of cross
streets and access points to SR 210, which is advantageous to the use of
SR 210 as an urban parkway. However, the presence of the UPRR
switch yard serves as a barrier to north-south city arterials, which has a
negative effect on traffic that is destined to and from North Tucson.
Much of the north-south traffic that is blocked by the UPRR remains on
I-10 to access major north-south arterials to reach their destinations.
SR 210 is intended to provide motorists with an alternate route into
Tucson‟s downtown business district from points east and south of
downtown.
I-10; Jct. I-19 to SR 83 & SR 210; Golf Links Road to I-10 Feasibility Report Update
3
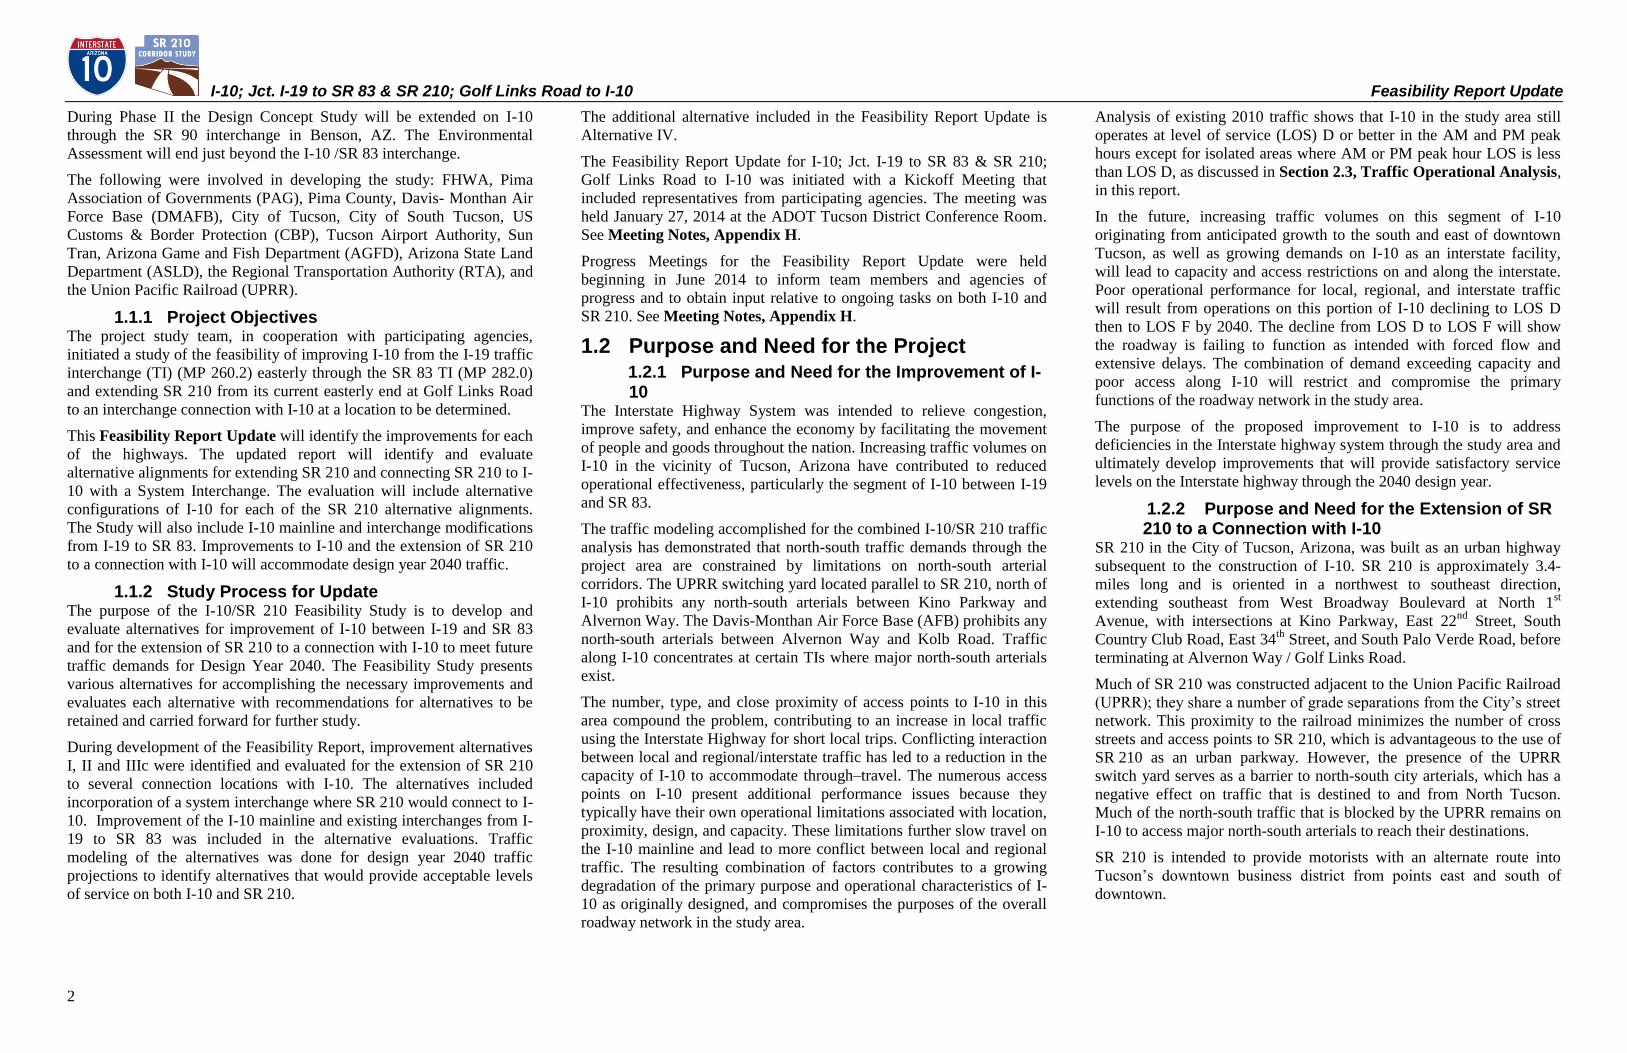
Figure 1.2 Vicinity Map
I-10; Jct. I-19 to SR 83 & SR 210; Golf Links Road to I-10 Feasibility Report Update
4
The use of SR 210 as a business spur is limited by the fact that motorists
on westbound I-10 desiring to access downtown Tucson via SR 210
must currently use city arterials to get from I-10 to SR 210. The
additional trips on the city arterials tend to exceed the capacity of the
local roadway network, which causes motorists to stay on I-10.
Commercial and commuter traffic heading into downtown Tucson also
use I-10 and add to peak hour congestion, causing increased volume and
stress to the operation of the interstate highway. As is, the limited
capacity and limited access for local trips prevents the existing roadway
network in the study area from functioning as primarily intended.
Since I-10 runs parallel to SR 210 approximately 1.75 miles south of SR
210, connecting SR 210 and I-10 would facilitate the intended use of SR
210 as a business spur. It would provide westbound local traffic with an
attractive alternative to using I-10 for accessing downtown Tucson and
would allow the interstate route to better serve through-traffic.
For SR 210 traffic to increase to a level nearer capacity, local traffic
currently using I-10 would require improved access via an extension of
SR 210 to the south and east, likely connecting to I-10 somewhere
between the existing Alvernon Way TI and the Rita Road TI south of
DMAFB. This connection would allow SR 210 to become a viable
alternative to I-10 for local traffic to and from the business, university
and cultural districts in the downtown Tucson area.
The purpose of extending SR 210 to an interchange with I-10 is to
provide traffic originating east and south of downtown Tucson an
alternative route to access the city center. Improved operational
performance for local, regional, and interstate traffic would result from
better utilization of SR 210 and improved operations on I-10.
1.3 Characteristics of the I-10 and SR 210 Corridors 1.3.1 Characteristics of the I-10 Corridor
The study area begins within the limits of the I-10/I-19 System
Interchange at MP 260.2 and extends eastward approximately 22 miles
to I-10 MP 282.0, east of the I-10/SR 83 TI. See Figure 1-2 Vicinity
Map.
Property adjacent to I-10 is primarily industrial from I-19 east through
Alvernon Way. East of Alvernon Way to approximately Rita Road, the
adjacent property is a mixture of residential and commercial properties
with areas that are undeveloped. From Rita Road through the end of the
project at SR 83 the adjacent property is primarily undeveloped.
The Union Pacific Railroad approaches I-10 from the north along the
east side of Alvernon Way. The railroad turns and continues southeast
approximately 250-feet north of I-10 for a short distance. The railroad
and I-10 then separate and continue south-east about three-quarters of a
mile apart.
At the beginning of the project, I-10 turns from a north-south direction
to an east-west direction as the corridor proceeds to the east. Just east of
Park Avenue, I-10 turns to the southeast. From Park Avenue to the end
of the project I-10 is oriented on a northwest to southeast diagonal that
intersects the city street grid at approximately a 45-degree angle.
From the beginning of the project at I-19 to Kino Parkway, I-10 has
three lanes eastbound and three lanes westbound with 10-foot inside and
outside shoulders. From Kino Parkway to the end of the project just east
of SR 83, I-10 has two eastbound lanes and two westbound lanes with
10-foot outside shoulders and 4-foot inside shoulders.
I-10 has a variable width median running through the project area. From
the beginning of the project through 6th
Avenue the median width is 32-
feet, with a concrete barrier located in the center of the median. Through
the horizontal curve east of 6th
Avenue the median narrows to 26-feet.
The 26-foot median continues to Park Avenue, where the median
transitions to 60-feet wide and the concrete barrier ends. The 60-foot
wide median continues to Kino Parkway, where the width of the median
transitions to 84-feet wide. The 84-foot wide median continues to
Valencia Road. The median width narrows to 68-feet wide through the
horizontal curve on I-10 at Valencia Road. The 68-foot wide median
continues through Houghton Road to approximately MP 277.4, where
the eastbound and westbound roadways separate and continue on
independent alignments to approximately MP 281.3, west of the SR 83
TI where the eastbound and westbound roadways come together and
continue with an 88-foot median.
The existing cross-slope of the I-10 roadway in tangent sections as
shown on as-built plans is:
Beginning of Project @ MP 260.2 to MP 267.5: roadway cross-slope
is -0.01ft/ft from median to shoulder.
MP 267.5 to End of Project @ MP 282.0: roadway cross-slope is
-0.015ft/ft from median to shoulder.
TIs are located at all of the major cross streets including from west to
east: 6th
Avenue, Park Avenue, Kino Parkway, Palo Verde Road,
Alvernon Way, Valencia Road, Craycroft Road, Wilmot Road, Kolb
Road, Rita Road, Houghton Road, Wentworth Road / Colossal Cave
Road, and SR 83.
The Design Speed on I-10 through the project limits is 65 mph in
accordance with the ADOT RDG for urban/fringe urban Controlled
Access Highways.
The speed limit on I-10 is 55 mph from I-19 through the Kino Parkway
TI where the speed limit increases to 65 mph through Kolb Road TI.
The speed limit then increases to 75 mph easterly through the end of the
Feasibility Study area.
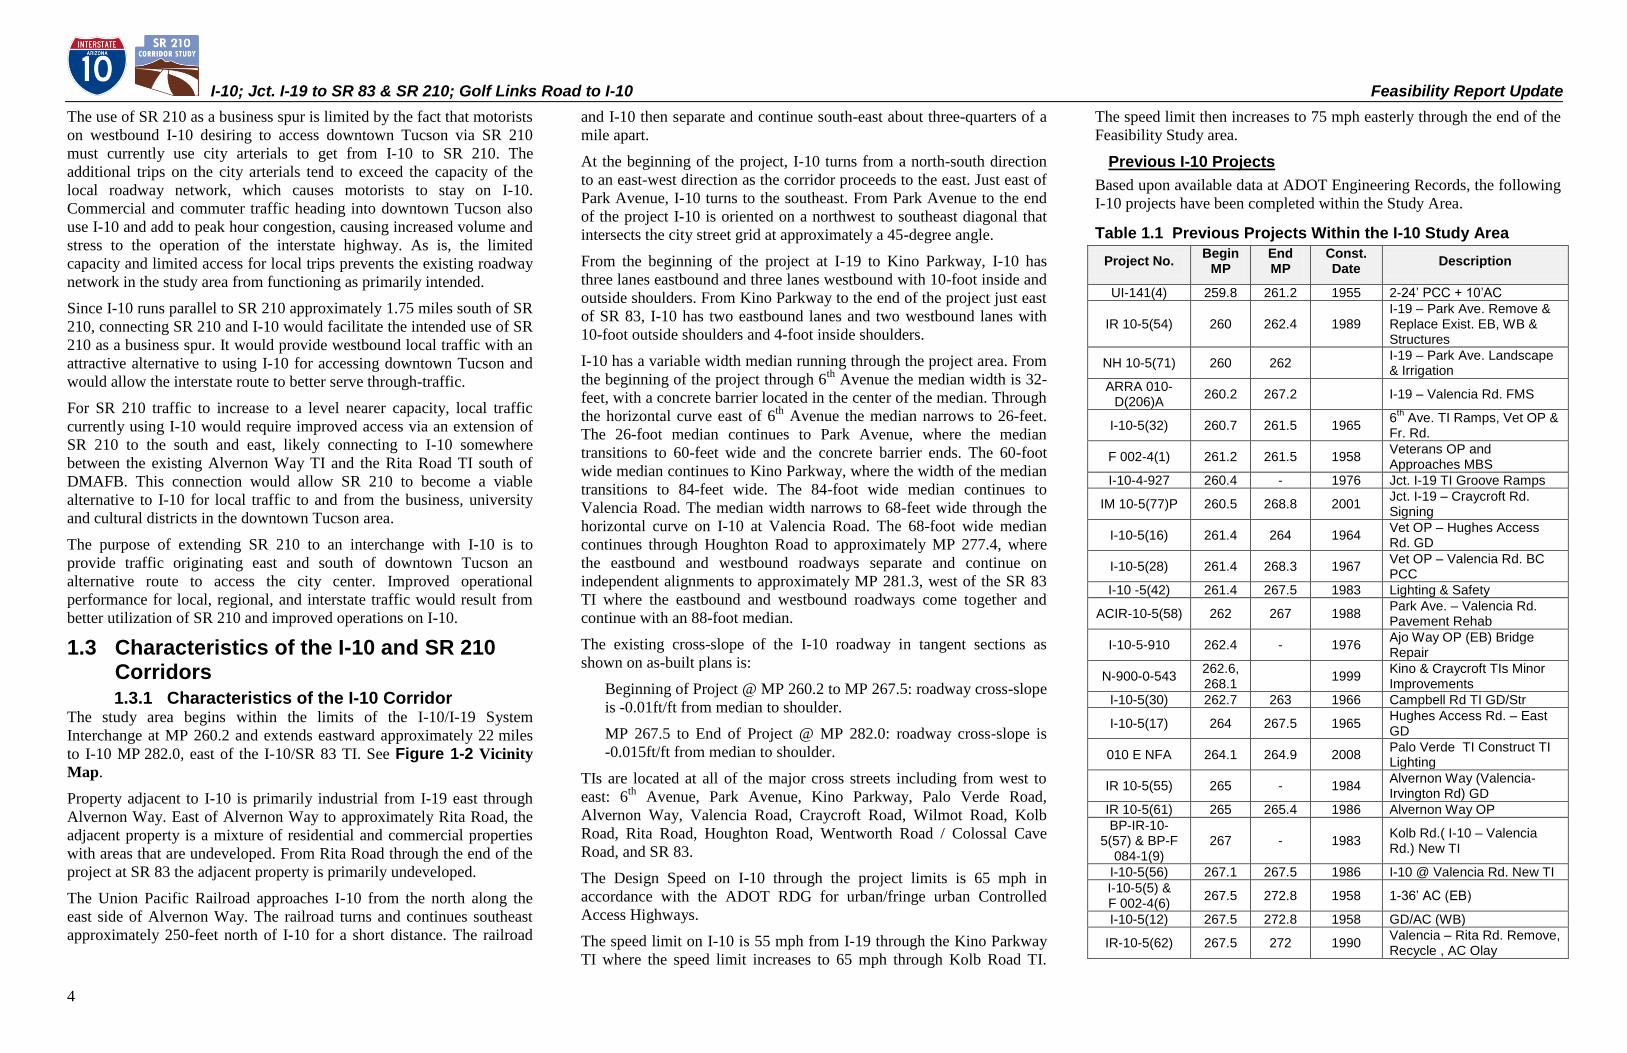
Previous I-10 Projects Based upon available data at ADOT Engineering Records, the following
I-10 projects have been completed within the Study Area.
Table 1.1 Previous Projects Within the I-10 Study Area Project No. Begin
MP End MP
Const. Date Description
UI-141(4) 259.8 261.2 1955 2-24’ PCC + 10’AC
IR 10-5(54) 260 262.4 1989 I-19 – Park Ave. Remove & Replace Exist. EB, WB & Structures
NH 10-5(71) 260 262 I-19 – Park Ave. Landscape & Irrigation
ARRA 010-D(206)A
260.2 267.2 I-19 – Valencia Rd. FMS
I-10-5(32) 260.7 261.5 1965 6
th Ave. TI Ramps, Vet OP &
Fr. Rd.
F 002-4(1) 261.2 261.5 1958 Veterans OP and Approaches MBS
I-10-4-927 260.4 - 1976 Jct. I-19 TI Groove Ramps
IM 10-5(77)P 260.5 268.8 2001 Jct. I-19 – Craycroft Rd. Signing
I-10-5(16) 261.4 264 1964 Vet OP – Hughes Access Rd. GD
I-10-5(28) 261.4 268.3 1967 Vet OP – Valencia Rd. BC PCC
I-10 -5(42) 261.4 267.5 1983 Lighting & Safety
ACIR-10-5(58) 262 267 1988 Park Ave. – Valencia Rd. Pavement Rehab
I-10-5-910 262.4 - 1976 Ajo Way OP (EB) Bridge Repair
N-900-0-543 262.6, 268.1
1999 Kino & Craycroft TIs Minor Improvements
I-10-5(30) 262.7 263 1966 Campbell Rd TI GD/Str
I-10-5(17) 264 267.5 1965 Hughes Access Rd. – East GD
010 E NFA 264.1 264.9 2008 Palo Verde TI Construct TI Lighting
IR 10-5(55) 265 - 1984 Alvernon Way (Valencia-Irvington Rd) GD
IR 10-5(61) 265 265.4 1986 Alvernon Way OP
BP-IR-10-5(57) & BP-F
084-1(9) 267 - 1983
Kolb Rd.( I-10 – Valencia Rd.) New TI
I-10-5(56) 267.1 267.5 1986 I-10 @ Valencia Rd. New TI
I-10-5(5) & F 002-4(6)
267.5 272.8 1958 1-36’ AC (EB)
I-10-5(12) 267.5 272.8 1958 GD/AC (WB)
IR-10-5(62) 267.5 272 1990 Valencia – Rita Rd. Remove, Recycle , AC Olay
I-10; Jct. I-19 to SR 83 & SR 210; Golf Links Road to I-10 Feasibility Report Update
5
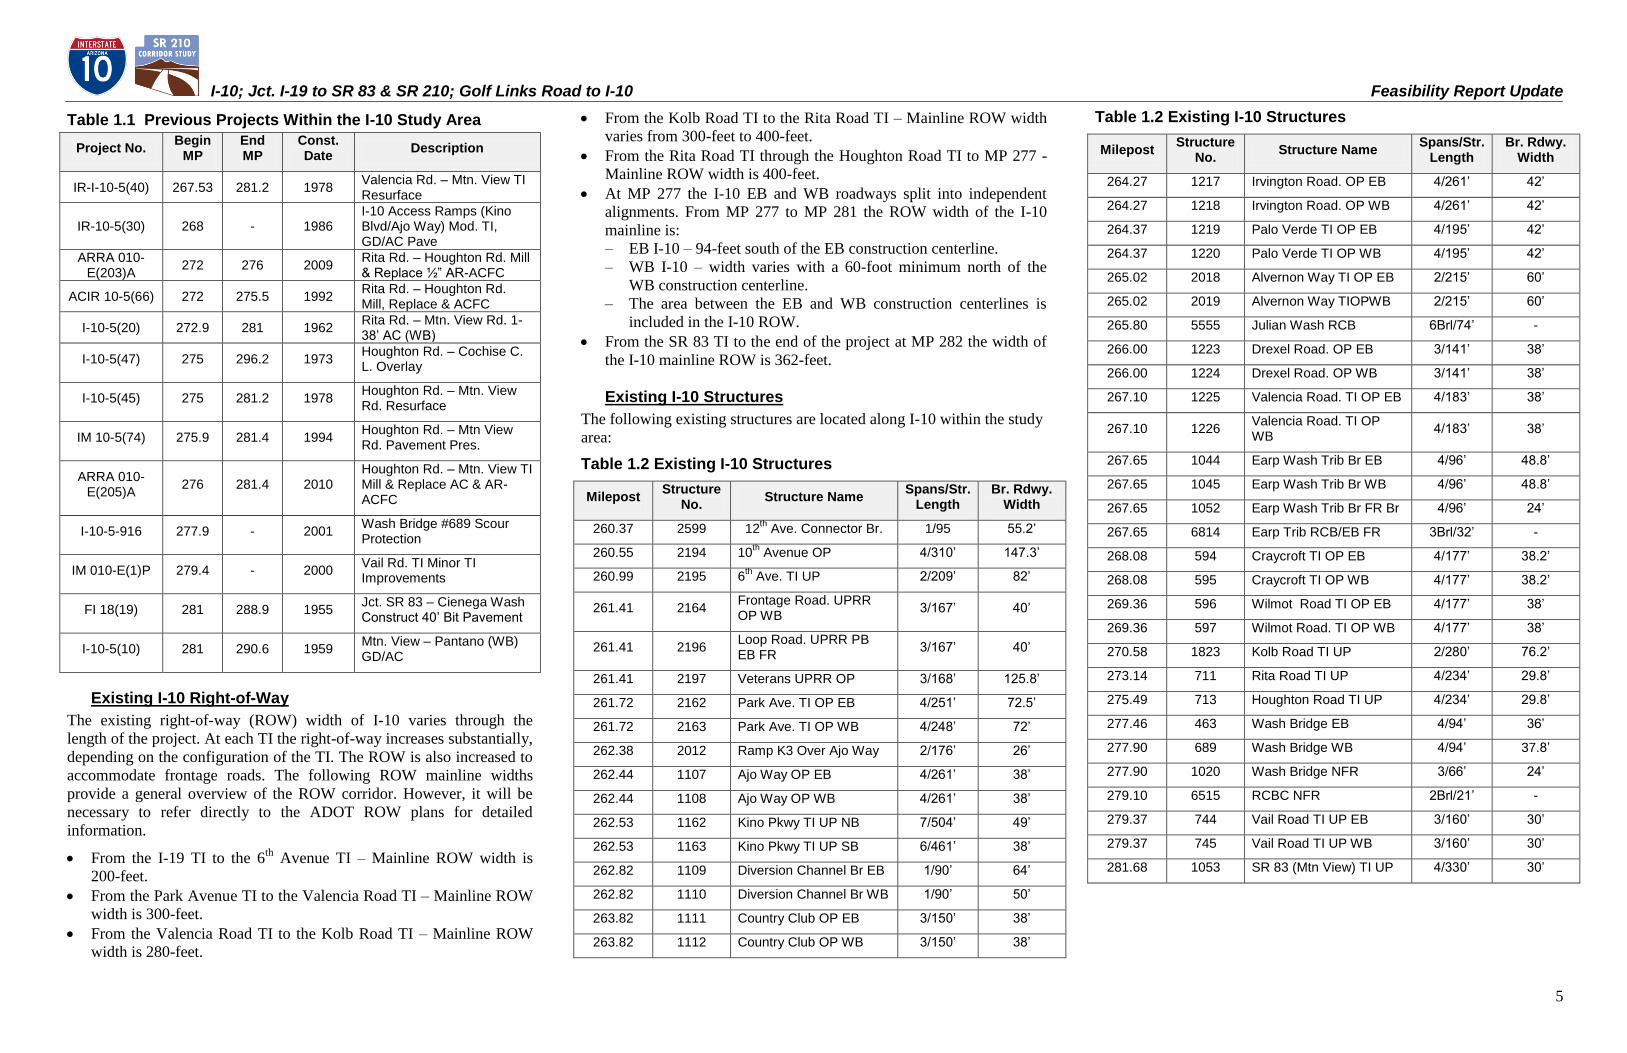
Table 1.1 Previous Projects Within the I-10 Study Area Project No. Begin
MP End MP
Const. Date Description
IR-I-10-5(40) 267.53 281.2 1978 Valencia Rd. – Mtn. View TI Resurface
IR-10-5(30) 268 - 1986 I-10 Access Ramps (Kino Blvd/Ajo Way) Mod. TI, GD/AC Pave
ARRA 010-E(203)A
272 276 2009 Rita Rd. – Houghton Rd. Mill & Replace ½” AR-ACFC
ACIR 10-5(66) 272 275.5 1992 Rita Rd. – Houghton Rd. Mill, Replace & ACFC
I-10-5(20) 272.9 281 1962 Rita Rd. – Mtn. View Rd. 1-38’ AC (WB)
I-10-5(47) 275 296.2 1973 Houghton Rd. – Cochise C. L. Overlay
I-10-5(45) 275 281.2 1978 Houghton Rd. – Mtn. View Rd. Resurface
IM 10-5(74) 275.9 281.4 1994 Houghton Rd. – Mtn View Rd. Pavement Pres.
ARRA 010-E(205)A
276 281.4 2010 Houghton Rd. – Mtn. View TI Mill & Replace AC & AR-ACFC
I-10-5-916 277.9 - 2001 Wash Bridge #689 Scour Protection
IM 010-E(1)P 279.4 - 2000 Vail Rd. TI Minor TI Improvements
FI 18(19) 281 288.9 1955 Jct. SR 83 – Cienega Wash Construct 40’ Bit Pavement
I-10-5(10) 281 290.6 1959 Mtn. View – Pantano (WB) GD/AC
Existing I-10 Right-of-Way The existing right-of-way (ROW) width of I-10 varies through the
length of the project. At each TI the right-of-way increases substantially,
depending on the configuration of the TI. The ROW is also increased to
accommodate frontage roads. The following ROW mainline widths
provide a general overview of the ROW corridor. However, it will be
necessary to refer directly to the ADOT ROW plans for detailed
information.
From the I-19 TI to the 6th
Avenue TI – Mainline ROW width is
200-feet.
From the Park Avenue TI to the Valencia Road TI – Mainline ROW
width is 300-feet.
From the Valencia Road TI to the Kolb Road TI – Mainline ROW
width is 280-feet.
From the Kolb Road TI to the Rita Road TI – Mainline ROW width
varies from 300-feet to 400-feet.
From the Rita Road TI through the Houghton Road TI to MP 277 -
Mainline ROW width is 400-feet.
At MP 277 the I-10 EB and WB roadways split into independent
alignments. From MP 277 to MP 281 the ROW width of the I-10
mainline is:
– EB I-10 – 94-feet south of the EB construction centerline.
– WB I-10 – width varies with a 60-foot minimum north of the
WB construction centerline.
– The area between the EB and WB construction centerlines is
included in the I-10 ROW.
From the SR 83 TI to the end of the project at MP 282 the width of
the I-10 mainline ROW is 362-feet.
Existing I-10 Structures The following existing structures are located along I-10 within the study
area:
Table 1.2 Existing I-10 Structures
Milepost Structure No. Structure Name Spans/Str.
Length Br. Rdwy.
Width
260.37 2599 12th Ave. Connector Br. 1/95 55.2’
260.55 2194 10th Avenue OP 4/310’ 147.3’
260.99 2195 6th Ave. TI UP 2/209’ 82’
261.41 2164 Frontage Road. UPRR OP WB
3/167’ 40’
261.41 2196 Loop Road. UPRR PB EB FR
3/167’ 40’
261.41 2197 Veterans UPRR OP 3/168’ 125.8’
261.72 2162 Park Ave. TI OP EB 4/251’ 72.5’
261.72 2163 Park Ave. TI OP WB 4/248’ 72’
262.38 2012 Ramp K3 Over Ajo Way 2/176’ 26’
262.44 1107 Ajo Way OP EB 4/261’ 38’
262.44 1108 Ajo Way OP WB 4/261’ 38’
262.53 1162 Kino Pkwy TI UP NB 7/504’ 49’
262.53 1163 Kino Pkwy TI UP SB 6/461’ 38’
262.82 1109 Diversion Channel Br EB 1/90’ 64’
262.82 1110 Diversion Channel Br WB 1/90’ 50’
263.82 1111 Country Club OP EB 3/150’ 38’
263.82 1112 Country Club OP WB 3/150’ 38’
Table 1.2 Existing I-10 Structures
Milepost Structure No. Structure Name Spans/Str.
Length Br. Rdwy.
Width
264.27 1217 Irvington Road. OP EB 4/261’ 42’
264.27 1218 Irvington Road. OP WB 4/261’ 42’
264.37 1219 Palo Verde TI OP EB 4/195’ 42’
264.37 1220 Palo Verde TI OP WB 4/195’ 42’
265.02 2018 Alvernon Way TI OP EB 2/215’ 60’
265.02 2019 Alvernon Way TIOPWB 2/215’ 60’
265.80 5555 Julian Wash RCB 6Brl/74’ -
266.00 1223 Drexel Road. OP EB 3/141’ 38’
266.00 1224 Drexel Road. OP WB 3/141’ 38’
267.10 1225 Valencia Road. TI OP EB 4/183’ 38’
267.10 1226 Valencia Road. TI OP WB
4/183’ 38’
267.65 1044 Earp Wash Trib Br EB 4/96’ 48.8’
267.65 1045 Earp Wash Trib Br WB 4/96’ 48.8’
267.65 1052 Earp Wash Trib Br FR Br 4/96’ 24’
267.65 6814 Earp Trib RCB/EB FR 3Brl/32’ -
268.08 594 Craycroft TI OP EB 4/177’ 38.2’
268.08 595 Craycroft TI OP WB 4/177’ 38.2’
269.36 596 Wilmot Road TI OP EB 4/177’ 38’
269.36 597 Wilmot Road. TI OP WB 4/177’ 38’
270.58 1823 Kolb Road TI UP 2/280’ 76.2’
273.14 711 Rita Road TI UP 4/234’ 29.8’
275.49 713 Houghton Road TI UP 4/234’ 29.8’
277.46 463 Wash Bridge EB 4/94’ 36’
277.90 689 Wash Bridge WB 4/94’ 37.8’
277.90 1020 Wash Bridge NFR 3/66’ 24’
279.10 6515 RCBC NFR 2Brl/21’ -
279.37 744 Vail Road TI UP EB 3/160’ 30’
279.37 745 Vail Road TI UP WB 3/160’ 30’
281.68 1053 SR 83 (Mtn View) TI UP 4/330’ 30’
I-10; Jct. I-19 to SR 83 & SR 210; Golf Links Road to I-10 Feasibility Report Update
6
1.3.2 Characteristics of the SR 210 Corridor The study area begins at the east end of SR 210 near Golf Links Road
and Alvernon Way. The north-west end of the Davis-Monthan AFB is
located just east of the end of SR 210. Alignments to extend SR 210
south-east to connect with I-10 will be identified east from Alvernon
Way. The northern limits of the study area will be the southern boundary
of Davis-Monthan AFB. Alignments to extend SR 210 will have to turn
to the south to avoid Davis-Monthan AFB.
Property through the study area for extending SR 210 is primarily
industrial from Alvernon Way east to Craycroft Road. From Craycroft
Road to the east the property is primarily residential with some
undeveloped land. The Thomas Jay Regional Park is located to the east
of Craycroft Road and south of the UPRR. The Pima Air Museum is
located just east of Valencia Road and north of the UPRR.
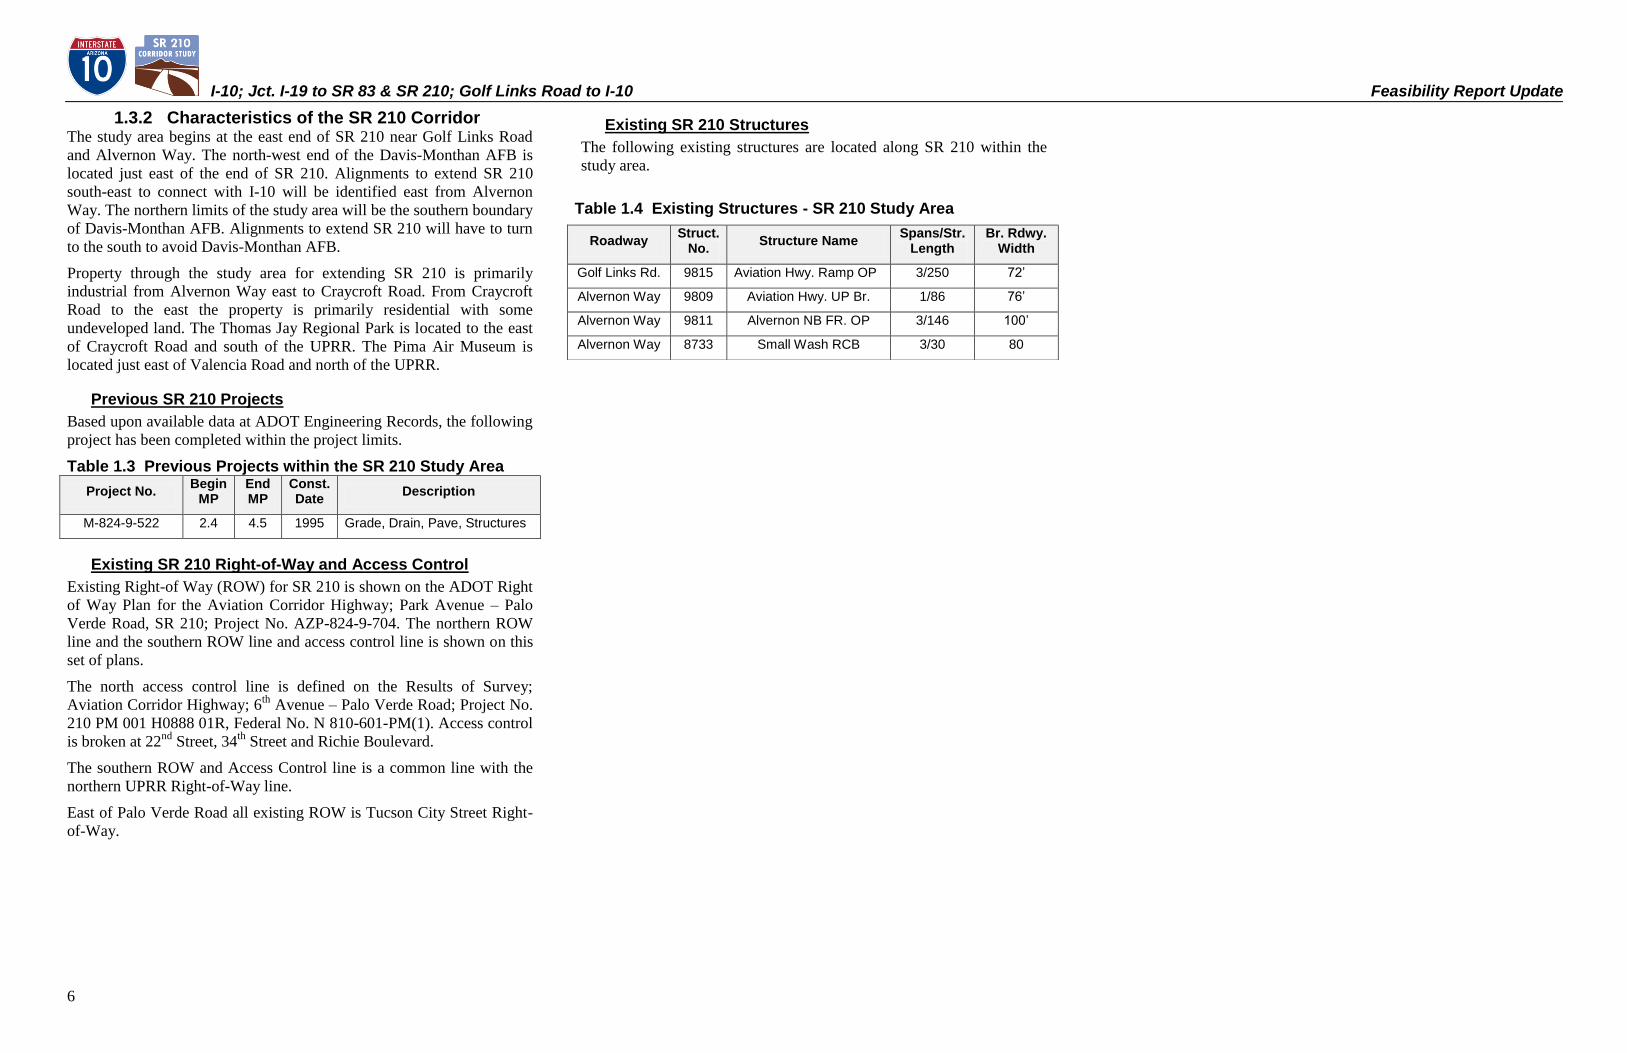
Previous SR 210 Projects Based upon available data at ADOT Engineering Records, the following
project has been completed within the project limits.
Table 1.3 Previous Projects within the SR 210 Study Area Project No. Begin
MP End MP
Const. Date Description
M-824-9-522 2.4 4.5 1995 Grade, Drain, Pave, Structures
Existing SR 210 Right-of-Way and Access Control Existing Right-of Way (ROW) for SR 210 is shown on the ADOT Right
of Way Plan for the Aviation Corridor Highway; Park Avenue – Palo
Verde Road, SR 210; Project No. AZP-824-9-704. The northern ROW
line and the southern ROW line and access control line is shown on this
set of plans.
The north access control line is defined on the Results of Survey;
Aviation Corridor Highway; 6th
Avenue – Palo Verde Road; Project No.
210 PM 001 H0888 01R, Federal No. N 810-601-PM(1). Access control
is broken at 22nd
Street, 34th
Street and Richie Boulevard.
The southern ROW and Access Control line is a common line with the
northern UPRR Right-of-Way line.
East of Palo Verde Road all existing ROW is Tucson City Street Right-
of-Way.
Existing SR 210 Structures The following existing structures are located along SR 210 within the
study area.
Table 1.4 Existing Structures - SR 210 Study Area
Roadway Struct.
No. Structure Name Spans/Str.
Length Br. Rdwy.
Width
Golf Links Rd. 9815 Aviation Hwy. Ramp OP 3/250 72’
Alvernon Way 9809 Aviation Hwy. UP Br. 1/86 76’
Alvernon Way 9811 Alvernon NB FR. OP 3/146 100’
Alvernon Way 8733 Small Wash RCB 3/30 80
I-10; Jct. I-19 to SR 83 & SR 210; Golf Links Road to I-10 Feasibility Report Update
7
2 TRAFFIC AND CRASH DATA 2.1 Forward I-10 is one of the major travel routes in the State of Arizona. It serves
national, regional and local trips connecting large metropolitan areas to
rural communities. The I-10 corridor from I-19 to SR 90 provides
connectivity between the rural communities of Sierra Vista and Benson
in Cochise County to the Tucson urban core in Pima County.
PAG is the agency responsible for the Tucson metropolitan area regional
transportation planning. SouthEastern Arizona Governments
Organization (SEAGO) is the counterpart for Cochise County.
PAG has identified the SR 210 extension from Golf Links Road to I-10
as a vital connection required to meet future mobility needs in the
Tucson metro area.
PAG is in the process of finalizing the new 2045 Regional
Transportation Plan (RTP). For this effort PAG reviewed and revised the
forecasted regional growth. Due to the economic climate, PAG
projected a more conservative growth with a significant reduction of
population and employment in the PAG planning area. This has
significantly impacted the study area travel demand and prompted a
review of the recommendations made in the 2011 Initial Traffic Report.
An Initial Traffic Report Addendum; I-10: Jct. Interstate 19 to SR 90/SR
210: Golf Links Road to I-10, has been prepared that identifies and
evaluates the design year 2040 transportation needs for I-10 from I-19
east to SR 90 in Cochise County, and for the extension of SR 210 to
connect with I-10. This Feasibility Report Update utilizes the Initial
Traffic Report Addendum for the analysis of improvements to I-10 from
I-19 to SR 83, and the extension of SR 210 to a connection with I-10.
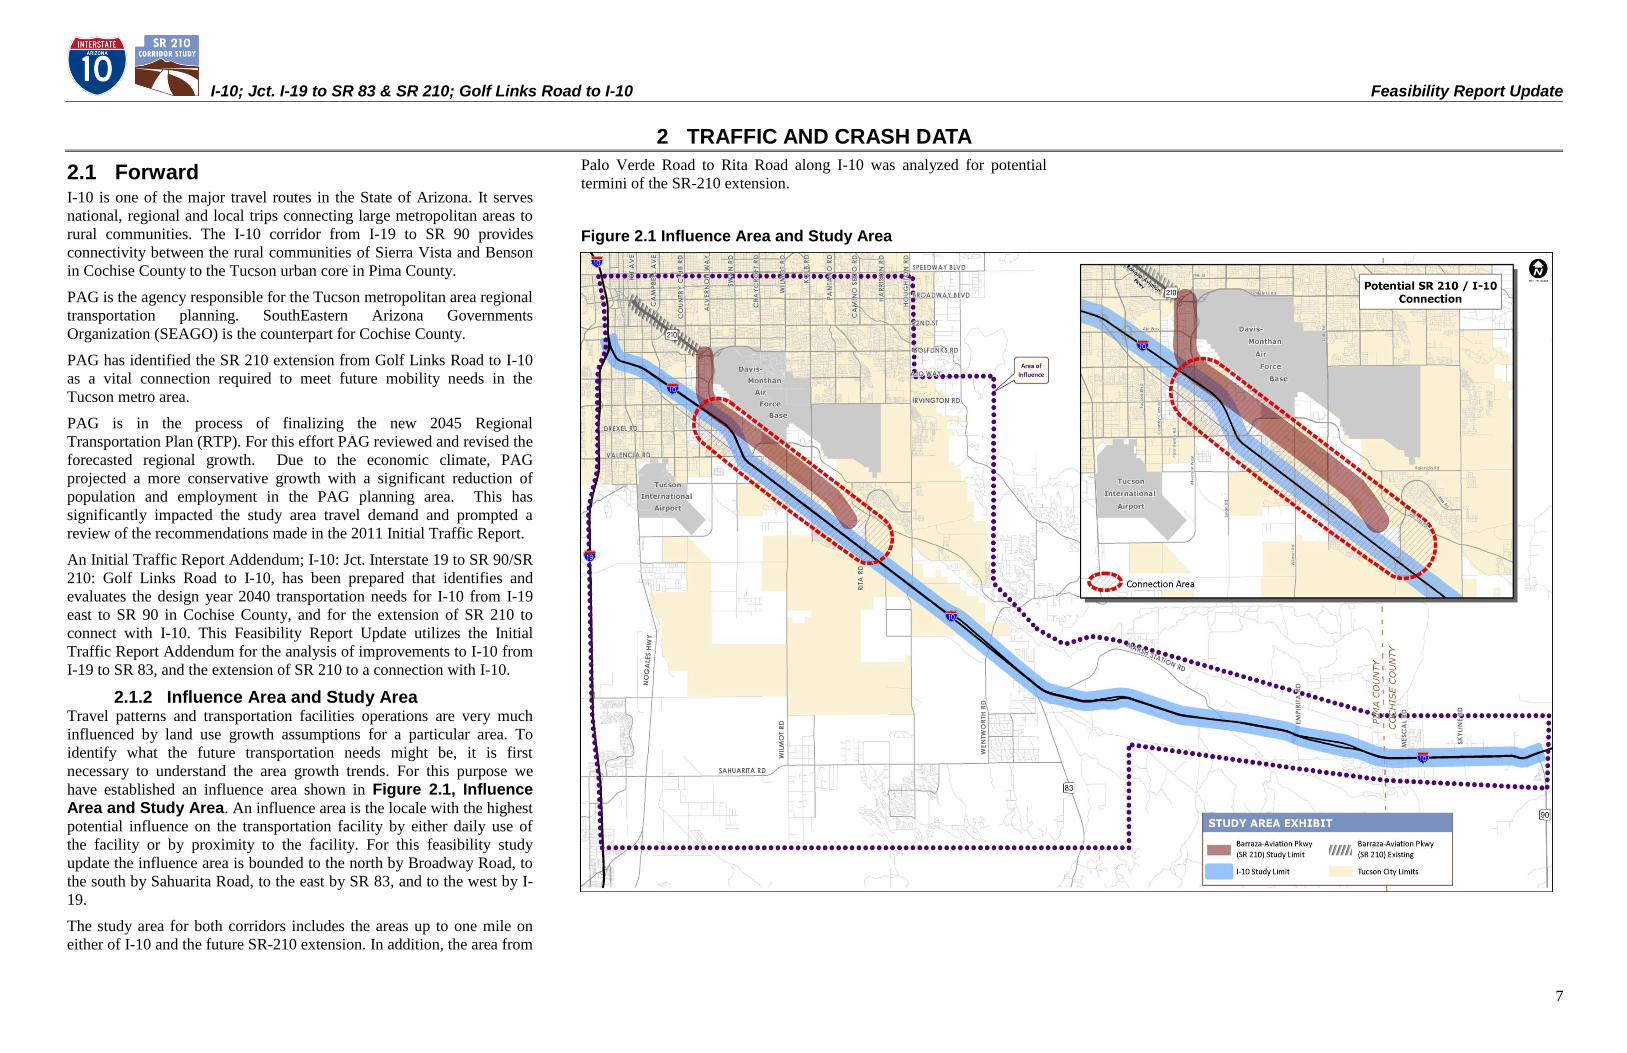
2.1.2 Influence Area and Study Area Travel patterns and transportation facilities operations are very much
influenced by land use growth assumptions for a particular area. To
identify what the future transportation needs might be, it is first
necessary to understand the area growth trends. For this purpose we
have established an influence area shown in Figure 2.1, Influence Area and Study Area. An influence area is the locale with the highest
potential influence on the transportation facility by either daily use of
the facility or by proximity to the facility. For this feasibility study
update the influence area is bounded to the north by Broadway Road, to
the south by Sahuarita Road, to the east by SR 83, and to the west by I-
19.
The study area for both corridors includes the areas up to one mile on
either of I-10 and the future SR-210 extension. In addition, the area from
Palo Verde Road to Rita Road along I-10 was analyzed for potential
termini of the SR-210 extension.
Figure 2.1 Influence Area and Study Area
I-10; Jct. I-19 to SR 83 & SR 210; Golf Links Road to I-10 Feasibility Report Update
8
2.2 Traffic Forecast 2.2.1 Technical Process and Assumptions
A regional travel demand model is a planning tool used to assess how
transportation systems will perform based on the future land use and
forecasted growth in the study area. The current transportation system is
often used as the initial roadway system and new improvements are
identified based on the future demand. Using the travel demand model
as a planning tool, future transportation needs are assessed and potential
roadway improvements are modeled and evaluated. The macro scale
nature of this tool only provides a planning evaluation for the operation
of roadway between intersections or interchanges. It provides an order
of magnitude of the travel demand to help us identify the location, type
and capacity of the improvements.
The 2014 PAG Travel Demand Model and the Northwest Cochise
County Transportation Plan which forecasted travel demand has been
utilized to identify future transportation deficiencies, reduced mobility
and bottleneck locations in the study area.
2.2.2 PAG Travel Demand Model The (2014) PAG Travel Demand Model, for the design year 2040, was
obtained for the study at the end of February 2014. The model covers
approximately 4,300 square miles in Pima County and includes the more
populated urban areas of Tucson, Marana, Oro Valley and Green Valley.
However for this study, the modeling efforts were focused in the area of
influence. In 2011 PAG conducted an external travel survey to better
understand the patterns of the traveling public in, out and through the
PAG planning area. The survey results were used to calibrate the
external travel component of the model. The new 2010 Census
information and the American Community Survey data provided more
accurate information about population distribution and current travel
characteristics in the PAG region. These items together with new growth
assumptions directly affect future travel on I-10 and SR 210.
2.2.3 Socioeconomic Data Socioeconomic data in the PAG model consists of population, housing
units, and employment and is compiled at the Traffic Analysis Zone
(TAZ) level. Traffic Analysis Zones (TAZs) are geographic zonal units
used to tabulate land use and employment data. Boundaries of the TAZs
are defined based on similar land uses, physical barriers, and major
streets in the transportation system. PAG revised the TAZ structure used
in the 2011 Initial Traffic Report. Some large TAZs in the influence area
were split to provide a better and more accurate access to the future
roadways in the network. The New Traffic Analysis Zone (TAZ) Structure exhibit in Appendix B, Traffic Modeling presents the 2040
PAG model TAZs within the area of influence.
The new 2045 PAG model socioeconomic data and TAZs were not
revised for this study. For this study we assumed that the 2045
population will be in place by 2040 as a conservative assessment. The
socioeconomic data provided for this study in February 2014 was not
final. The overall population and employment forecast will not change,
but its allocation may change slightly. Future model traffic volumes are
a result of the PAG 2040 population, housing units, and employment
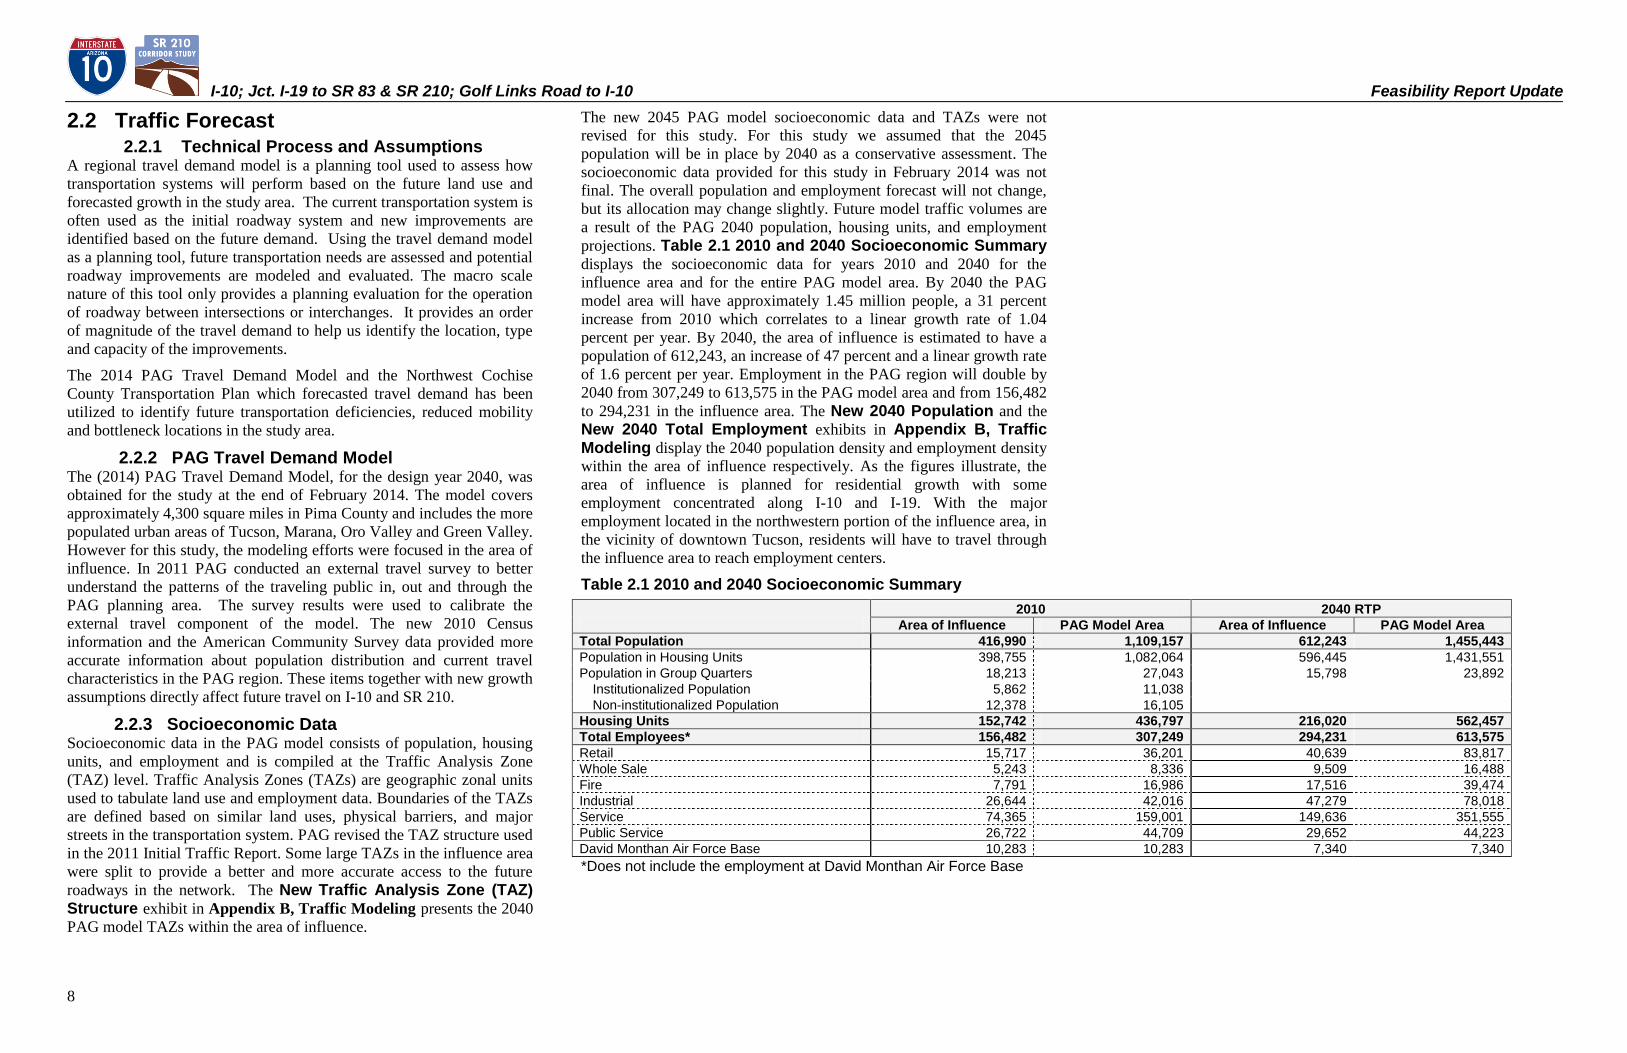
projections. Table 2.1 2010 and 2040 Socioeconomic Summary displays the socioeconomic data for years 2010 and 2040 for the
influence area and for the entire PAG model area. By 2040 the PAG
model area will have approximately 1.45 million people, a 31 percent
increase from 2010 which correlates to a linear growth rate of 1.04
percent per year. By 2040, the area of influence is estimated to have a
population of 612,243, an increase of 47 percent and a linear growth rate
of 1.6 percent per year. Employment in the PAG region will double by
2040 from 307,249 to 613,575 in the PAG model area and from 156,482
to 294,231 in the influence area. The New 2040 Population and the
New 2040 Total Employment exhibits in Appendix B, Traffic Modeling display the 2040 population density and employment density
within the area of influence respectively. As the figures illustrate, the
area of influence is planned for residential growth with some
employment concentrated along I-10 and I-19. With the major
employment located in the northwestern portion of the influence area, in
the vicinity of downtown Tucson, residents will have to travel through
the influence area to reach employment centers.
Table 2.1 2010 and 2040 Socioeconomic Summary
*Does not include the employment at David Monthan Air Force Base
2010 2040 RTP
Area of Influence PAG Model Area Area of Influence PAG Model Area Total Population 416,990 1,109,157 612,243 1,455,443 Population in Housing Units 398,755 1,082,064 596,445 1,431,551
Population in Group Quarters 18,213 27,043 15,798 23,892
Institutionalized Population 5,862 11,038
Non-institutionalized Population 12,378 16,105
Housing Units 152,742 436,797 216,020 562,457 Total Employees* 156,482 307,249 294,231 613,575 Retail 15,717 36,201 40,639 83,817
Whole Sale 5,243 8,336 9,509 16,488
Fire 7,791 16,986 17,516 39,474
Industrial 26,644 42,016 47,279 78,018
Service 74,365 159,001 149,636 351,555
Public Service 26,722 44,709 29,652 44,223
David Monthan Air Force Base 10,283 10,283 7,340 7,340
I-10; Jct. I-19 to SR 83 & SR 210; Golf Links Road to I-10 Feasibility Report Update
9
2.2.4 Roadway Network System I and II roadway networks, developed for the 2011 Initial Traffic
Report were used as the starting point for validating the recommended
alternatives. Due to various environmental and design issues, System
IIIc was eliminated and was replaced by System IV. System IV
introduces a collector distributor road on I-10 from the I-10/SR 210
interchange to Kolb Road to provide congestion relief to I-10 in that
section of the proposed improvement.
2.2.5 Sensitivity Analysis To verify if the improvements recommended in the 2011 Initial Traffic
Report were still applicable, future forecasted traffic volumes were
generated using the new 2040 socioeconomic data and System I and II
roadway network alternatives. This step was also necessary in order to
identify the magnitude of the change in travel demand between the old
model assumptions and the new model assumptions. Based on the new
traffic forecast, the recommended improvements for each system were
reviewed.
Due to the decrease in population and employment, especially in the
study area, the decrease in future travel demand was significant. This
resulted in the reduction of one lane in each direction along I-10 from
Alvernon Way to SR 90 from the configuration recommended in the
2011 Initial Traffic Report.
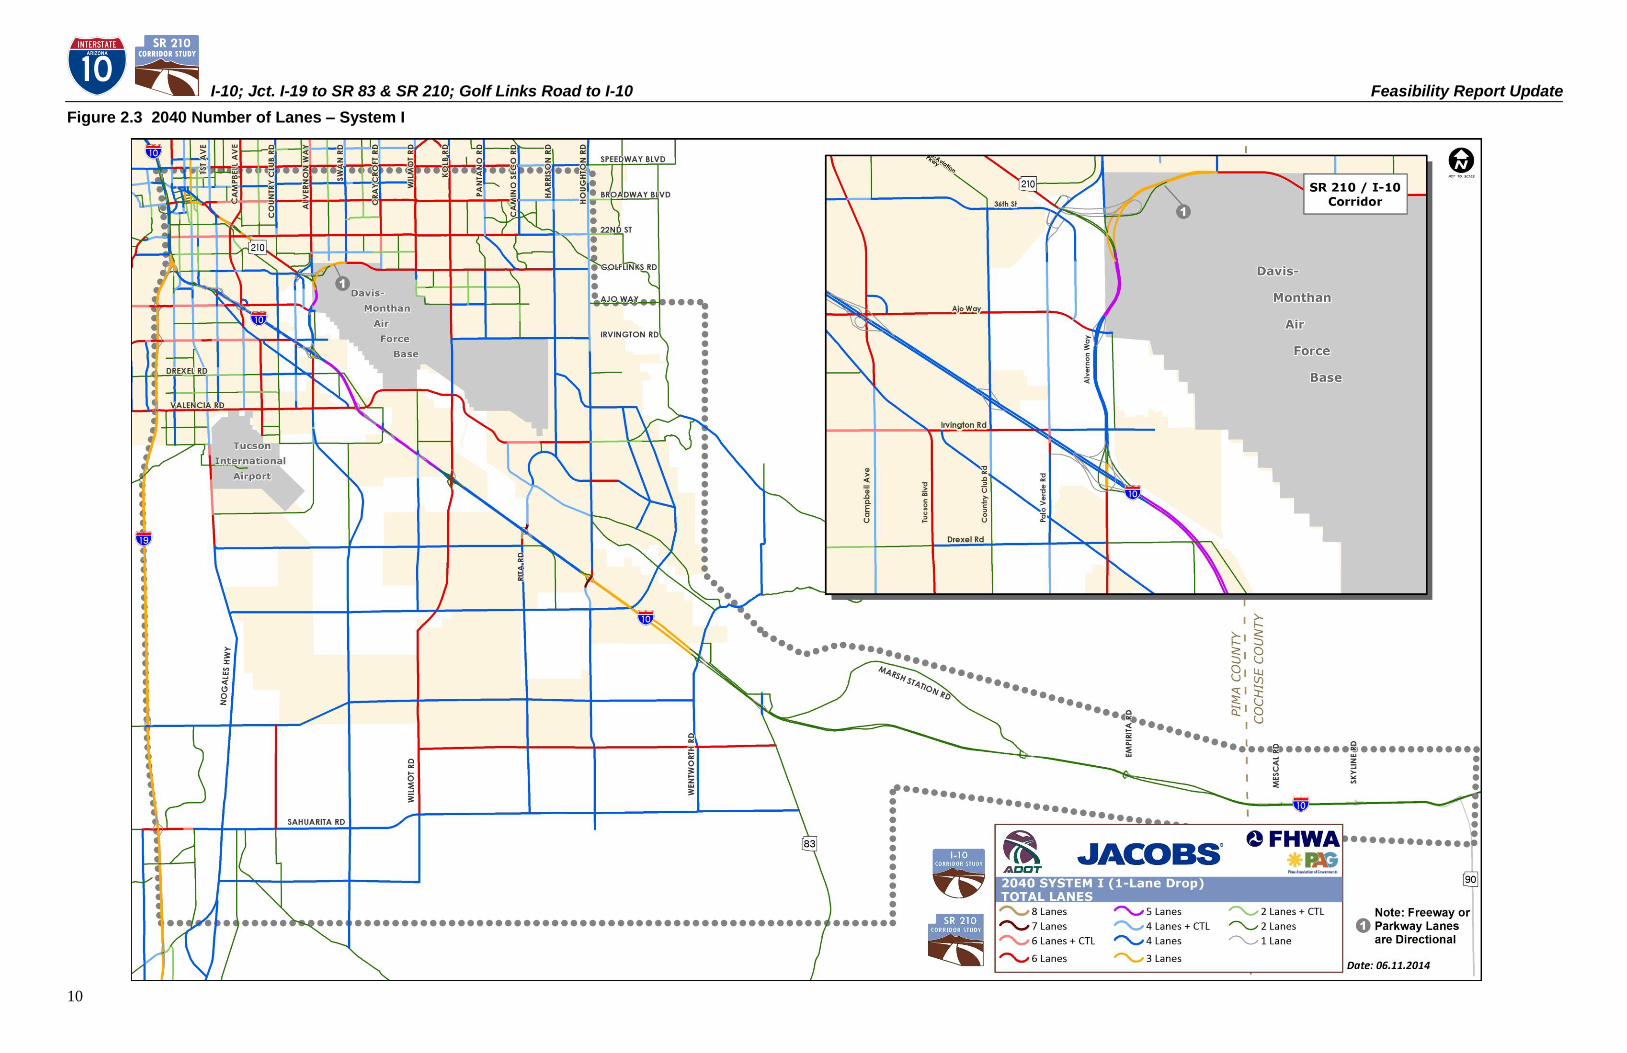
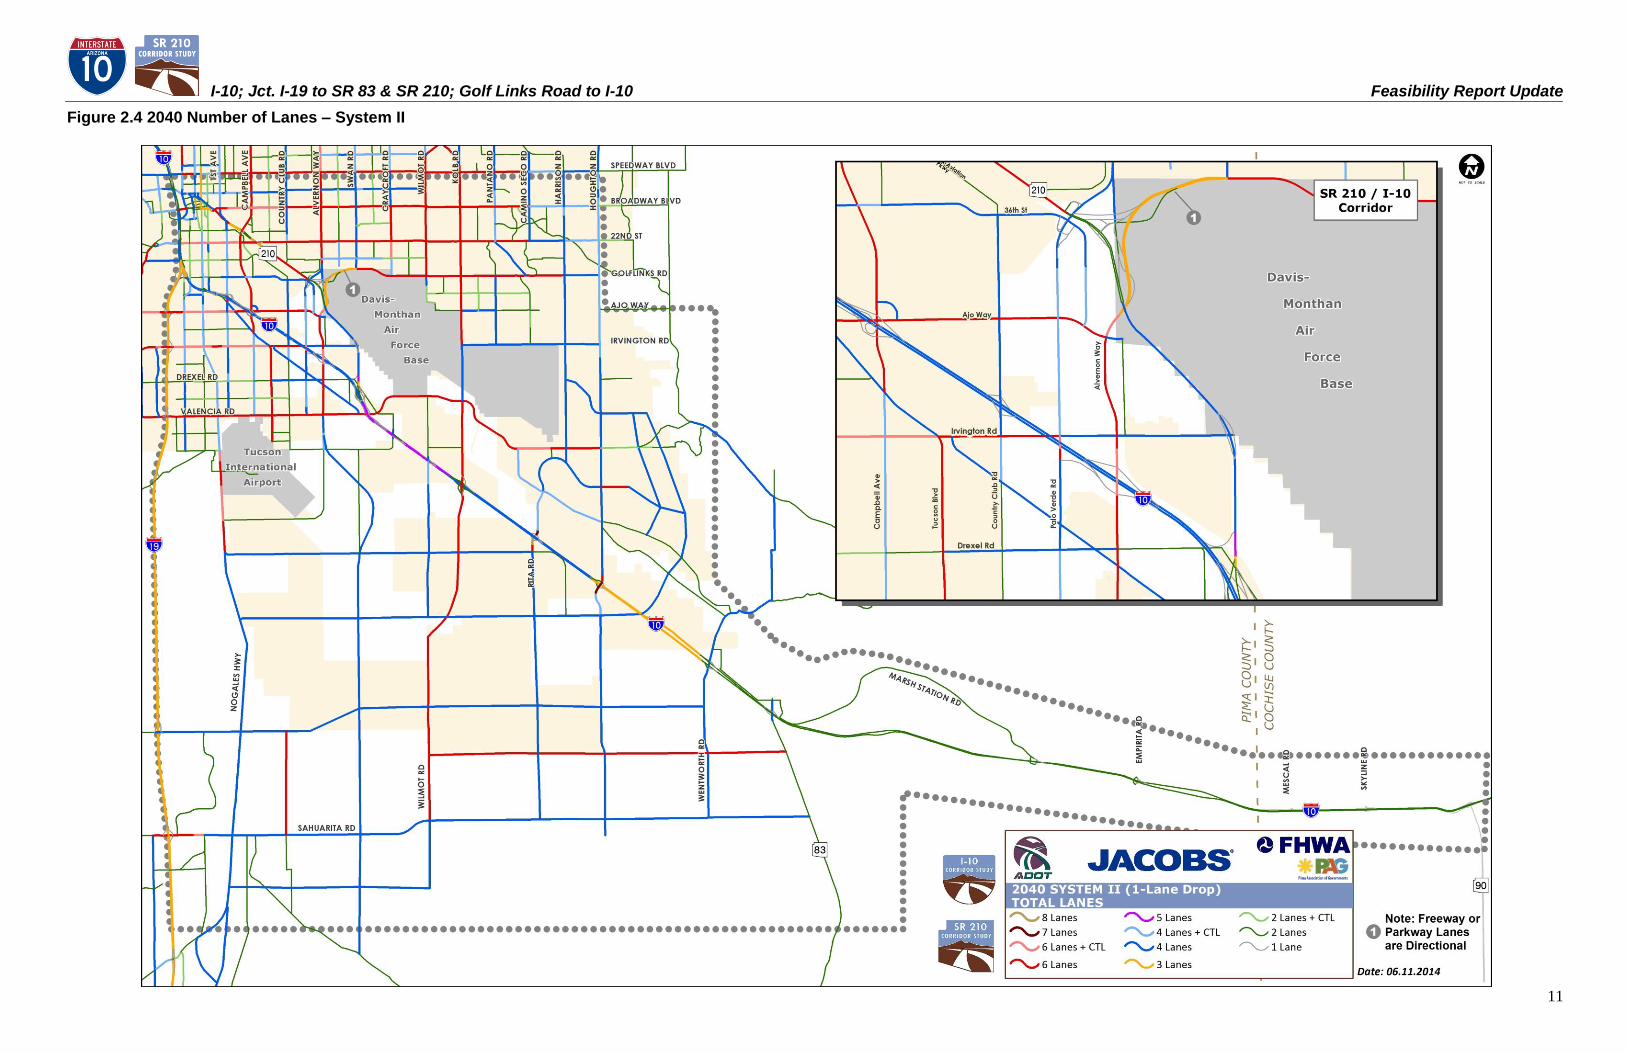
System I and II where revised to include one less lane along I-10 from
Alvernon and SR 90. System IV was developed using the same
assumptions. Figure 2.3, 2040 Number of Lanes – System I, Figure 2.4, 2040 Number of Lanes – System II, and Figure 2.5, 2040 Number of Lanes – System IV depict the revised System I, II
and IV roadway number of lanes respectively.
2.2.6 No-Build Scenario The No build scenario is often used to determine how future
transportation systems operate without planned improvements on
specific facilities. This will also help locate and quantify future travel
needs and deficiencies. For this analysis, the 2040 revised roadway
network was used, but the I-10 and SR 210 facilities were coded to
current conditions. The primary purpose of the No-Build is to create a
benchmark against which the System Alternatives will be compared.
2.2.7 Forecasted Traffic Volumes Future forecasted traffic volumes were generated using the new 2040
socioeconomic data and future System I, II and IV roadway network
alternatives. The traffic volumes were reviewed for reasonability and
compared to other study results for consistency. In addition, the
forecasted traffic volumes were used to evaluate the performance of the
improvements based on the following measures: level-of-service (LOS),
vehicle miles traveled (VMT), vehicle hours traveled (VHT) and
screenline analysis.
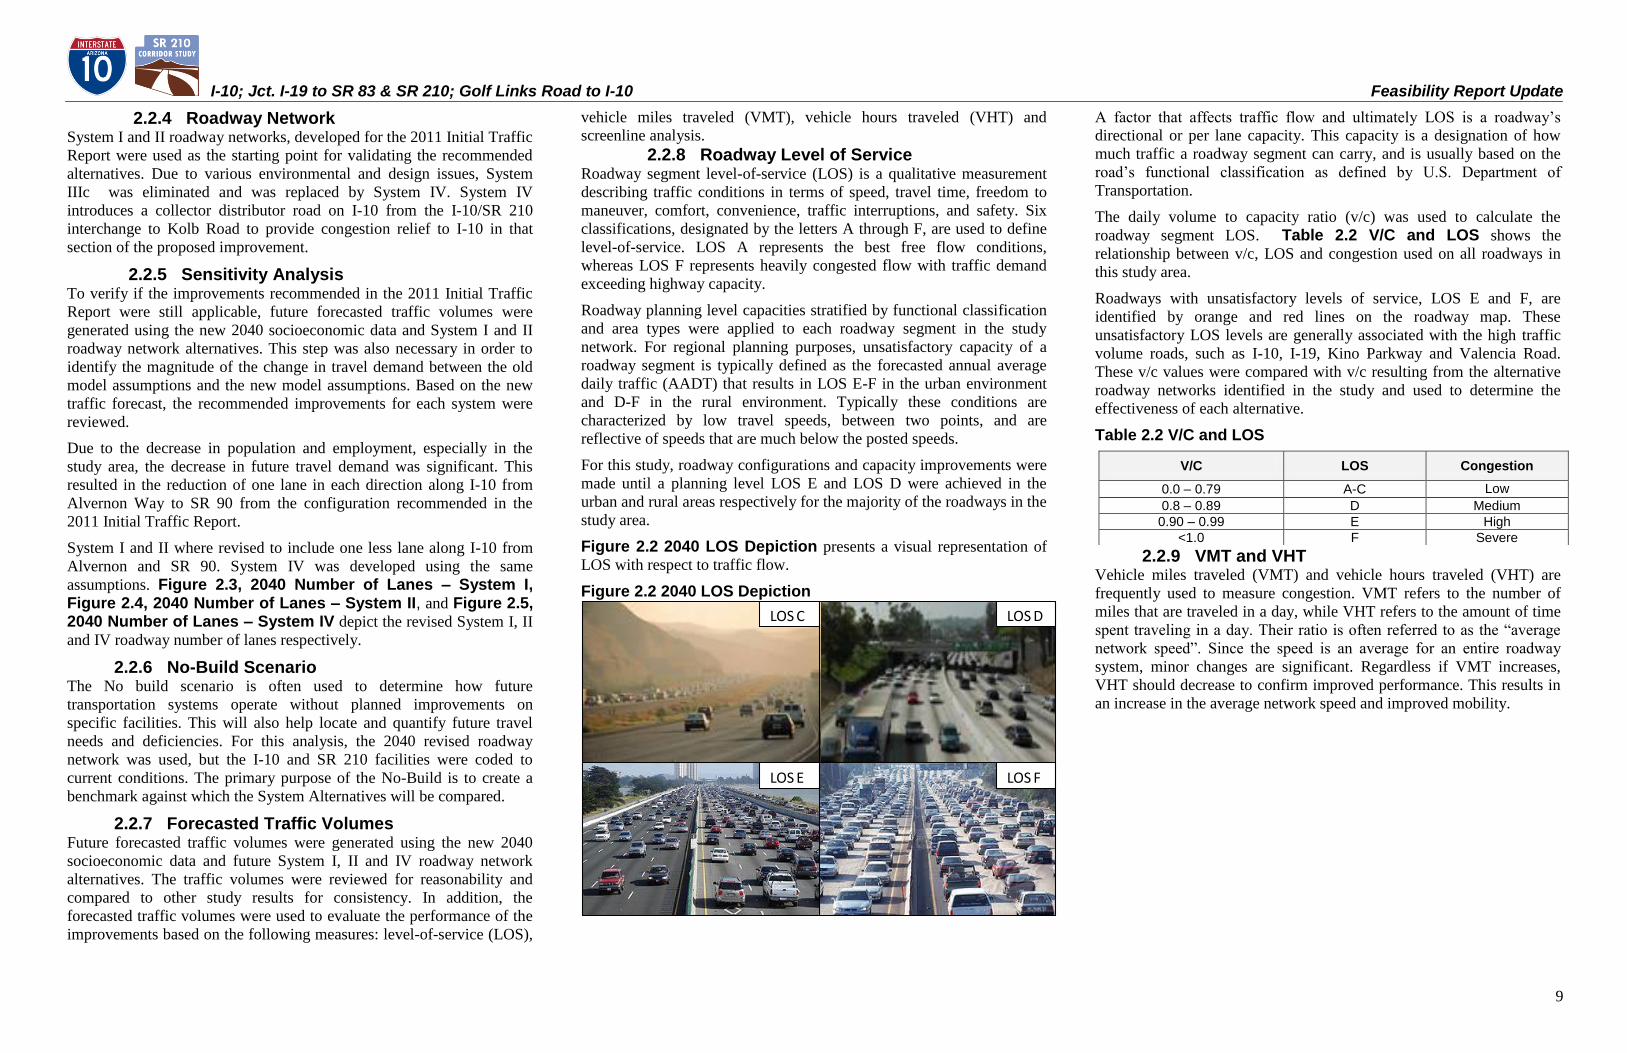
2.2.8 Roadway Level of Service Roadway segment level-of-service (LOS) is a qualitative measurement
describing traffic conditions in terms of speed, travel time, freedom to
maneuver, comfort, convenience, traffic interruptions, and safety. Six
classifications, designated by the letters A through F, are used to define
level-of-service. LOS A represents the best free flow conditions,
whereas LOS F represents heavily congested flow with traffic demand
exceeding highway capacity.
Roadway planning level capacities stratified by functional classification
and area types were applied to each roadway segment in the study
network. For regional planning purposes, unsatisfactory capacity of a
roadway segment is typically defined as the forecasted annual average
daily traffic (AADT) that results in LOS E-F in the urban environment
and D-F in the rural environment. Typically these conditions are
characterized by low travel speeds, between two points, and are
reflective of speeds that are much below the posted speeds.
For this study, roadway configurations and capacity improvements were
made until a planning level LOS E and LOS D were achieved in the
urban and rural areas respectively for the majority of the roadways in the
study area.
Figure 2.2 2040 LOS Depiction presents a visual representation of
LOS with respect to traffic flow.
Figure 2.2 2040 LOS Depiction LOS C LOS D
LOS E LOS F
A factor that affects traffic flow and ultimately LOS is a roadway‟s
directional or per lane capacity. This capacity is a designation of how
much traffic a roadway segment can carry, and is usually based on the
road‟s functional classification as defined by U.S. Department of
Transportation.
The daily volume to capacity ratio (v/c) was used to calculate the
roadway segment LOS. Table 2.2 V/C and LOS shows the
relationship between v/c, LOS and congestion used on all roadways in
this study area.
Roadways with unsatisfactory levels of service, LOS E and F, are
identified by orange and red lines on the roadway map. These
unsatisfactory LOS levels are generally associated with the high traffic
volume roads, such as I-10, I-19, Kino Parkway and Valencia Road.
These v/c values were compared with v/c resulting from the alternative
roadway networks identified in the study and used to determine the
effectiveness of each alternative.
Table 2.2 V/C and LOS
2.2.9 VMT and VHT Vehicle miles traveled (VMT) and vehicle hours traveled (VHT) are
frequently used to measure congestion. VMT refers to the number of
miles that are traveled in a day, while VHT refers to the amount of time
spent traveling in a day. Their ratio is often referred to as the “average
network speed”. Since the speed is an average for an entire roadway
system, minor changes are significant. Regardless if VMT increases,
VHT should decrease to confirm improved performance. This results in
an increase in the average network speed and improved mobility.
V/C LOS Congestion
0.0 – 0.79 A-C Low
0.8 – 0.89 D Medium
0.90 – 0.99 E High
<1.0 F Severe
I-10; Jct. I-19 to SR 83 & SR 210; Golf Links Road to I-10 Feasibility Report Update
10
Figure 2.3 2040 Number of Lanes – System I
I-10; Jct. I-19 to SR 83 & SR 210; Golf Links Road to I-10 Feasibility Report Update
11
Figure 2.4 2040 Number of Lanes – System II
I-10; Jct. I-19 to SR 83 & SR 210; Golf Links Road to I-10 Feasibility Report Update
12
Figure 2.5 2040 Number of Lanes – System IV
I-10; Jct. I-19 to SR 83 & SR 210; Golf Links Road to I-10 Feasibility Report Update
13
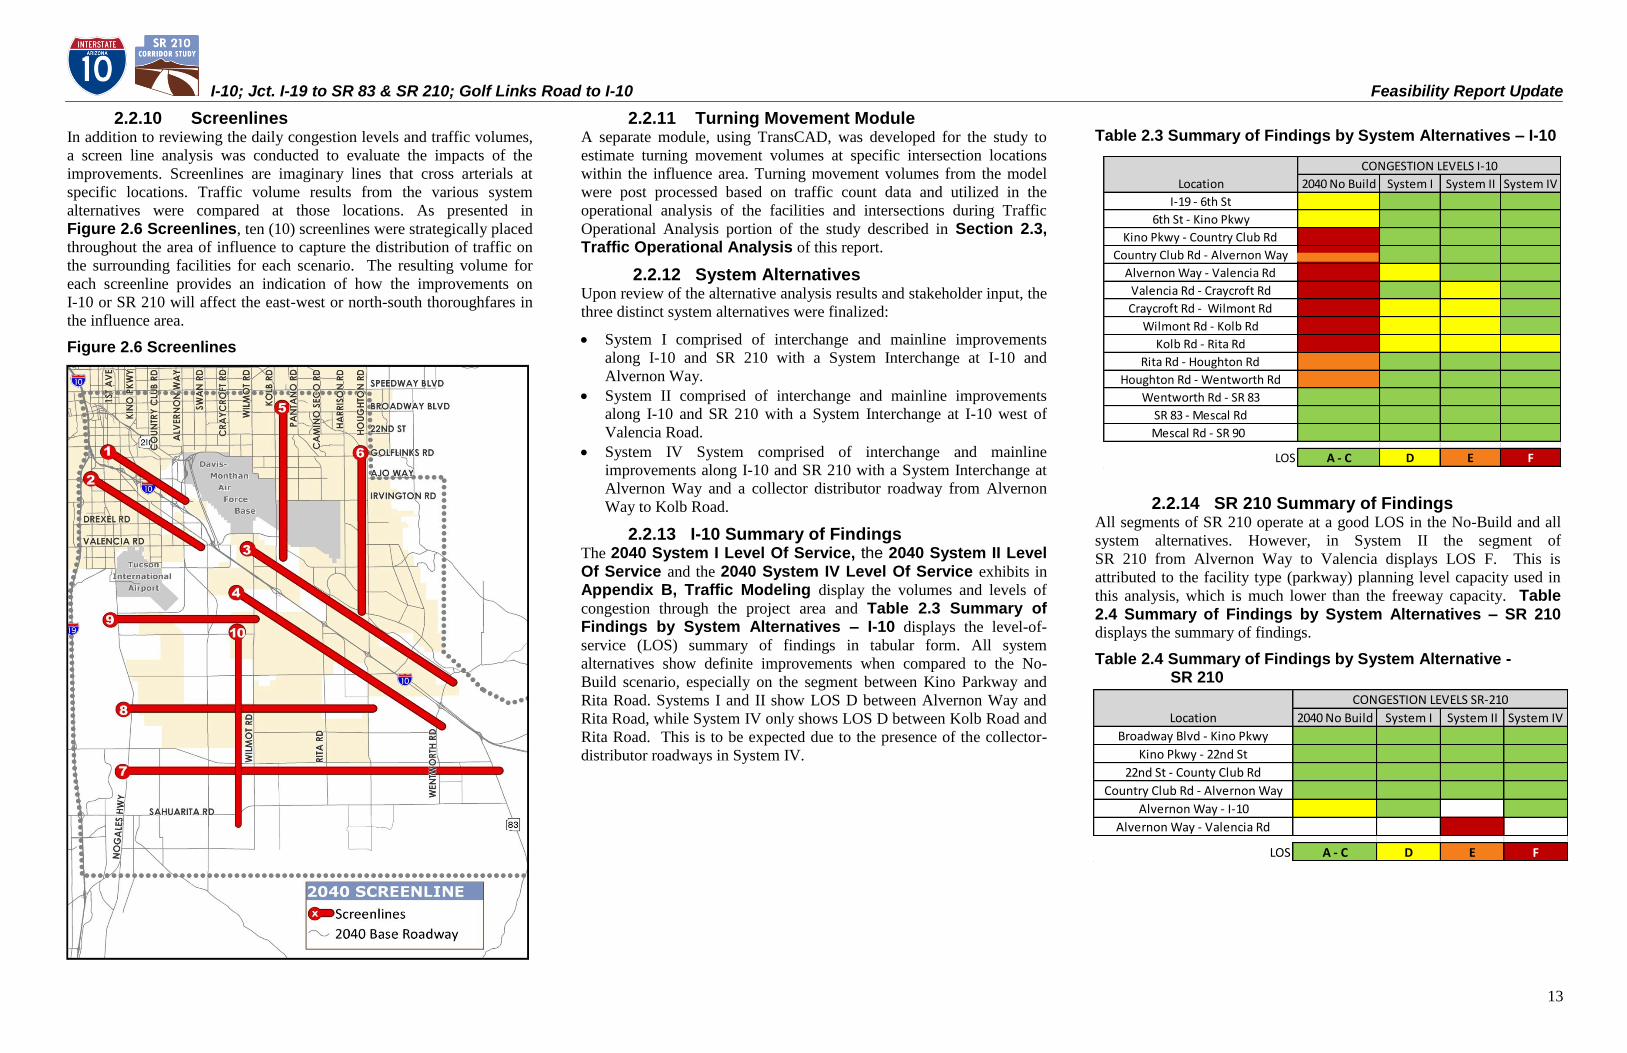
2.2.10 Screenlines In addition to reviewing the daily congestion levels and traffic volumes,
a screen line analysis was conducted to evaluate the impacts of the
improvements. Screenlines are imaginary lines that cross arterials at
specific locations. Traffic volume results from the various system
alternatives were compared at those locations. As presented in
Figure 2.6 Screenlines, ten (10) screenlines were strategically placed
throughout the area of influence to capture the distribution of traffic on
the surrounding facilities for each scenario. The resulting volume for
each screenline provides an indication of how the improvements on
I-10 or SR 210 will affect the east-west or north-south thoroughfares in
the influence area.
Figure 2.6 Screenlines
2.2.11 Turning Movement Module A separate module, using TransCAD, was developed for the study to
estimate turning movement volumes at specific intersection locations
within the influence area. Turning movement volumes from the model
were post processed based on traffic count data and utilized in the
operational analysis of the facilities and intersections during Traffic
Operational Analysis portion of the study described in Section 2.3, Traffic Operational Analysis of this report.
2.2.12 System Alternatives Upon review of the alternative analysis results and stakeholder input, the
three distinct system alternatives were finalized:
System I comprised of interchange and mainline improvements
along I-10 and SR 210 with a System Interchange at I-10 and
Alvernon Way.
System II comprised of interchange and mainline improvements
along I-10 and SR 210 with a System Interchange at I-10 west of
Valencia Road.
System IV System comprised of interchange and mainline
improvements along I-10 and SR 210 with a System Interchange at
Alvernon Way and a collector distributor roadway from Alvernon
Way to Kolb Road.
2.2.13 I-10 Summary of Findings The 2040 System I Level Of Service, the 2040 System II Level Of Service and the 2040 System IV Level Of Service exhibits in
Appendix B, Traffic Modeling display the volumes and levels of
congestion through the project area and Table 2.3 Summary of Findings by System Alternatives – I-10 displays the level-of-
service (LOS) summary of findings in tabular form. All system
alternatives show definite improvements when compared to the No-
Build scenario, especially on the segment between Kino Parkway and
Rita Road. Systems I and II show LOS D between Alvernon Way and
Rita Road, while System IV only shows LOS D between Kolb Road and
Rita Road. This is to be expected due to the presence of the collector-
distributor roadways in System IV.
Table 2.3 Summary of Findings by System Alternatives – I-10
2.2.14 SR 210 Summary of Findings All segments of SR 210 operate at a good LOS in the No-Build and all
system alternatives. However, in System II the segment of
SR 210 from Alvernon Way to Valencia displays LOS F. This is
attributed to the facility type (parkway) planning level capacity used in
this analysis, which is much lower than the freeway capacity. Table 2.4 Summary of Findings by System Alternatives – SR 210
displays the summary of findings.
Table 2.4 Summary of Findings by System Alternative - SR 210
2040 No Build System I System II System IV
LOS A - C D E F
CONGESTION LEVELS I-10
Wentworth Rd - SR 83
SR 83 - Mescal Rd
Alvernon Way - Valencia Rd
Valencia Rd - Craycroft Rd
Craycroft Rd - Wilmont Rd
Wilmont Rd - Kolb Rd
Location
I-19 - 6th St
6th St - Kino Pkwy
Kino Pkwy - Country Club Rd
Country Club Rd - Alvernon Way
Mescal Rd - SR 90
Kolb Rd - Rita Rd
Rita Rd - Houghton Rd
Houghton Rd - Wentworth Rd
2040 No Build System I System II System IV
LOS A - C D E F
Alvernon Way - Valencia Rd
Broadway Blvd - Kino Pkwy
Kino Pkwy - 22nd St
22nd St - County Club Rd
CONGESTION LEVELS SR-210
Country Club Rd - Alvernon Way
Alvernon Way - I-10
Location
I-10; Jct. I-19 to SR 83 & SR 210; Golf Links Road to I-10 Feasibility Report Update
14
2.2.15 System Alternatives Scenario Screenline Analysis
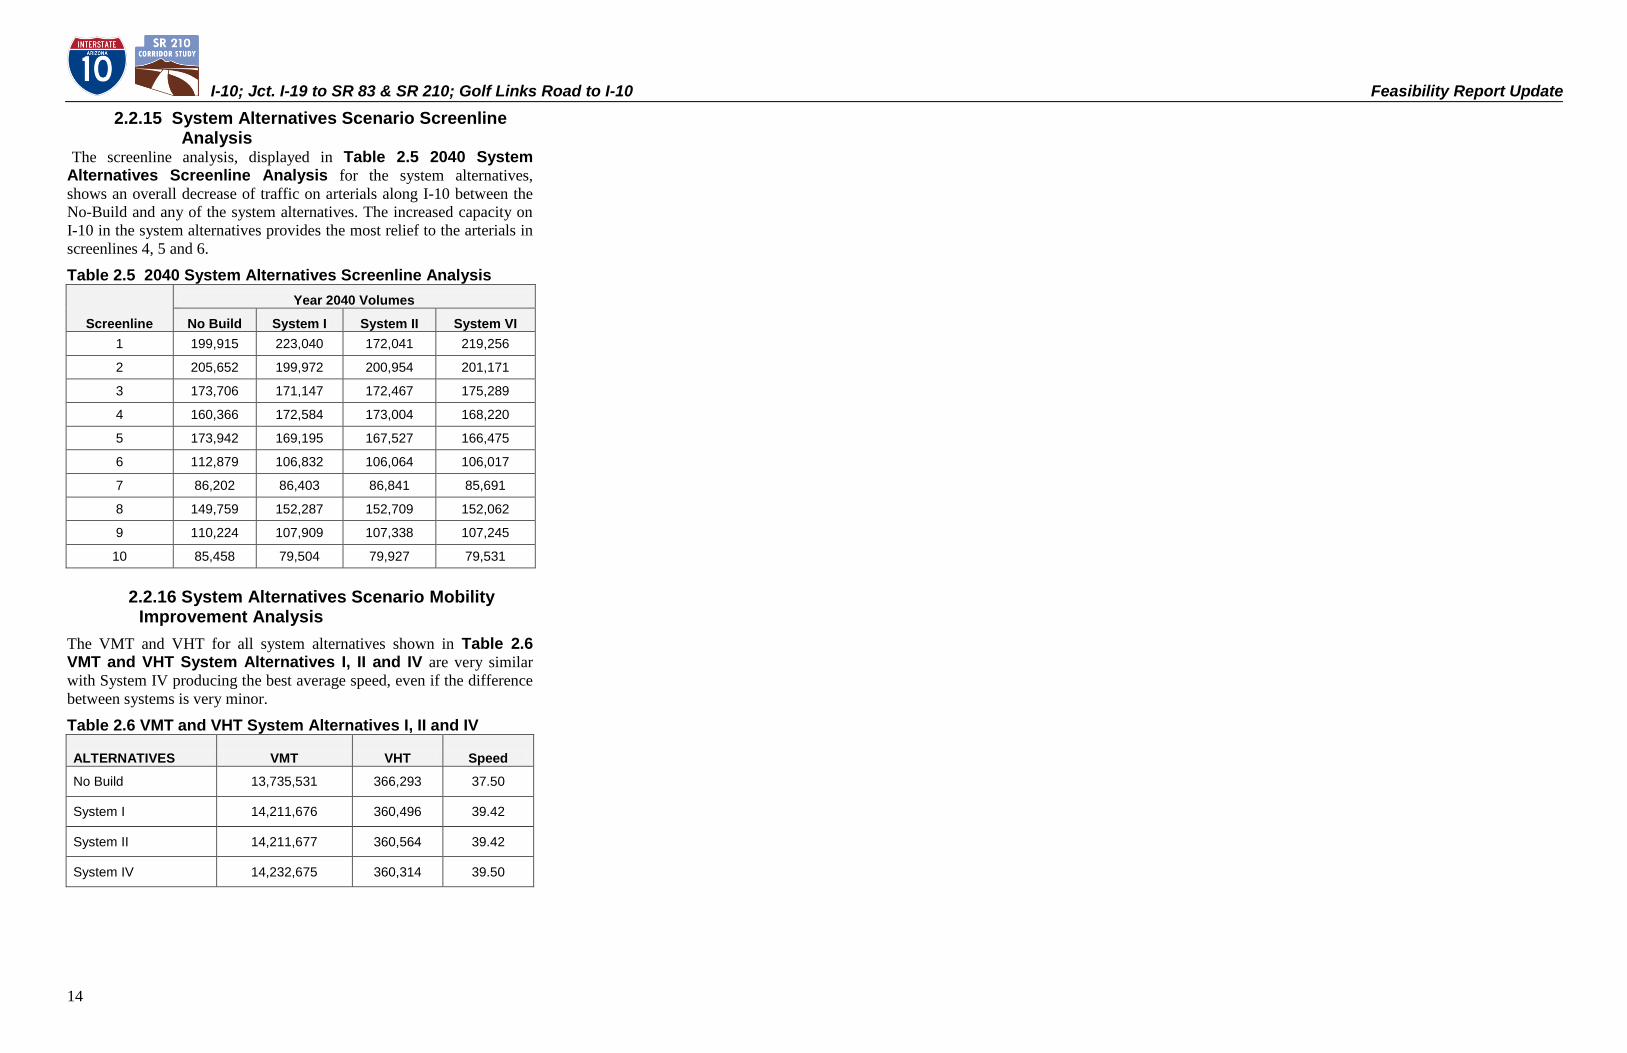
The screenline analysis, displayed in Table 2.5 2040 System Alternatives Screenline Analysis for the system alternatives,
shows an overall decrease of traffic on arterials along I-10 between the
No-Build and any of the system alternatives. The increased capacity on
I-10 in the system alternatives provides the most relief to the arterials in
screenlines 4, 5 and 6.
Table 2.5 2040 System Alternatives Screenline Analysis
Screenline
Year 2040 Volumes
No Build System I System II System VI 1 199,915 223,040 172,041 219,256
2 205,652 199,972 200,954 201,171
3 173,706 171,147 172,467 175,289
4 160,366 172,584 173,004 168,220
5 173,942 169,195 167,527 166,475
6 112,879 106,832 106,064 106,017
7 86,202 86,403 86,841 85,691
8 149,759 152,287 152,709 152,062
9 110,224 107,909 107,338 107,245
10 85,458 79,504 79,927 79,531
2.2.16 System Alternatives Scenario Mobility
Improvement Analysis The VMT and VHT for all system alternatives shown in Table 2.6 VMT and VHT System Alternatives I, II and IV are very similar
with System IV producing the best average speed, even if the difference
between systems is very minor.
Table 2.6 VMT and VHT System Alternatives I, II and IV
ALTERNATIVES VMT VHT Speed
No Build 13,735,531 366,293 37.50
System I 14,211,676 360,496 39.42
System II 14,211,677 360,564 39.42
System IV 14,232,675 360,314 39.50
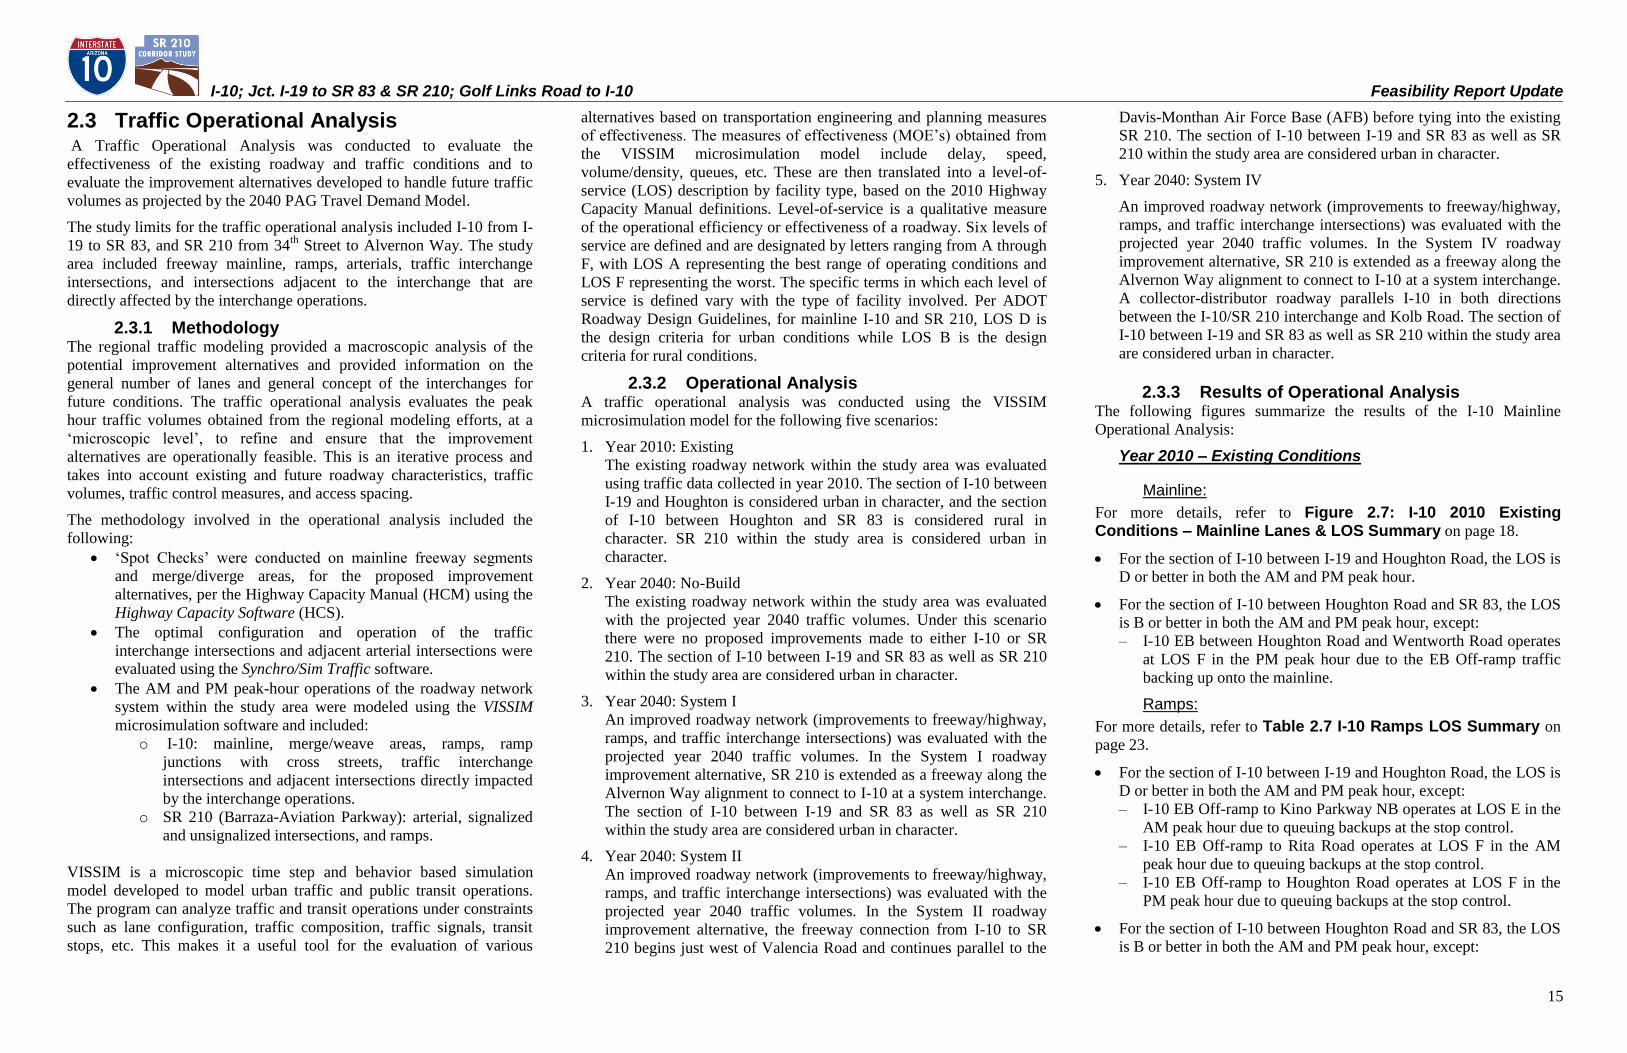
I-10; Jct. I-19 to SR 83 & SR 210; Golf Links Road to I-10 Feasibility Report Update
15
2.3 Traffic Operational Analysis A Traffic Operational Analysis was conducted to evaluate the
effectiveness of the existing roadway and traffic conditions and to
evaluate the improvement alternatives developed to handle future traffic
volumes as projected by the 2040 PAG Travel Demand Model.
The study limits for the traffic operational analysis included I-10 from I-
19 to SR 83, and SR 210 from 34th
Street to Alvernon Way. The study
area included freeway mainline, ramps, arterials, traffic interchange
intersections, and intersections adjacent to the interchange that are
directly affected by the interchange operations.
2.3.1 Methodology The regional traffic modeling provided a macroscopic analysis of the
potential improvement alternatives and provided information on the
general number of lanes and general concept of the interchanges for
future conditions. The traffic operational analysis evaluates the peak
hour traffic volumes obtained from the regional modeling efforts, at a
„microscopic level‟, to refine and ensure that the improvement
alternatives are operationally feasible. This is an iterative process and
takes into account existing and future roadway characteristics, traffic
volumes, traffic control measures, and access spacing.
The methodology involved in the operational analysis included the
following:
„Spot Checks‟ were conducted on mainline freeway segments
and merge/diverge areas, for the proposed improvement
alternatives, per the Highway Capacity Manual (HCM) using the
Highway Capacity Software (HCS).
The optimal configuration and operation of the traffic
interchange intersections and adjacent arterial intersections were
evaluated using the Synchro/Sim Traffic software.
The AM and PM peak-hour operations of the roadway network
system within the study area were modeled using the VISSIM
microsimulation software and included:
o I-10: mainline, merge/weave areas, ramps, ramp
junctions with cross streets, traffic interchange
intersections and adjacent intersections directly impacted
by the interchange operations.
o SR 210 (Barraza-Aviation Parkway): arterial, signalized
and unsignalized intersections, and ramps.
VISSIM is a microscopic time step and behavior based simulation
model developed to model urban traffic and public transit operations.
The program can analyze traffic and transit operations under constraints
such as lane configuration, traffic composition, traffic signals, transit
stops, etc. This makes it a useful tool for the evaluation of various
alternatives based on transportation engineering and planning measures
of effectiveness. The measures of effectiveness (MOE‟s) obtained from
the VISSIM microsimulation model include delay, speed,
volume/density, queues, etc. These are then translated into a level-of-
service (LOS) description by facility type, based on the 2010 Highway
Capacity Manual definitions. Level-of-service is a qualitative measure
of the operational efficiency or effectiveness of a roadway. Six levels of
service are defined and are designated by letters ranging from A through
F, with LOS A representing the best range of operating conditions and
LOS F representing the worst. The specific terms in which each level of
service is defined vary with the type of facility involved. Per ADOT
Roadway Design Guidelines, for mainline I-10 and SR 210, LOS D is
the design criteria for urban conditions while LOS B is the design
criteria for rural conditions.
2.3.2 Operational Analysis A traffic operational analysis was conducted using the VISSIM
microsimulation model for the following five scenarios:
1. Year 2010: Existing
The existing roadway network within the study area was evaluated
using traffic data collected in year 2010. The section of I-10 between
I-19 and Houghton is considered urban in character, and the section
of I-10 between Houghton and SR 83 is considered rural in
character. SR 210 within the study area is considered urban in
character.
2. Year 2040: No-Build
The existing roadway network within the study area was evaluated
with the projected year 2040 traffic volumes. Under this scenario
there were no proposed improvements made to either I-10 or SR
210. The section of I-10 between I-19 and SR 83 as well as SR 210
within the study area are considered urban in character.
3. Year 2040: System I
An improved roadway network (improvements to freeway/highway,
ramps, and traffic interchange intersections) was evaluated with the
projected year 2040 traffic volumes. In the System I roadway
improvement alternative, SR 210 is extended as a freeway along the
Alvernon Way alignment to connect to I-10 at a system interchange.
The section of I-10 between I-19 and SR 83 as well as SR 210
within the study area are considered urban in character.
4. Year 2040: System II
An improved roadway network (improvements to freeway/highway,
ramps, and traffic interchange intersections) was evaluated with the
projected year 2040 traffic volumes. In the System II roadway
improvement alternative, the freeway connection from I-10 to SR
210 begins just west of Valencia Road and continues parallel to the
Davis-Monthan Air Force Base (AFB) before tying into the existing
SR 210. The section of I-10 between I-19 and SR 83 as well as SR
210 within the study area are considered urban in character.
5. Year 2040: System IV
An improved roadway network (improvements to freeway/highway,
ramps, and traffic interchange intersections) was evaluated with the
projected year 2040 traffic volumes. In the System IV roadway
improvement alternative, SR 210 is extended as a freeway along the
Alvernon Way alignment to connect to I-10 at a system interchange.
A collector-distributor roadway parallels I-10 in both directions
between the I-10/SR 210 interchange and Kolb Road. The section of
I-10 between I-19 and SR 83 as well as SR 210 within the study area
are considered urban in character.
2.3.3 Results of Operational Analysis The following figures summarize the results of the I-10 Mainline
Operational Analysis:
Year 2010 – Existing Conditions
Mainline:
For more details, refer to Figure 2.7: I-10 2010 Existing Conditions – Mainline Lanes & LOS Summary on page 18.
For the section of I-10 between I-19 and Houghton Road, the LOS is
D or better in both the AM and PM peak hour.
For the section of I-10 between Houghton Road and SR 83, the LOS
is B or better in both the AM and PM peak hour, except:
– I-10 EB between Houghton Road and Wentworth Road operates
at LOS F in the PM peak hour due to the EB Off-ramp traffic
backing up onto the mainline.
Ramps:
For more details, refer to Table 2.7 I-10 Ramps LOS Summary on
page 23.
For the section of I-10 between I-19 and Houghton Road, the LOS is
D or better in both the AM and PM peak hour, except:
– I-10 EB Off-ramp to Kino Parkway NB operates at LOS E in the
AM peak hour due to queuing backups at the stop control.
– I-10 EB Off-ramp to Rita Road operates at LOS F in the AM
peak hour due to queuing backups at the stop control.
– I-10 EB Off-ramp to Houghton Road operates at LOS F in the
PM peak hour due to queuing backups at the stop control.
For the section of I-10 between Houghton Road and SR 83, the LOS
is B or better in both the AM and PM peak hour, except:
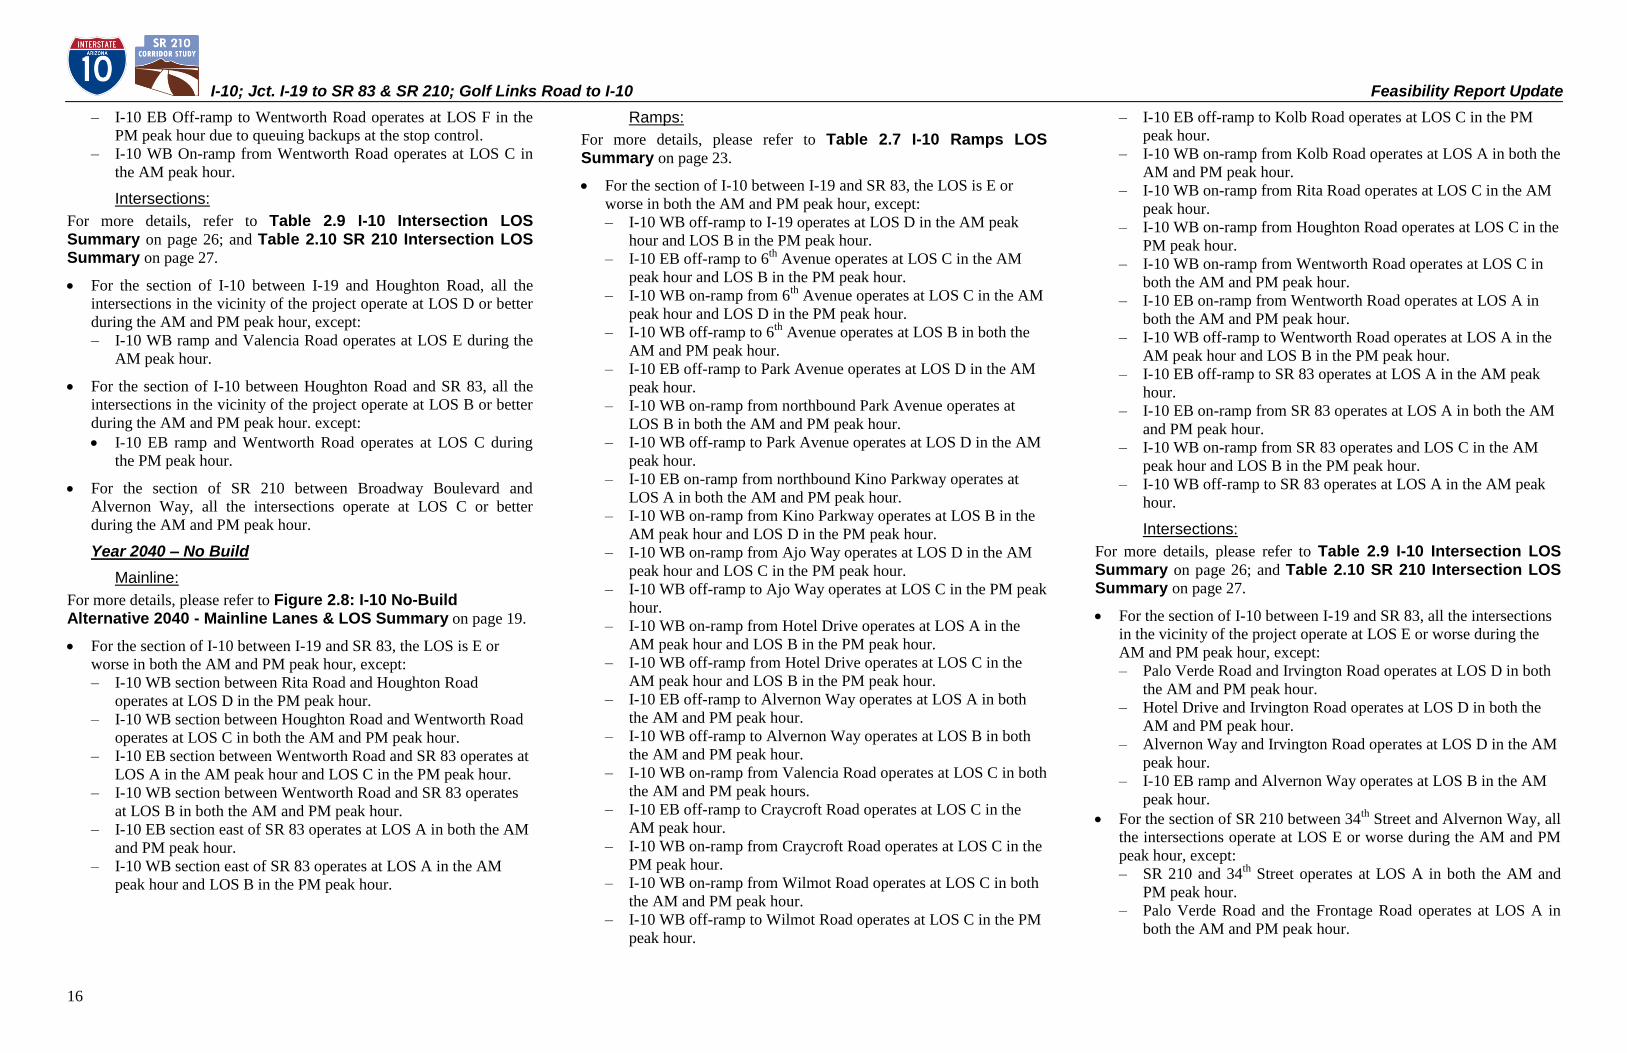
I-10; Jct. I-19 to SR 83 & SR 210; Golf Links Road to I-10 Feasibility Report Update
16
– I-10 EB Off-ramp to Wentworth Road operates at LOS F in the
PM peak hour due to queuing backups at the stop control.
– I-10 WB On-ramp from Wentworth Road operates at LOS C in
the AM peak hour.
Intersections:
For more details, refer to Table 2.9 I-10 Intersection LOS Summary on page 26; and Table 2.10 SR 210 Intersection LOS Summary on page 27.
For the section of I-10 between I-19 and Houghton Road, all the
intersections in the vicinity of the project operate at LOS D or better
during the AM and PM peak hour, except:
– I-10 WB ramp and Valencia Road operates at LOS E during the
AM peak hour.
For the section of I-10 between Houghton Road and SR 83, all the
intersections in the vicinity of the project operate at LOS B or better
during the AM and PM peak hour. except:
I-10 EB ramp and Wentworth Road operates at LOS C during
the PM peak hour.
For the section of SR 210 between Broadway Boulevard and
Alvernon Way, all the intersections operate at LOS C or better
during the AM and PM peak hour.
Year 2040 – No Build
Mainline:
For more details, please refer to Figure 2.8: I-10 No-Build Alternative 2040 - Mainline Lanes & LOS Summary on page 19.
For the section of I-10 between I-19 and SR 83, the LOS is E or
worse in both the AM and PM peak hour, except:
– I-10 WB section between Rita Road and Houghton Road
operates at LOS D in the PM peak hour.
– I-10 WB section between Houghton Road and Wentworth Road
operates at LOS C in both the AM and PM peak hour.
– I-10 EB section between Wentworth Road and SR 83 operates at
LOS A in the AM peak hour and LOS C in the PM peak hour.
– I-10 WB section between Wentworth Road and SR 83 operates
at LOS B in both the AM and PM peak hour.
– I-10 EB section east of SR 83 operates at LOS A in both the AM
and PM peak hour.
– I-10 WB section east of SR 83 operates at LOS A in the AM
peak hour and LOS B in the PM peak hour.
Ramps:
For more details, please refer to Table 2.7 I-10 Ramps LOS Summary on page 23.
For the section of I-10 between I-19 and SR 83, the LOS is E or
worse in both the AM and PM peak hour, except:
– I-10 WB off-ramp to I-19 operates at LOS D in the AM peak
hour and LOS B in the PM peak hour.
– I-10 EB off-ramp to 6th
Avenue operates at LOS C in the AM
peak hour and LOS B in the PM peak hour.
– I-10 WB on-ramp from 6th
Avenue operates at LOS C in the AM
peak hour and LOS D in the PM peak hour.
– I-10 WB off-ramp to 6th
Avenue operates at LOS B in both the
AM and PM peak hour.
– I-10 EB off-ramp to Park Avenue operates at LOS D in the AM
peak hour.
– I-10 WB on-ramp from northbound Park Avenue operates at
LOS B in both the AM and PM peak hour.
– I-10 WB off-ramp to Park Avenue operates at LOS D in the AM
peak hour.
– I-10 EB on-ramp from northbound Kino Parkway operates at
LOS A in both the AM and PM peak hour.
– I-10 WB on-ramp from Kino Parkway operates at LOS B in the
AM peak hour and LOS D in the PM peak hour.
– I-10 WB on-ramp from Ajo Way operates at LOS D in the AM
peak hour and LOS C in the PM peak hour.
– I-10 WB off-ramp to Ajo Way operates at LOS C in the PM peak
hour.
– I-10 WB on-ramp from Hotel Drive operates at LOS A in the
AM peak hour and LOS B in the PM peak hour.
– I-10 WB off-ramp from Hotel Drive operates at LOS C in the
AM peak hour and LOS B in the PM peak hour.
– I-10 EB off-ramp to Alvernon Way operates at LOS A in both
the AM and PM peak hour.
– I-10 WB off-ramp to Alvernon Way operates at LOS B in both
the AM and PM peak hour.
– I-10 WB on-ramp from Valencia Road operates at LOS C in both
the AM and PM peak hours.
– I-10 EB off-ramp to Craycroft Road operates at LOS C in the
AM peak hour.
– I-10 WB on-ramp from Craycroft Road operates at LOS C in the
PM peak hour.
– I-10 WB on-ramp from Wilmot Road operates at LOS C in both
the AM and PM peak hour.
– I-10 WB off-ramp to Wilmot Road operates at LOS C in the PM
peak hour.
– I-10 EB off-ramp to Kolb Road operates at LOS C in the PM
peak hour.
– I-10 WB on-ramp from Kolb Road operates at LOS A in both the
AM and PM peak hour.
– I-10 WB on-ramp from Rita Road operates at LOS C in the AM
peak hour.
– I-10 WB on-ramp from Houghton Road operates at LOS C in the
PM peak hour.
– I-10 WB on-ramp from Wentworth Road operates at LOS C in
both the AM and PM peak hour.
– I-10 EB on-ramp from Wentworth Road operates at LOS A in
both the AM and PM peak hour.
– I-10 WB off-ramp to Wentworth Road operates at LOS A in the
AM peak hour and LOS B in the PM peak hour.
– I-10 EB off-ramp to SR 83 operates at LOS A in the AM peak
hour.
– I-10 EB on-ramp from SR 83 operates at LOS A in both the AM
and PM peak hour.
– I-10 WB on-ramp from SR 83 operates and LOS C in the AM
peak hour and LOS B in the PM peak hour.
– I-10 WB off-ramp to SR 83 operates at LOS A in the AM peak
hour.
Intersections:
For more details, please refer to Table 2.9 I-10 Intersection LOS Summary on page 26; and Table 2.10 SR 210 Intersection LOS Summary on page 27.
For the section of I-10 between I-19 and SR 83, all the intersections
in the vicinity of the project operate at LOS E or worse during the
AM and PM peak hour, except:
– Palo Verde Road and Irvington Road operates at LOS D in both
the AM and PM peak hour.
– Hotel Drive and Irvington Road operates at LOS D in both the
AM and PM peak hour.
– Alvernon Way and Irvington Road operates at LOS D in the AM
peak hour.
– I-10 EB ramp and Alvernon Way operates at LOS B in the AM
peak hour.
For the section of SR 210 between 34th
Street and Alvernon Way, all
the intersections operate at LOS E or worse during the AM and PM
peak hour, except:
– SR 210 and 34th
Street operates at LOS A in both the AM and
PM peak hour.
– Palo Verde Road and the Frontage Road operates at LOS A in
both the AM and PM peak hour.
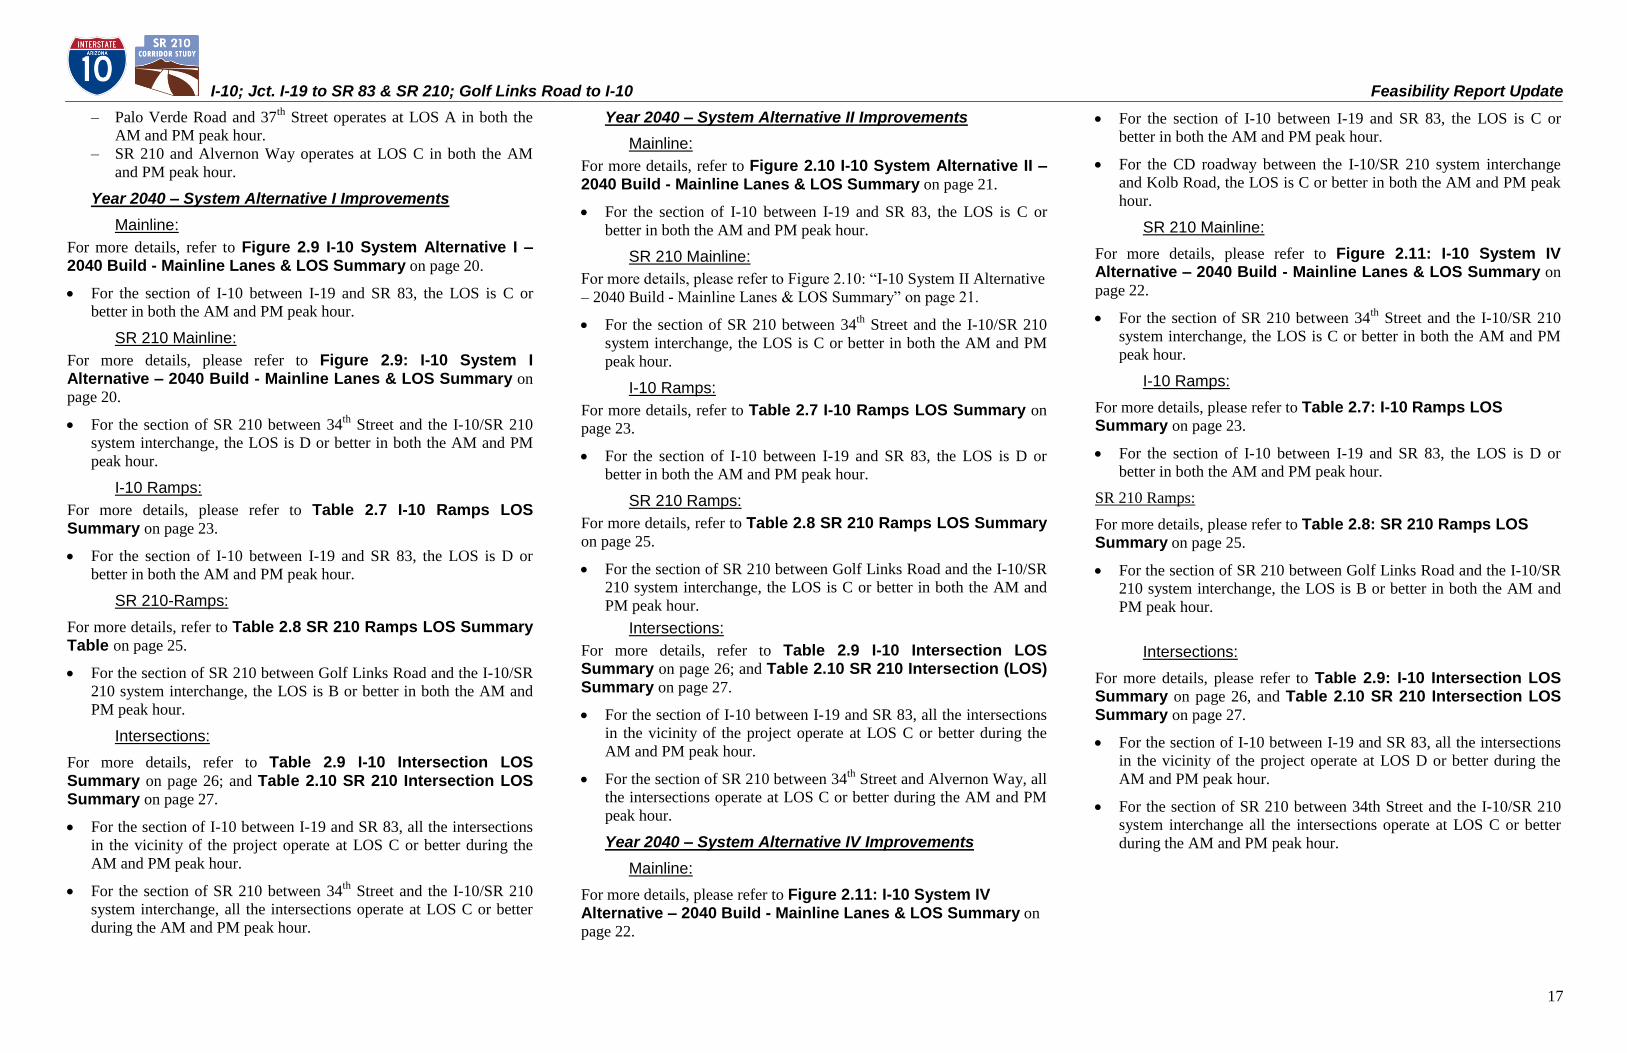
I-10; Jct. I-19 to SR 83 & SR 210; Golf Links Road to I-10 Feasibility Report Update
17
– Palo Verde Road and 37th
Street operates at LOS A in both the
AM and PM peak hour.
– SR 210 and Alvernon Way operates at LOS C in both the AM
and PM peak hour.
Year 2040 – System Alternative I Improvements
Mainline:
For more details, refer to Figure 2.9 I-10 System Alternative I – 2040 Build - Mainline Lanes & LOS Summary on page 20.
For the section of I-10 between I-19 and SR 83, the LOS is C or
better in both the AM and PM peak hour.
SR 210 Mainline:
For more details, please refer to Figure 2.9: I-10 System I Alternative – 2040 Build - Mainline Lanes & LOS Summary on
page 20.
For the section of SR 210 between 34th
Street and the I-10/SR 210
system interchange, the LOS is D or better in both the AM and PM
peak hour.
I-10 Ramps:
For more details, please refer to Table 2.7 I-10 Ramps LOS Summary on page 23.
For the section of I-10 between I-19 and SR 83, the LOS is D or
better in both the AM and PM peak hour.
SR 210-Ramps:
For more details, refer to Table 2.8 SR 210 Ramps LOS Summary Table on page 25.
For the section of SR 210 between Golf Links Road and the I-10/SR
210 system interchange, the LOS is B or better in both the AM and
PM peak hour.
Intersections: For more details, refer to Table 2.9 I-10 Intersection LOS Summary on page 26; and Table 2.10 SR 210 Intersection LOS Summary on page 27.
For the section of I-10 between I-19 and SR 83, all the intersections
in the vicinity of the project operate at LOS C or better during the
AM and PM peak hour.
For the section of SR 210 between 34th
Street and the I-10/SR 210
system interchange, all the intersections operate at LOS C or better
during the AM and PM peak hour.
Year 2040 – System Alternative II Improvements
Mainline:
For more details, refer to Figure 2.10 I-10 System Alternative II – 2040 Build - Mainline Lanes & LOS Summary on page 21.
For the section of I-10 between I-19 and SR 83, the LOS is C or
better in both the AM and PM peak hour.
SR 210 Mainline:
For more details, please refer to Figure 2.10: “I-10 System II Alternative
– 2040 Build - Mainline Lanes & LOS Summary” on page 21.
For the section of SR 210 between 34th
Street and the I-10/SR 210
system interchange, the LOS is C or better in both the AM and PM
peak hour.
I-10 Ramps:
For more details, refer to Table 2.7 I-10 Ramps LOS Summary on
page 23.
For the section of I-10 between I-19 and SR 83, the LOS is D or
better in both the AM and PM peak hour.
SR 210 Ramps:
For more details, refer to Table 2.8 SR 210 Ramps LOS Summary on page 25.
For the section of SR 210 between Golf Links Road and the I-10/SR
210 system interchange, the LOS is C or better in both the AM and
PM peak hour.
Intersections:
For more details, refer to Table 2.9 I-10 Intersection LOS Summary on page 26; and Table 2.10 SR 210 Intersection (LOS) Summary on page 27.
For the section of I-10 between I-19 and SR 83, all the intersections
in the vicinity of the project operate at LOS C or better during the
AM and PM peak hour.
For the section of SR 210 between 34th
Street and Alvernon Way, all
the intersections operate at LOS C or better during the AM and PM
peak hour.
Year 2040 – System Alternative IV Improvements
Mainline:
For more details, please refer to Figure 2.11: I-10 System IV Alternative – 2040 Build - Mainline Lanes & LOS Summary on
page 22.
For the section of I-10 between I-19 and SR 83, the LOS is C or
better in both the AM and PM peak hour.
For the CD roadway between the I-10/SR 210 system interchange
and Kolb Road, the LOS is C or better in both the AM and PM peak
hour.
SR 210 Mainline:
For more details, please refer to Figure 2.11: I-10 System IV Alternative – 2040 Build - Mainline Lanes & LOS Summary on
page 22.
For the section of SR 210 between 34th
Street and the I-10/SR 210
system interchange, the LOS is C or better in both the AM and PM
peak hour.
I-10 Ramps:
For more details, please refer to Table 2.7: I-10 Ramps LOS Summary on page 23.
For the section of I-10 between I-19 and SR 83, the LOS is D or
better in both the AM and PM peak hour.
SR 210 Ramps:
For more details, please refer to Table 2.8: SR 210 Ramps LOS Summary on page 25.
For the section of SR 210 between Golf Links Road and the I-10/SR
210 system interchange, the LOS is B or better in both the AM and
PM peak hour.
Intersections:
For more details, please refer to Table 2.9: I-10 Intersection LOS Summary on page 26, and Table 2.10 SR 210 Intersection LOS Summary on page 27.
For the section of I-10 between I-19 and SR 83, all the intersections
in the vicinity of the project operate at LOS D or better during the
AM and PM peak hour.
For the section of SR 210 between 34th Street and the I-10/SR 210
system interchange all the intersections operate at LOS C or better
during the AM and PM peak hour.
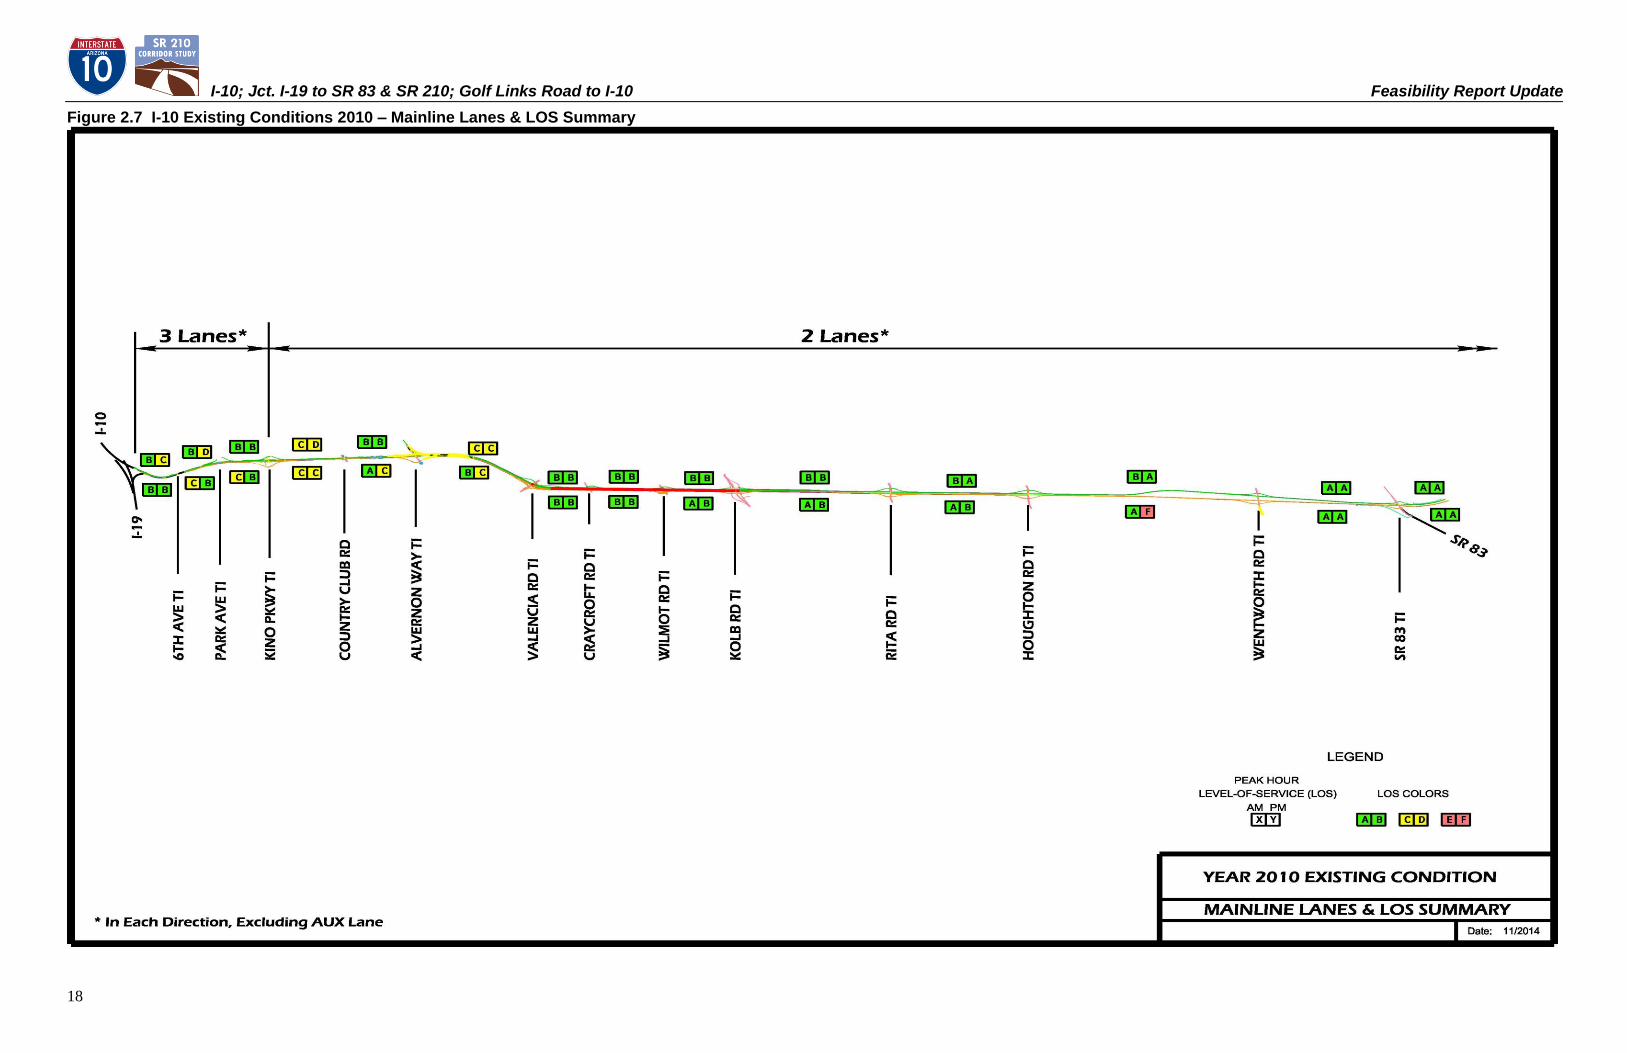
I-10; Jct. I-19 to SR 83 & SR 210; Golf Links Road to I-10 Feasibility Report Update
18
Figure 2.7 I-10 Existing Conditions 2010 – Mainline Lanes & LOS Summary
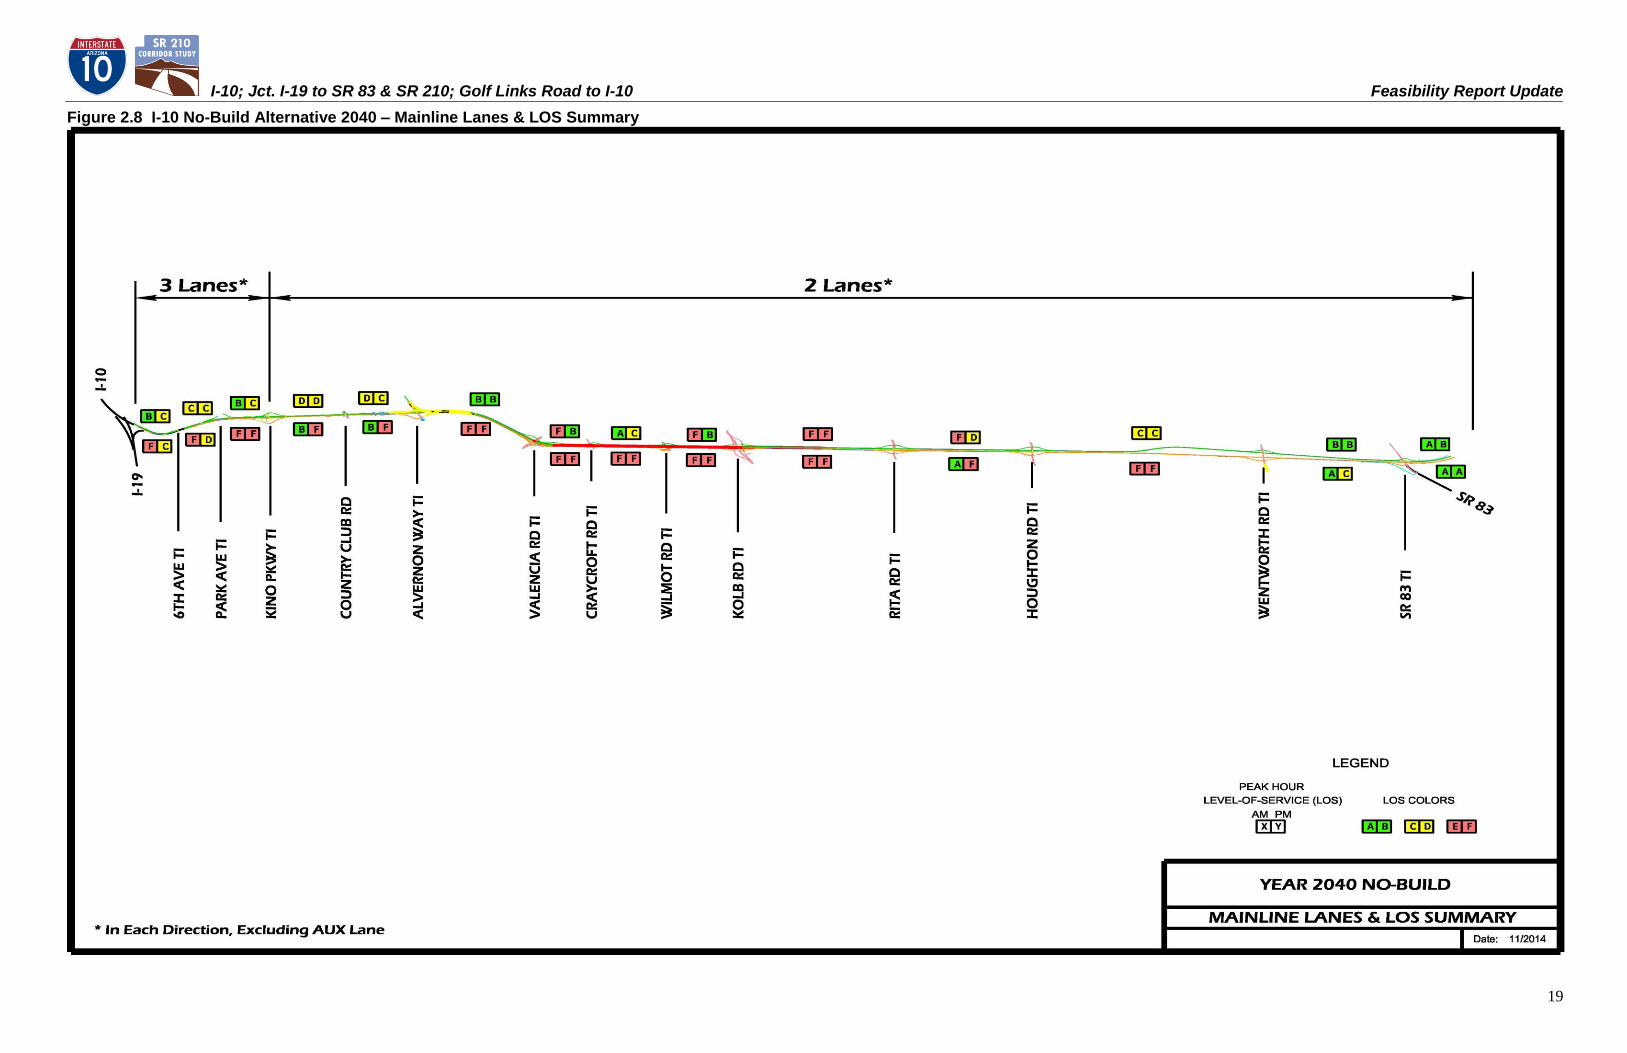
I-10; Jct. I-19 to SR 83 & SR 210; Golf Links Road to I-10 Feasibility Report Update
19
Figure 2.8 I-10 No-Build Alternative 2040 – Mainline Lanes & LOS Summary
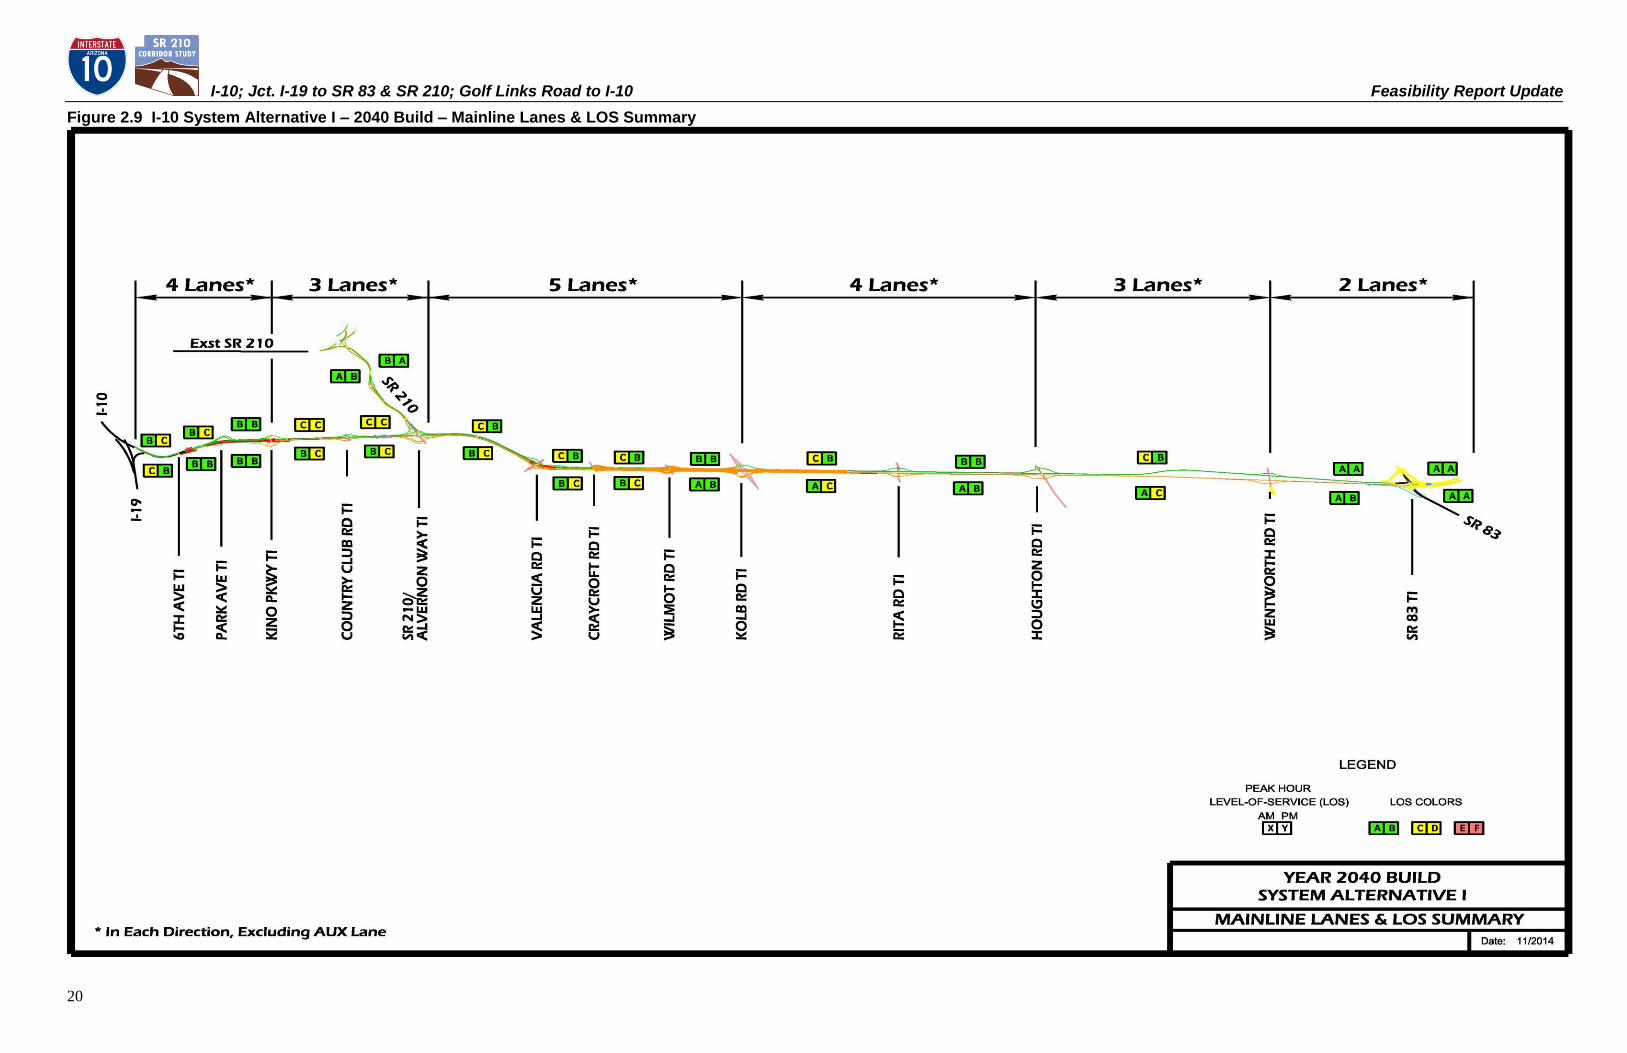
I-10; Jct. I-19 to SR 83 & SR 210; Golf Links Road to I-10 Feasibility Report Update
20
Figure 2.9 I-10 System Alternative I – 2040 Build – Mainline Lanes & LOS Summary
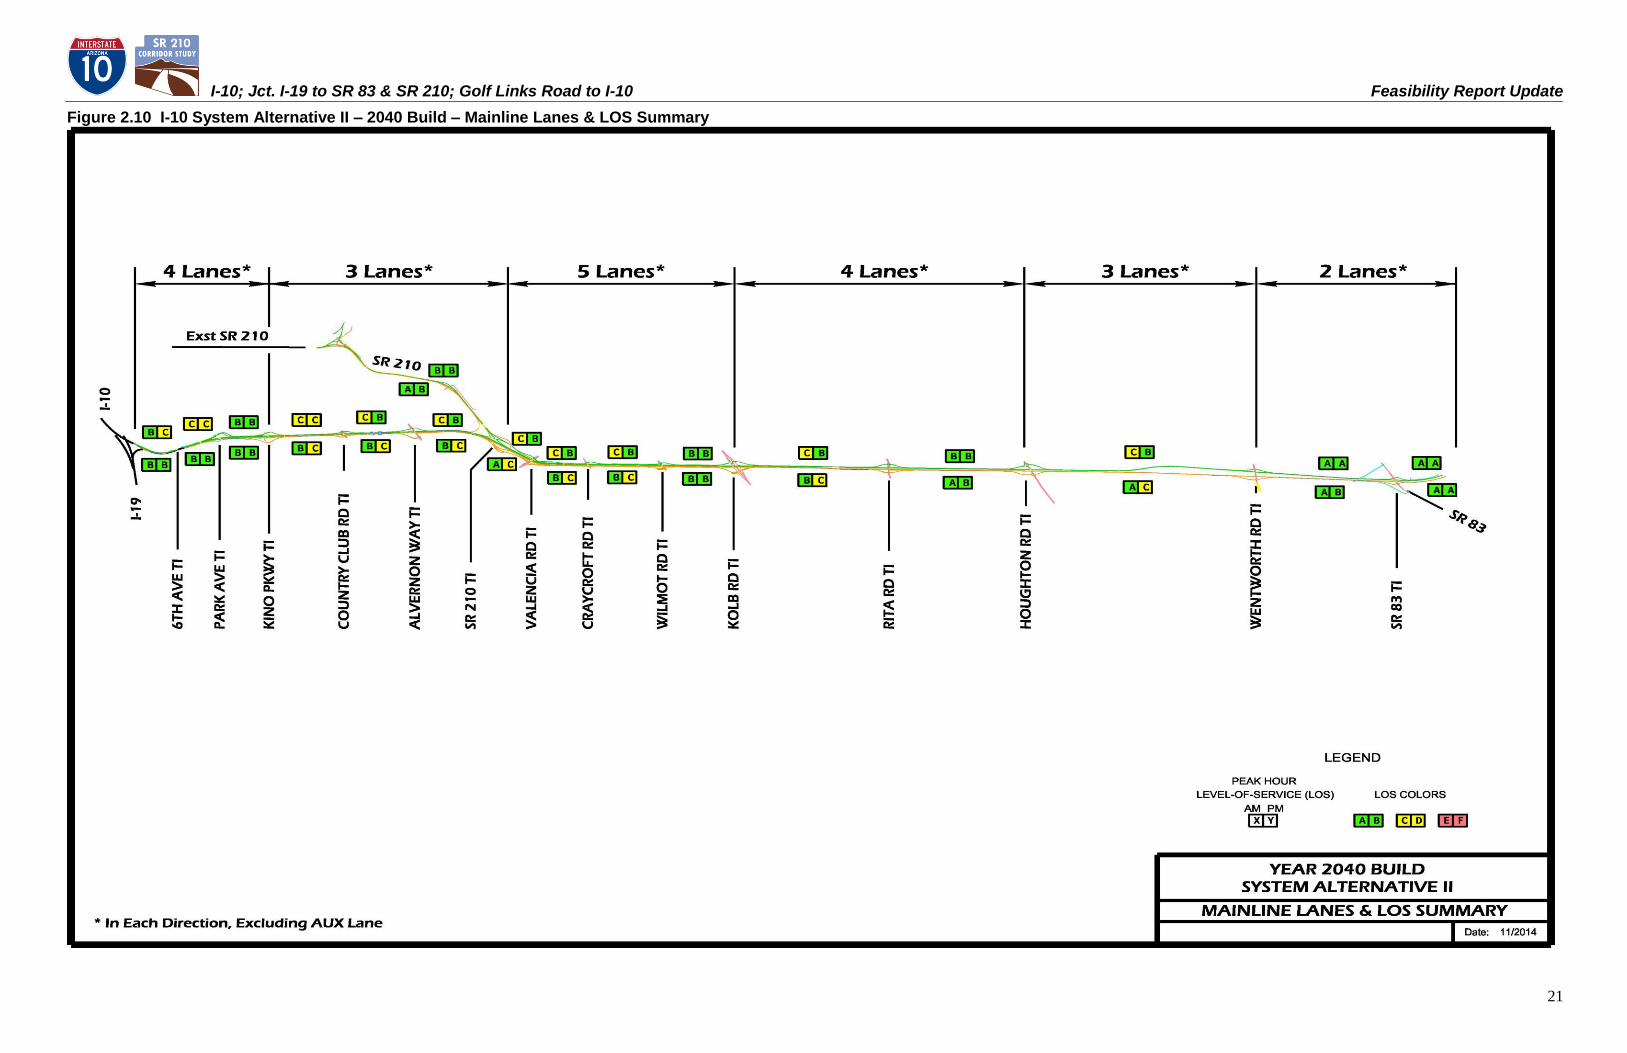
I-10; Jct. I-19 to SR 83 & SR 210; Golf Links Road to I-10 Feasibility Report Update
21
Figure 2.10 I-10 System Alternative II – 2040 Build – Mainline Lanes & LOS Summary
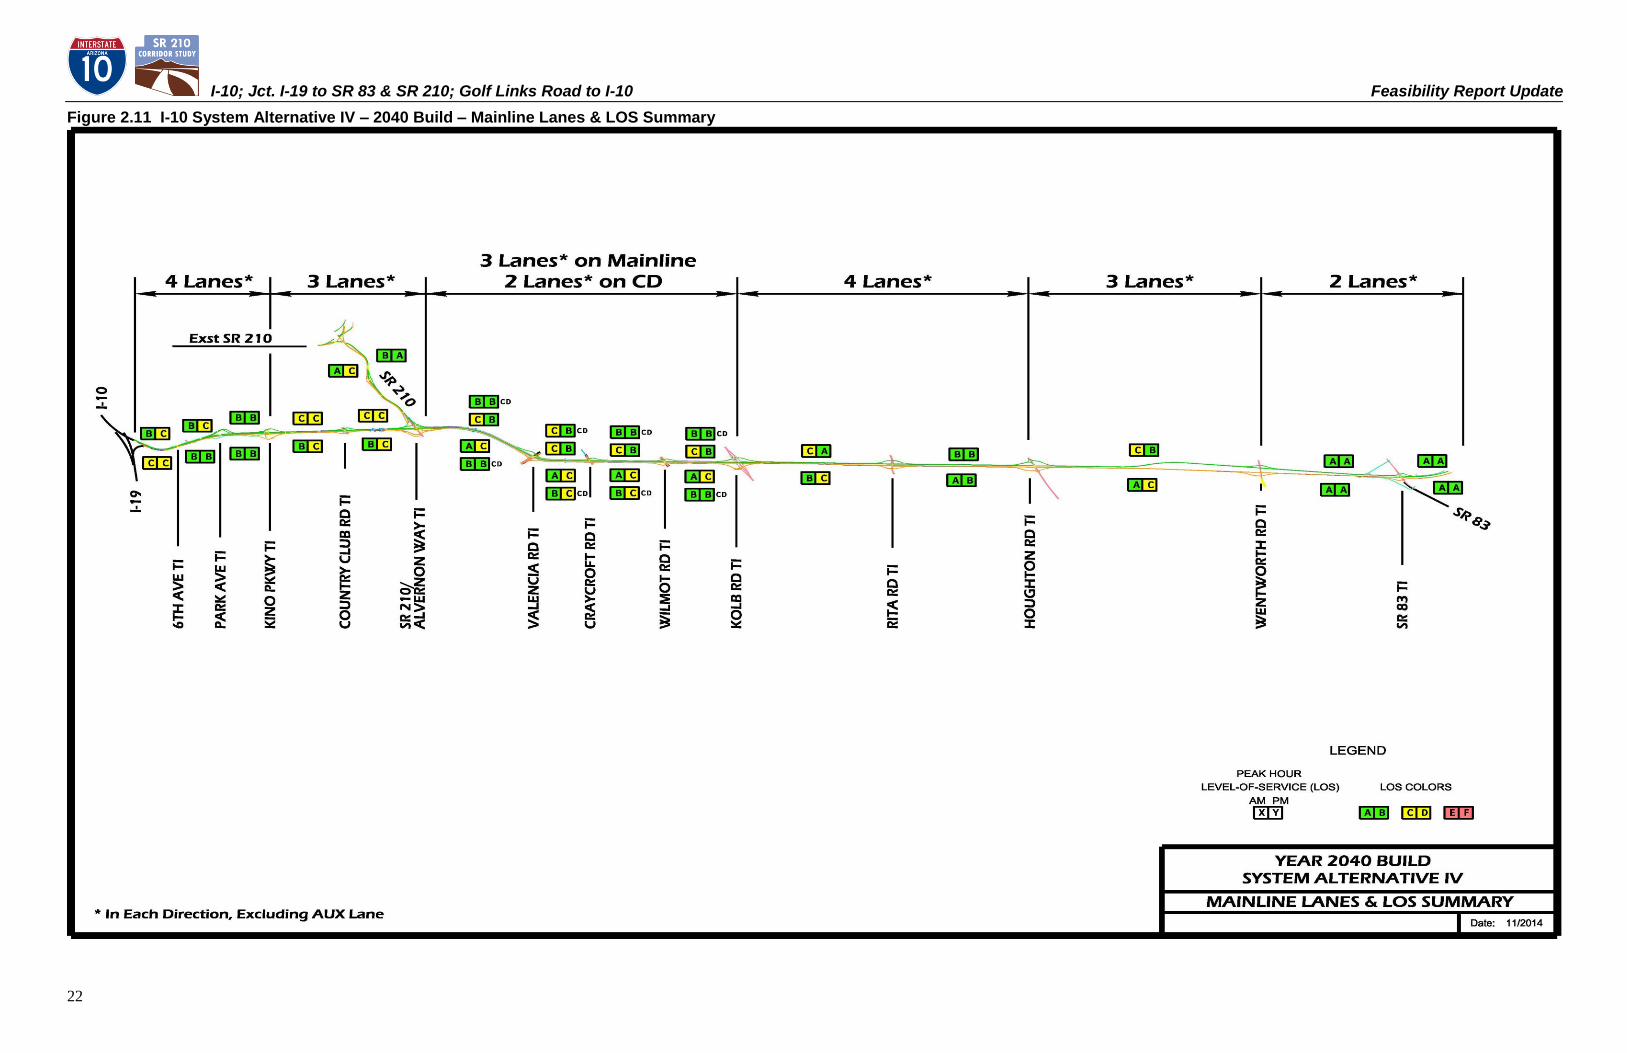
I-10; Jct. I-19 to SR 83 & SR 210; Golf Links Road to I-10 Feasibility Report Update
22
Figure 2.11 I-10 System Alternative IV – 2040 Build – Mainline Lanes & LOS Summary
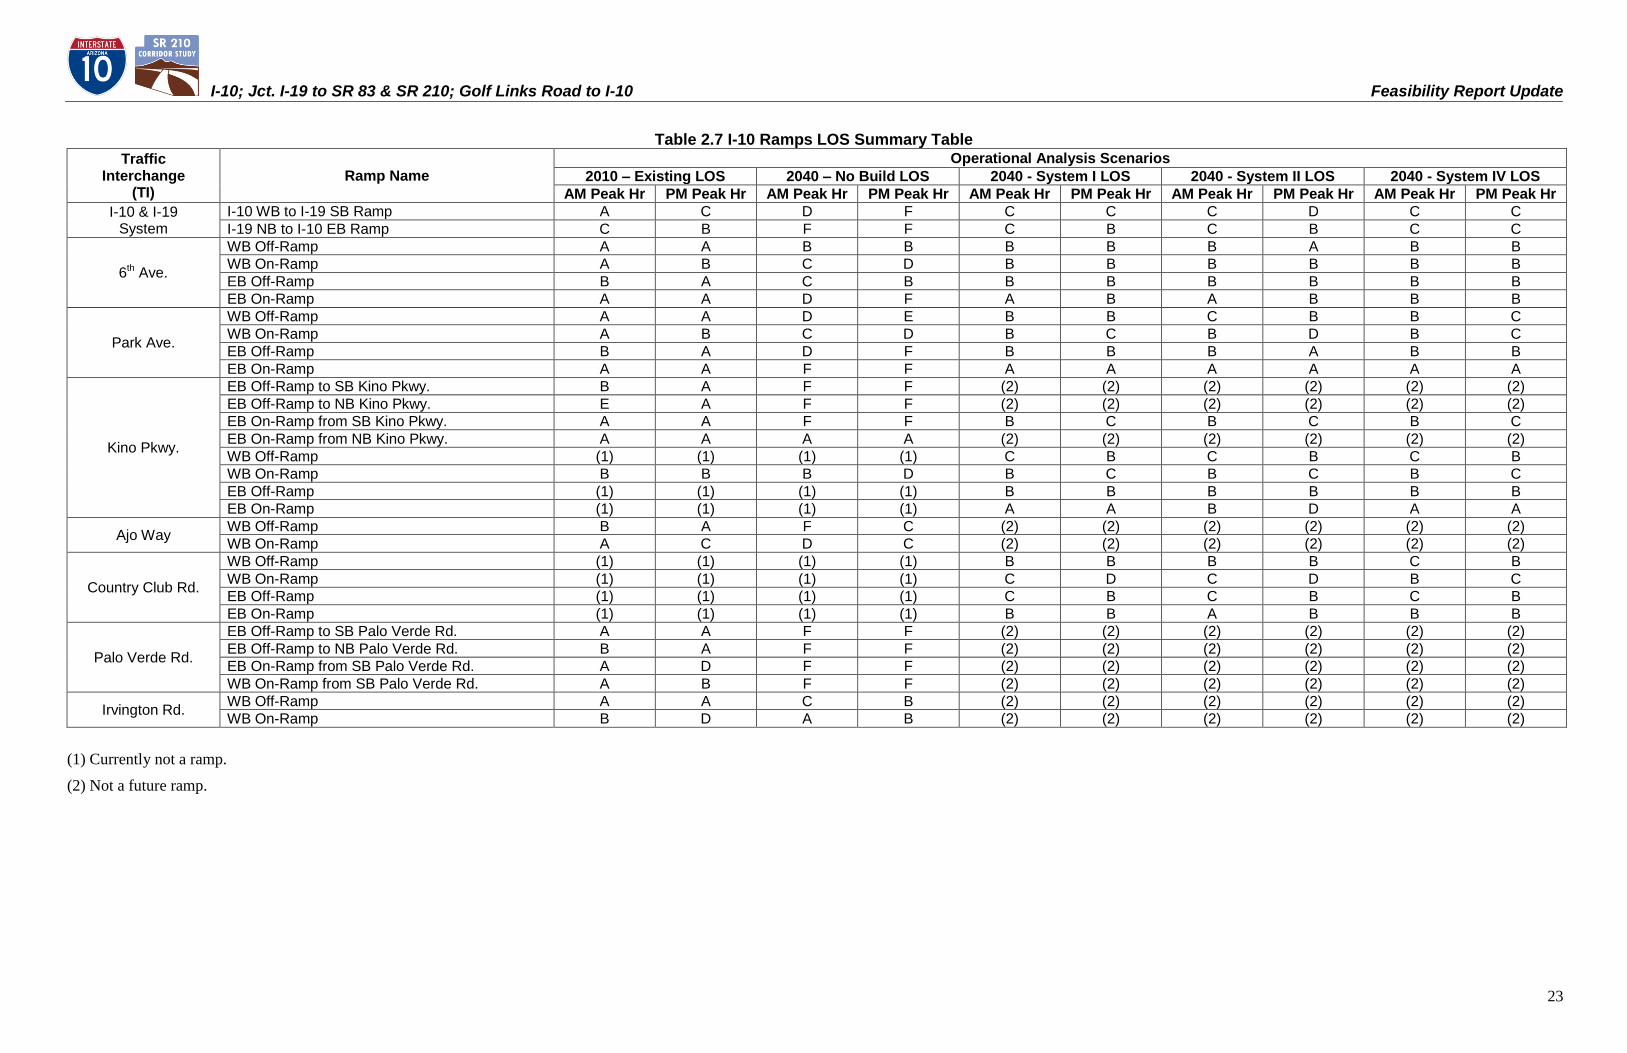
I-10; Jct. I-19 to SR 83 & SR 210; Golf Links Road to I-10 Feasibility Report Update
23
Table 2.7 I-10 Ramps LOS Summary Table
Traffic Interchange
(TI) Ramp Name
Operational Analysis Scenarios 2010 – Existing LOS 2040 – No Build LOS 2040 - System I LOS 2040 - System II LOS 2040 - System IV LOS
AM Peak Hr PM Peak Hr AM Peak Hr PM Peak Hr AM Peak Hr PM Peak Hr AM Peak Hr PM Peak Hr AM Peak Hr PM Peak Hr I-10 & I-19
System
I-10 WB to I-19 SB Ramp A C D F C C C D C C
I-19 NB to I-10 EB Ramp C B F F C B C B C C
6th Ave.
WB Off-Ramp A A B B B B B A B B
WB On-Ramp A B C D B B B B B B
EB Off-Ramp B A C B B B B B B B
EB On-Ramp A A D F A B A B B B
Park Ave.
WB Off-Ramp A A D E B B C B B C
WB On-Ramp A B C D B C B D B C
EB Off-Ramp B A D F B B B A B B
EB On-Ramp A A F F A A A A A A
Kino Pkwy.
EB Off-Ramp to SB Kino Pkwy. B A F F (2) (2) (2) (2) (2) (2)
EB Off-Ramp to NB Kino Pkwy. E A F F (2) (2) (2) (2) (2) (2)
EB On-Ramp from SB Kino Pkwy. A A F F B C B C B C
EB On-Ramp from NB Kino Pkwy. A A A A (2) (2) (2) (2) (2) (2)
WB Off-Ramp (1) (1) (1) (1) C B C B C B
WB On-Ramp B B B D B C B C B C
EB Off-Ramp (1) (1) (1) (1) B B B B B B
EB On-Ramp (1) (1) (1) (1) A A B D A A
Ajo Way WB Off-Ramp B A F C (2) (2) (2) (2) (2) (2)
WB On-Ramp A C D C (2) (2) (2) (2) (2) (2)
Country Club Rd.
WB Off-Ramp (1) (1) (1) (1) B B B B C B
WB On-Ramp (1) (1) (1) (1) C D C D B C
EB Off-Ramp (1) (1) (1) (1) C B C B C B
EB On-Ramp (1) (1) (1) (1) B B A B B B
Palo Verde Rd.
EB Off-Ramp to SB Palo Verde Rd. A A F F (2) (2) (2) (2) (2) (2)
EB Off-Ramp to NB Palo Verde Rd. B A F F (2) (2) (2) (2) (2) (2)
EB On-Ramp from SB Palo Verde Rd. A D F F (2) (2) (2) (2) (2) (2)
WB On-Ramp from SB Palo Verde Rd. A B F F (2) (2) (2) (2) (2) (2)
Irvington Rd. WB Off-Ramp A A C B (2) (2) (2) (2) (2) (2)
WB On-Ramp B D A B (2) (2) (2) (2) (2) (2)
(1) Currently not a ramp.
(2) Not a future ramp.
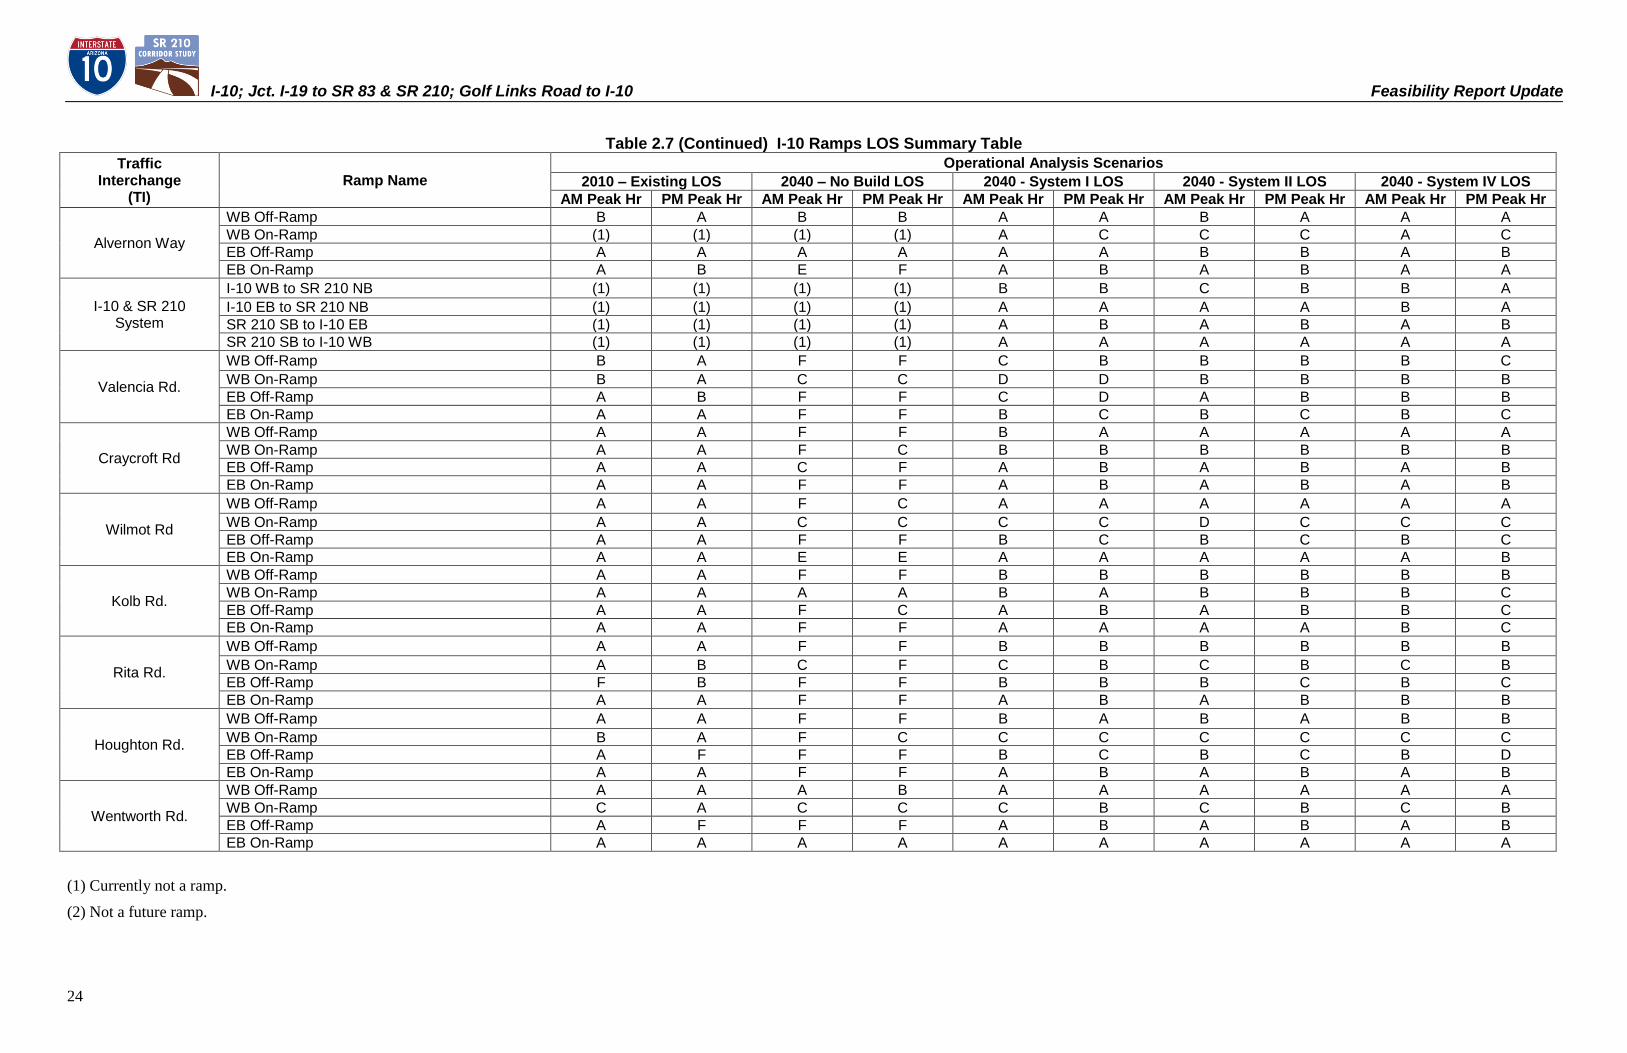
I-10; Jct. I-19 to SR 83 & SR 210; Golf Links Road to I-10 Feasibility Report Update
24
Table 2.7 (Continued) I-10 Ramps LOS Summary Table Traffic
Interchange (TI)
Ramp Name Operational Analysis Scenarios
2010 – Existing LOS 2040 – No Build LOS 2040 - System I LOS 2040 - System II LOS 2040 - System IV LOS AM Peak Hr PM Peak Hr AM Peak Hr PM Peak Hr AM Peak Hr PM Peak Hr AM Peak Hr PM Peak Hr AM Peak Hr PM Peak Hr
Alvernon Way
WB Off-Ramp B A B B A A B A A A
WB On-Ramp (1) (1) (1) (1) A C C C A C
EB Off-Ramp A A A A A A B B A B
EB On-Ramp A B E F A B A B A A
I-10 & SR 210 System
I-10 WB to SR 210 NB (1) (1) (1) (1) B B C B B A
I-10 EB to SR 210 NB (1) (1) (1) (1) A A A A B A
SR 210 SB to I-10 EB (1) (1) (1) (1) A B A B A B
SR 210 SB to I-10 WB (1) (1) (1) (1) A A A A A A
Valencia Rd.
WB Off-Ramp B A F F C B B B B C
WB On-Ramp B A C C D D B B B B
EB Off-Ramp A B F F C D A B B B
EB On-Ramp A A F F B C B C B C
Craycroft Rd
WB Off-Ramp A A F F B A A A A A
WB On-Ramp A A F C B B B B B B
EB Off-Ramp A A C F A B A B A B
EB On-Ramp A A F F A B A B A B
Wilmot Rd
WB Off-Ramp A A F C A A A A A A
WB On-Ramp A A C C C C D C C C
EB Off-Ramp A A F F B C B C B C
EB On-Ramp A A E E A A A A A B
Kolb Rd.
WB Off-Ramp A A F F B B B B B B
WB On-Ramp A A A A B A B B B C
EB Off-Ramp A A F C A B A B B C
EB On-Ramp A A F F A A A A B C
Rita Rd.
WB Off-Ramp A A F F B B B B B B
WB On-Ramp A B C F C B C B C B
EB Off-Ramp F B F F B B B C B C
EB On-Ramp A A F F A B A B B B
Houghton Rd.
WB Off-Ramp A A F F B A B A B B
WB On-Ramp B A F C C C C C C C
EB Off-Ramp A F F F B C B C B D
EB On-Ramp A A F F A B A B A B
Wentworth Rd.
WB Off-Ramp A A A B A A A A A A
WB On-Ramp C A C C C B C B C B
EB Off-Ramp A F F F A B A B A B
EB On-Ramp A A A A A A A A A A
(1) Currently not a ramp.
(2) Not a future ramp.
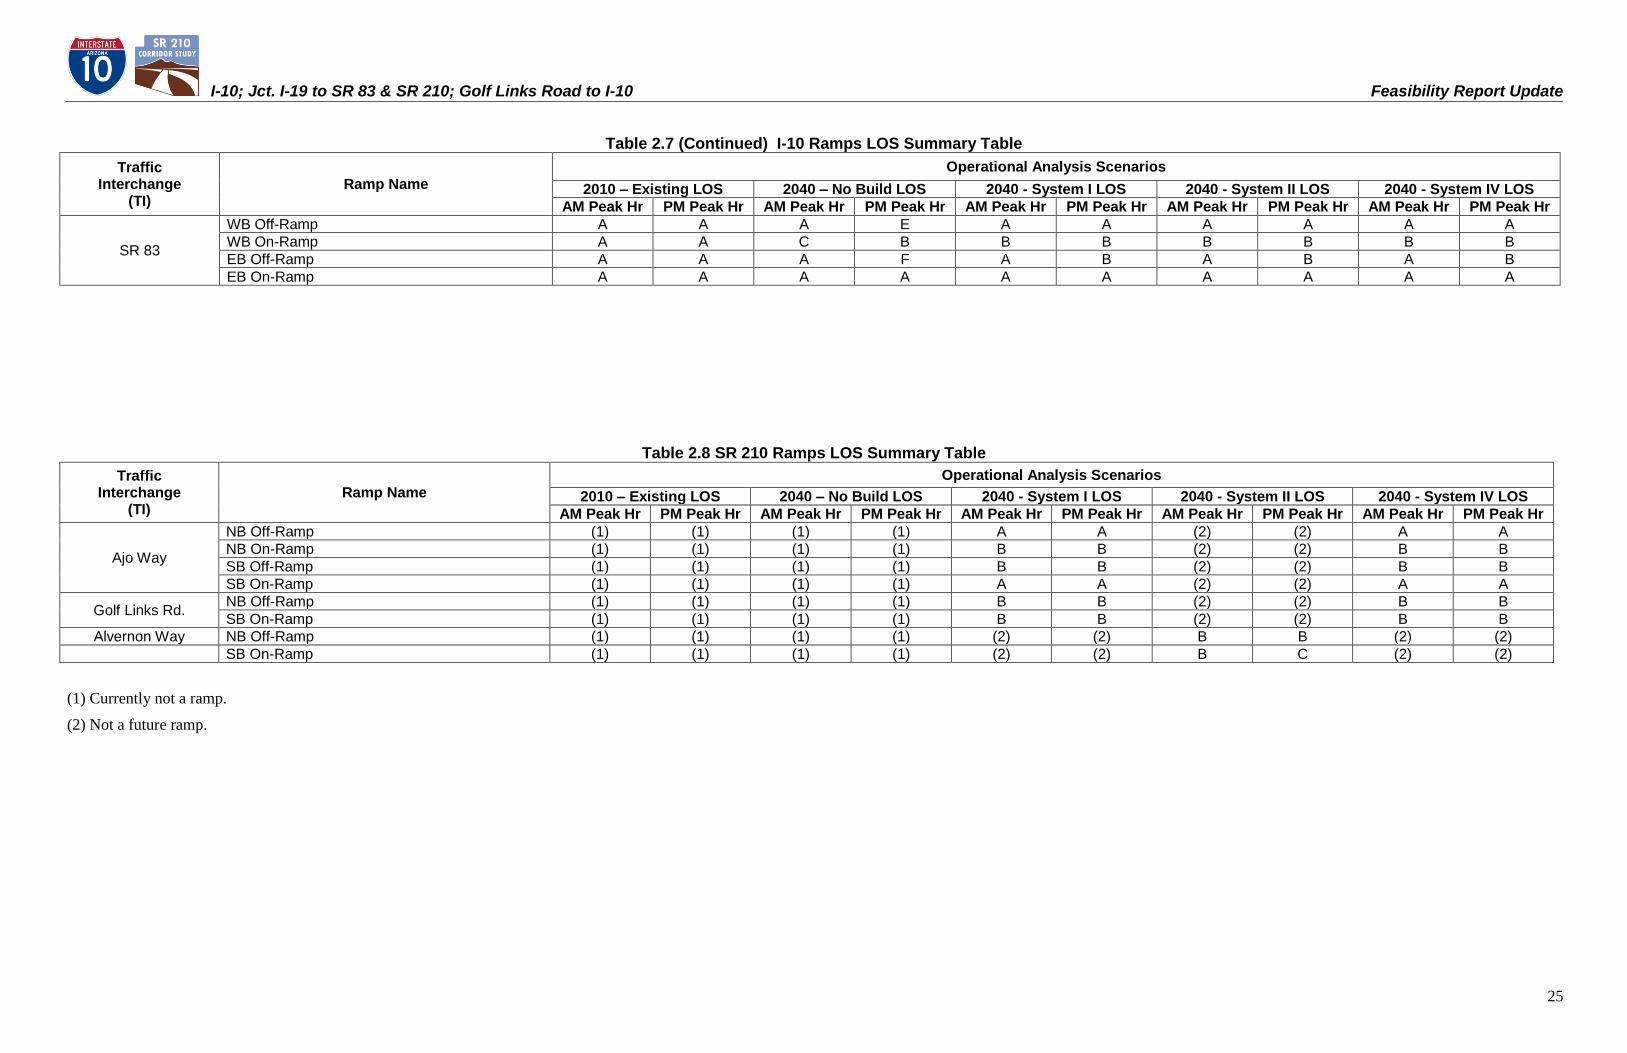
I-10; Jct. I-19 to SR 83 & SR 210; Golf Links Road to I-10 Feasibility Report Update
25
Table 2.7 (Continued) I-10 Ramps LOS Summary Table Traffic
Interchange (TI)
Ramp Name Operational Analysis Scenarios
2010 – Existing LOS 2040 – No Build LOS 2040 - System I LOS 2040 - System II LOS 2040 - System IV LOS AM Peak Hr PM Peak Hr AM Peak Hr PM Peak Hr AM Peak Hr PM Peak Hr AM Peak Hr PM Peak Hr AM Peak Hr PM Peak Hr
SR 83
WB Off-Ramp A A A E A A A A A A
WB On-Ramp A A C B B B B B B B
EB Off-Ramp A A A F A B A B A B
EB On-Ramp A A A A A A A A A A
Table 2.8 SR 210 Ramps LOS Summary Table Traffic
Interchange (TI)
Ramp Name Operational Analysis Scenarios
2010 – Existing LOS 2040 – No Build LOS 2040 - System I LOS 2040 - System II LOS 2040 - System IV LOS AM Peak Hr PM Peak Hr AM Peak Hr PM Peak Hr AM Peak Hr PM Peak Hr AM Peak Hr PM Peak Hr AM Peak Hr PM Peak Hr
Ajo Way
NB Off-Ramp (1) (1) (1) (1) A A (2) (2) A A
NB On-Ramp (1) (1) (1) (1) B B (2) (2) B B
SB Off-Ramp (1) (1) (1) (1) B B (2) (2) B B
SB On-Ramp (1) (1) (1) (1) A A (2) (2) A A
Golf Links Rd. NB Off-Ramp (1) (1) (1) (1) B B (2) (2) B B
SB On-Ramp (1) (1) (1) (1) B B (2) (2) B B
Alvernon Way NB Off-Ramp (1) (1) (1) (1) (2) (2) B B (2) (2)
SB On-Ramp (1) (1) (1) (1) (2) (2) B C (2) (2)
(1) Currently not a ramp.
(2) Not a future ramp.
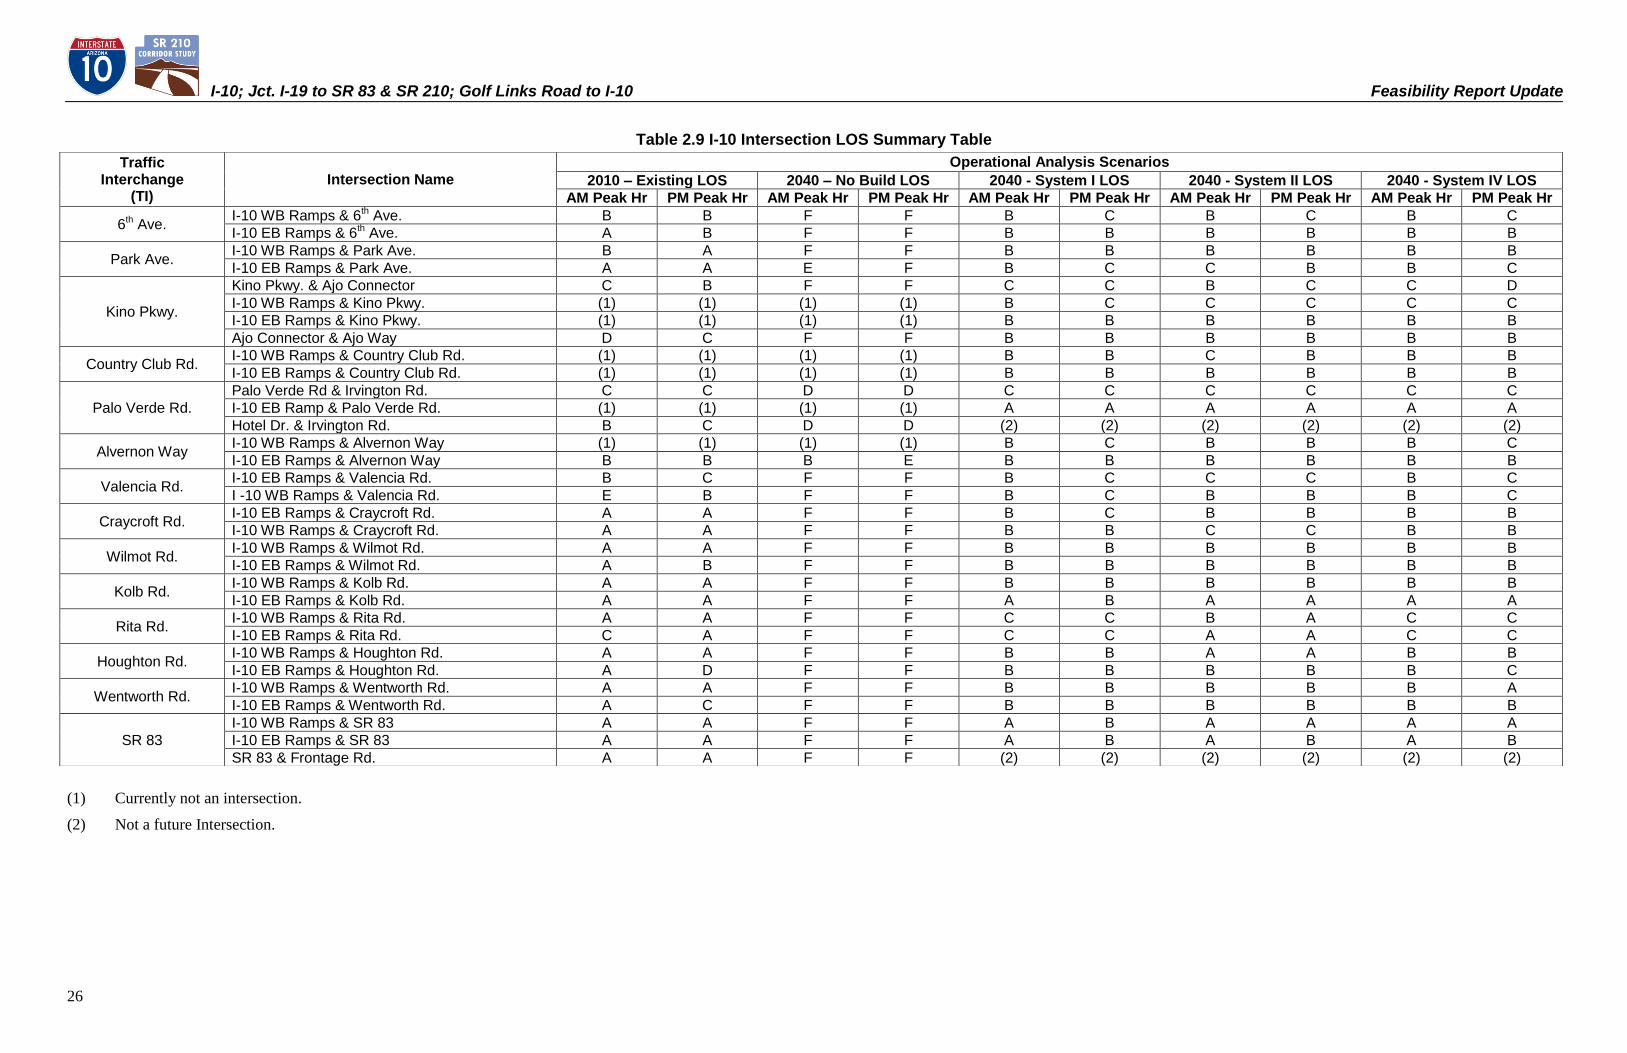
I-10; Jct. I-19 to SR 83 & SR 210; Golf Links Road to I-10 Feasibility Report Update
26
Table 2.9 I-10 Intersection LOS Summary Table
(1) Currently not an intersection.
(2) Not a future Intersection.
Traffic Interchange
(TI) Intersection Name
Operational Analysis Scenarios 2010 – Existing LOS 2040 – No Build LOS 2040 - System I LOS 2040 - System II LOS 2040 - System IV LOS
AM Peak Hr PM Peak Hr AM Peak Hr PM Peak Hr AM Peak Hr PM Peak Hr AM Peak Hr PM Peak Hr AM Peak Hr PM Peak Hr
6th Ave. I-10 WB Ramps & 6th Ave. B B F F B C B C B C
I-10 EB Ramps & 6th Ave. A B F F B B B B B B
Park Ave. I-10 WB Ramps & Park Ave. B A F F B B B B B B
I-10 EB Ramps & Park Ave. A A E F B C C B B C
Kino Pkwy.
Kino Pkwy. & Ajo Connector C B F F C C B C C D
I-10 WB Ramps & Kino Pkwy. (1) (1) (1) (1) B C C C C C
I-10 EB Ramps & Kino Pkwy. (1) (1) (1) (1) B B B B B B
Ajo Connector & Ajo Way D C F F B B B B B B
Country Club Rd. I-10 WB Ramps & Country Club Rd. (1) (1) (1) (1) B B C B B B
I-10 EB Ramps & Country Club Rd. (1) (1) (1) (1) B B B B B B
Palo Verde Rd.
Palo Verde Rd & Irvington Rd. C C D D C C C C C C
I-10 EB Ramp & Palo Verde Rd. (1) (1) (1) (1) A A A A A A
Hotel Dr. & Irvington Rd. B C D D (2) (2) (2) (2) (2) (2)
Alvernon Way I-10 WB Ramps & Alvernon Way (1) (1) (1) (1) B C B B B C
I-10 EB Ramps & Alvernon Way B B B E B B B B B B
Valencia Rd. I-10 EB Ramps & Valencia Rd. B C F F B C C C B C
I -10 WB Ramps & Valencia Rd. E B F F B C B B B C
Craycroft Rd. I-10 EB Ramps & Craycroft Rd. A A F F B C B B B B
I-10 WB Ramps & Craycroft Rd. A A F F B B C C B B
Wilmot Rd. I-10 WB Ramps & Wilmot Rd. A A F F B B B B B B
I-10 EB Ramps & Wilmot Rd. A B F F B B B B B B
Kolb Rd. I-10 WB Ramps & Kolb Rd. A A F F B B B B B B
I-10 EB Ramps & Kolb Rd. A A F F A B A A A A
Rita Rd. I-10 WB Ramps & Rita Rd. A A F F C C B A C C
I-10 EB Ramps & Rita Rd. C A F F C C A A C C
Houghton Rd. I-10 WB Ramps & Houghton Rd. A A F F B B A A B B
I-10 EB Ramps & Houghton Rd. A D F F B B B B B C
Wentworth Rd. I-10 WB Ramps & Wentworth Rd. A A F F B B B B B A
I-10 EB Ramps & Wentworth Rd. A C F F B B B B B B
SR 83
I-10 WB Ramps & SR 83 A A F F A B A A A A
I-10 EB Ramps & SR 83 A A F F A B A B A B
SR 83 & Frontage Rd. A A F F (2) (2) (2) (2) (2) (2)
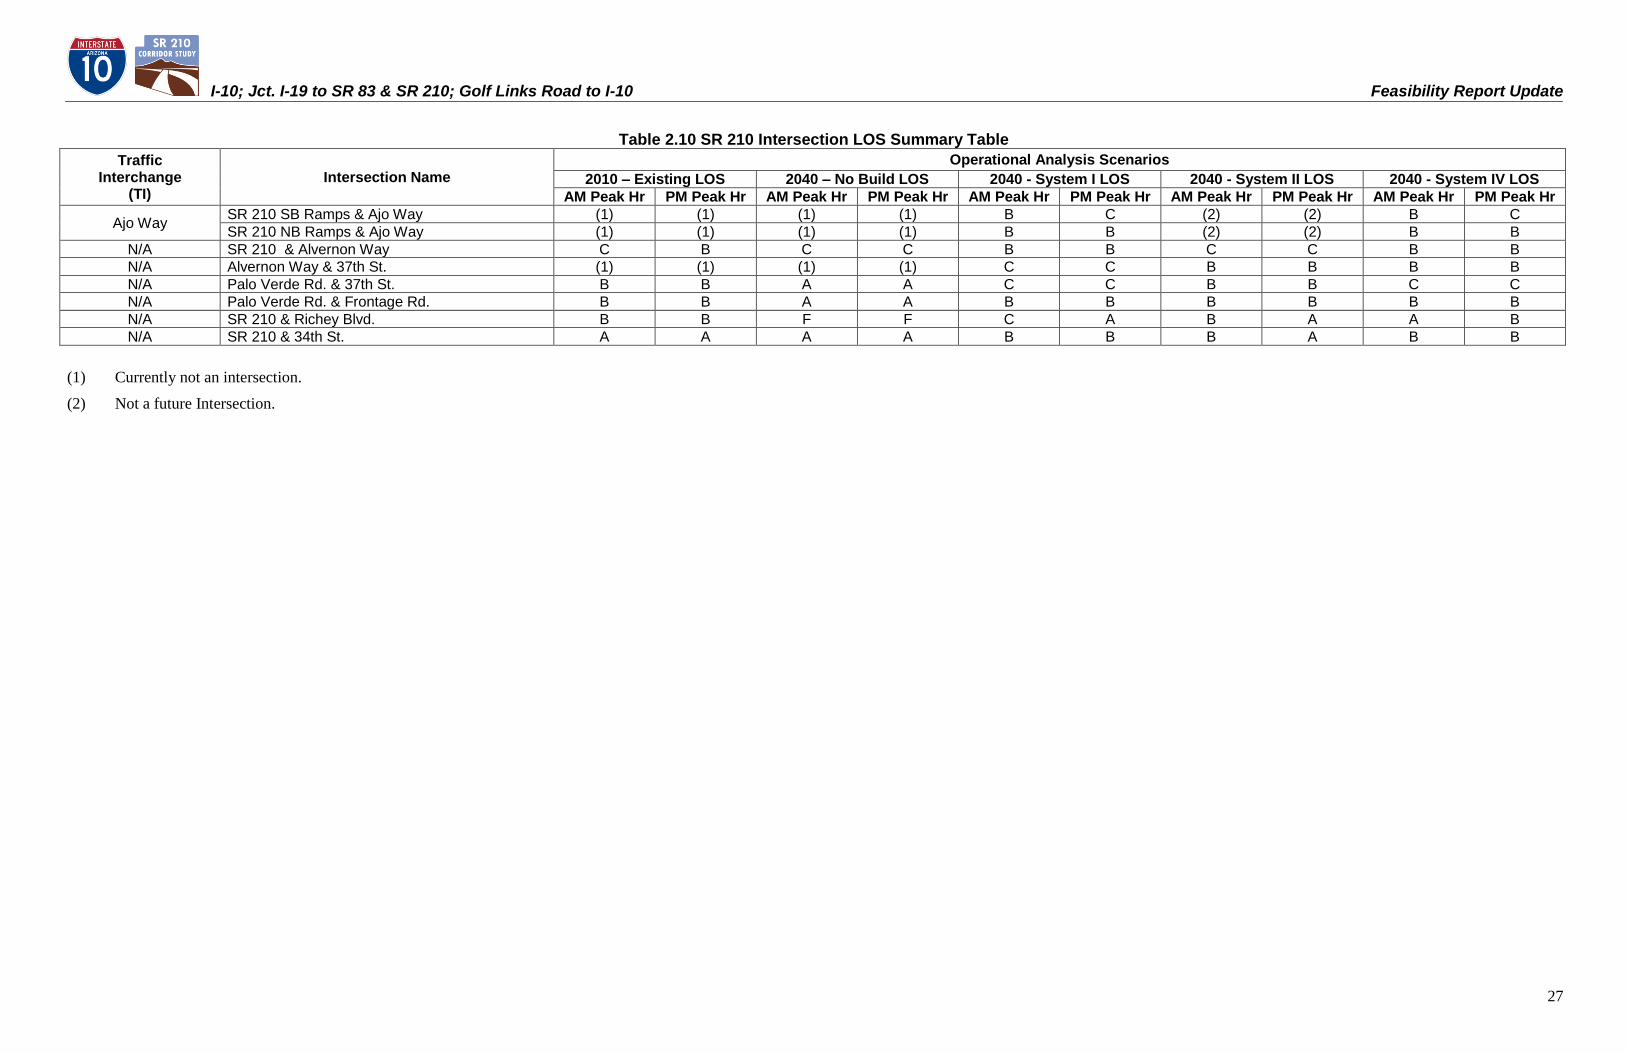
I-10; Jct. I-19 to SR 83 & SR 210; Golf Links Road to I-10 Feasibility Report Update
27
Table 2.10 SR 210 Intersection LOS Summary Table
Traffic Interchange
(TI) Intersection Name
Operational Analysis Scenarios 2010 – Existing LOS 2040 – No Build LOS 2040 - System I LOS 2040 - System II LOS 2040 - System IV LOS
AM Peak Hr PM Peak Hr AM Peak Hr PM Peak Hr AM Peak Hr PM Peak Hr AM Peak Hr PM Peak Hr AM Peak Hr PM Peak Hr
Ajo Way SR 210 SB Ramps & Ajo Way (1) (1) (1) (1) B C (2) (2) B C
SR 210 NB Ramps & Ajo Way (1) (1) (1) (1) B B (2) (2) B B
N/A SR 210 & Alvernon Way C B C C B B C C B B
N/A Alvernon Way & 37th St. (1) (1) (1) (1) C C B B B B
N/A Palo Verde Rd. & 37th St. B B A A C C B B C C
N/A Palo Verde Rd. & Frontage Rd. B B A A B B B B B B
N/A SR 210 & Richey Blvd. B B F F C A B A A B
N/A SR 210 & 34th St. A A A A B B B A B B
(1) Currently not an intersection.
(2) Not a future Intersection.
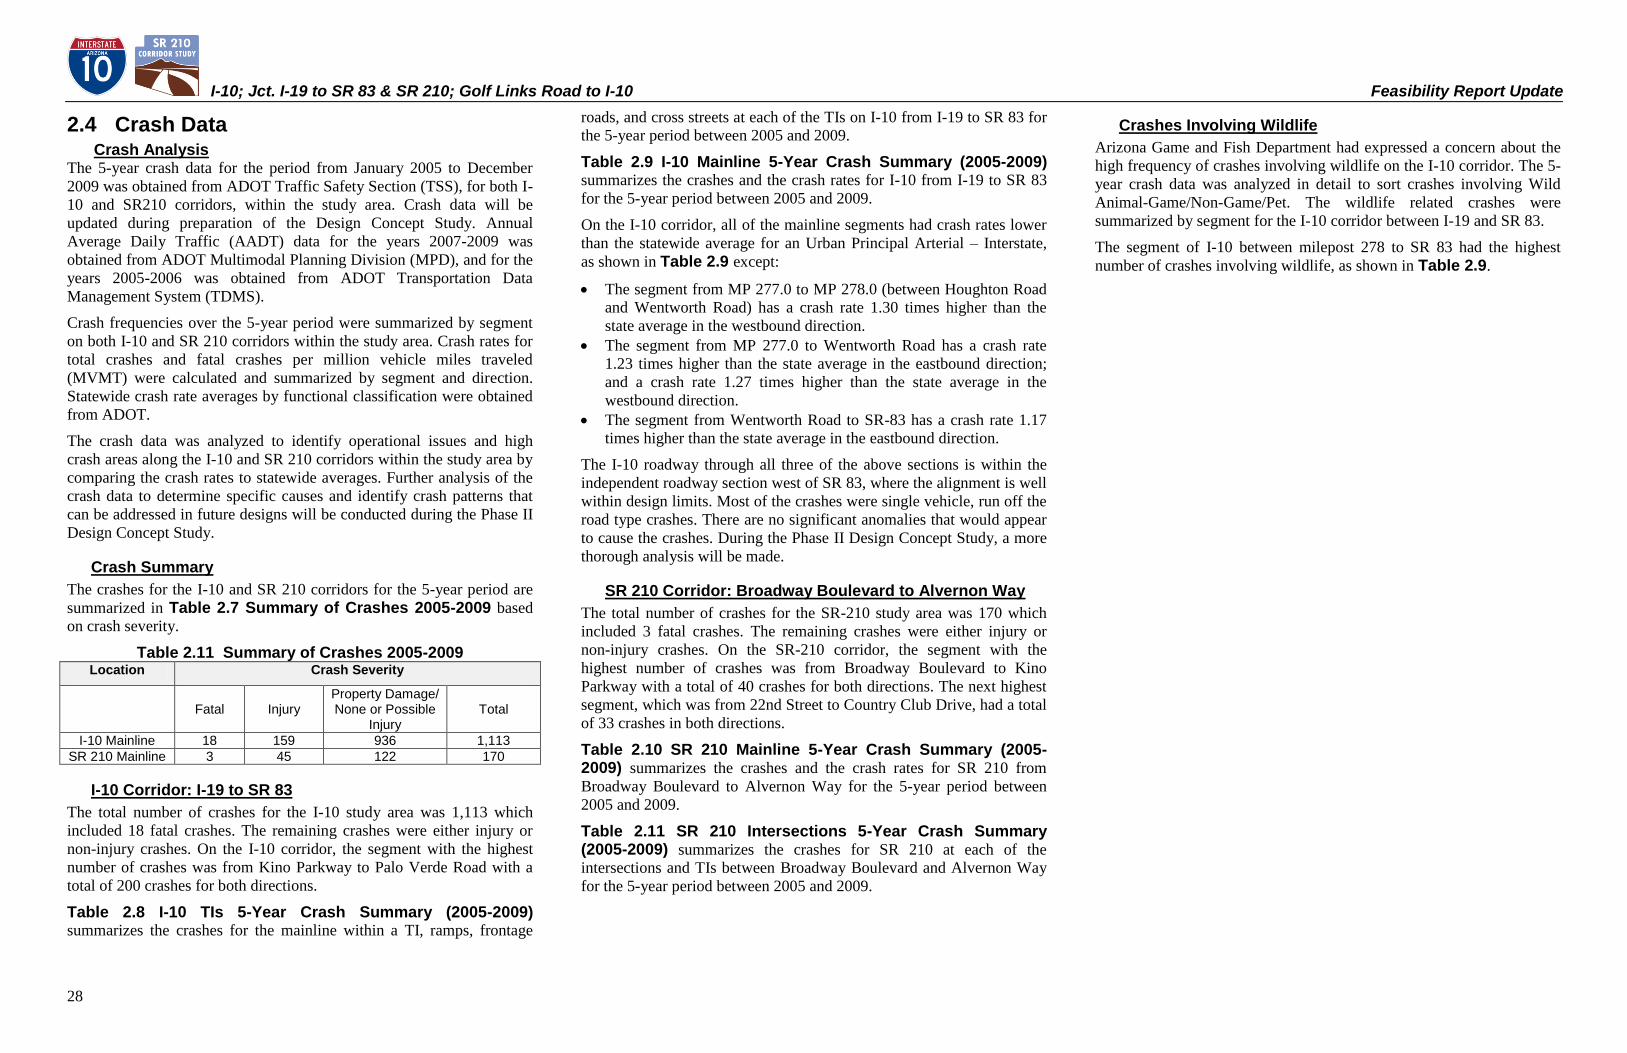
I-10; Jct. I-19 to SR 83 & SR 210; Golf Links Road to I-10 Feasibility Report Update
28
2.4 Crash Data Crash Analysis The 5-year crash data for the period from January 2005 to December
2009 was obtained from ADOT Traffic Safety Section (TSS), for both I-
10 and SR210 corridors, within the study area. Crash data will be
updated during preparation of the Design Concept Study. Annual
Average Daily Traffic (AADT) data for the years 2007-2009 was
obtained from ADOT Multimodal Planning Division (MPD), and for the
years 2005-2006 was obtained from ADOT Transportation Data
Management System (TDMS).
Crash frequencies over the 5-year period were summarized by segment
on both I-10 and SR 210 corridors within the study area. Crash rates for
total crashes and fatal crashes per million vehicle miles traveled
(MVMT) were calculated and summarized by segment and direction.
Statewide crash rate averages by functional classification were obtained
from ADOT.
The crash data was analyzed to identify operational issues and high
crash areas along the I-10 and SR 210 corridors within the study area by
comparing the crash rates to statewide averages. Further analysis of the
crash data to determine specific causes and identify crash patterns that
can be addressed in future designs will be conducted during the Phase II
Design Concept Study.
Crash Summary The crashes for the I-10 and SR 210 corridors for the 5-year period are
summarized in Table 2.7 Summary of Crashes 2005-2009 based
on crash severity.
Table 2.11 Summary of Crashes 2005-2009 Location Crash Severity
Fatal Injury Property Damage/ None or Possible
Injury Total
I-10 Mainline 18 159 936 1,113
SR 210 Mainline 3 45 122 170
I-10 Corridor: I-19 to SR 83 The total number of crashes for the I-10 study area was 1,113 which
included 18 fatal crashes. The remaining crashes were either injury or
non-injury crashes. On the I-10 corridor, the segment with the highest
number of crashes was from Kino Parkway to Palo Verde Road with a
total of 200 crashes for both directions.
Table 2.8 I-10 TIs 5-Year Crash Summary (2005-2009) summarizes the crashes for the mainline within a TI, ramps, frontage
roads, and cross streets at each of the TIs on I-10 from I-19 to SR 83 for
the 5-year period between 2005 and 2009.
Table 2.9 I-10 Mainline 5-Year Crash Summary (2005-2009) summarizes the crashes and the crash rates for I-10 from I-19 to SR 83
for the 5-year period between 2005 and 2009.
On the I-10 corridor, all of the mainline segments had crash rates lower
than the statewide average for an Urban Principal Arterial – Interstate,
as shown in Table 2.9 except:
The segment from MP 277.0 to MP 278.0 (between Houghton Road
and Wentworth Road) has a crash rate 1.30 times higher than the
state average in the westbound direction.
The segment from MP 277.0 to Wentworth Road has a crash rate
1.23 times higher than the state average in the eastbound direction;
and a crash rate 1.27 times higher than the state average in the
westbound direction.
The segment from Wentworth Road to SR-83 has a crash rate 1.17
times higher than the state average in the eastbound direction.
The I-10 roadway through all three of the above sections is within the
independent roadway section west of SR 83, where the alignment is well
within design limits. Most of the crashes were single vehicle, run off the
road type crashes. There are no significant anomalies that would appear
to cause the crashes. During the Phase II Design Concept Study, a more
thorough analysis will be made.
SR 210 Corridor: Broadway Boulevard to Alvernon Way The total number of crashes for the SR-210 study area was 170 which
included 3 fatal crashes. The remaining crashes were either injury or
non-injury crashes. On the SR-210 corridor, the segment with the
highest number of crashes was from Broadway Boulevard to Kino
Parkway with a total of 40 crashes for both directions. The next highest
segment, which was from 22nd Street to Country Club Drive, had a total
of 33 crashes in both directions.
Table 2.10 SR 210 Mainline 5-Year Crash Summary (2005-2009) summarizes the crashes and the crash rates for SR 210 from
Broadway Boulevard to Alvernon Way for the 5-year period between
2005 and 2009.
Table 2.11 SR 210 Intersections 5-Year Crash Summary (2005-2009) summarizes the crashes for SR 210 at each of the
intersections and TIs between Broadway Boulevard and Alvernon Way
for the 5-year period between 2005 and 2009.
Crashes Involving Wildlife Arizona Game and Fish Department had expressed a concern about the
high frequency of crashes involving wildlife on the I-10 corridor. The 5-
year crash data was analyzed in detail to sort crashes involving Wild
Animal-Game/Non-Game/Pet. The wildlife related crashes were
summarized by segment for the I-10 corridor between I-19 and SR 83.
The segment of I-10 between milepost 278 to SR 83 had the highest
number of crashes involving wildlife, as shown in Table 2.9.
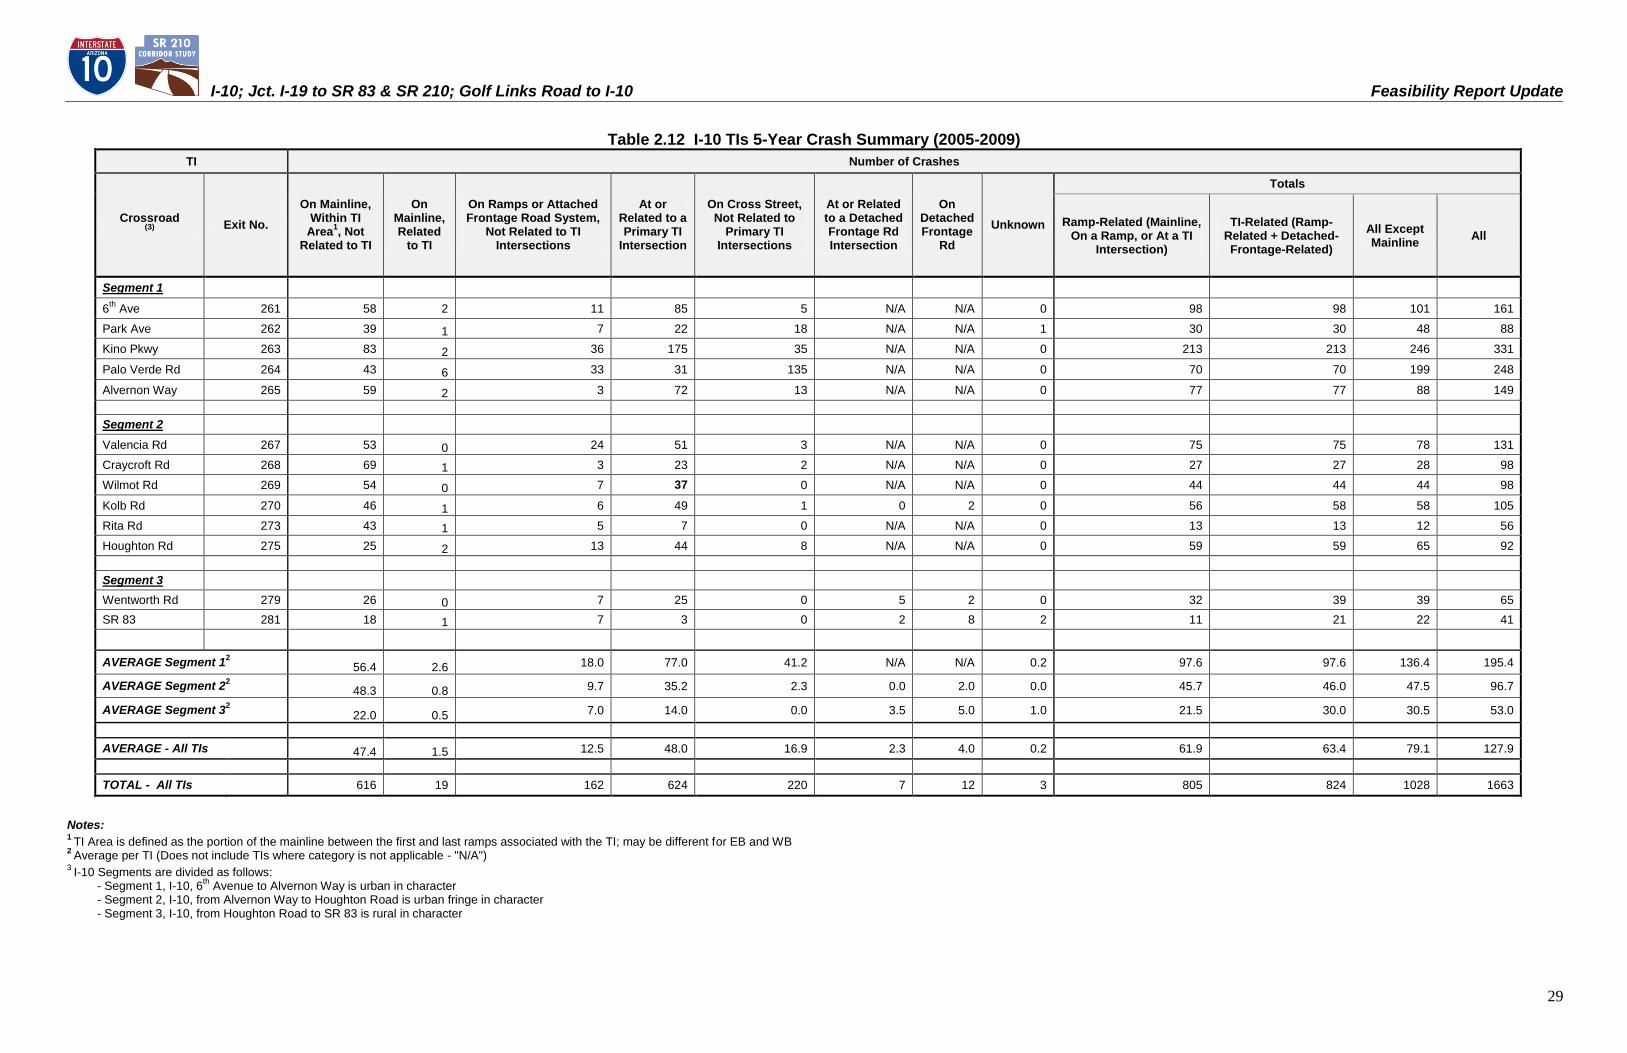
I-10; Jct. I-19 to SR 83 & SR 210; Golf Links Road to I-10 Feasibility Report Update
29
Table 2.12 I-10 TIs 5-Year Crash Summary (2005-2009)
TI Number of Crashes
Crossroad (3) Exit No.
On Mainline, Within TI
Area1, Not Related to TI
On Mainline, Related
to TI
On Ramps or Attached Frontage Road System,
Not Related to TI Intersections
At or Related to a Primary TI
Intersection
On Cross Street, Not Related to
Primary TI Intersections
At or Related to a Detached Frontage Rd Intersection
On Detached Frontage
Rd Unknown
Totals
Ramp-Related (Mainline, On a Ramp, or At a TI
Intersection)
TI-Related (Ramp-Related + Detached-Frontage-Related)
All Except Mainline All
Segment 1
6th
Ave 261 58 2 11 85 5 N/A N/A 0 98 98 101 161
Park Ave 262 39 1 7 22 18 N/A N/A 1 30 30 48 88
Kino Pkwy 263 83 2 36 175 35 N/A N/A 0 213 213 246 331
Palo Verde Rd 264 43 6 33 31 135 N/A N/A 0 70 70 199 248
Alvernon Way 265 59 2 3 72 13 N/A N/A 0 77 77 88 149
Segment 2
Valencia Rd 267 53 0 24 51 3 N/A N/A 0 75 75 78 131
Craycroft Rd 268 69 1 3 23 2 N/A N/A 0 27 27 28 98
Wilmot Rd 269 54 0 7 37 0 N/A N/A 0 44 44 44 98
Kolb Rd 270 46 1 6 49 1 0 2 0 56 58 58 105
Rita Rd 273 43 1 5 7 0 N/A N/A 0 13 13 12 56
Houghton Rd 275 25 2 13 44 8 N/A N/A 0 59 59 65 92
Segment 3
Wentworth Rd 279 26 0 7 25 0 5 2 0 32 39 39 65
SR 83 281 18 1 7 3 0 2 8 2 11 21 22 41
AVERAGE Segment 12 56.4 2.6 18.0 77.0 41.2 N/A N/A 0.2 97.6 97.6 136.4 195.4
AVERAGE Segment 22 48.3 0.8 9.7 35.2 2.3 0.0 2.0 0.0 45.7 46.0 47.5 96.7
AVERAGE Segment 32 22.0 0.5 7.0 14.0 0.0 3.5 5.0 1.0 21.5 30.0 30.5 53.0
AVERAGE - All TIs 47.4 1.5 12.5 48.0 16.9 2.3 4.0 0.2 61.9 63.4 79.1 127.9
TOTAL - All TIs 616 19 162 624 220 7 12 3 805 824 1028 1663
Notes: 1
TI Area is defined as the portion of the mainline between the first and last ramps associated with the TI; may be different for EB and WB 2
Average per TI (Does not include TIs where category is not applicable - "N/A") 3
I-10 Segments are divided as follows: - Segment 1, I-10, 6
th Avenue to Alvernon Way is urban in character
- Segment 2, I-10, from Alvernon Way to Houghton Road is urban fringe in character - Segment 3, I-10, from Houghton Road to SR 83 is rural in character
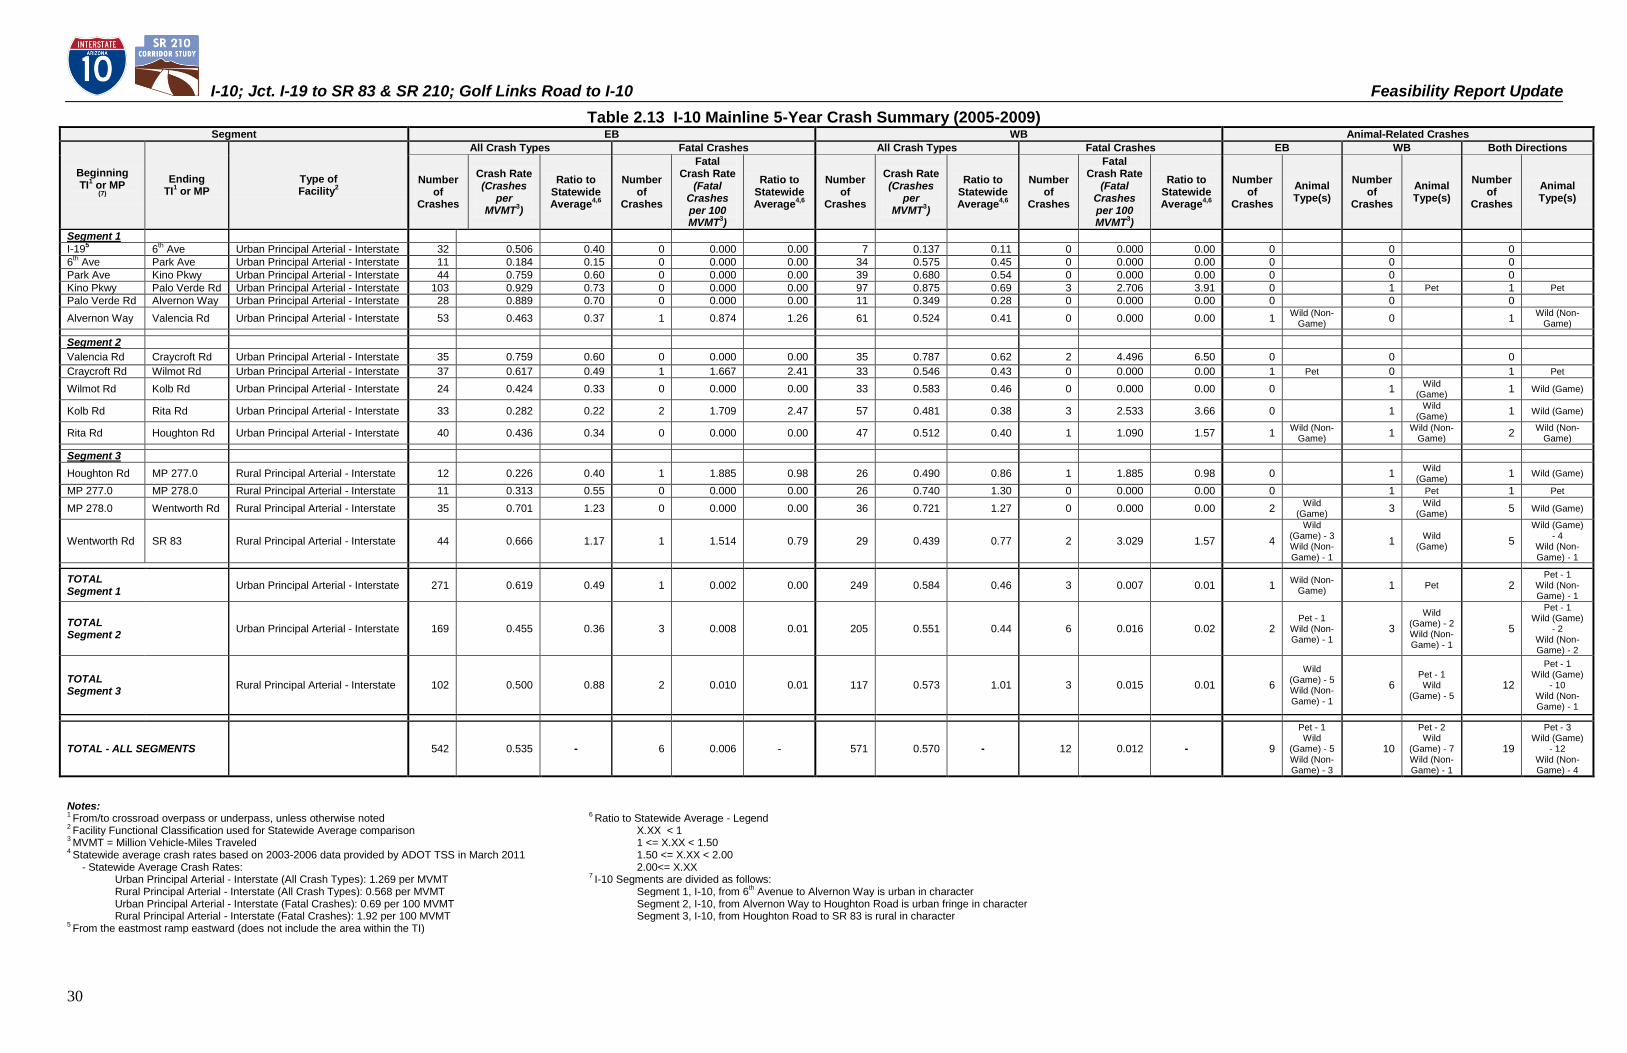
I-10; Jct. I-19 to SR 83 & SR 210; Golf Links Road to I-10 Feasibility Report Update
30
Table 2.13 I-10 Mainline 5-Year Crash Summary (2005-2009) Segment EB WB Animal-Related Crashes
Beginning TI1 or MP
(7) Ending
TI1 or MP Type of Facility2
All Crash Types Fatal Crashes All Crash Types Fatal Crashes EB WB Both Directions
Number of
Crashes
Crash Rate (Crashes
per MVMT
3)
Ratio to Statewide Average4,6
Number of
Crashes
Fatal Crash Rate
(Fatal Crashes per 100 MVMT
3)
Ratio to Statewide Average4,6
Number of
Crashes
Crash Rate (Crashes
per MVMT
3)
Ratio to Statewide Average4,6
Number of
Crashes
Fatal Crash Rate
(Fatal Crashes per 100 MVMT
3)
Ratio to Statewide Average4,6
Number of
Crashes Animal Type(s)
Number of
Crashes Animal Type(s)
Number of
Crashes Animal Type(s)
Segment 1
I-195 6
th Ave Urban Principal Arterial - Interstate 32 0.506 0.40 0 0.000 0.00 7 0.137 0.11 0 0.000 0.00 0 0 0
6th Ave Park Ave Urban Principal Arterial - Interstate 11 0.184 0.15 0 0.000 0.00 34 0.575 0.45 0 0.000 0.00 0 0 0
Park Ave Kino Pkwy Urban Principal Arterial - Interstate 44 0.759 0.60 0 0.000 0.00 39 0.680 0.54 0 0.000 0.00 0 0 0
Kino Pkwy Palo Verde Rd Urban Principal Arterial - Interstate 103 0.929 0.73 0 0.000 0.00 97 0.875 0.69 3 2.706 3.91 0 1 Pet 1 Pet
Palo Verde Rd Alvernon Way Urban Principal Arterial - Interstate 28 0.889 0.70 0 0.000 0.00 11 0.349 0.28 0 0.000 0.00 0 0 0
Alvernon Way Valencia Rd Urban Principal Arterial - Interstate 53 0.463 0.37 1 0.874 1.26 61 0.524 0.41 0 0.000 0.00 1 Wild (Non-
Game) 0 1
Wild (Non-Game)
Segment 2
Valencia Rd Craycroft Rd Urban Principal Arterial - Interstate 35 0.759 0.60 0 0.000 0.00 35 0.787 0.62 2 4.496 6.50 0 0 0
Craycroft Rd Wilmot Rd Urban Principal Arterial - Interstate 37 0.617 0.49 1 1.667 2.41 33 0.546 0.43 0 0.000 0.00 1 Pet 0 1 Pet
Wilmot Rd Kolb Rd Urban Principal Arterial - Interstate 24 0.424 0.33 0 0.000 0.00 33 0.583 0.46 0 0.000 0.00 0 1 Wild
(Game) 1 Wild (Game)
Kolb Rd Rita Rd Urban Principal Arterial - Interstate 33 0.282 0.22 2 1.709 2.47 57 0.481 0.38 3 2.533 3.66 0 1 Wild
(Game) 1 Wild (Game)
Rita Rd Houghton Rd Urban Principal Arterial - Interstate 40 0.436 0.34 0 0.000 0.00 47 0.512 0.40 1 1.090 1.57 1 Wild (Non-
Game) 1
Wild (Non-Game)
2 Wild (Non-
Game)
Segment 3
Houghton Rd MP 277.0 Rural Principal Arterial - Interstate 12 0.226 0.40 1 1.885 0.98 26 0.490 0.86 1 1.885 0.98 0 1 Wild
(Game) 1 Wild (Game)
MP 277.0 MP 278.0 Rural Principal Arterial - Interstate 11 0.313 0.55 0 0.000 0.00 26 0.740 1.30 0 0.000 0.00 0 1 Pet 1 Pet
MP 278.0 Wentworth Rd Rural Principal Arterial - Interstate 35 0.701 1.23 0 0.000 0.00 36 0.721 1.27 0 0.000 0.00 2 Wild
(Game) 3
Wild (Game)
5 Wild (Game)
Wentworth Rd SR 83 Rural Principal Arterial - Interstate 44 0.666 1.17 1 1.514 0.79 29 0.439 0.77 2 3.029 1.57 4
Wild (Game) - 3 Wild (Non-
Game) - 1
1 Wild
(Game) 5
Wild (Game) - 4
Wild (Non-
Game) - 1
TOTAL Segment 1
Urban Principal Arterial - Interstate 271 0.619 0.49 1 0.002 0.00 249 0.584 0.46 3 0.007 0.01 1 Wild (Non-
Game) 1 Pet 2
Pet - 1 Wild (Non-Game) - 1
TOTAL Segment 2
Urban Principal Arterial - Interstate 169 0.455 0.36 3 0.008 0.01 205 0.551 0.44 6 0.016 0.02 2 Pet - 1
Wild (Non-Game) - 1
3
Wild (Game) - 2 Wild (Non-Game) - 1
5
Pet - 1 Wild (Game)
- 2 Wild (Non-Game) - 2
TOTAL Segment 3
Rural Principal Arterial - Interstate 102 0.500 0.88 2 0.010 0.01 117 0.573 1.01 3 0.015 0.01 6
Wild (Game) - 5 Wild (Non-Game) - 1
6 Pet - 1 Wild
(Game) - 5 12
Pet - 1 Wild (Game)
- 10 Wild (Non-Game) - 1
TOTAL - ALL SEGMENTS 542 0.535 - 6 0.006 - 571 0.570 - 12 0.012 - 9
Pet - 1 Wild
(Game) - 5 Wild (Non-Game) - 3
10
Pet - 2 Wild
(Game) - 7 Wild (Non-Game) - 1
19
Pet - 3 Wild (Game)
- 12 Wild (Non-Game) - 4
Notes: 1 From/to crossroad overpass or underpass, unless otherwise noted
6 Ratio to Statewide Average - Legend
2 Facility Functional Classification used for Statewide Average comparison X.XX < 1
3 MVMT = Million Vehicle-Miles Traveled 1 <= X.XX < 1.50
4 Statewide average crash rates based on 2003-2006 data provided by ADOT TSS in March 2011 1.50 <= X.XX < 2.00
- Statewide Average Crash Rates: 2.00<= X.XX Urban Principal Arterial - Interstate (All Crash Types): 1.269 per MVMT
7 I-10 Segments are divided as follows:
Rural Principal Arterial - Interstate (All Crash Types): 0.568 per MVMT Segment 1, I-10, from 6th Avenue to Alvernon Way is urban in character
Urban Principal Arterial - Interstate (Fatal Crashes): 0.69 per 100 MVMT Segment 2, I-10, from Alvernon Way to Houghton Road is urban fringe in character Rural Principal Arterial - Interstate (Fatal Crashes): 1.92 per 100 MVMT Segment 3, I-10, from Houghton Road to SR 83 is rural in character 5 From the eastmost ramp eastward (does not include the area within the TI)
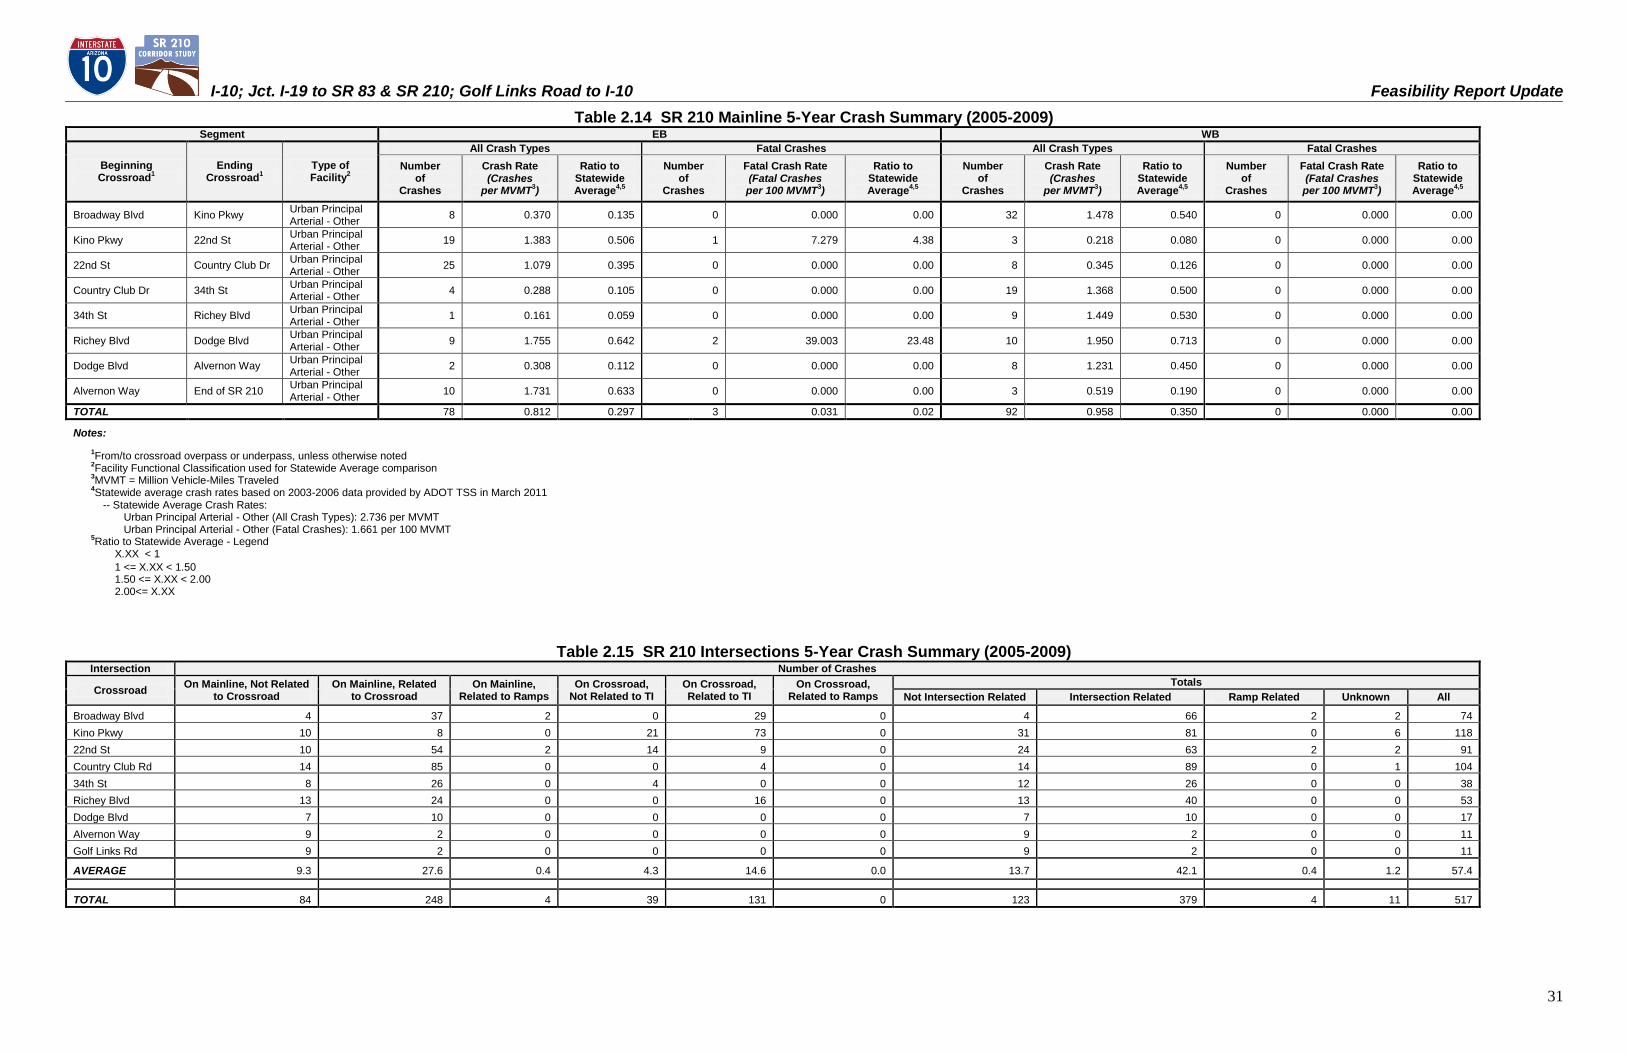
I-10; Jct. I-19 to SR 83 & SR 210; Golf Links Road to I-10 Feasibility Report Update
31
Table 2.14 SR 210 Mainline 5-Year Crash Summary (2005-2009) Segment EB WB
Beginning Crossroad1
Ending Crossroad1
Type of Facility2
All Crash Types Fatal Crashes All Crash Types Fatal Crashes Number
of Crashes
Crash Rate (Crashes
per MVMT3)
Ratio to Statewide Average4,5
Number of
Crashes
Fatal Crash Rate (Fatal Crashes per 100 MVMT
3)
Ratio to Statewide Average4,5
Number of
Crashes
Crash Rate (Crashes
per MVMT3)
Ratio to Statewide Average4,5
Number of
Crashes
Fatal Crash Rate (Fatal Crashes per 100 MVMT
3)
Ratio to Statewide Average4,5
Broadway Blvd Kino Pkwy Urban Principal Arterial - Other
8 0.370 0.135 0 0.000 0.00 32 1.478 0.540 0 0.000 0.00
Kino Pkwy 22nd St Urban Principal Arterial - Other
19 1.383 0.506 1 7.279 4.38 3 0.218 0.080 0 0.000 0.00
22nd St Country Club Dr Urban Principal Arterial - Other
25 1.079 0.395 0 0.000 0.00 8 0.345 0.126 0 0.000 0.00
Country Club Dr 34th St Urban Principal Arterial - Other
4 0.288 0.105 0 0.000 0.00 19 1.368 0.500 0 0.000 0.00
34th St Richey Blvd Urban Principal Arterial - Other
1 0.161 0.059 0 0.000 0.00 9 1.449 0.530 0 0.000 0.00
Richey Blvd Dodge Blvd Urban Principal Arterial - Other
9 1.755 0.642 2 39.003 23.48 10 1.950 0.713 0 0.000 0.00
Dodge Blvd Alvernon Way Urban Principal Arterial - Other
2 0.308 0.112 0 0.000 0.00 8 1.231 0.450 0 0.000 0.00
Alvernon Way End of SR 210 Urban Principal Arterial - Other
10 1.731 0.633 0 0.000 0.00 3 0.519 0.190 0 0.000 0.00
TOTAL 78 0.812 0.297 3 0.031 0.02 92 0.958 0.350 0 0.000 0.00
Notes:
1From/to crossroad overpass or underpass, unless otherwise noted
2Facility Functional Classification used for Statewide Average comparison
3MVMT = Million Vehicle-Miles Traveled
4Statewide average crash rates based on 2003-2006 data provided by ADOT TSS in March 2011
-- Statewide Average Crash Rates: Urban Principal Arterial - Other (All Crash Types): 2.736 per MVMT Urban Principal Arterial - Other (Fatal Crashes): 1.661 per 100 MVMT 5Ratio to Statewide Average - Legend
X.XX < 1
1 <= X.XX < 1.50 1.50 <= X.XX < 2.00 2.00<= X.XX
Table 2.15 SR 210 Intersections 5-Year Crash Summary (2005-2009) Intersection Number of Crashes
Crossroad On Mainline, Not Related to Crossroad
On Mainline, Related to Crossroad
On Mainline, Related to Ramps
On Crossroad, Not Related to TI
On Crossroad, Related to TI
On Crossroad, Related to Ramps
Totals Not Intersection Related Intersection Related Ramp Related Unknown All
Broadway Blvd 4 37 2 0 29 0 4 66 2 2 74
Kino Pkwy 10 8 0 21 73 0 31 81 0 6 118
22nd St 10 54 2 14 9 0 24 63 2 2 91
Country Club Rd 14 85 0 0 4 0 14 89 0 1 104
34th St 8 26 0 4 0 0 12 26 0 0 38
Richey Blvd 13 24 0 0 16 0 13 40 0 0 53
Dodge Blvd 7 10 0 0 0 0 7 10 0 0 17
Alvernon Way 9 2 0 0 0 0 9 2 0 0 11
Golf Links Rd 9 2 0 0 0 0 9 2 0 0 11
AVERAGE 9.3 27.6 0.4 4.3 14.6 0.0 13.7 42.1 0.4 1.2 57.4
TOTAL 84 248 4 39 131 0 123 379 4 11 517
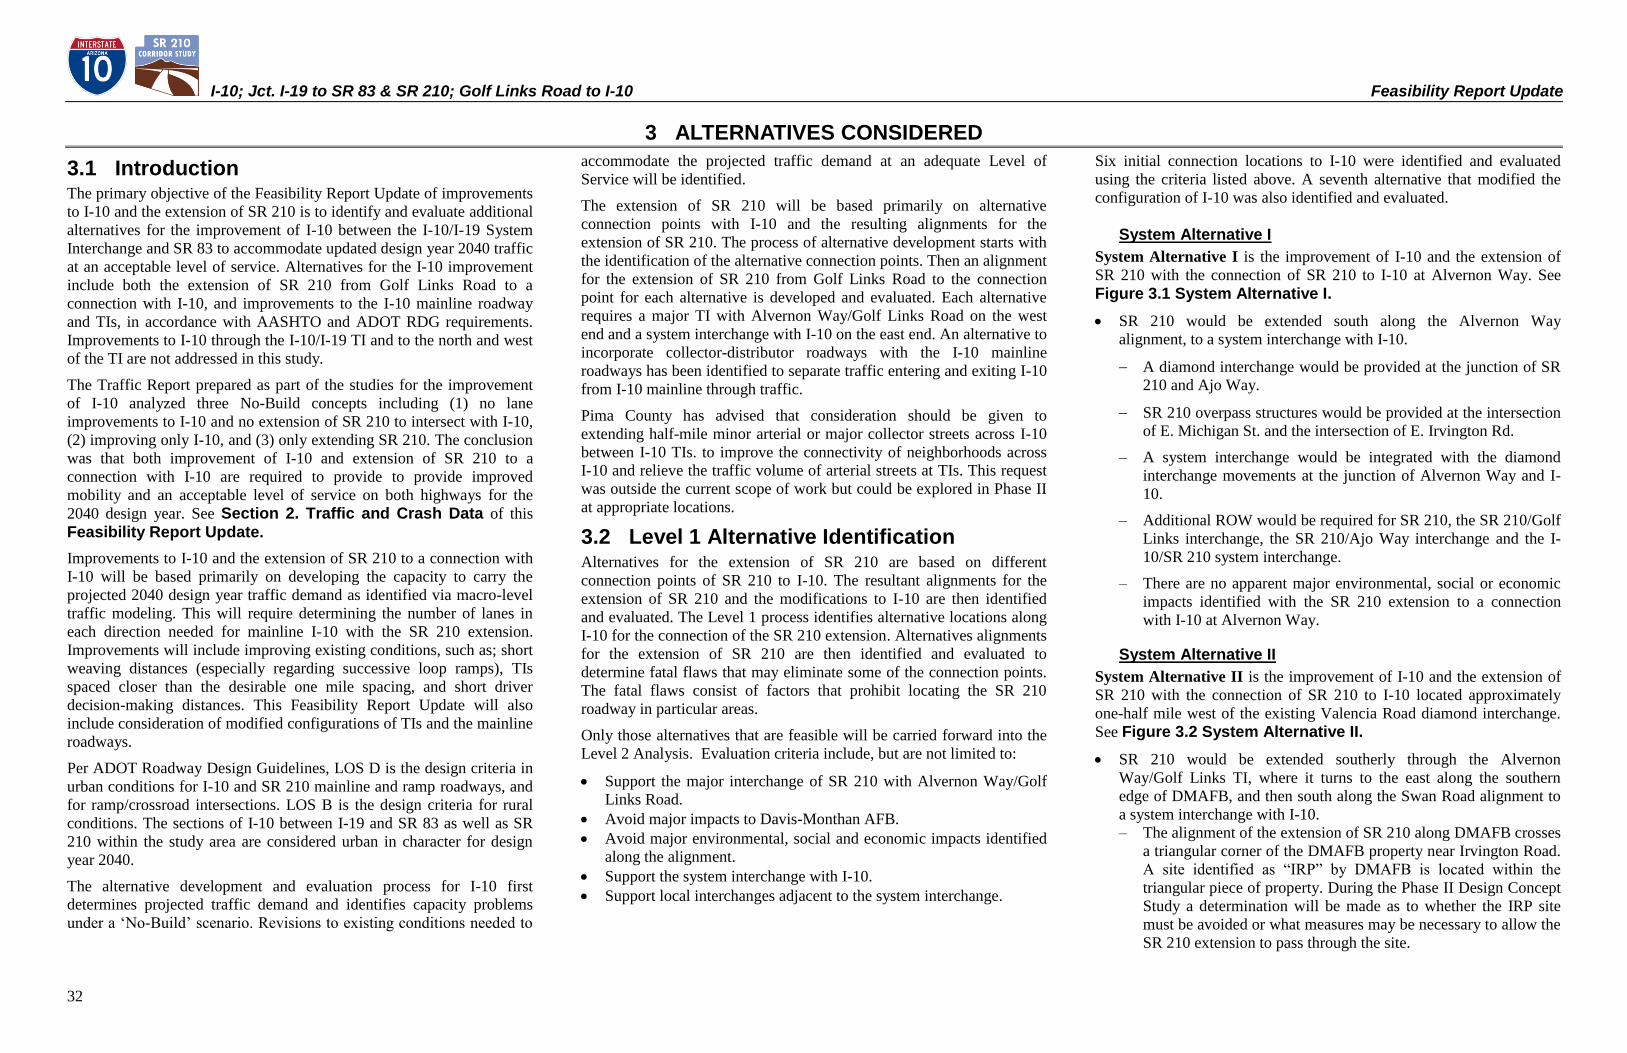
I-10; Jct. I-19 to SR 83 & SR 210; Golf Links Road to I-10 Feasibility Report Update
32
3 ALTERNATIVES CONSIDERED3.1 Introduction The primary objective of the Feasibility Report Update of improvements
to I-10 and the extension of SR 210 is to identify and evaluate additional
alternatives for the improvement of I-10 between the I-10/I-19 System
Interchange and SR 83 to accommodate updated design year 2040 traffic
at an acceptable level of service. Alternatives for the I-10 improvement
include both the extension of SR 210 from Golf Links Road to a
connection with I-10, and improvements to the I-10 mainline roadway
and TIs, in accordance with AASHTO and ADOT RDG requirements.
Improvements to I-10 through the I-10/I-19 TI and to the north and west
of the TI are not addressed in this study.
The Traffic Report prepared as part of the studies for the improvement
of I-10 analyzed three No-Build concepts including (1) no lane
improvements to I-10 and no extension of SR 210 to intersect with I-10,
(2) improving only I-10, and (3) only extending SR 210. The conclusion
was that both improvement of I-10 and extension of SR 210 to a
connection with I-10 are required to provide to provide improved
mobility and an acceptable level of service on both highways for the
2040 design year. See Section 2. Traffic and Crash Data of this
Feasibility Report Update.
Improvements to I-10 and the extension of SR 210 to a connection with
I-10 will be based primarily on developing the capacity to carry the
projected 2040 design year traffic demand as identified via macro-level
traffic modeling. This will require determining the number of lanes in
each direction needed for mainline I-10 with the SR 210 extension.
Improvements will include improving existing conditions, such as; short
weaving distances (especially regarding successive loop ramps), TIs
spaced closer than the desirable one mile spacing, and short driver
decision-making distances. This Feasibility Report Update will also
include consideration of modified configurations of TIs and the mainline
roadways.
Per ADOT Roadway Design Guidelines, LOS D is the design criteria in
urban conditions for I-10 and SR 210 mainline and ramp roadways, and
for ramp/crossroad intersections. LOS B is the design criteria for rural
conditions. The sections of I-10 between I-19 and SR 83 as well as SR
210 within the study area are considered urban in character for design
year 2040.
The alternative development and evaluation process for I-10 first
determines projected traffic demand and identifies capacity problems
under a „No-Build‟ scenario. Revisions to existing conditions needed to
accommodate the projected traffic demand at an adequate Level of
Service will be identified.
The extension of SR 210 will be based primarily on alternative
connection points with I-10 and the resulting alignments for the
extension of SR 210. The process of alternative development starts with
the identification of the alternative connection points. Then an alignment
for the extension of SR 210 from Golf Links Road to the connection
point for each alternative is developed and evaluated. Each alternative
requires a major TI with Alvernon Way/Golf Links Road on the west
end and a system interchange with I-10 on the east end. An alternative to
incorporate collector-distributor roadways with the I-10 mainline
roadways has been identified to separate traffic entering and exiting I-10
from I-10 mainline through traffic.
Pima County has advised that consideration should be given to
extending half-mile minor arterial or major collector streets across I-10
between I-10 TIs. to improve the connectivity of neighborhoods across
I-10 and relieve the traffic volume of arterial streets at TIs. This request
was outside the current scope of work but could be explored in Phase II
at appropriate locations.
3.2 Level 1 Alternative Identification Alternatives for the extension of SR 210 are based on different
connection points of SR 210 to I-10. The resultant alignments for the
extension of SR 210 and the modifications to I-10 are then identified
and evaluated. The Level 1 process identifies alternative locations along
I-10 for the connection of the SR 210 extension. Alternatives alignments
for the extension of SR 210 are then identified and evaluated to
determine fatal flaws that may eliminate some of the connection points.
The fatal flaws consist of factors that prohibit locating the SR 210
roadway in particular areas.
Only those alternatives that are feasible will be carried forward into the
Level 2 Analysis. Evaluation criteria include, but are not limited to:
Support the major interchange of SR 210 with Alvernon Way/Golf
Links Road.
Avoid major impacts to Davis-Monthan AFB.
Avoid major environmental, social and economic impacts identified
along the alignment.
Support the system interchange with I-10.
Support local interchanges adjacent to the system interchange.
Six initial connection locations to I-10 were identified and evaluated
using the criteria listed above. A seventh alternative that modified the
configuration of I-10 was also identified and evaluated.
System Alternative I System Alternative I is the improvement of I-10 and the extension of
SR 210 with the connection of SR 210 to I-10 at Alvernon Way. See
Figure 3.1 System Alternative I. SR 210 would be extended south along the Alvernon Way
alignment, to a system interchange with I-10.
A diamond interchange would be provided at the junction of SR
210 and Ajo Way.
SR 210 overpass structures would be provided at the intersection
of E. Michigan St. and the intersection of E. Irvington Rd.
– A system interchange would be integrated with the diamond
interchange movements at the junction of Alvernon Way and I-
10.
– Additional ROW would be required for SR 210, the SR 210/Golf
Links interchange, the SR 210/Ajo Way interchange and the I-
10/SR 210 system interchange.
– There are no apparent major environmental, social or economic
impacts identified with the SR 210 extension to a connection
with I-10 at Alvernon Way.
System Alternative II System Alternative II is the improvement of I-10 and the extension of
SR 210 with the connection of SR 210 to I-10 located approximately
one-half mile west of the existing Valencia Road diamond interchange.
See Figure 3.2 System Alternative II. SR 210 would be extended southerly through the Alvernon
Way/Golf Links TI, where it turns to the east along the southern
edge of DMAFB, and then south along the Swan Road alignment to
a system interchange with I-10.
– The alignment of the extension of SR 210 along DMAFB crosses
a triangular corner of the DMAFB property near Irvington Road.
A site identified as “IRP” by DMAFB is located within the
triangular piece of property. During the Phase II Design Concept
Study a determination will be made as to whether the IRP site
must be avoided or what measures may be necessary to allow the
SR 210 extension to pass through the site.
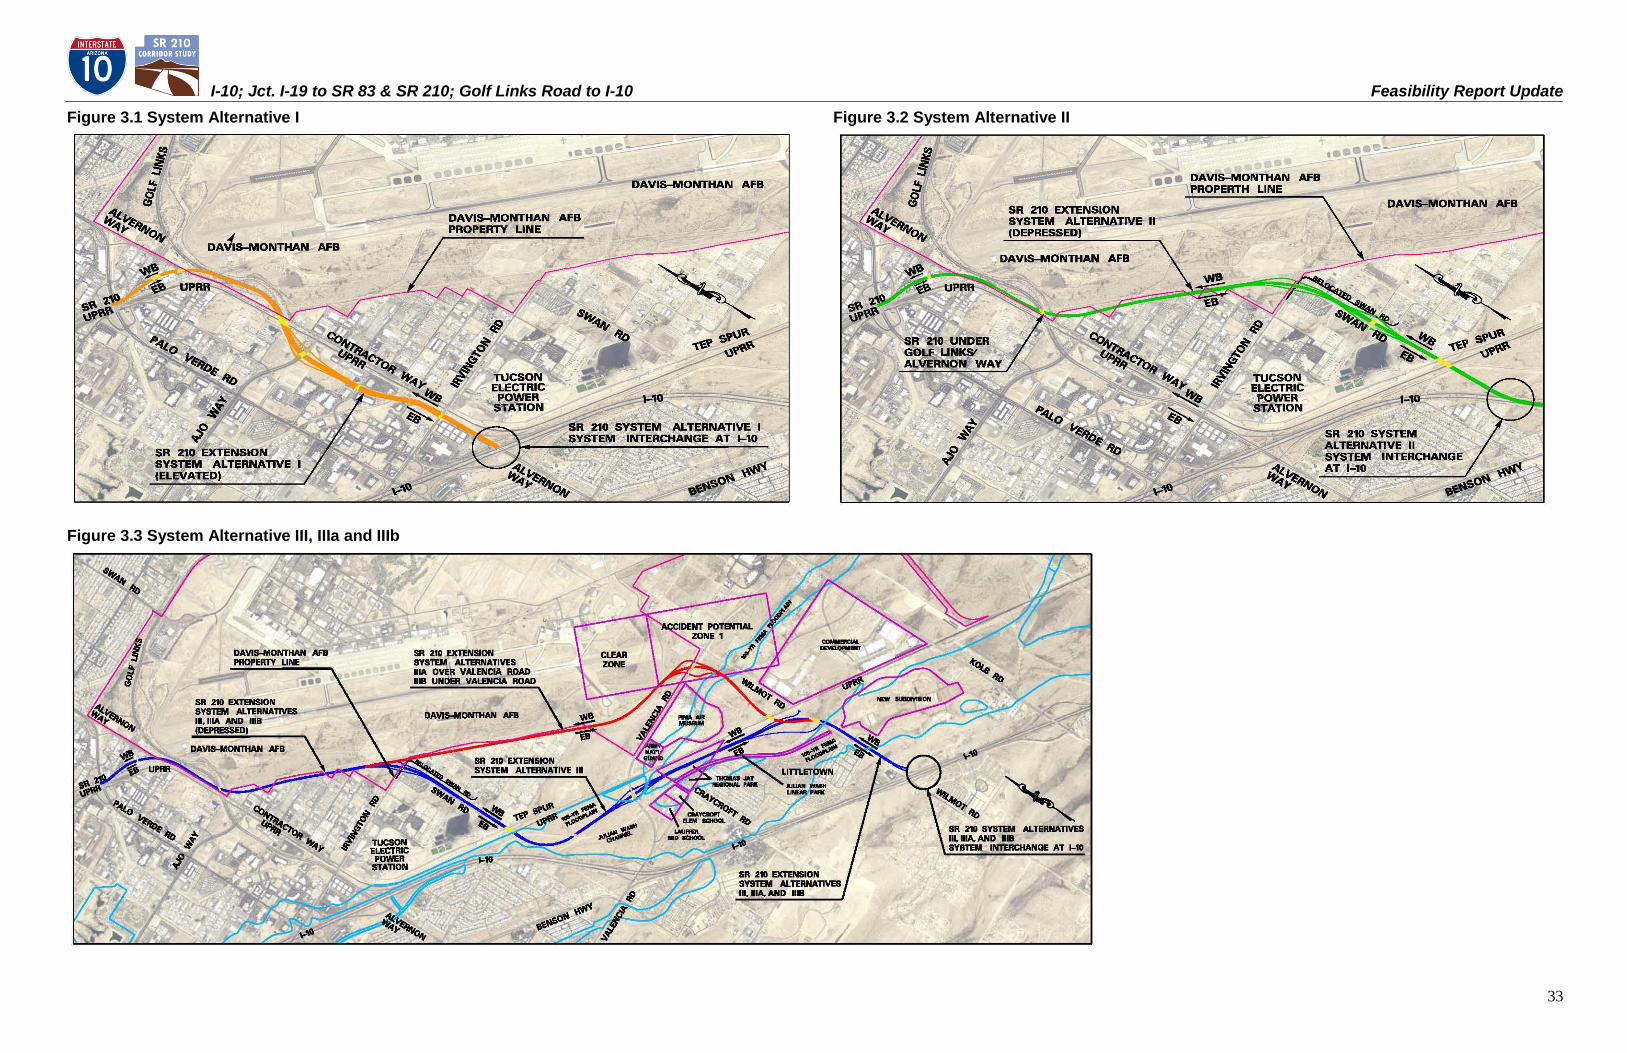
I-10; Jct. I-19 to SR 83 & SR 210; Golf Links Road to I-10 Feasibility Report Update
33
Figure 3.1 System Alternative I Figure 3.2 System Alternative II
Figure 3.3 System Alternative III, IIIa and IIIb
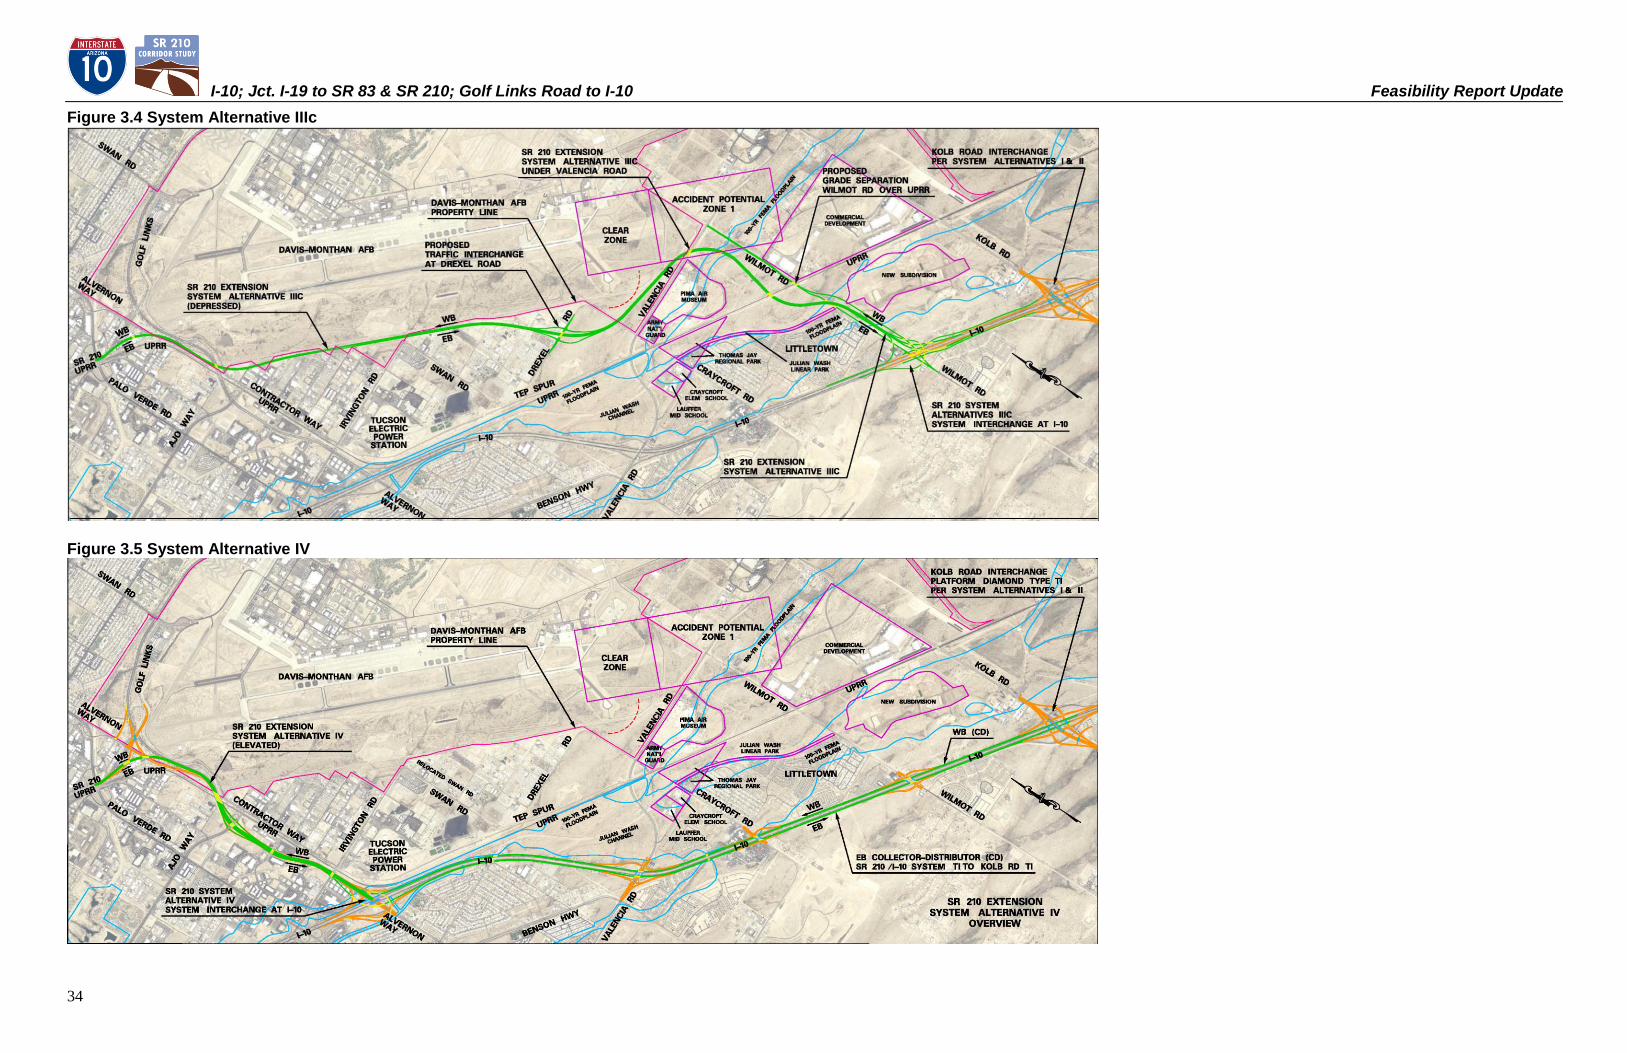
I-10; Jct. I-19 to SR 83 & SR 210; Golf Links Road to I-10 Feasibility Report Update
34
Figure 3.4 System Alternative IIIc
Figure 3.5 System Alternative IV
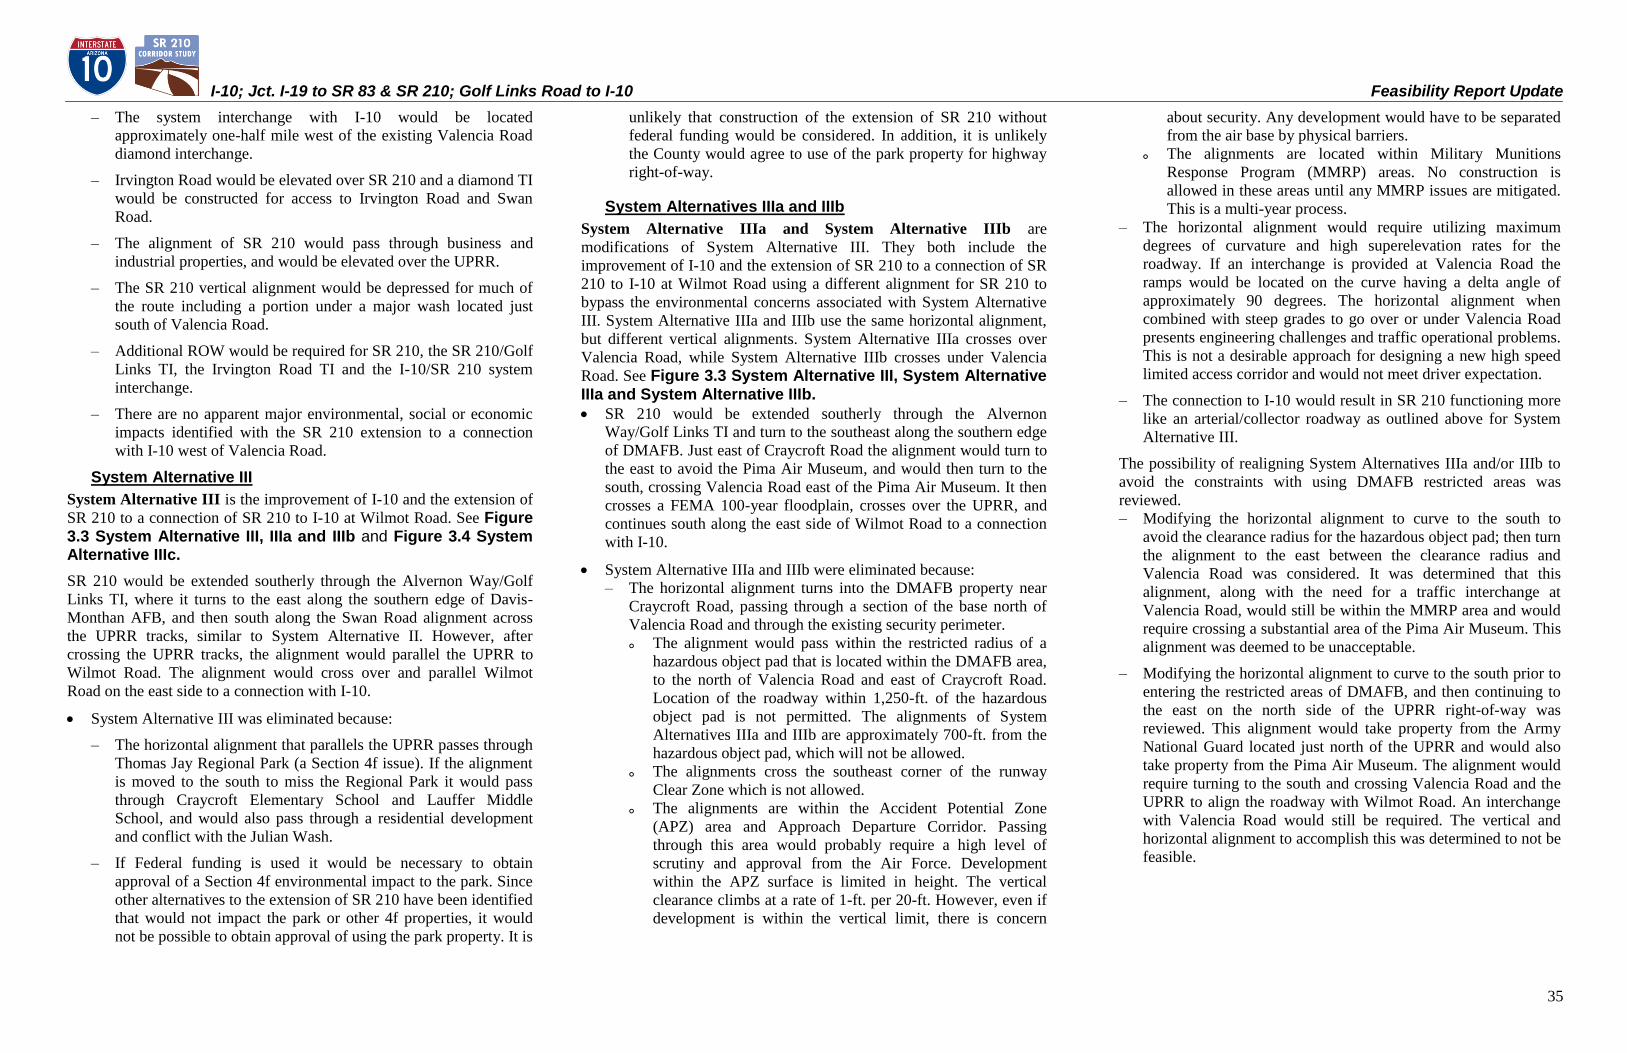
I-10; Jct. I-19 to SR 83 & SR 210; Golf Links Road to I-10 Feasibility Report Update
35
– The system interchange with I-10 would be located
approximately one-half mile west of the existing Valencia Road
diamond interchange.
– Irvington Road would be elevated over SR 210 and a diamond TI
would be constructed for access to Irvington Road and Swan
Road.
– The alignment of SR 210 would pass through business and
industrial properties, and would be elevated over the UPRR.
– The SR 210 vertical alignment would be depressed for much of
the route including a portion under a major wash located just
south of Valencia Road.
– Additional ROW would be required for SR 210, the SR 210/Golf
Links TI, the Irvington Road TI and the I-10/SR 210 system
interchange.
– There are no apparent major environmental, social or economic
impacts identified with the SR 210 extension to a connection
with I-10 west of Valencia Road.
System Alternative III System Alternative III is the improvement of I-10 and the extension of
SR 210 to a connection of SR 210 to I-10 at Wilmot Road. See Figure 3.3 System Alternative III, IIIa and IIIb and Figure 3.4 System Alternative IIIc. SR 210 would be extended southerly through the Alvernon Way/Golf
Links TI, where it turns to the east along the southern edge of Davis-
Monthan AFB, and then south along the Swan Road alignment across
the UPRR tracks, similar to System Alternative II. However, after
crossing the UPRR tracks, the alignment would parallel the UPRR to
Wilmot Road. The alignment would cross over and parallel Wilmot
Road on the east side to a connection with I-10.
System Alternative III was eliminated because:
– The horizontal alignment that parallels the UPRR passes through
Thomas Jay Regional Park (a Section 4f issue). If the alignment
is moved to the south to miss the Regional Park it would pass
through Craycroft Elementary School and Lauffer Middle
School, and would also pass through a residential development
and conflict with the Julian Wash.
– If Federal funding is used it would be necessary to obtain
approval of a Section 4f environmental impact to the park. Since
other alternatives to the extension of SR 210 have been identified
that would not impact the park or other 4f properties, it would
not be possible to obtain approval of using the park property. It is
unlikely that construction of the extension of SR 210 without
federal funding would be considered. In addition, it is unlikely
the County would agree to use of the park property for highway
right-of-way.
System Alternatives IIIa and IIIb System Alternative IIIa and System Alternative IIIb are
modifications of System Alternative III. They both include the
improvement of I-10 and the extension of SR 210 to a connection of SR
210 to I-10 at Wilmot Road using a different alignment for SR 210 to
bypass the environmental concerns associated with System Alternative
III. System Alternative IIIa and IIIb use the same horizontal alignment,
but different vertical alignments. System Alternative IIIa crosses over
Valencia Road, while System Alternative IIIb crosses under Valencia
Road. See Figure 3.3 System Alternative III, System Alternative IIIa and System Alternative IIIb. SR 210 would be extended southerly through the Alvernon
Way/Golf Links TI and turn to the southeast along the southern edge
of DMAFB. Just east of Craycroft Road the alignment would turn to
the east to avoid the Pima Air Museum, and would then turn to the
south, crossing Valencia Road east of the Pima Air Museum. It then
crosses a FEMA 100-year floodplain, crosses over the UPRR, and
continues south along the east side of Wilmot Road to a connection
with I-10.
System Alternative IIIa and IIIb were eliminated because:
– The horizontal alignment turns into the DMAFB property near
Craycroft Road, passing through a section of the base north of
Valencia Road and through the existing security perimeter.
o The alignment would pass within the restricted radius of a
hazardous object pad that is located within the DMAFB area,
to the north of Valencia Road and east of Craycroft Road.
Location of the roadway within 1,250-ft. of the hazardous
object pad is not permitted. The alignments of System
Alternatives IIIa and IIIb are approximately 700-ft. from the
hazardous object pad, which will not be allowed.
o The alignments cross the southeast corner of the runway
Clear Zone which is not allowed.
o The alignments are within the Accident Potential Zone
(APZ) area and Approach Departure Corridor. Passing
through this area would probably require a high level of
scrutiny and approval from the Air Force. Development
within the APZ surface is limited in height. The vertical
clearance climbs at a rate of 1-ft. per 20-ft. However, even if
development is within the vertical limit, there is concern
about security. Any development would have to be separated
from the air base by physical barriers.
o The alignments are located within Military Munitions
Response Program (MMRP) areas. No construction is
allowed in these areas until any MMRP issues are mitigated.
This is a multi-year process.
– The horizontal alignment would require utilizing maximum
degrees of curvature and high superelevation rates for the
roadway. If an interchange is provided at Valencia Road the
ramps would be located on the curve having a delta angle of
approximately 90 degrees. The horizontal alignment when
combined with steep grades to go over or under Valencia Road
presents engineering challenges and traffic operational problems.
This is not a desirable approach for designing a new high speed
limited access corridor and would not meet driver expectation.
– The connection to I-10 would result in SR 210 functioning more
like an arterial/collector roadway as outlined above for System
Alternative III.
The possibility of realigning System Alternatives IIIa and/or IIIb to
avoid the constraints with using DMAFB restricted areas was
reviewed.
– Modifying the horizontal alignment to curve to the south to
avoid the clearance radius for the hazardous object pad; then turn
the alignment to the east between the clearance radius and
Valencia Road was considered. It was determined that this
alignment, along with the need for a traffic interchange at
Valencia Road, would still be within the MMRP area and would
require crossing a substantial area of the Pima Air Museum. This
alignment was deemed to be unacceptable.
– Modifying the horizontal alignment to curve to the south prior to
entering the restricted areas of DMAFB, and then continuing to
the east on the north side of the UPRR right-of-way was
reviewed. This alignment would take property from the Army
National Guard located just north of the UPRR and would also
take property from the Pima Air Museum. The alignment would
require turning to the south and crossing Valencia Road and the
UPRR to align the roadway with Wilmot Road. An interchange
with Valencia Road would still be required. The vertical and
horizontal alignment to accomplish this was determined to not be
feasible.
I-10; Jct. I-19 to SR 83 & SR 210; Golf Links Road to I-10 Feasibility Report Update
36
System Alternative IIIc System Alternative IIIc is a further modification of System Alternative
III which was identified after it was determined that System Alternatives
IIIa and IIIb were not acceptable and were eliminated from further
consideration. System Alternative IIIc would include the improvement
of I-10 and the extension of SR 210 to a connection of SR 210 to I-10 at
Wilmot Road. See Figure 3.4 System Alternative IIIc.
System Alternative IIIc would utilize a horizontal alignment for SR
210 that roughly parallels the south side of Davis-Monthan AFB
from Alvernon Way to Swan Road. The alignment would then turn
to the south and cross under Drexel Road. It would then turn back to
the east past the Pima Air Museum and then turn to the south again
and cross under Valencia Road. After crossing under a major wash
just south of Valencia Road, the vertical alignment would climb to
cross over the UPRR. The profile would stay elevated and cross over
Wilmot Road and intersect I-10 with a system interchange.
A new traffic interchange would be constructed at the crossing of SR
210 and Drexel Road. The local road system would provide access
between SR 210 and Valencia Road via the traffic interchange at
Drexel Road.
Wilmot Road would be split into a couplet south of I-10 to facilitate
turning movements at I-10 with a split diamond concept. The split
diamond interchange would be integrated with the I-10 / SR 210
System Interchange.
The Wilmot Road couplet would continue to the north of I-10 just
beyond the 100-year FEMA Floodplain. The couplet roadways
would merge into a two-direction roadway just south of the UPRR.
Wilmot Road would be elevated and cross over the UPRR,
eliminating the existing grade crossing.
System Alternative IIIc was developed in response to the Pima County
Department of Transportation request for the extension of SR 210 that
joins I-10 at or near Wilmot Road. System Alternative IIIc would avoid
the Thomas Jay Regional Park, the Craycroft Elementary School and the
Lauffer Middle School.
DMAFB reviewed the preliminary concept of System Alternative IIIc.
Their review identified some concerns that would have to be overcome.
System Alternative IIIc was eliminated because the cost of System
Alternative IIIc will be substantially higher than either System
Alternative I or II. Additional costs would include:
Additional construction and right-of-way costs because of the
additional length of the corridor.
System Alternative IIIc would require relocation of
approximately 50 more residences than either System Alternative
I or II.
There would be numerous conflicts with utilities located within
local streets that would be crossed by System Alternative IIIc.
Right-of-way acquisition would be required from DMAFB.
The alignment of System Alternative IIIc passes near areas on
DMAFB where explosive ordinance is removed from aircraft,
creating a likely danger to users of the roadway if accidental
explosions occurred.
The alignment of the roadway near DMAFB would need to be
checked for unexploded ordinance.
Other costs associated with impacting a longer, highly developed
corridor.
System Alternative IV Subsequent to the Approval of the Feasibility Report dated October
2012 by ADOT, an additional alternative, System Alternative IV, was
identified for the improvement of I-10 and SR 210 within the project
area.
System Alternative IV is the extension of SR 210 south along the
Alvernon Way alignment to I-10 and the addition of collector-distributor
(CD) roadways adjacent to both the eastbound and westbound I-10
mainline roadway from Alvernon Way easterly through the Kolb Road
TI.
A system interchange will provide access between SR 210 and the
eastbound and westbound I-10 CD roadways. The system
interchange will be integrated with the diamond interchange
movements at the junction of Alvernon Way and I-10.
The eastbound CD roadway is a continuation of the southbound SR
210 roadway.
A ramp will be provided to allow vehicles on eastbound I-10 to exit
I-10 and enter the eastbound CD roadway.
The eastbound CD roadway will end with a taper into the eastbound
I-10 mainline roadway at the Kolb Road TI.
The westbound CD roadway will separate from the westbound I-10
mainline within the limits of the Kolb Road TI.
The westbound CD roadway will curve to the north approaching
Alvernon Way and become the northbound SR 210 roadway.
A ramp will be provided to allow vehicles on the westbound CD
roadway to exit the CD roadway and enter westbound I-10.
The eastbound and westbound CD roadways will be separated from
the eastbound and westbound I-10 mainline roadways by concrete
barriers.
Traffic interchanges will provide access between the CD roadways
and major cross streets at Valencia Road, Craycroft Road, Wilmot
Road and Kolb Road within the limits of the CD roadways.
Additional right-of-way will be required for SR 210, the SR
210/Golf Links TI, the Ajo Way TI, and the I-10/SR 210 system
interchange. Because of the additional width of the CD roadways
along I-10, some additional right-of-way may be required along I-10.
Other I-10/SR 210 Connection Locations: The connection at Craycroft Road was eliminated because;
– It bisected the community of Littletown and impacted both
Lauffer Middle School and Craycroft Elementary School.
– The system interchange ramps would conflict with the Valencia
Road/I-10 TI, which would require the removal of the Valencia
Road/I-10 TI ramps. Valencia Road is a major east-west
arterial/parkway that requires full access with I-10.
The connections at Kolb Road and Rita Road were eliminated
because:
– Alternatives that connect SR 210 with I-10 at Kolb Road and
Rita Road share the alignment alternatives described above for
System Alternative III east of Swan Road. Therefore, the SR 210
connections with I-10 at Kolb Road and Rita Road were
eliminated.
Analysis of projected traffic on I-10 in the design year 2040 showed
there would be only marginal improvements in I-10 traffic if the SR 210
connection with I-10 was extended to the east of Wilmot Road. This
analysis reduces the value of alternative connections of SR 210 to I-10
east of Wilmot Road. See the Initial Traffic Report for further details.
3.3 Level 2 Alternative Analysis The level 2 analysis includes:
A determination of the traffic handling capability of each alternative,
using design year traffic projections.
Identification of impacts to surrounding areas resulting from each
alternative.
I-10; Jct. I-19 to SR 83 & SR 210; Golf Links Road to I-10 Feasibility Report Update
37
A rough estimate of cost based on conceptual configuration of the
roadway.
Other factors as identified during the study process.
3.3.1 System Alternative I System Alternative I extends SR 210 southerly along the existing
Alvernon Way alignment to I-10. See Appendix C. The extension is
classified as an urban freeway and is elevated from north of the UPRR
overpass to south of Irvington Road. Access to Ajo Way is provided via
a diamond TI. SR 210 is grade-separated over Irvington Road.
The SR 210/Alvernon Way/Golf Links TI provides all traffic
movements except access to Contractors Way. Access to Contractors
Way is provided from SR 210 via the Ajo Way TI, then east on Ajo
Way across the at-grade RR crossing just west of Contractors Way.
The horizontal layout of the SR 210 extension avoids conflicts with
UPRR right-of-way. All new roadways are within or just west of the
existing Golf Links/Alvernon Way roadways between Palo Verde Road
and the UPRR overpass. All new elevated roadways are at
approximately the same elevation as elevated Golf Links Road.
Therefore, horizontal and vertical impacts to Davis-Monthan AFB are
avoided.
SR 210 between Golf Links Road and I-10 is a minimum of four lanes
in each direction to accommodate both SR 210 through traffic and local
traffic to either Alvernon Way or Golf Links Road.
SR 210 mainline between Golf Links Road and the I-10/SR 210 system
interchange at Alvernon Way will have LOS B or better, both AM and
PM in 2040.
The SR 210 ramps between Golf Links Road and the I-10/SR 210
system interchange will have LOS B or better, both AM and PM in
2040.
The system interchange with I-10 lies on top of and incorporates the
existing diamond TI at Alvernon Way and I-10.
To complete the diamond TI, the westbound I-10 exit ramp to Palo
Verde Road is eliminated and a new westbound entrance ramp from
Alvernon Way is added.
The major movements between I-10 and SR 210 (Ramps S-E, W-N,
S-W, and E-N) are provided by directional ramps associated with the
system interchange.
The diamond TI ramps serve to provide access for the minor
movements between I-10 and Alvernon Way (E-S and W-S).
Directional Ramps S-E and W-N are a minimum of two lanes each
to accommodate the heavy traffic volume demand between I-10 and
SR 210.
I-10 will have four mainline lanes in each direction from I-19 easterly to
Kino Parkway, three mainline lanes in each direction from Kino
Parkway to the I-10/SR 210 system interchange at Alvernon Way, and
five mainline lanes in each direction east of the I-10/SR 210 system
interchange at Alvernon Way to Kolb Road. The need for five mainline
lanes in each direction to the east of the I-10/SR 210 system Interchange
reflects the additional traffic that enters I-10 via TI‟s with arterial
roadways to the east, and then the reduction in traffic on I-10 due to
traffic exiting at the SR I-10/SR 210 system interchange. East of Kolb
Road the number of mainline I-10 lanes in each direction gradually
reduces from four lanes to two lanes at Wentworth Road.
3.3.2 System Alternative II This alternative extends SR 210 southerly through the Alvernon
Way/Golf Links TI, where it turns to the east along the southern edge of
Davis-Monthan AFB, and then south along the Swan Road alignment to
I-10. See Appendix D. The system interchange with I-10 is located
approximately one-half mile west of the existing Valencia Road
diamond interchange.
The SR 210/Alvernon Way/Golf Links interchange provides all traffic
movements except access to Contractor Way. Access to Contractor Way
is provided from SR 210 via an interchange at Irvington Road,
approximately one mile east of Contractor Way.
The horizontal alignment avoids conflicts with UPRR right-of-way in
the Golf Links Road/Alvernon Way area. All new roadways are within
or just west of the existing Golf Links/Alvernon Way roadways between
Palo Verde Road and the UPRR overpass. All new elevated roadways
are at approximately the same elevation as elevated Golf Links Road.
Therefore, horizontal and vertical impacts to Davis-Monthan AFB are
avoided.
SR 210 between Palo Verde Road and I-10 is a minimum of two lanes in
each direction. SR 210 is grade-separated over both the Tucson Electric
Power RR Spur and UPRR tracks.
Both WB and EB SR 210 west of Golf Links Road will have LOS C or
better for both the AM and PM in 2040.
WB SR 210 mainline between Golf Links Road and the I-10/SR 210
system interchange west of Valencia Road will have LOS C or better,
for the AM and LOS B or better for the PM in 2040. EB SR 210 will
operate at LOS A during the AM peak hour and at LOS B or better
during the PM peak hour.
The SR 210 ramps between Golf Links Road and the I-10/SR 210
system interchange will have LOS B or better for the AM and LOS C or
better for the PM in 2040.
Because of the proximity of the proposed system interchange to the
existing diamond TI at Valencia Road, the Valencia Road and Craycroft
Road ramps will be incorporated into the system interchange to provide
access to/from both I-10 and SR 210 from all ramps. See Appendix D.
The major movements between I-10 and SR 210 (Ramps S-E, W-N, S-
W, and E-N) are provided by directional ramps associated with the
system interchange. Directional ramps S-E and W-N are a minimum of
two lanes each to accommodate the heavy traffic volume demand
between I-10 and SR 210.
I-10 will have four mainline lanes in each direction from I-19 easterly to
Kino Parkway, three mainline lanes in each direction from Kino
Parkway to the I-10/SR 210 system interchange west of Valencia Road,
four mainline lanes in each direction between the I-10/SR 210 system
interchange and Valencia Road, and five mainline lanes in each
direction east of Valencia Road to Kolb Road. The need for five
mainline lanes in each direction to the east reflects the additional traffic
that enters I-10 via TI‟s with arterial roadways to the east, and then the
reduction in traffic on I-10 due to traffic exiting at the SR I-10/SR 210
System Interchange. East of Kolb Road the number of mainline I-10
lanes in each direction gradually reduces from four lanes to two lanes at
Wentworth Road.
3.3.3 System Alternative IV System Alternative IV extends SR 210 southerly along the existing
Alvernon Way alignment to I-10 similar to System Alternative I. See
Appendix E. The extension is classified as an urban freeway and is
elevated from north of the UPRR overpass to south of Irvington Road.
Access to Ajo Way is provided via a diamond TI. SR 210 is grade-
separated over Irvington Road.
The SR 210/Alvernon Way/Golf Links TI provides all traffic
movements except access to Contractors Way. Access to Contractors
Way is provided from SR 210 via the Ajo Way TI, then east on Ajo
Way across the at-grade RR crossing just west of Contractors Way.
The horizontal layout of the SR 210 extension avoids conflicts with
UPRR right-of-way. All new roadways are within or just west of the
existing Golf Links/Alvernon Way roadways between Palo Verde Road
and the UPRR overpass. All new elevated roadways are at
approximately the same elevation as elevated Golf Links Road.
Therefore, horizontal and vertical impacts to Davis-Monthan AFB are
avoided.
I-10; Jct. I-19 to SR 83 & SR 210; Golf Links Road to I-10 Feasibility Report Update
38
SR 210 between Golf Links Road and I-10 is a minimum of four lanes
in each direction to accommodate both SR 210 through traffic and local
traffic to either Alvernon Way or Golf Links Road.
SR 210 mainline between Golf Links Road and the I-10/SR 210 System
interchange at Alvernon Way will have LOS B or better during the AM
and LOS C or better during the PM in 2040.
The SR 210 ramps between Golf Links Road and the I-10/SR 210
System Interchange will have LOS B or better, both AM and PM in
2040. The System Interchange with I-10 lies on top of and incorporates
the existing diamond TI at Alvernon Way and I-10.
To complete the diamond TI, the westbound I-10 exit ramp to Palo
Verde Road is eliminated and a new westbound entrance ramp from
Alvernon Way is added.
The major movements between I-10 and SR 210 (Ramps S-E, W-N,
S-W, and E-N) are provided by directional ramps associated with the
System Interchange.
The diamond TI ramps serve to provide access for the minor
movements between I-10 and Alvernon Way (E-S and W-S).
Directional Ramps S-E and W-N are a minimum of two lanes each
to accommodate the heavy traffic volume demand between I-10 and
SR 210.
I-10 will have four mainline lanes in each direction from I-19 easterly to
Kino Parkway and three mainline lanes in each direction from Kino
Parkway to the I-10/SR 210 system interchange at Alvernon Way.
East of the I-10/SR 210 System Interchange CD roadways will be added
adjacent to both the EB and WB I-10 mainline roadways. The CD
roadways will begin as extensions of the SR 210 NB and SB roadways
and will continue to the east, ending at the Kolb Road TI.
The EB and WB I-10 mainline roadways will have three lanes in each
direction and the EB and WB I-10 CD roadways will have two lanes in
each direction between the I-10/SR 210 System Interchange and Kolb
Road. East of Kolb Road the number of mainline I-10 lanes in each
direction gradually reduces from four lanes to two lanes at Wentworth
Road. The LOS of both the mainline roadways and the CD roadways
will be LOS C or better
The need for additional lanes in each direction to the east reflects the
additional traffic that enters I-10 via TI‟s with arterial roadways to the
east, and then the reduction in traffic on I-10 due to traffic exiting at the
SR I-10/SR 210 System Interchange.
3.3.4 Modifications to Existing I-10 Modifications to existing I-10 from I-19 to SR 83 are required to
provide an acceptable LOS for design year 2040. The modifications
include improvements to both the I-10 mainline roadway and to the
existing I-10 TIs within the project limits.
The modifications to existing I-10 will be similar for both System
Alternative I and System Alternative II with the following exceptions:
The number of mainline I-10 lanes will be different between the
locations of the junction of I-10/SR 210 with System Alternative I
and the junction of I-10/SR 210 with System Alternative II.
The Alvernon Way TI and the Valencia Road TI will be different for
System Alternative I than for System Alternative II.
The modifications to existing I-10 with System Alternative IV will be
similar to the modifications to existing I-10 with System Alternative I
and System Alternative II from I-19 to Alvernon Way and from Kolb
Road to SR 83. From Alvernon Way to Kolb Road, Alternative IV will:
Modify I-10 mainline roadways to incorporate CD roadways parallel
to the eastbound and westbound I-10 mainline roadways.
The Alvernon Way TI, the Valencia Rd. TI, the Craycroft Rd. TI, the
Wilmot RD TI, and the Kolb Rd. TI will connect with the I-10 CD
roadways.
Evaluation Process for Existing I-10 Mainline and TIs Using the 2040 PAG Forecast Traffic Volumes for peak hour traffic
volumes and „Synchro‟ micro-modeling software, traffic capacity
problems at TIs are identified wherever levels of service are low using
the existing crossroad and ramp configurations. Solutions are then
identified and tested by re-running the micro-model with the proposed
solution coded into the software. This iterative process is repeated until
an adequate solution is produced.
Since the „Synchro‟ micro-modeling software is used at individual TIs,
regional solutions are checked by combining the „Synchro‟ solutions as
a 2040 Build scenario and running it within the PAG Model.
Once the 2040 Build scenario is validated, the combined solution is
presented to the project stakeholders. Stakeholder comments that impact
the design solution are addressed by developing revised solutions and
checking them through the micro-modeling process. The resulting
combined solution is checked using VISSIM regional micro-modeling
software. This identifies levels of service and numbers of lanes for
mainline I-10, ramps, crossroads, and turn lanes.
All initial „Synchro‟ micro-modeling runs and solutions involve a
default of a standard diamond type TI. If micro-modeling indicates that
a diamond type TI will not adequately function, other TI types are
tested. Section 3.3.5 describes each TI and required improvements.
I-10 Capacity The results of traffic modeling indicate that in 2040 four lanes will be
required in each direction on I-10 between the I-10/I-19 System
Interchange and Kino Parkway and three lanes will be required in each
direction on I-10 from Kino Parkway to the I-10/SR 210 System
Interchange for all alternatives being considered. East of the I-10/SR
210 System Interchange, the number of lanes on I-10 vary to
accommodate the traffic demand and range from six to two lanes in each
direction. Auxiliary lanes are required between successive entrance and
exit ramps.
The configuration of the I-10 mainline roadway varies with
consideration of System Alternative IV which introduces CD roadways
along the I-10 mainline from Alvernon Way to Kolb Road.
Because of the relatively close spacing between the alternative locations
of the I-10/SR 210 System Interchange, traffic demand on I-10 is
relatively the same for System Alternative I, System Alternative II and
System Alternative IV. This means that traffic volumes and the number
of mainline I-10 lanes both west and east of the SR 210 System
Interchange are similar for System Alternative I, and System Alternative
II. The traffic volumes for System Alternative IV are the same as for
System Alternatives I and II; however, the configurations of the
mainline roadways and ramp connections between the I-10 mainline and
crossroads at traffic interchanges are different for System Alternative IV
because of the introduction of the CD lanes.
I-10 mainline lanes will vary as follows:
From the I-19 interchange easterly to the Kino Parkway interchange
I-10 will have four mainline lanes in each direction.
From the Kino Parkway interchange easterly to the I-10/SR 210
System Interchange I-10 will have three mainline lanes in each
direction.
Between the Alvernon Way interchange and the Valencia Road
interchange I-10 will have the following number of mainline lanes in
each direction for the alternatives under consideration:
System Alternative I: The I-10/SR 210 system interchange is at
Alvernon Way. The I-10 mainline will have five lanes in each
direction.
System Alternative II: The I-10/SR 210 system interchange is
located approximately ½ mile west of the I-10/Valencia Road TI.
The I-10 mainline will have three lanes in each direction
between Alvernon Way and the I-10/SR 210 system interchange,
and five lanes in each direction between the I-10/SR 210 system
interchange and the Valencia Road TI.
I-10; Jct. I-19 to SR 83 & SR 210; Golf Links Road to I-10 Feasibility Report Update
39
System Alternative IV: Three mainline lanes plus two CD lanes
in each direction.
Between Valencia Road and Craycroft Road, I-10 System
Alternative I will have five lanes in each direction, System
Alternative II will have five mainline lanes in each direction and
System Alternative IV will have will have three mainline lanes plus
two CD lanes in each direction.
Between Craycroft Road and Wilmot Road I-10 System Alternatives
I and II will have five mainline lanes in each direction. System
Alternative IV will have three mainline lanes plus two CD lanes in
each direction.
Between Wilmot Road and Kolb Road I-10 System Alternatives I
and II will have four eastbound mainline lanes and five westbound
mainline lanes. System Alternative IV will have three mainline lanes
plus two CD lanes in each direction.
Between Kolb Road and Houghton Road I-10 System Alternatives I,
II and IV will have four mainline lanes in each direction.
From Houghton Road to Colossal Cave Road/Wentworth Road I-10
System Alternatives I, II and IV will have three mainline lanes in
each direction.
From Colossal Cave Road/Wentworth Road easterly to the end of
the project I-10 System Alternatives I, II and IV will have two lanes
in each direction.
Auxiliary lanes will be required along both the eastbound and
westbound I-10 roadways in addition to the mainline through lanes
I-10 will have LOS C or better in both directions through the limits of
the project.
The western project limits of this study are at the I-10/I-19 System
Interchange. Physical constrictions prevent I-10 widening north of the
south ramps to/from 29th Street and potential widening solutions are not
addressed in this study. The eastbound entrance ramp from 29th Street
becomes the 4th eastbound general purpose lane on I-10. The 4th
westbound general purpose lane on I-10 becomes a mandatory exit to
29th Street.
I-10 Right-of-Way The areas adjacent to I-10 from I-19 to approximately 7,000-feet (1.3
miles) east of Kolb Road are developed with both commercial and
residential development along I-10. The existing I-10 ROW corridor is
quite narrow and there is very little unused ROW between the existing
outer edges of the roadways and the ROW lines.
Input from Stakeholders indicated a desire to widen the existing
roadways to the outside where feasible. However, preliminary layout of
additional lanes for the I-10 mainline roadway and the reconfiguration
of TI ramps indicates that within the limits discussed above from I-19 to
approximately 7000-feet (1.3 miles) east of Kolb Road, it will be
necessary to widen the I-10 mainline roadways into the median to the
extent feasible to reduce the impact to adjacent properties that would
occur if all widening is done to the outside of the existing roadways.
From the above location east of Kolb Road to the end of the project, just
beyond the SR 83 TI there is little development adjacent to the existing
I-10 ROW. Through this area widening I-10 to the outside of the
existing roadways will be feasible.
Additional ROW will be required along I-10 where TIs and frontage
roads are being modified.
I-10 Median At the west end of the project, existing I-10 has a closed median with
Portland Cement Concrete Pavement (PCCP) and a concrete median
barrier located at median centerline. Through the horizontal curve over
Park Avenue, the existing median changes from the closed median to an
open median that separates the eastbound and westbound roadways. The
open median continues throughout the remainder of the project, past the
SR 83 TI.
Because of the need to minimize the impact on adjacent developed
areas, it may be necessary to extend the closed median from Park
Avenue east to approximately 7,000 feet (1.3 miles) east of Kolb Road
at the end of an existing two-way frontage road along a developed area
that restricts right-of-way. East of this location, widening of the I-10
mainline roadway to the outside appears to be feasible. A final
determination of the location of the transition from a closed median to
an open median should be made during the Phase II Design Concept
Study.
I-10 TI Spacing In urban conditions, TIs should nominally be one mile apart. This
provides distance to develop adequate weaving distances associated with
auxiliary lanes that normally occur between successive entrance and exit
ramps. Since I-10 cuts angularly across the local street grid system with
major arterials on one mile spacing, the distances between TIs are
nominally more than one mile apart; typically 1.4 miles. However, the
location of some existing TIs results in distances between TIs of less
than one mile.
Park Avenue TI is approximately 0.7 miles from both 6th
Avenue TI
and Kino Parkway TI.
Craycroft Road TI is approximately 0.85 miles from the Valencia
Road TI.
Palo Verde Road TI is approximately 0.6 miles from the Alvernon
Way TI.
Elimination of these TIs is not practical, as they provide needed access
to local businesses and governmental services. Therefore,
reconfiguration of TI ramps is needed to maintain access, yet maximize
weaving distances and safety for the traveling public. The Palo Verde
Road TI can be removed and a new TI at Country Club Road is needed
and will be added. Country Club Road is located approximately 1.2
miles from Kino Boulevard TI and Alvernon Way TI. The ramps for the
TIs at Park Avenue and Craycroft Road will be relocated to eliminate
the weaving issues and improve safety for the traveling public. See
Section 3.3.5. I-10 TI Modifications for the Park Avenue TI and
Craycroft Road TI modifications concerning the ramps. All other TIs
within the project limits meet or exceed the minimum one mile spacing
criteria.
During the Phase II Design Concept Study, a Change of Access Report
will be prepared that details traffic operations and addresses FHWA
policy requirements for new or revised access points to the interstate
system.
3.3.5 I-10 TI Modifications Each of the existing TIs within the project limits was evaluated from a
capacity and safety standpoint to determine needed improvements. The
evaluation process involved:
Using the projected 2040 peak hour traffic volumes and micro-
modeling software to identify problem areas or movements that have
unacceptable levels of service.
Identifying solutions.
Testing solutions by re-running the micro-model with the proposed
solutions coded into the software.
Repeating the iterative process until adequate solutions are
produced.
Solutions typically involve enlarging the crossroads and ramp termini at
the crossroads; providing additional through-lanes and turn-lanes to
accommodate the higher traffic demand.
The existing TIs are typically diamond type TIs.
Where right-of-way is limited, tight diamond TIs are used. The tight
diamond TIs can remain, subject to turning radius checks to be
performed during the Phase II Design Concept Study.
There are three partial cloverleaf TIs that will be modified to
eliminate successive loop ramps. The successive loop ramps provide
I-10; Jct. I-19 to SR 83 & SR 210; Golf Links Road to I-10 Feasibility Report Update
40
inadequate weaving distances, limiting capacity and creating safety
issues.
There are several spread diamond TIs, mostly in the more rural
sections east of Wilmot Road. Spread diamonds will be converted to
standard diamond types to reduce right-of-way requirements unless
there are reasons for retaining the spread configuration.
The existing TIs will be tested for capacity as diamond TIs with
approximately 600 feet between the ramp termini, unless conditions
dictate a different spacing. Where diamond TIs cannot provide the
needed capacity, modifications will be made to develop the capacity.
See Appendix C for plan views of the new and modified TIs.
A description of improvements for each existing and new TI is included
below. Improvements meet the capacity and operational requirements,
but are not necessarily the final recommended solution. That is to be
determined in the Phase II Design Concept Study. Refer to Appendix B
for projected traffic volumes on crossroads at each TI.
I-10/6th Avenue TI (MP 260.99) The existing diamond type TI has four ramps that provide full access
between I-10 and 6th
Avenue. See plan sheets 1 and 2 of 2040
Improvements – System Alternatives I, II and IV in Appendices C, D
and E.
The eastbound entrance ramp from 6th
Avenue is interrelated with
the eastbound exit ramp from I-10 to Park Avenue via a weave on
the frontage road.
The existing westbound exit ramp from I-10 to 6th
Avenue is
interrelated with the entrance ramp from Park Avenue to I-10 via a
short weave along mainline I-10.
The 6th
Avenue westbound exit ramp will be relocated to the east
side of Park Avenue with grade separated crossings over the
westbound exit ramp to Park Avenue and over Park Avenue.
I-10 is fully depressed and passes under 6th
Avenue.
6th
Avenue across I-10 has two through lanes and single left turn
lanes in each direction between the ramp termini. The City of South
Tucson has advised that the outside pedestrian fencing on the 6th
Avenue underpass bridge over I-10 has artistic enhancements that
should be incorporated into any bridge widening or replacement.
Traffic modeling evaluations determined that the diamond TI at 6th
Avenue functions adequately, but will need additional through and turn
lanes on the crossroad. (Check updated Traffic Report).
Existing 6th
Avenue has many signalized intersections and pedestrian
crossings that are spaced relatively close together. The existing posted
speed limit is 35 mph. The PAG Model cannot accurately depict these
conditions, thus resulting in unrealistically higher volumes at the I-10/6th
Avenue TI. Further evaluation of volumes and impacts upon
improvements should be performed during the Phase II Design Concept
Study. It is probable that the projected traffic volumes on 6th
Avenue can
be reduced, which would result in needing less improvement. This may
also impact the need for 6th
Avenue bridge replacement versus bridge
widening.
The existing „U-turn‟ ramp that connects the eastbound and westbound
frontage roads provides access under I-10 in the vicinity of the UPRR
crossing under I-10.
The vertical clearance under the I-10 bridge does not meet current
design criteria. The need to retain this ramp should be determined during
the Phase II Design Concept Study.
Ramp changes that are needed at the Park Avenue TI impact the 6th
Avenue westbound exit ramp. Those changes are discussed under the
following I-10/Park Avenue TI discussion.
I-10/Park Avenue TI (MP 261.72) The existing partial cloverleaf TI has four ramps that provide full access
between I-10 and Park Avenue. See plan sheet 2 of 2040 Improvements
– System Alternatives I, II and IV in Appendix C, D and E.
The weave along I-10 between the westbound loop entrance ramp
and the exit ramp to 6th
Avenue is too short.
The eastbound exit ramp intersects Park Avenue approximately 600
feet south of I-10 with a signalized intersection, and becomes the
west end of Benson Highway.
Benson Highway crosses Park Avenue at a 45 degree skew angle.
Therefore, left turns onto northbound Park Avenue are a sharp 135
degrees, which is not desirable.
At I-10, Park Avenue has three through lanes and a single left turn
lane in each direction. The outside northbound lane becomes the
loop ramp. To the north, the curb line is continued for three lanes to
the intersection with the westbound ramps, but the outside lane is
striped for non-usage.
Modifications to the Park Avenue TI were identified and evaluated
through the iterative process described previously.
The loop ramp from Park Avenue to westbound I-10 will be replaced
with a diamond entrance ramp from Park Avenue to westbound I-10.
This converts the partial cloverleaf TI to a diamond type TI.
The new westbound entrance ramp from Park Avenue results in an
unacceptable length of weave between the entrance ramp and the
existing exit ramp to 6th
Avenue, necessitating moving the
westbound exit ramp to 6th
Avenue to the east of Park Avenue.
The Park Avenue westbound exit ramp must be relocated to the east.
To eliminate weaving with the westbound entrance ramp from Kino
Parkway, the exit ramp to Park Avenue is relocated just inside the
existing north right-of-way for I-10 to east of Kino Parkway and it
„braids‟ under Kino Parkway and the Kino entrance ramp to avoid
weaving and improve safety.
The eastbound exit ramp from I-10 to Park Avenue currently
connects with the Benson Highway. That connection will remain and
an additional connection will be extended to Park Avenue. This
removes traffic from the skewed intersection with Benson Highway
and improves traffic operations and safety.
Park Avenue will have 3-through lanes and single left-turn lanes in each
direction. Existing Park Avenue has adequate width for this
configuration.
Additional study will be required during the Phase II Design Concept
Study to finalize the lane configurations.
I-10/Kino Parkway TI (MP 262.53) Kino Parkway is one of four continuous major north-south
arterials/parkways from south of I-10 into central and north Tucson that
does not encounter a physical obstacle, such as the UPRR switching
yard and Davis Monthan AFB. As such, the I-10/Kino Parkway TI is a
major intermediate destination for traffic from the south and southeast
part of the Tucson Metropolitan area to access downtown Tucson.
The existing partial cloverleaf TI provides access between I-10, Kino
Parkway, and Ajo Way. See plan sheet 3 of 2040 Improvements –
System Alternatives I, II and IV in Appendix C, D and E. Through
traffic on all three roadways are grade-separated. The majority of access
to and from I-10 is through TI ramps. The Ajo Way Connector between
Kino Parkway and Ajo Way in the northeast quadrant provides access to
and from westbound I-10 and Kino Parkway.
A diamond TI was evaluated through the iterative process described
above.
A direct connection for westbound I-10 traffic to Kino Parkway
without using the Ajo Way Connector was used.
– This new diamond ramp required the removal of the two existing
ramps between westbound I-10 and Ajo Way.
– The westbound access to and from Ajo Way is relocated to a
new TI at Country Club Road.
The eastbound I-10 exit loop ramp is removed and replaced with a
new I-10 exit ramp west of Kino Parkway
– The eastbound exit ramp is grade-separated over the new
eastbound entrance ramp from Park Avenue.
I-10; Jct. I-19 to SR 83 & SR 210; Golf Links Road to I-10 Feasibility Report Update
41
– The ramp terminus is located as far north as possible along Kino
Parkway to increase the weave distance down to the left turn
lanes onto Benson Highway.
The southbound Kino Parkway to eastbound I-10 loop ramp was
originally removed as a part of the effort to remove all loop ramps.
However, the traffic simulations indicated that the heavy southbound
left turn demand from Kino Parkway to eastbound I-10, along with
the heavy northbound through traffic demand on Kino Parkway,
causes the intersection of Kino Parkway and the I-10 eastbound
entrance and exit ramps to fail.
Therefore, a loop ramp is used to remove the southbound left-turn
traffic from the ramp terminal intersection. The existing loop ramp
will be modified to operate more safely. The loop ramp will merge
with the diamond ramp. The ramp merge onto eastbound I-10 will be
moved to the east to provide adequate length.
Kino Parkway will have three lanes in each direction Left turn lanes will
be used for the northbound Kino Parkway to westbound I-10 movement.
Traffic modeling evaluations determined that the TI will function
adequately as a diamond TI with the loop ramp. The modeling also
indicates that both TI intersections operate at a satisfactory LOS for all
conditions.
Additional study is needed during the Phase II Design Concept Study to
finalize the TI configuration.
I-10/Country Club Road TI (MP 263.82) A new diamond TI will be located at Country Club Road to replace the
existing Palo Verde Road TI. See sheet 4 of 2040 Improvements –
System Alternatives I, II and IV in Appendix C, D and E. Design
criteria for skew angles of ramps at the crossroad will impact both the
spacing between ramp termini and ramp alignments.
Traffic modeling evaluations determined that the diamond TI will
function adequately, by providing three lanes and dual left turn lanes in
each direction on the crossroad with external storage needed for the left
turn lanes.
I-10/Palo Verde Road TI (MP 264.37) The existing TI at the junction of I-10 and Palo Verde Road will be
removed. See sheet 5 of 2040 Improvements – System Alternatives I, II
and IV in Appendix C, D and E.
The proposed TI at I-10 and Country Club Road will provide access for
traffic that currently uses the Palo Verde TI.
The existing eastbound frontage road on the south side of I-10 will
remain. The intersection of the frontage road and Palo Verde Road will
be modified to a “T” intersection to provide access from both
northbound and southbound Palo Verde Road.
I-10/Alvernon Way TI (MP 265.02) Alvernon Way is one of four continuous major north-south
arterials/parkways from south of I-10 into central and north Tucson that
does not encounter a physical obstacle, such as the UPRR switching
yard and Davis Monthan AFB. The I-10/Alvernon Way TI is a major
connector for traffic from the south and southeast part of the Tucson
Metropolitan area to access central and downtown Tucson.
Alvernon Way is the location for two of the alternatives to connect SR
210 to I-10 (System Alternative I and System Alternative IV), covered
in Section 3.3.1 and Section 3.3.3 of this report. If System Alternative I
or System Alternative IV is selected, the Service TI discussed here
would be integrated with a System Interchange as discussed for System
Alternative I and System Alternative IV in the following subsections of
this report.
If System Alternative II is selected, the I-10/Alvernon Way TI would be
modified as discussed in the following paragraphs, but would not have
to be integrated with a System Interchange.
The existing partial diamond TI has three ramps, but does not provide
full access between I-10 and Alvernon Way. See sheet 6 of Existing
Conditions in Appendix A. There is no existing westbound entrance
ramp from Alvernon Way to westbound I-10.
The initial evaluation involved retaining the existing TI, with the
following changes:
The westbound entrance ramp would be added.
The westbound exit ramp would be reconfigured to provide access to
southbound Alvernon Way.
The eastbound exit ramp will be reconfigured to improve the angle
at the intersection with Alvernon Way.
Traffic modeling evaluations determined that the TI will function
adequately as a diamond TI with three lanes in each direction plus left
turn lanes on the crossroad. The modeling evaluations also indicate that
both intersections will operate at LOS B, but external storage for left
turns is needed. While existing curb locations do not support the
external storage, there may be sufficient distance between the center
bridge pier and the abutments to accommodate the additional lanes.
Additional study is needed during the Phase II Design Concept Study to
determine the final need for the external storage while providing an
adequate LOS and to determine if the needed lanes will fit within the
bridge opening.
I-10/SR 210 – System Alternative I Interchange (MP 265.02)
Under System Alternative I, SR 210 will be extended south along the
Alvernon Way alignment to a System Interchange with I-10.
Improvements to the existing diamond TI and crossroad, as listed above,
will be performed. See sheets 5 and 6 of 2040 Improvements - System
Alternative I in Appendix C.
Additional ROW will be required for the extension of SR 210.
The new system interchange will be integrated with and placed on top of
the diamond service TI. The system interchange will include four new
directional ramps.
Traffic modeling evaluations determined that the system interchange
will function adequately, with the directional ramps serving I-10 to/from
SR 210. Ramps S-E and W-N are major two-lane ramps. Ramp S-W and
E-N are shown as one-lane ramps The diamond ramps will serve I-10 to
Alvernon Way, especially to the south.
Portions of the new system interchange are within the existing Julian
Wash floodplain and are adjacent to Los Ninos Elementary School and
Los Ninos Park. Impacts to the floodplain, school and park should be
studied in more detail during the Phase II Design Concept Study.
I-10/SR 210 – System Alternative II Interchange (MP 266.3) Under System Alternative II, SR 210 will be extended to the east and
will turn to the south, roughly along the Swan Road alignment, to
intersect with I-10 west of the existing Valencia Road TI. See sheets 7
and 8 of 2040 Improvements – System Alternative II in Appendix D.
The new system interchange will involve four new directional ramps
and four minor ramps. Mainline SR 210 and Ramp S-W will cross over
the UPRR and the Tucson Electric Power spur railroad tracks.
Additional ROW will be required for the extension of SR 210.
Traffic modeling evaluations determined that the system interchange
will function adequately, with the directional ramps serving I-10 to/from
SR 210. Ramps S-E and W-N are major two-lane ramps. Ramp S-W and
E-N are shown as one-lane ramps The minor ramps provide full access
from/to I-10 and SR 210 to/from Valencia Road and Craycroft Road.
The proximity of the I-10/SR 210 System Alternative II Interchange to
Valencia Road will require ramps for the System Interchange to be
integrated with ramps for the diamond interchange at Valencia Road as
shown on sheets 7 and 8 of 2040 Improvements – System Alternative II
in Appendix D.
I-10; Jct. I-19 to SR 83 & SR 210; Golf Links Road to I-10 Feasibility Report Update
42
A private development project, named Valencia Crossing Project, has
been submitted to the City of Tucson. If the project is approved and
implemented it would affect System Alternative II.
The majority of the system interchange is within the Julian Wash
floodplain and will be on either high embankments or structures.
Further study regarding the proposed Valencia Crossing project and
impacts to the Julian Wash floodplain will be needed during the Phase II
Design Concept Study.
I-10/SR 210 – System Alternative IV Interchange (MP 265.02)
Under System Alternative IV, SR 210 will be extended south along the
Alvernon Way alignment to a System Interchange with I-10.
Improvements to the existing diamond TI and crossroad, as listed above,
will be performed. See sheets 5 and 6 of 2040 Improvements - System
Alternative IV in Appendix E.
Additional ROW will be required for the extension of SR 210.
The new system interchange will be integrated with and placed on top of
the diamond service TI. The system interchange will include four new
directional ramps.
Traffic modeling evaluations determined that the system interchange
will function adequately, with the directional ramps serving I-10 to/from
SR 210. Ramps S-E and W-N are major two-lane ramps that connect SR
210 and the I-10 CD roadways. Ramp S-W and E-N are shown as one-
lane ramps. The diamond ramps will serve I-10 to Alvernon Way,
especially to the south.
Portions of the new system interchange are within the existing Julian
Wash floodplain and are adjacent to Los Ninos Elementary School and
Los Ninos Park. Impacts to the floodplain, school and park should be
studied in more detail during the Phase II Design Concept Study.
I-10/Valencia Road TI (MP 267.10) The existing diamond TI has four ramps that provide full access between
I-10 and Valencia Road. See sheet 8 of 2040 Improvements - System
Interchange I in Appendix C and sheet 8 of 2040 Improvements –
System Interchange IV in Appendix E.
As noted above the ramps for the I-10/Valencia Road TI will be
integrated with the ramps for the I-10/SR 210 System Interchange II.
There are existing eastbound and westbound frontage roads between the
Valencia Road and Craycroft Road TIs. There are no access driveways
onto the eastbound frontage road. There are a few access driveways onto
the westbound frontage road near Craycroft Road. The frontage roads
will be removed. Further study may be required during the Phase II
Design Concept Study to determine how best to provide access to
adjacent properties. If properties would become landlocked by removing
the frontage roads a decision will have to be made to provide alternative
access or purchase access rights to the properties.
Traffic modeling evaluations determined that the existing diamond TI
will function adequately by widening Valencia Road to provide three
through lanes and dual left turn lanes in each direction. The increase in
the width of Valencia Road will require the replacement of the existing
I-10 bridges.
As discussed below, System Alternatives I, II and IV show the Craycroft
Road eastbound exit ramp is relocated westerly to west of Valencia
Road and crosses Valencia Road at grade and separates from the
Valencia Road entrance ramp east of Valencia Road.. The Craycroft
Road westbound entrance ramp is relocated westerly to just east of
Valencia Road where it merges with the Valencia westbound exit ramp
and continues across Valencia Road at grade and joins the Valencia
Road westbound entrance ramp.
I-10/Craycroft Road TI (MP 268.08) The existing tight diamond type TI has four ramps that provide full
access between I-10 and Craycroft Road. See sheets 8 and 9 of 2040
Improvements – System Alternatives I, II and IV in Appendix C, D and
E. There are commercial properties in three of the four quadrants of the
TI, including the TTT truck stop in the northwest quadrant. The four-
span I-10 overpass structures accommodate two lanes in each direction
on the crossroad.
There are eastbound and westbound frontage roads between the
Craycroft Road and Wilmot Road TIs. There are no access driveways
onto the eastbound frontage road. There are a few access driveways onto
the westbound frontage road near Wilmot Road. The frontage roads will
be removed. Further study may be required during the Phase II Design
Concept Study to determine how best to provide access to adjacent
properties. It may be feasible to relocate these accesses to Wilmot Road.
If properties would become landlocked by removing the frontage roads a
decision will have to be made to provide alternative access or purchase
access rights to the properties.
Due to the short distance between the Valencia Road and Craycroft
Road TIs, back-to-back diamond TIs with auxiliary lanes will not
function adequately, as the length of the auxiliary lanes will be too short.
Therefore, the eastbound exit and westbound entrance ramps for
Craycroft Road will be relocated westerly to just west of Valencia Road
to provide for the Craycroft ramps to merge with the Valencia ramps
and cross Valencia Road at grade.
Traffic modeling evaluations determined that the existing tight diamond
TI functions adequately, by providing two lanes and single left turn
lanes in each direction on Craycroft Road. The increase in crossroad
width will require the replacement of the existing I-10 bridges. The
westbound exit ramp will be realigned to improve the skew angle at the
crossroad.
The conceptual improvements will retain the tight diamond
configuration to minimize right-of-way acquisitions from the developed
properties. However, this restricts the distance between the ramp
terminals and limits left turn storage capacity. Further evaluation of
truck turning radii, required left turn storage, and other elements is
required during the Phase II Design Concept Study.
I-10/Wilmot Road TI (MP 269.36) The existing tight diamond type TI has four ramps that provide full
access between I-10 and Wilmot Road. See sheet 10 of 2040
Improvements – System Alternative I, II and IV in Appendix C, D and
E. The four-span I-10 overpass structure only accommodates two lanes
in each direction on the crossroad.
There are eastbound and westbound frontage roads between the Wilmot
Road and Kolb Road TIs. There are no access driveways onto the
eastbound frontage road. There are a few access driveways onto the
westbound frontage road for utility facilities. It is intended to relocate
these access points to the local street system and remove both the
eastbound and westbound frontage roads. Further study may be required
during the Phase II Design Concept Study to determine how best to
provide access to adjacent properties.
Traffic modeling evaluations determined that the existing tight diamond
TI functions adequately, by providing two lanes in each direction on
Wilmot Road with a single left turn lane for the south to east movement
and a double left turn lane for the north to west movement. The increase
in crossroad width will require the replacement of the existing I-10
bridges. All ramps will be realigned to improve the skew angles at the
crossroad.
The conceptual improvements will retain the TI in a tight configuration
to minimize right-of-way acquisitions. However, this restricts the
distance between the ramps and internal left turn storage. Further
evaluation of truck turning radii, required left turn storage, and other
elements is required during the Phase II Design Concept Study.
I-10/Kolb Road TI (MP 270.58) The existing spread diamond type TI has four ramps that provide full
access between I-10 and Kolb Road. See sheet 11 of 2040
I-10; Jct. I-19 to SR 83 & SR 210; Golf Links Road to I-10 Feasibility Report Update
43
Improvements – System Alternatives I, II and IV in Appendix C, D and
E.
The I-10 CD roadways utilized in System Alternative IV terminate
within the limits of the Kolb Road TI.
The PAG identified improvements to Kolb Road as a needed but
unfunded improvement south of I-10. The improvement would extend
Kolb Road to the south of I-10 and tie it into Wilmot Road. Kolb Road
will then be identified as a Parkway and will be one of four continuous
major north-south arterials/parkways from south of I-10 into central and
north Tucson that does not encounter a physical obstacle, such as the
UPRR switching yard and Davis Monthan AFB. The I-10/Kolb Road TI
is a major connector for traffic from the southeast part of the Tucson
Metropolitan area to access downtown Tucson via I-10 and north
Tucson via Kolb Road. The major traffic movements at the TI are shown
in Appendix B.
The combination of heavy through volumes on Kolb Road and heavy
opposing turn volumes will create significant operational problems.
Initial traffic modeling evaluations were performed with different types
of TIs; diamond, single point urban (SPUI), and divergent diamond.
None of these resolved the operational problems; particularly due to the
projected heavy through volumes on Kolb Road. Finally, a diverging
diamond TI with separate roadways for through traffic was developed
and evaluated. It was determined that it functioned with a typical LOS of
A. With this configuration, the Kolb Road mainline roadways are
separated from the Kolb Road ramp connections. The ramp connections
tie into a separate roadway that crosses I-10 and is centered between the
northbound and southbound Kolb Road roadways. I-10 remains at
ground level. The Kolb Road mainline roadways and the centered
roadway that connects to the I-10 ramps are one level above I-10. The
separated northbound and southbound mainline Kolb Road roadways
carry only through traffic. Turning movements are restricted to the
center roadway. Therefore, the turning movements do not interfere with
the through movements. All ramps that connect to the center roadway
are standard diamond type ramps.
East of Kolb Road, a two-way frontage road serves properties along the
south side of I-10. The west end of the frontage road intersects Kolb
Road approximately 300-ft. south of the existing ramp intersection. The
frontage road parallels I-10 and ends approximately 7,000-ft. (1.3 miles)
east of Kolb Road.
To retain the two-way frontage road and avoid new right-of-way, I-10 is
shifted to the north. This also allows for the retention of the access point
onto Kolb Road. However, due to the new interchange configuration, a
new south connector is required to provide full access to/from the
frontage road. The connector intersects with the center roadway, but
passes under the northbound Kolb Road mainline roadway in a two-lane
box structure. Additional access for the two-way frontage road could be
established by the City of Tucson on the east end by extending Pantano
Road north to the frontage road.
The ramp connector roadways and Kolb Road mainline roadways merge
just south of IBM Road, a significant east-west arterial. Further
evaluation is needed in the Phase II Design Concept Study to provide
turning movements between Kolb Road and IBM Road.
I-10/Rita Road TI (MP 273.14) The existing spread diamond TI has four ramps that provide full access
between I-10 and Rita Road. See sheet 13 of 2040 Improvements –
System Alternatives I, II and IV in Appendix C, D and E. The four-
span bridge over I-10 has piers next to I-10 edges of pavement that are
in conflict with I-10 widening (either closed or open median). Ramp
geometry does not meet current design criteria. The TI will be revised to
a standard diamond TI to improve geometrics. The ramps will be
realigned to improve skew angles at the crossroad.
The increase in crossroad width along with the conflicts with existing
bridge pier locations will require the replacement of the bridge over
I-10.
Traffic modeling evaluations determined that the reconfigured diamond
interchange functions adequately by providing three lanes and dual left
turns in each direction on Rita Road.
I-10/Houghton Road TI (MP 275.49) The existing spread diamond type interchange has four ramps that
provide full access between I-10 and Houghton Road. See sheet 15 of
2040 Improvements – System Alternatives I, II and IV in Appendix C,
D and E. The four-span bridge over I-10 has piers next to I-10 edges of
pavement that are in conflict with I-10 widening (either closed or open
median). Ramp geometry does not meet current design criteria.
Houghton Road is one of four continuous major north-south
arterials/parkways from south of I-10 into central and north Tucson that
does not encounter a physical obstacle, such as the UPRR switching
yard and Davis Monthan AFB. The I-10/Houghton Road TI is a major
connector for traffic from the southeast part of the Tucson Metropolitan
area to access downtown Tucson via I-10 and east Tucson via Houghton
Road. Recommended improvements at the interchange are:
The interchange will be revised to a diverging diamond interchange
to improve geometrics. The northbound and southbound through
roadways will cross at the ramp terminals on both sides of I-10, thus
reversing the direction of the through roadways within the limits of
the TI. The ramps will be realigned to improve skew angles at the
crossroad.
The increase in crossroad width along with the conflicts with
existing bridge pier locations will require the replacement of the
bridge over I-10.
Traffic modeling evaluations determined that the diverging diamond
interchange functions adequately by providing three lanes and dual left
turns in each direction on Houghton Road.
Pima County has requested that Houghton Road be realigned to roughly
follow the section line as shown in the plan sheets in Appendix C, D
and E. This will be evaluated in the Phase II Design Concept Study.
I-10/ Colossal Cave / Wentworth Road TI (MP 279.37) The existing spread diamond TI has four ramps that provide full access
between I-10 and Colossal Cave/Wentworth Road. See sheet 18 of 2040
Improvements – System Alternatives I, II and IV in Appendix C, D and
E. The TI is located where I-10 has an extra wide median, resulting in
two bridges over I-10. Both of the three-span bridges have piers next to
I-10 edges of pavement that are in conflict with I-10 widening. Ramp
geometry does not meet current design criteria.
The TI will be revised to a standard diamond TI to improve geometrics.
The wider crossroad width along with the pier issue will require the
replacement of both bridges over I-10. The crossroad will be realigned
to improve skew angles with the ramps.
Traffic modeling evaluations determined that the reconfigured diamond
TI functions adequately by providing two lanes and left turns in each
direction on Colossal Cave/Wentworth Road.
The frontage road along the north side of I-10 in the vicinity of the
Colossal Cave/Wentworth Road will be reconstructed to align with the
future local street network.
There are horizontal curves in the crossroad to the south that may impact
the alignment of Colossal Cave/Wentworth Road. Horizontal alignment
alternatives will be identified and evaluated during the Phase II Design
Concept Study.
I-10/ SR 83 TI (MP 281.68) The existing trumpet TI has four ramps that provide full access between
I-10 and SR 83. See sheet 20 of 2040 Improvements – System
Alternatives I, II and IV in Appendix C, D and E. The four-span bridge
has piers next to I-10 edges of pavement that are in conflict with I-10
widening, especially for outside widening. Ramp geometry does not
meet current design criteria. The connection of the existing two-way
frontage road to the trumpet ramp does not meet current design criteria.
I-10; Jct. I-19 to SR 83 & SR 210; Golf Links Road to I-10 Feasibility Report Update
44
Indications from stakeholders are that future development north of I-10
will be occurring in the near future. The existing trumpet interchange
does not provide for extending the crossroad to the north and using the
existing connector to the frontage road is inappropriate. Therefore, the
interchange will be revised to a standard diamond TI to provide access
to the north and to improve ramp geometrics. Northbound SR 83 to
westbound I-10 traffic will be converted from the free-flow trumpet
ramp to a left turn onto a standard diamond ramp. The crossroad will be
extended north of the TI; the extent to be determined during the Phase II
Design Concept Study.
Traffic modeling evaluations determined that the reconfigured diamond
TI functions adequately by providing two lanes and left turns in each
direction on SR 83. The use of dual northbound left turns keeps
northbound SR 83 traffic flowing at LOS B. To eliminate the dual left
turns, a flyover ramp would be needed.
The existing two-way frontage road on the north side of I-10 on both the
east and west side of SR 83 will be removed and relocated to align with
the future local street network.
The existing two-way frontage road in the southwest quadrant will be
shifted to provide proper offset from eastbound I-10. The frontage road
will also be extended to tie into SR 83 opposite the Old SR 83 roadway
to create a new intersection. Realignment of the frontage road will
require new right-of-way.
3.4 Alternatives for Further Consideration As discussed in Section 3.2 of this Feasibility Report, it has been
determined that System Alternatives III, IIIa, IIIb and IIIc are eliminated
and will not be carried forward for further study.
System Alternative IV was identified to provide CD roadways between
Alvernon Way and Kolb Road to improve access between I-10 and SR
210 and to extend the improved access between I-10 and the local street
system easterly. System Alternative IV is described in Section 3.2 of
this report.
Therefore, to summarize:
Three alternatives will be carried forward to the Phase II Design
Concept Study for further consideration:
I-10/SR 210 System Alternative I
I-10/SR 210 System Alternative II
I-10/SR 210 System Alternative IV
Additional analysis of all alternatives being carried forward will be
required during the Phase II Design Concept Study.
The weaving distance along I-10 between the I-19 ramps and 6th
Avenue
is short. Consideration may be given to eliminating the I-10 ramps to
29th
Street and 22nd
Street.
Consideration may be given to including underpasses or overpasses of I-
10 at half-mile minor arterial or major collector streets in the
transportation planning to improve north/south connectivity in addition
to the connectivity provided at the traffic interchanges at one-mile major
arterial streets.
3.4.1 Evaluation Criteria As a result of input from the Study Team, Performance Measures have
been developed for evaluating the impact of alternative transportation
improvements during the Phase II Design Concept Study. The
Performance Measure Ranking percentages are as follows:
30% Transportation Performance
25% Financial/Economic Performance
15% Social Impact
15% Land Use/Economic Development Impacts
15% Environmental Impacts
I-10; Jct. I-19 to SR 83 & SR 210; Golf Links Road to I-10 Feasibility Report Update
45
4 MAJOR DESIGN FEATURES
4.1 Introduction This section describes the major design features used to develop and
evaluate alternatives to meet current and future traffic needs and
enhance safety and traffic operational features of I-10 and SR 210
including traffic interchanges and frontage roads.
The I-10/SR 210 improvement alternatives meet the design requirements
in the ADOT Roadway Design Guidelines and the 2004 AASHTO
Policy on Geometric Design of Highways and Streets. The
improvements to I-10 satisfy requirements for interstate highways as
contained in the AASHTO Policy on Design Standards Interstate
System.
4.2 Major Design Features 4.2.1 Design Controls
The following design controls were used for both I-10 and SR 210 in the
development of the alternatives:
Design Year: 2040
Design Speed
– I-10 and SR 210 Mainline (Urban): 65 mph
– I-10 and SR 210 Ramps – Service Interchange:
Main Body of Ramp: 50 mph
Parallel Exit Ramp: 60 mph
Parallel Entrance Ramp: 55 mph
Ramp at Crossroad: 35 mph
I-10 and SR 210 Ramps – System Interchange:
Main Body of Ramp: 55 mph
First Curve at Entrance: 55 mph
First Curve at Exit 65 mph
– I-10 and SR 210 Ramps (At Crossroads): 35 mph
– Crossroads through Interchange: 40 mph
If the design speed of a crossroad outside the limits of an
interchange is greater than 40 mph the higher design speed
will be carried through the interchange.
(Crossroads classified as Parkways may have 50 mph design speed.)
Typical Sections:
– I-10 Mainline, I-10 Collector-Distributor Roadway and SR 210
Mainline:
Lane width: 12-feet
Shoulder width:
2 lanes in each direction:
Outside shoulder: 10-feet
Inside shoulder: 4-feet
3 or more lanes in each direction:
Outside shoulder: 12-feet*
Inside shoulder: 12-feet *
*Truck traffic DDHV is projected to exceed 250.
– Number of Through Lanes – I-10:
From I-19 to Kino Parkway:
Eastbound: 4-lanes
Westbound: 4-lanes
From Kino Parkway to SR 210 connection to I-10:
Eastbound: 3-lanes
Westbound: 3-lanes
From SR 210 connection to Valencia Road
System Alternative I:
Eastbound: 5-lanes
Westbound: 5-lanes
System Alternative II:
Eastbound: 5-lanes
Westbound: 5-lanes
System Alternative IV:
Eastbound: 3 mainline lanes + 2 CD lanes
Westbound: 3 mainline lanes + 2 CD lanes
From Valencia Road to Craycroft Road:
System Alternative I:
Eastbound: 5-lanes
Westbound: 5-lanes
System Alternative II:
Eastbound: 5-lanes
Westbound: 5-lanes
System Alternative IV;
Eastbound: 3 mainline lanes + 2 CD lanes
Westbound: 3 mainline lanes +2 CD lanes
From Craycroft Road to Wilmot Road:
System Alternative I:
Eastbound: 5-lanes
Westbound: 5-lanes
System Alternative II:
Eastbound: 5-lanes
Westbound: 5-lanes
System Alternative IV:
Eastbound: 3 mainline lanes + 2 CD lanes
Westbound 3 mainline lanes + 2 CD lanes
From Wilmot Road to Kolb Road:
System Alternative I:
Eastbound: 4-lanes
Westbound 5-lanes
System Alternative II:
Eastbound: 4-lanes
Westbound 5-lanes
System Alternative IV:
Eastbound: 3 mainline lanes + 2 CD lanes
Westbound: 3 mainline lanes + 2 CD lanes
From Kolb Road to Houghton Road
Eastbound: 4-lanes
Westbound: 4-lanes
From Houghton Road to Colossal Cave/Wentworth Road
Eastbound: 3-lanes
Westbound: 3-lanes
From Colossal Cave/Wentworth Road through SR 83:
Eastbound: 2-lanes
Westbound: 2-lanes
– Through Lanes for SR 210 with System Alternative I and System
Alternative IV:
Through the main body of SR 210 with System Alternative I
and System Alternative IV, the number of lanes will vary
from 2-lanes in each direction to 4-lanes in each direction.
(Note: Number of through lanes for SR 210 with System
Alternatives I and IV includes lanes for both Alvernon
Way local traffic and SR 210 traffic.)
– Through Lanes for SR 210 with System Alternative II:
Eastbound 2-lanes
Westbound 2-lanes
– Interchange Ramps (I-10 and SR 210):
All ramps shall be parallel type ramps. Two lane entrance ramps at
service interchanges will have dual-lane metering of traffic onto the
mainline.
1-Lane Directional Ramps:
Lane width: 12-feet
Left shoulder: 6-feet
Right shoulder: 10-feet
I-10; Jct. I-19 to SR 83 & SR 210; Golf Links Road to I-10 Feasibility Report Update
46
2-Lane Directional Ramps:
Lane width: 12-feet
Left shoulder: 4-feet
Right shoulder: 8-feet
1-Lane and 2-Lane Ramps:
Lane width: 12-feet
Left shoulder: 2-feet
Right shoulder: 8-feet
– Interchange Crossroads:
Crossroads will have raised curbs with 2-foot setback from the
outside lane edge.
Crossroads will have raised medians with 2-foot setback to the
median curb from the lane edge. Number of through lanes will
vary per agreement with local agency having jurisdiction.
Median width of crossroads within the ADOT R/W will be in
accordance with RDG Chapter 500.
Lane width: 12-feet
Slope Criteria:
– I-10 and SR 210:
Use ADOT RDG Figure 306.4B.
– Interchange Ramps:
Use ADOT RDG Figure 504.4A.
Note: East of Houghton Road the character of the area becomes less
urban, with large spacing between interchanges. During the DCR
phase a determination will be made as to whether I-10 will be
designed without curbs, using the rural configuration in accordance
with the RDG.
Roadway Cross-slope:
Roadway Cross-slope of tangent sections of new or
reconstructed roadways shall be 0.02‟/‟
Maximum Gradient (Urban):
– I-10 and SR 210 Mainline: 3%
– Interchange Ramps: Use ADOT RDG Section 504.1.
– Interchange Crossroads adjacent to ramp termini: 3%
Maximum Superelevation:
– I-10 and SR 210 Mainline (RDG Section 202): 0.06 ft/ft
– Interchange Ramps (RDG Section 504.3): 0.06 ft/ft
(Ramp curves should not have spirals, per RDG Section 504.2)
Maximum Degree of Curve:
– I-10 and SR 210 Mainline (RDG Table 202.3B): 3° 27‟
– I-10 and SR 210 Interchange Ramps (RDG Table 202.3B)
Circular curves will be used for ramp alignment.
Service Interchange:
Main Body of Ramp: 6° 53‟
Parallel Exit Ramp: 4° 18‟
Parallel Entrance Ramp: 5° 24‟
System Interchange:
Body of Ramp: 5° 24‟
First Curve at Entrance 5° 24‟
First Curve at Exit 3° 27‟
4.2.2 Access Control I-10 is an Interstate Freeway with full control of access along the
mainline roadways and through the full extent of all interchange ramps.
Existing SR 210 is a partial access controlled Parkway with access
breaks at major signalized intersections.
The extension of SR 210 is an Urban Access Controlled Freeway with
full control of access along the mainline roadways and through the full
extent of all interchange ramps.
The limits of access control managed by ADOT at interchange
crossroads will be in accordance with Section 506 of the ADOT
RDG.
Access control along interchange crossroads beyond the
requirements of Section 506 of the RDG will be implemented by
agreements with the local agencies having jurisdiction over the
crossroad. See Appendix F; Access Control Strategies at
Crossroads for access control concepts at interchange crossroads.
4.2.3 Horizontal and Vertical Alignments All elements of the I-10 and SR 210 improvements will comply with the
ADOT RDG and the AASHTO guidelines.
The existing horizontal alignment of the I-10 eastbound and westbound
mainlines will be retained when the improvements described herein are
implemented. It may be necessary to modify the vertical alignment to
accommodate vertical clearance requirements where new or widened
structures are added, or where it is necessary to reconstruct the existing
pavement. Additional through lanes will be added in some areas and
traffic interchanges will be modified. The determination of vertical
alignment of I-10 will be made during the Phase II Design Concept
Study and an Analysis Report for retained portions of both the vertical
and horizontal alignments will be prepared at that time.
4.2.4 Right-of-Way The existing ROW for I-10, including ROW for TI ramps and for
Frontage Roads will be used. It will be necessary to acquire additional
ROW where interchanges and frontage roads are being extensively
revised. The extent of new ROW will be defined during the Phase II
Design Concept Study process.
ROW required for revisions to the existing ROW corridor will be in
conformance with requirements of the ADOT RDG and AASHTO.
The minimum right-of-way width for the extension of SR 210 will be
10-feet beyond the catch line of the mainline or ramp roadway in
accordance with Figure 306.4B of the ADOT RDG.
4.2.5 Drainage Several major watercourse crossings exist within the study segment of
I-10 and the extension of SR 210, and will be addressed during the
Phase II Design Concept study.
1. Diversion Channel, EB (MP 262.82): single 85‟ span bridge.
2. Diversion Channel, WB (MP 262.82): single 85‟ span bridge.
3. Julian Wash (MP 265.80): 6 barrel, 74‟ total span Reinforced
Concrete Box Culvert (RCBC).
4. Earp Wash Tributary, WB Frontage Road (MP 267.65): four 25‟
span bridge.
5. Earp Wash Tributary, EB (MP 267.65): four 25‟ span bridge.
6. Earp Wash Tributary, WB (MP 267.65): four 25‟ span bridge.
7. Earp Wash Tributary, EB Frontage Road (MP 267.65): three 10‟
span bridge.
8. Wash, EB (MP 277.46): four 25‟ span bridge.
9. Wash, WB (MP277.90): four 25‟ span bridge.
10. Wash, North Frontage Road (MP 277.90): three 22‟ span bridge.
11. Wash, North Frontage Road (MP 279.10): 2 barrel, 21‟ total span
RCBC.
12. Julian Wash (FEMA Zone X) north of Valencia Road and south
of the UPRR tracks.
Numerous smaller drainage crossing facilities existing along the study
area will be addressed during the Phase II Design Concept Study.
Drainage investigation during the Phase II Design Concept Study will
include the evaluation of existing roadway drainage systems and
determinations as to whether the existing drainage facilities should be
modified to accommodate the roadway improvements or should be
replaced in their entirety.
4.2.6 Section 401 and 404 Permits Impacts to floodplains, water quality, or the sole source aquifer would
not be expected to have a major role in determining I-10 or SR 210
improvements.
I-10; Jct. I-19 to SR 83 & SR 210; Golf Links Road to I-10 Feasibility Report Update
47
Any widening of the I-10 mainline and new interchange ramps on the
north side of I-10 between Kino Parkway and Craycroft Road may
encroach on the 100-to-500-year Julian Wash floodplain. Drainage
analysis during design would be needed to determine the degree of
impacts. Primarily, impacts could be expected at Country Club Road
(new TI), Alvernon Way (expanded TI under System Alternative I and
System Alternative IV), and Swan Road (new TI under System
Alternative II). A jurisdictional delineation should be conducted during
final design to identify all Waters in the study area.
Julian Wash and several unnamed washes cross SR 210 in the study area
and may be regulated by the Corps.
Section 404 of the Clean Water Act regulates the placement of fill or
dredged material into Waters of the United States (Waters). The U. S.
Army Corps of Engineers (Corps) has regulatory jurisdiction of Waters.
A Section 401 Water Quality Certification, which is administered by the
Arizona Department of Environmental Quality, is required for any
action subject to Section 404; however, most projects that fall under a
Nationwide Permit are conditionally certified under Section 401.
Coordination with the EPA during design would need to occur relative
to sole source aquifer impacts. This study area is within the Upper Santa
Cruz & Avra Basin Sole Source Aquifer designated area.
ADOT Environmental Planning Group shall apply for all permits
required.
4.2.7 Floodplain Considerations Research of known flood hazard areas or local flooding problem areas
along or near existing I-10, and along or near the proposed extension of
SR 210 within the study limits included review of the most recent
Federal Emergency Management Agency (FEMA) Flood Insurance Rate
Maps (FIRMS), and discussions with City of Tucson and Pima County
personnel.
Offsite drainage affecting the segment of I-10 from I-19 to SR 83 is
characterized by washes flowing roughly parallel to I-10, from east-
southeast towards the west-northwest. Inspection of FEMA FIRMS in
the study area shows that several Special Flood Hazard Areas (SFHAS)
exist adjacent to I-10 along this corridor to include the following
locations:
1. East of Kino Parkway: Zone A, Tucson Diversion Channel
crossing of I-1.0
2. West of Palo Verde Road, Zone A, unnamed flooding area south
of I-10.
3. South of Valencia Road: Zone A, “1% Annual Chance Flood
Discharge Contained in Culvert.”
Within the SR 210 study area there is one FEMA SFHA; Julian Wash
(FEMA Zone X) south of Valencia Road and north of the UPRR tracks.
Discussions with City of Tucson and Pinal County personnel revealed
that they had no knowledge of additional local flooding problems within
the I-10 and SR 210 extension study corridors.
4.2.8 Geology The I-10 and SR 210 extension study corridors are located within the
Basin and Range physiographic province, and are characterized as broad
alluvial filled basins bounded by steeply dipping faults and fault-block
mountains. The corridor within the limits of this project is within the
Tucson Area (Upper Santa Cruz basin), which is a structural basin filled
with alluvium and bounded by mountains.
The Upper Santa Cruz basin has a broad and gently sloping valley floor,
generally trending north to northwest. Elevations in the basin range from
about 2,490-feet in downtown Tucson to about 3,500-feet at the east
edge of the basin near SR 83.
Geologic hazards along the I-10 study corridor include land subsidence
and earth fissures, soil shrink and swell potential, floods and
earthquakes.
Land subsidence and earth fissures are associated with the draw-
down of groundwater from the alluvial aquifers.
Soil shrink and swell is a potential hazard in areas of the alluvial fan
where sediment has been deposited from flood and mud flow events.
Flood hazards may exist in low lying portions of the alignment near
the stream channels. The I-10 alignment within the study area tends
to parallel stream channels instead of crossing the channels. Flood
hazards are therefore reduced to low lying portions of the alignment
adjacent to the stream channels.
Earthquake and seismic activity has been a low risk hazard in the
Santa Cruz basin area. The Seismicity Map of the State of Arizona
contains two events within 50 miles of the I-10/SR 210 study area.
The intensity was such that damage to manmade structures would
not be great.
Additional geotechnical information is available in the Materials
Investigation Report for the I-10 Corridor Study, Junction I-19 to
Pima/Cochise County Line prepared for ADOT.
4.2.9 Earthwork Most of existing I-10 within the study area is constructed on earthwork
embankments. Modifications to the I-10 mainline roadway, ramps and
frontage roads will require importing fill material.
The extension of SR 210 under System Alternative I or System
Alternative IV will be at-grade or above grade through the length of the
extension to the connection with I-10. Borrow will be required.
The extension of SR 210 under System Alternative II will be below
existing ground along the southern border of Davis Monthan AFB; then
will climb above ground to cross over the UPRR. The earthwork balance
is unknown at this time.
The extent of earthwork will be developed during the Design Concept
Study.
4.2.10 Traffic Design I-10
The existing service interchange at Palo Verde Road will be removed
and replaced with a new service interchange at Country Club Road to
improve spacing of traffic interchanges and improve connections to the
local street system.
All other I-10 service interchanges within the project limits will be
modified as described in Section 3, Alternatives Considered.
A system interchange will be developed at Alvernon Way if System
Alternative I or System Alternative IV is selected.
A system interchange will be developed west of Valencia Road if
System Alternative II is selected.
SR 210 Extension The existing SR 210/Alvernon Way/Golf Links Road connection
consists of a split interchange between Golf Links Road and Alvernon
Way plus a diamond interchange between SR 210 and Alvernon Way.
System Alternative I and System Alternative IV:
System Alternative I and System Alternative IV will reconfigure the
combined interchanges to extend SR 210 to a system interchange
with I-10 at Alvernon Way. The interchange between SR 210 and
Golf Links Road/Alvernon Way will be reconfigured with
interchange connections with SR 210, Golf Links Road and
Alvernon Way as shown in Appendix C and E.
A diamond interchange will connect Ajo Way with extended SR
210.
System Alternative II:
System Alternative II will extend SR 210 east to a system
interchange with I-10 approximately one-half mile west of Valencia
Road.
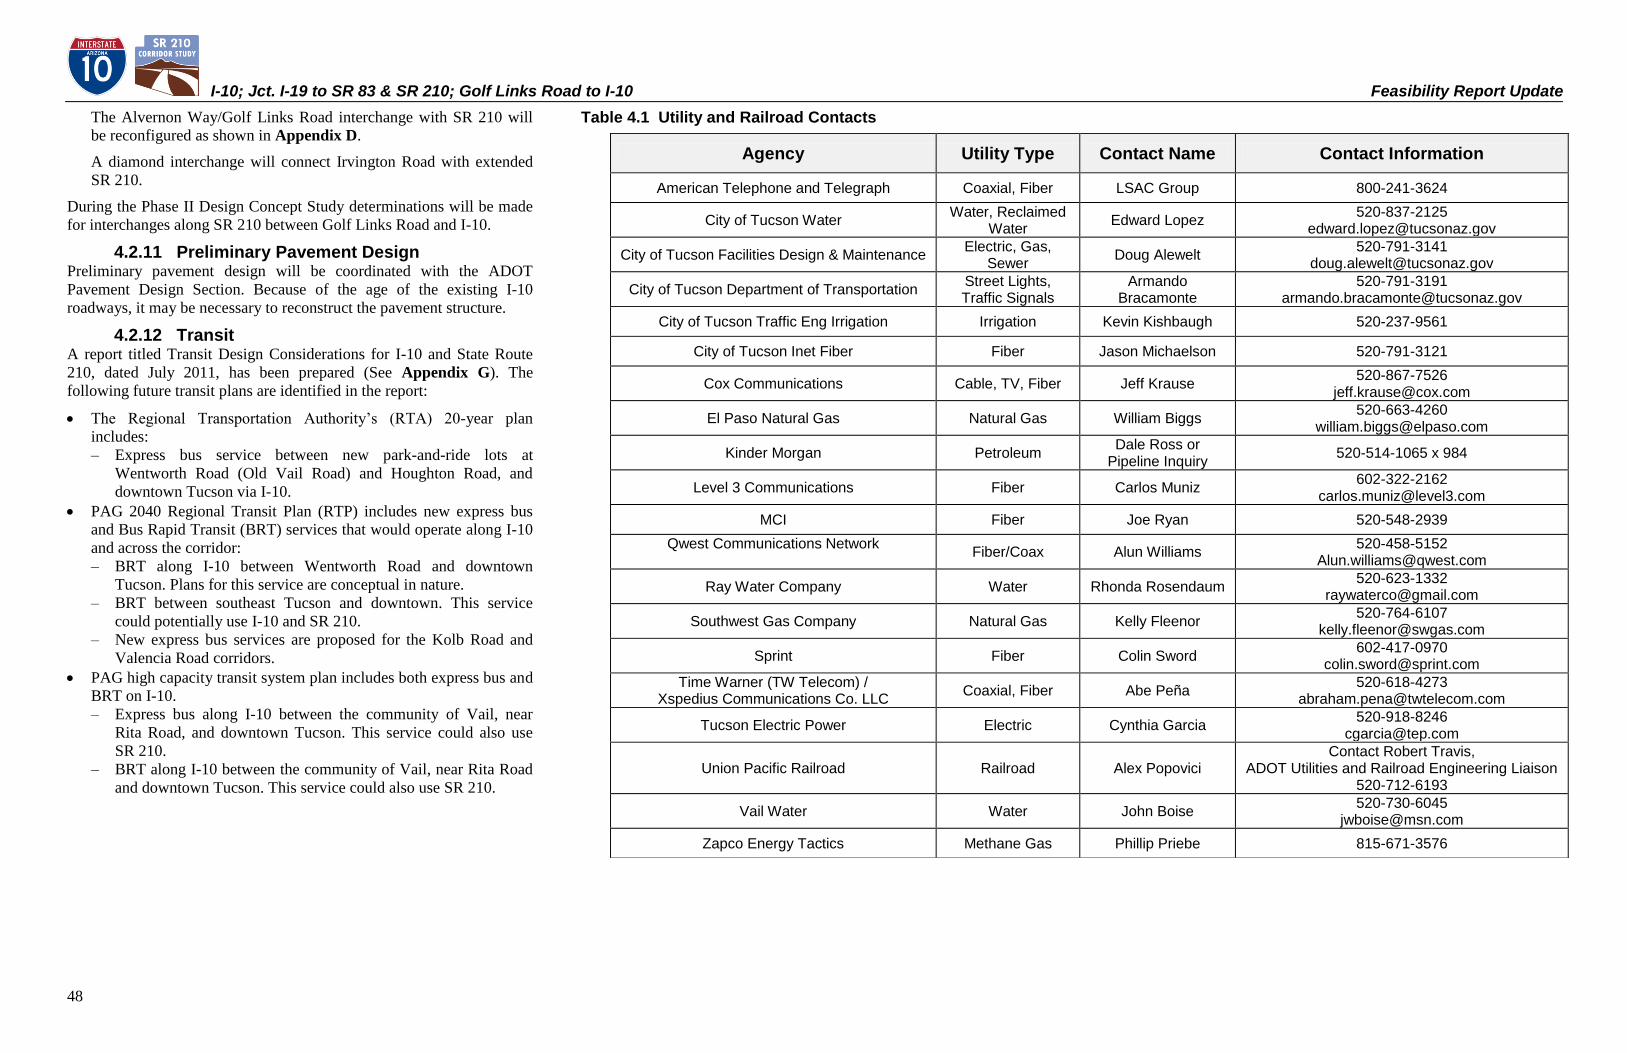
I-10; Jct. I-19 to SR 83 & SR 210; Golf Links Road to I-10 Feasibility Report Update
48
The Alvernon Way/Golf Links Road interchange with SR 210 will
be reconfigured as shown in Appendix D.
A diamond interchange will connect Irvington Road with extended
SR 210.
During the Phase II Design Concept Study determinations will be made
for interchanges along SR 210 between Golf Links Road and I-10.
4.2.11 Preliminary Pavement Design Preliminary pavement design will be coordinated with the ADOT
Pavement Design Section. Because of the age of the existing I-10
roadways, it may be necessary to reconstruct the pavement structure.
4.2.12 Transit A report titled Transit Design Considerations for I-10 and State Route
210, dated July 2011, has been prepared (See Appendix G). The
following future transit plans are identified in the report:
The Regional Transportation Authority‟s (RTA) 20-year plan
includes:
– Express bus service between new park-and-ride lots at
Wentworth Road (Old Vail Road) and Houghton Road, and
downtown Tucson via I-10.
PAG 2040 Regional Transit Plan (RTP) includes new express bus
and Bus Rapid Transit (BRT) services that would operate along I-10
and across the corridor:
– BRT along I-10 between Wentworth Road and downtown
Tucson. Plans for this service are conceptual in nature.
– BRT between southeast Tucson and downtown. This service
could potentially use I-10 and SR 210.
– New express bus services are proposed for the Kolb Road and
Valencia Road corridors.
PAG high capacity transit system plan includes both express bus and
BRT on I-10.
– Express bus along I-10 between the community of Vail, near
Rita Road, and downtown Tucson. This service could also use
SR 210.
– BRT along I-10 between the community of Vail, near Rita Road
and downtown Tucson. This service could also use SR 210.
Table 4.1 Utility and Railroad Contacts
Agency Utility Type Contact Name Contact Information
American Telephone and Telegraph Coaxial, Fiber LSAC Group 800-241-3624
City of Tucson Water Water, Reclaimed
Water Edward Lopez
520-837-2125 [email protected]
City of Tucson Facilities Design & Maintenance Electric, Gas,
Sewer Doug Alewelt
520-791-3141 [email protected]
City of Tucson Department of Transportation Street Lights, Traffic Signals
Armando Bracamonte
520-791-3191 [email protected]
City of Tucson Traffic Eng Irrigation Irrigation Kevin Kishbaugh 520-237-9561
City of Tucson Inet Fiber Fiber Jason Michaelson 520-791-3121
Cox Communications Cable, TV, Fiber Jeff Krause 520-867-7526
El Paso Natural Gas Natural Gas William Biggs 520-663-4260
Kinder Morgan Petroleum Dale Ross or
Pipeline Inquiry 520-514-1065 x 984
Level 3 Communications Fiber Carlos Muniz 602-322-2162
MCI Fiber Joe Ryan 520-548-2939
Qwest Communications Network
Fiber/Coax Alun Williams 520-458-5152
Ray Water Company Water Rhonda Rosendaum 520-623-1332
Southwest Gas Company Natural Gas Kelly Fleenor 520-764-6107
Sprint Fiber Colin Sword 602-417-0970
Time Warner (TW Telecom) / Xspedius Communications Co. LLC
Coaxial, Fiber Abe Peña 520-618-4273
Tucson Electric Power Electric Cynthia Garcia 520-918-8246
Union Pacific Railroad Railroad Alex Popovici Contact Robert Travis,
ADOT Utilities and Railroad Engineering Liaison 520-712-6193
Vail Water Water John Boise 520-730-6045
Zapco Energy Tactics Methane Gas Phillip Priebe 815-671-3576
I-10; Jct. I-19 to SR 83 & SR 210; Golf Links Road to I-10 Feasibility Report Update
49
4.2.13 Utilities and Rail Facilities Table 4.1 lists Utility and Railroad contacts.
Union Pacific Railroad (UPRR):
– I-10 crosses the UPRR Nogales Subdivision tracks at MP
268.12.
– The UPRR is located to the east of Alvernon Way and
approaches I-10 from the north and turns to the east just north of
I-10. The I-10 right-of-way line is parallel to and 42-feet south of
the UPRR right-of-way line from approximate MP 265.25 to MP
265.55. I-10 then turns to the southeast and separates from the
UPRR by approximately three-quarters of a mile.
– The extension of SR 210 with System Alternative I and System
Alternative IV crosses over the UPRR south of the
Alvernon/Golf Links Road TI.
– The extension of SR 210 with System Alternative II crosses over
the UPRR and the TEP Spur along the Swan Road alignment.
4.2.14 Design Exceptions During the Phase II Design Concept Study an AASHTO Controlling
Design Criteria Report will be prepared. An Analysis Report for any
portions of the existing vertical and horizontal alignments that will be
retained will be included in the AASHTO Controlling Design Criteria
Report. At this time no design exceptions are anticipated for the I-10 or
SR 210 improvements.
I-10; Jct. I-19 to SR 83 & SR 210; Golf Links Road to I-10 Feasibility Report Update
50
5 ENVIRONMENTAL OVERVIEW SUMMARY AND PUBLIC INVOLVEMENT 5.1 Introduction The Environmental Overview (EO) has been updated to expand the
analysis of one of the alternatives previously considered and to add a
new alternative for consideration. The updated EO conducted in
conjunction with preparation of the Feasibility Study Update is
summarized in the following paragraphs. The complete EO is contained
in Appendix H.
I-10 (Junction I-19 to SR 83)
The evaluation of the socioeconomic environment, physical and natural
resources, cultural resources, and regulatory requirements conducted for
I-10 indicates the proposed improvements from I-19 to SR 83 have no
fatal flaws. The proposed improvements are located largely in or near
the existing I-10 ROW. Impacts could occur with the TI connections to
I-10 with SR 210; however, those impacts are moderate, with residential
displacements unlikely, few business displacements, and limited impact
on cultural resources. Natural or physical resource impacts would be
expected with widening and TI reconfigurations in the rural segment of
the corridor.
The loss of vegetation, widening of drainage structures, and general
addition of more travel lanes could be expected to affect wildlife. A
broad area from Houghton Road east beyond SR 83 has been identified
by the USFWS, the AGFD, Pima County, and the City of Tucson as
important to wildlife movement and/or conservation of plant and animal
species. Project development in DCR/EA phase has an opportunity to
work with the agencies to avoid or mitigate natural resource impacts.
Noise impacts typical to interstate widening or TI reconstruction appear
to have mitigation options. The preparation of a noise report during the
DCR/EA phase would identify specific areas affected. Changes in
access or cross streets would require continued coordination with the
local jurisdictions to minimize impacts.
SR 210 (Golf Links Road to I-10)
The evaluation of the socioeconomic environment, physical and natural
resources, cultural resources, and regulatory requirements conducted for
SR 210 indicates the extension from Golf Links Road to a connection
with I-10 has some substantive environmental issues. The issues related
to the System III, IIIa and IIIb alternatives (100 year floodplain impacts,
close proximity to two public schools, potential environmental justice
issue related to the community of Littletown, direct impact on a Section
4[f] resource and impacts related to DMAFB) resulted in dropping those
alternatives from further consideration in this Feasibility Study.
Upon further analysis of operational, cost and environmental factors,
System Alternative IIIc was eliminated.
The System IV alternative follows the same alignment as System I, and
adds CD roadways adjacent to both eastbound and westbound I-10.
The issues related to the System I, II and IV alternatives, while notable
with regard to economic impacts, would not be considered a fatal flaw
resulting in a recommendation to not extend SR 210.
The greatest impacts to the SR 210 study corridor would be in the form
of potential business displacements and changes in access for the
System I, System II and System IV alternatives. A single residential
parcel containing three homes in the midst of industrial zoning could be
displaced by all three alternatives. System alternatives I and IV could
require relocation of approximately 15 to 20 businesses and access
changes to several others, while the System II alternative could require
30 to 40 business relocations and other access changes. Additionally the
system II alternative may also encroach on DMAFB property. During
the DCR/EA phase, additional evaluation would be needed to determine
actual impacts, and input from the public/stakeholders should be
considered in the development of design options to minimize impacts on
businesses.
5.2 Coordination The Feasibility Study and the EO for I-10 (Junction I-19 to State Route
83) and SR 210 (Golf Links Road to Eastern Terminus) were conducted
in concert. Coordination with stakeholder agencies and team progress
meetings were jointly held throughout the process.
Agency/Stakeholder Coordination The project kickoff meeting was held on July 21, 2010, at the City of
Tucson Fire Central Station. Participants included representatives from:
FHWA
ADOT
PAG
Pima County Department of Transportation
Cochise County Highway and Flood Control Departments
City of South Tucson
The need for further evaluation of System Alternative IIIc and the
introduction of System Alternative IV resulted in beginning the
Feasibility Study Update January 27, 2014.
Team meetings resumed in 2014 including the above mentioned
participants plus the following participant agencies:
City of Tucson
Sun Tran
DMAFB
U.S. Customs and Border Protection
UPRR
The meetings were chaired by the ADOT Project Manager and Jacobs
Engineering Group Inc. Agenda items were varied for each meeting,
with a focus on soliciting input from the stakeholders. Presentations to
the stakeholders provided data and graphics depicting existing
conditions, LOS, operational issues, traffic modeling/forecasts,
alternatives development, and environmental resource issues. Early
discussions included the potential to enlarge the SR 210 study corridor
farther west. The corridor was shifted west to Palo Verde Road.
Preliminary traffic analysis indicated that connection locations west of
Alvernon Way would not generate substantive traffic relief on I-10;
therefore, no alternatives using Palo Verde Road were developed.
Several stakeholder-focused discussions supplemented the monthly
meetings, including:
Sun Tran – August 22, 2010
Utility Companies – September 27, 2010
AGFD – November 11, 2010
UPRR – March 9, 2011
PAG – April 6, 2011, April 7, 2014, and October 15, 2014
(presentation to Transportation Planning Committee)
DMAFB, PAG, and Pima County DOT – March 14, 2012
(Discussion of System IIIa, IIIb and IIIc alternatives)
Pima County DOT – January 14 and 21, 2014 and July 30, 2014
City of Tucson – March 6, 2014
All Feasibility Study materials were made available on the project
website at www.jacobsaz.com.
Public Involvement A Public Information Meeting was held October 6, 2011 at the Holiday
Inn Hotel and Suites, 4550 S. Palo Verde Road, Tucson, AZ. The format
of the meeting was an open house with an informational video. System
Alternatives I, II were displayed for public view.
Approximately seventy people attended the meeting. The following
public agencies were represented at the meeting: FHWA, ADOT, Pima
County, PAG, RTA, DMAFB, City of Tucson. Two news stations
covered the meeting: Fox News 11 and KVOA News 4.
I-10; Jct. I-19 to SR 83 & SR 210; Golf Links Road to I-10 Feasibility Report Update
51
6 COST ESTIMATES Preliminary cost estimates based on conceptual plans have been
prepared for System Alternative I, System Alternative II and System
Alternative IV that will be carried into the Phase II Design Concept
Study. The estimates are based on data available at the Feasibility Study
level of development.
The estimate items and the basis for the estimated cost of each item for
I-10 and SR 210 improvements are summarized below.
Mainline per Lane Mile – 6” AB + 10” PCCP + ½” AR-ACFC
for 12’ lanes + Striping (tape) and RPM. (Lane miles include
travel lanes plus 12-ft. outside shoulders and 12-ft. median
shoulders)
Crossroad Urban (5 lanes) per Lin. Ft. – includes 5-lanes each
direction, curb & gutter both sides, 6’ sidewalk both sides,
drainage
Crossroad Urban (4 lanes) per Lin. Ft. – includes 4-lanes each
direction, curb & gutter both sides, 6‟sidewalk both sides, drainage
Signalized Intersection per Each - includes signals on 4 legs,
signs, miscellaneous
Ramps and Frontage Roads per Lane per Lin. Ft. – includes
curb & gutter or concrete half barrier on both sides
Bridge per Sq. Ft. – estimated average cost
PCCP Ramp Removal - Lump Sum - estimated cost based on
approximate quantity of PCCP, AB, curb
AC Ramp Removal – Lump Sum – estimated cost based on
approximate quantity of AC and AB
Bridge Removal – Lump Sum - estimated cost
Retaining Wall per Sq. Ft. - estimated cost
Borrow per Cu. Yd. – estimated cost
Commercial Building Removal per Each - estimated cost
Residential Building Removal per Each - estimated cost
Pavement Drainage per Centerline Mile - based on estimated
quantity of excavation, riprap, channel lining, pipe, catch basins,
inlets, misc. items per mile
Roadway Lighting per Centerline Mile – based on estimated cost
per mile for similar project
Roadway Signs per Centerline Mile - based on estimated cost
per mile for similar project
FMS per Centerline Mile - based on estimated cost per mile for
similar project
Landscaping per Centerline Mile – based on estimated cost per
mile for similar project
Enclosed Median per Centerline Mile - includes median
embankment and Concrete Median Barrier
Outside Curb & Gutter per Centerline Mile – based on
estimated cost per mile for similar project
Outside Concrete Barrier per Centerline Mile – based on
estimated cost per mile for similar project
Total Estimated Cost The total estimated costs for System Alternative I, II and IV are listed
below. The costs exclude the cost of utilities and ROW. The amount of
ROW to be acquired, in acres, is listed separately.
System Alternative I
I-10 $691,100,000
SR 210 $194,940,000
System Alternative I Total $886,040,000
System Alternative I ROW – 196 acres required
System Alternative II
I-10 $671,270,000
SR 210 $171,200,000
System Alternative II Total $842,470,000
System Alternative II ROW – 337 acres required
System Alterative IV
I-10 $761,590,000
SR 210 $193,650,000
System Alternative IV Total $955,240,000
System Alternative IV ROW - 192 acres required
A more detailed breakdown of the costs associated with System
Alternatives I, II and IV has been provided on the following pages.
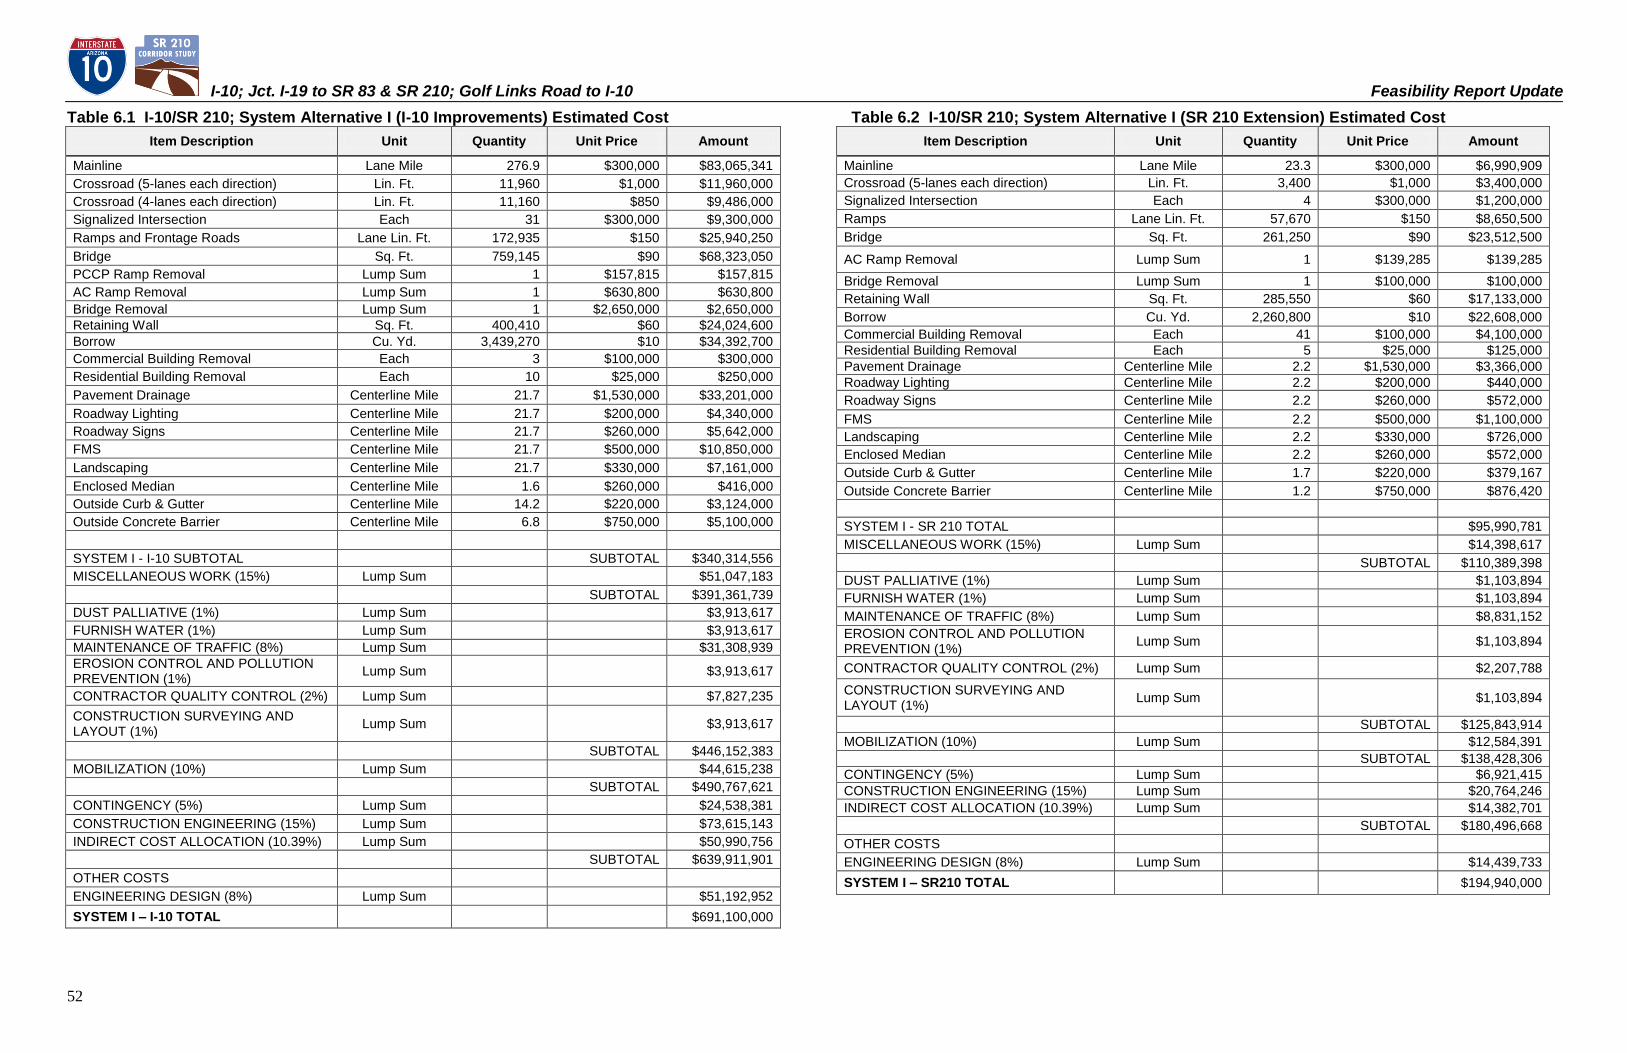
I-10; Jct. I-19 to SR 83 & SR 210; Golf Links Road to I-10 Feasibility Report Update
52
Table 6.1 I-10/SR 210; System Alternative I (I-10 Improvements) Estimated Cost Item Description Unit Quantity Unit Price Amount
Mainline Lane Mile 276.9 $300,000 $83,065,341
Crossroad (5-lanes each direction) Lin. Ft. 11,960 $1,000 $11,960,000
Crossroad (4-lanes each direction) Lin. Ft. 11,160 $850 $9,486,000
Signalized Intersection Each 31 $300,000 $9,300,000
Ramps and Frontage Roads Lane Lin. Ft. 172,935 $150 $25,940,250
Bridge Sq. Ft. 759,145 $90 $68,323,050
PCCP Ramp Removal Lump Sum 1 $157,815 $157,815
AC Ramp Removal Lump Sum 1 $630,800 $630,800
Bridge Removal Lump Sum 1 $2,650,000 $2,650,000
Retaining Wall Sq. Ft. 400,410 $60 $24,024,600
Borrow Cu. Yd. 3,439,270 $10 $34,392,700
Commercial Building Removal Each 3 $100,000 $300,000
Residential Building Removal Each 10 $25,000 $250,000
Pavement Drainage Centerline Mile 21.7 $1,530,000 $33,201,000
Roadway Lighting Centerline Mile 21.7 $200,000 $4,340,000
Roadway Signs Centerline Mile 21.7 $260,000 $5,642,000
FMS Centerline Mile 21.7 $500,000 $10,850,000
Landscaping Centerline Mile 21.7 $330,000 $7,161,000
Enclosed Median Centerline Mile 1.6 $260,000 $416,000
Outside Curb & Gutter Centerline Mile 14.2 $220,000 $3,124,000
Outside Concrete Barrier Centerline Mile 6.8 $750,000 $5,100,000
SYSTEM I - I-10 SUBTOTAL SUBTOTAL $340,314,556
MISCELLANEOUS WORK (15%) Lump Sum $51,047,183
SUBTOTAL $391,361,739
DUST PALLIATIVE (1%) Lump Sum $3,913,617
FURNISH WATER (1%) Lump Sum $3,913,617
MAINTENANCE OF TRAFFIC (8%) Lump Sum $31,308,939
EROSION CONTROL AND POLLUTION PREVENTION (1%)
Lump Sum $3,913,617
CONTRACTOR QUALITY CONTROL (2%) Lump Sum $7,827,235
CONSTRUCTION SURVEYING AND LAYOUT (1%)
Lump Sum $3,913,617
SUBTOTAL $446,152,383
MOBILIZATION (10%) Lump Sum $44,615,238
SUBTOTAL $490,767,621
CONTINGENCY (5%) Lump Sum $24,538,381
CONSTRUCTION ENGINEERING (15%) Lump Sum $73,615,143
INDIRECT COST ALLOCATION (10.39%) Lump Sum $50,990,756
SUBTOTAL $639,911,901
OTHER COSTS
ENGINEERING DESIGN (8%) Lump Sum $51,192,952
SYSTEM I – I-10 TOTAL $691,100,000
Table 6.2 I-10/SR 210; System Alternative I (SR 210 Extension) Estimated Cost Item Description Unit Quantity Unit Price Amount
Mainline Lane Mile 23.3 $300,000 $6,990,909
Crossroad (5-lanes each direction) Lin. Ft. 3,400 $1,000 $3,400,000
Signalized Intersection Each 4 $300,000 $1,200,000
Ramps Lane Lin. Ft. 57,670 $150 $8,650,500
Bridge Sq. Ft. 261,250 $90 $23,512,500
AC Ramp Removal Lump Sum 1 $139,285 $139,285
Bridge Removal Lump Sum 1 $100,000 $100,000
Retaining Wall Sq. Ft. 285,550 $60 $17,133,000
Borrow Cu. Yd. 2,260,800 $10 $22,608,000
Commercial Building Removal Each 41 $100,000 $4,100,000
Residential Building Removal Each 5 $25,000 $125,000
Pavement Drainage Centerline Mile 2.2 $1,530,000 $3,366,000
Roadway Lighting Centerline Mile 2.2 $200,000 $440,000
Roadway Signs Centerline Mile 2.2 $260,000 $572,000
FMS Centerline Mile 2.2 $500,000 $1,100,000
Landscaping Centerline Mile 2.2 $330,000 $726,000
Enclosed Median Centerline Mile 2.2 $260,000 $572,000
Outside Curb & Gutter Centerline Mile 1.7 $220,000 $379,167
Outside Concrete Barrier Centerline Mile 1.2 $750,000 $876,420
SYSTEM I - SR 210 TOTAL $95,990,781
MISCELLANEOUS WORK (15%) Lump Sum $14,398,617
SUBTOTAL $110,389,398
DUST PALLIATIVE (1%) Lump Sum $1,103,894
FURNISH WATER (1%) Lump Sum $1,103,894
MAINTENANCE OF TRAFFIC (8%) Lump Sum $8,831,152
EROSION CONTROL AND POLLUTION PREVENTION (1%)
Lump Sum $1,103,894
CONTRACTOR QUALITY CONTROL (2%) Lump Sum $2,207,788
CONSTRUCTION SURVEYING AND LAYOUT (1%)
Lump Sum $1,103,894
SUBTOTAL $125,843,914
MOBILIZATION (10%) Lump Sum $12,584,391
SUBTOTAL $138,428,306
CONTINGENCY (5%) Lump Sum $6,921,415
CONSTRUCTION ENGINEERING (15%) Lump Sum $20,764,246
INDIRECT COST ALLOCATION (10.39%) Lump Sum $14,382,701
SUBTOTAL $180,496,668
OTHER COSTS
ENGINEERING DESIGN (8%) Lump Sum $14,439,733
SYSTEM I – SR210 TOTAL
$194,940,000
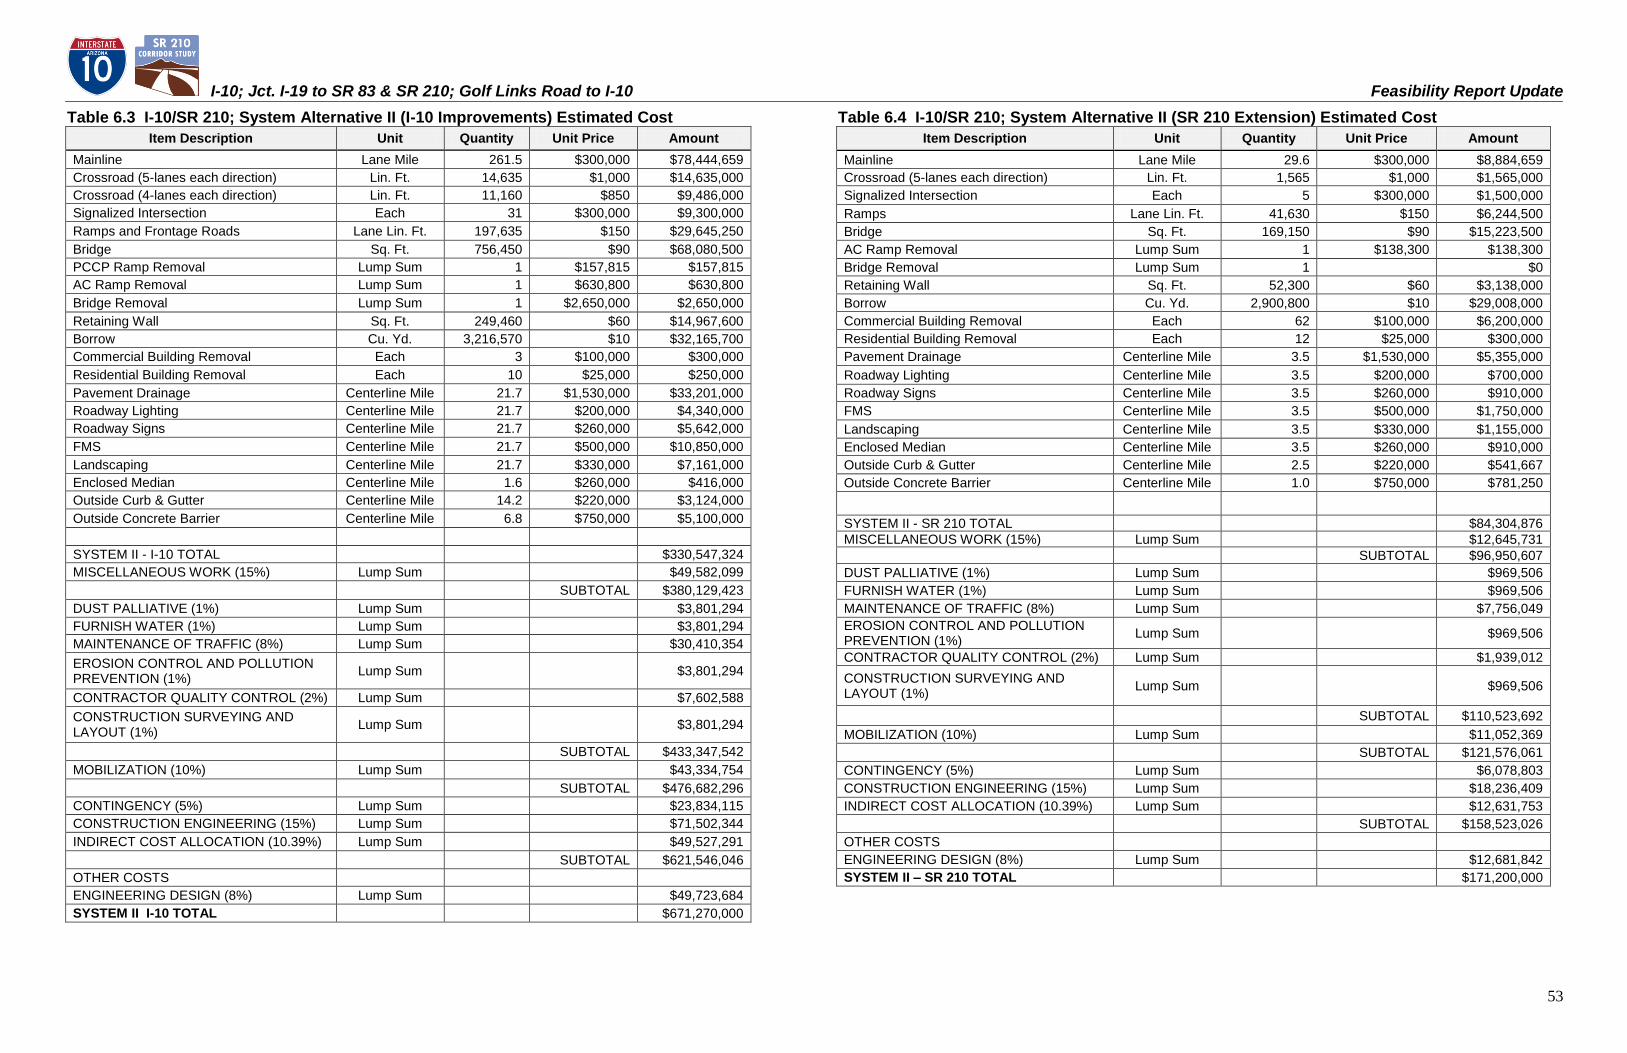
I-10; Jct. I-19 to SR 83 & SR 210; Golf Links Road to I-10 Feasibility Report Update
53
Table 6.3 I-10/SR 210; System Alternative II (I-10 Improvements) Estimated Cost Item Description Unit Quantity Unit Price Amount
Mainline Lane Mile 261.5 $300,000 $78,444,659
Crossroad (5-lanes each direction) Lin. Ft. 14,635 $1,000 $14,635,000
Crossroad (4-lanes each direction) Lin. Ft. 11,160 $850 $9,486,000
Signalized Intersection Each 31 $300,000 $9,300,000
Ramps and Frontage Roads Lane Lin. Ft. 197,635 $150 $29,645,250
Bridge Sq. Ft. 756,450 $90 $68,080,500
PCCP Ramp Removal Lump Sum 1 $157,815 $157,815
AC Ramp Removal Lump Sum 1 $630,800 $630,800
Bridge Removal Lump Sum 1 $2,650,000 $2,650,000
Retaining Wall Sq. Ft. 249,460 $60 $14,967,600
Borrow Cu. Yd. 3,216,570 $10 $32,165,700
Commercial Building Removal Each 3 $100,000 $300,000
Residential Building Removal Each 10 $25,000 $250,000
Pavement Drainage Centerline Mile 21.7 $1,530,000 $33,201,000
Roadway Lighting Centerline Mile 21.7 $200,000 $4,340,000
Roadway Signs Centerline Mile 21.7 $260,000 $5,642,000
FMS Centerline Mile 21.7 $500,000 $10,850,000
Landscaping Centerline Mile 21.7 $330,000 $7,161,000
Enclosed Median Centerline Mile 1.6 $260,000 $416,000
Outside Curb & Gutter Centerline Mile 14.2 $220,000 $3,124,000
Outside Concrete Barrier Centerline Mile 6.8 $750,000 $5,100,000
SYSTEM II - I-10 TOTAL $330,547,324
MISCELLANEOUS WORK (15%) Lump Sum $49,582,099
SUBTOTAL $380,129,423
DUST PALLIATIVE (1%) Lump Sum $3,801,294
FURNISH WATER (1%) Lump Sum $3,801,294
MAINTENANCE OF TRAFFIC (8%) Lump Sum $30,410,354
EROSION CONTROL AND POLLUTION PREVENTION (1%)
Lump Sum $3,801,294
CONTRACTOR QUALITY CONTROL (2%) Lump Sum $7,602,588
CONSTRUCTION SURVEYING AND LAYOUT (1%)
Lump Sum $3,801,294
SUBTOTAL $433,347,542
MOBILIZATION (10%) Lump Sum $43,334,754
SUBTOTAL $476,682,296
CONTINGENCY (5%) Lump Sum $23,834,115
CONSTRUCTION ENGINEERING (15%) Lump Sum $71,502,344
INDIRECT COST ALLOCATION (10.39%) Lump Sum $49,527,291
SUBTOTAL $621,546,046
OTHER COSTS
ENGINEERING DESIGN (8%) Lump Sum $49,723,684
SYSTEM II I-10 TOTAL
$671,270,000
Table 6.4 I-10/SR 210; System Alternative II (SR 210 Extension) Estimated Cost Item Description Unit Quantity Unit Price Amount
Mainline Lane Mile 29.6 $300,000 $8,884,659
Crossroad (5-lanes each direction) Lin. Ft. 1,565 $1,000 $1,565,000
Signalized Intersection Each 5 $300,000 $1,500,000
Ramps Lane Lin. Ft. 41,630 $150 $6,244,500
Bridge Sq. Ft. 169,150 $90 $15,223,500
AC Ramp Removal Lump Sum 1 $138,300 $138,300
Bridge Removal Lump Sum 1 $0
Retaining Wall Sq. Ft. 52,300 $60 $3,138,000
Borrow Cu. Yd. 2,900,800 $10 $29,008,000
Commercial Building Removal Each 62 $100,000 $6,200,000
Residential Building Removal Each 12 $25,000 $300,000
Pavement Drainage Centerline Mile 3.5 $1,530,000 $5,355,000
Roadway Lighting Centerline Mile 3.5 $200,000 $700,000
Roadway Signs Centerline Mile 3.5 $260,000 $910,000
FMS Centerline Mile 3.5 $500,000 $1,750,000
Landscaping Centerline Mile 3.5 $330,000 $1,155,000
Enclosed Median Centerline Mile 3.5 $260,000 $910,000
Outside Curb & Gutter Centerline Mile 2.5 $220,000 $541,667
Outside Concrete Barrier Centerline Mile 1.0 $750,000 $781,250
SYSTEM II - SR 210 TOTAL $84,304,876
MISCELLANEOUS WORK (15%) Lump Sum $12,645,731
SUBTOTAL $96,950,607
DUST PALLIATIVE (1%) Lump Sum $969,506
FURNISH WATER (1%) Lump Sum $969,506
MAINTENANCE OF TRAFFIC (8%) Lump Sum $7,756,049
EROSION CONTROL AND POLLUTION PREVENTION (1%)
Lump Sum $969,506
CONTRACTOR QUALITY CONTROL (2%) Lump Sum $1,939,012
CONSTRUCTION SURVEYING AND LAYOUT (1%)
Lump Sum $969,506
SUBTOTAL $110,523,692
MOBILIZATION (10%) Lump Sum $11,052,369
SUBTOTAL $121,576,061
CONTINGENCY (5%) Lump Sum $6,078,803
CONSTRUCTION ENGINEERING (15%) Lump Sum $18,236,409
INDIRECT COST ALLOCATION (10.39%) Lump Sum $12,631,753
SUBTOTAL $158,523,026
OTHER COSTS
ENGINEERING DESIGN (8%) Lump Sum $12,681,842
SYSTEM II – SR 210 TOTAL $171,200,000
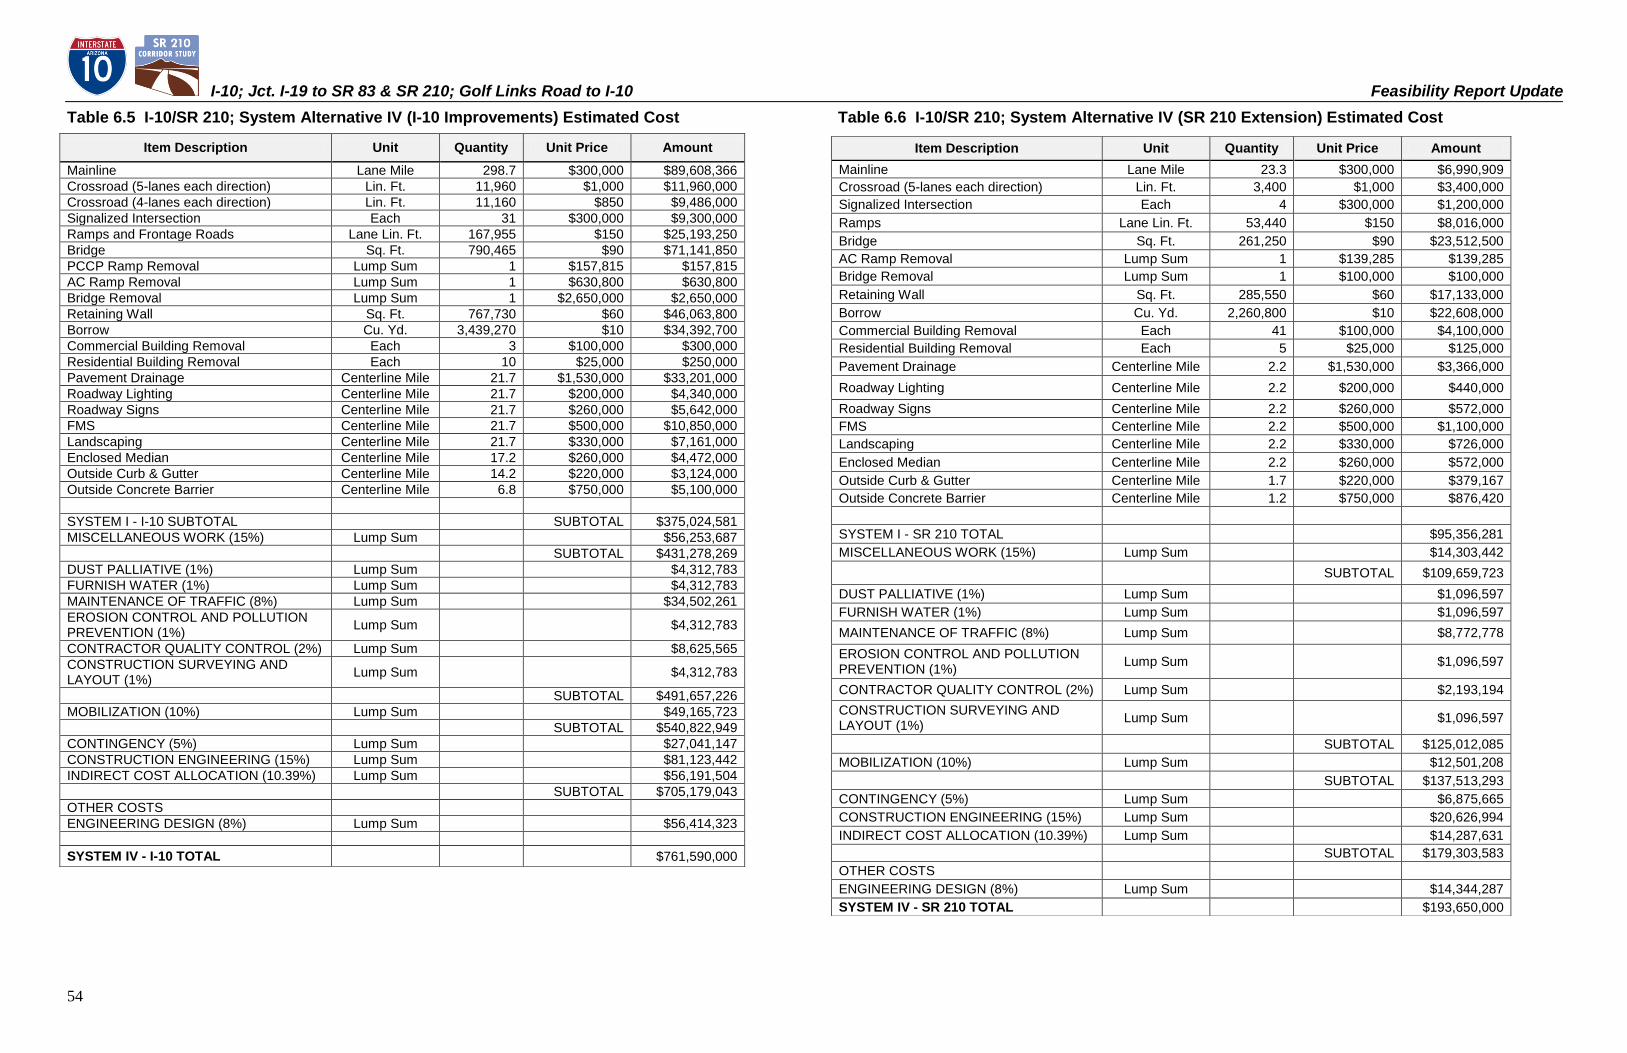
I-10; Jct. I-19 to SR 83 & SR 210; Golf Links Road to I-10 Feasibility Report Update
54
Table 6.5 I-10/SR 210; System Alternative IV (I-10 Improvements) Estimated Cost
Table 6.6 I-10/SR 210; System Alternative IV (SR 210 Extension) Estimated Cost
Item Description Unit Quantity Unit Price Amount Mainline Lane Mile 298.7 $300,000 $89,608,366
Crossroad (5-lanes each direction) Lin. Ft. 11,960 $1,000 $11,960,000
Crossroad (4-lanes each direction) Lin. Ft. 11,160 $850 $9,486,000
Signalized Intersection Each 31 $300,000 $9,300,000
Ramps and Frontage Roads Lane Lin. Ft. 167,955 $150 $25,193,250
Bridge Sq. Ft. 790,465 $90 $71,141,850
PCCP Ramp Removal Lump Sum 1 $157,815 $157,815
AC Ramp Removal Lump Sum 1 $630,800 $630,800
Bridge Removal Lump Sum 1 $2,650,000 $2,650,000
Retaining Wall Sq. Ft. 767,730 $60 $46,063,800
Borrow Cu. Yd. 3,439,270 $10 $34,392,700
Commercial Building Removal Each 3 $100,000 $300,000
Residential Building Removal Each 10 $25,000 $250,000
Pavement Drainage Centerline Mile 21.7 $1,530,000 $33,201,000
Roadway Lighting Centerline Mile 21.7 $200,000 $4,340,000
Roadway Signs Centerline Mile 21.7 $260,000 $5,642,000
FMS Centerline Mile 21.7 $500,000 $10,850,000
Landscaping Centerline Mile 21.7 $330,000 $7,161,000
Enclosed Median Centerline Mile 17.2 $260,000 $4,472,000
Outside Curb & Gutter Centerline Mile 14.2 $220,000 $3,124,000
Outside Concrete Barrier Centerline Mile 6.8 $750,000 $5,100,000
SYSTEM I - I-10 SUBTOTAL SUBTOTAL $375,024,581
MISCELLANEOUS WORK (15%) Lump Sum $56,253,687
SUBTOTAL $431,278,269
DUST PALLIATIVE (1%) Lump Sum $4,312,783
FURNISH WATER (1%) Lump Sum $4,312,783
MAINTENANCE OF TRAFFIC (8%) Lump Sum $34,502,261
EROSION CONTROL AND POLLUTION PREVENTION (1%)
Lump Sum $4,312,783
CONTRACTOR QUALITY CONTROL (2%) Lump Sum $8,625,565
CONSTRUCTION SURVEYING AND LAYOUT (1%)
Lump Sum $4,312,783
SUBTOTAL $491,657,226
MOBILIZATION (10%) Lump Sum $49,165,723
SUBTOTAL $540,822,949
CONTINGENCY (5%) Lump Sum $27,041,147
CONSTRUCTION ENGINEERING (15%) Lump Sum $81,123,442
INDIRECT COST ALLOCATION (10.39%) Lump Sum $56,191,504
SUBTOTAL $705,179,043
OTHER COSTS
ENGINEERING DESIGN (8%) Lump Sum $56,414,323
SYSTEM IV - I-10 TOTAL $761,590,000
Item Description Unit Quantity Unit Price Amount Mainline Lane Mile 23.3 $300,000 $6,990,909
Crossroad (5-lanes each direction) Lin. Ft. 3,400 $1,000 $3,400,000
Signalized Intersection Each 4 $300,000 $1,200,000
Ramps Lane Lin. Ft. 53,440 $150 $8,016,000
Bridge Sq. Ft. 261,250 $90 $23,512,500
AC Ramp Removal Lump Sum 1 $139,285 $139,285
Bridge Removal Lump Sum 1 $100,000 $100,000
Retaining Wall Sq. Ft. 285,550 $60 $17,133,000
Borrow Cu. Yd. 2,260,800 $10 $22,608,000
Commercial Building Removal Each 41 $100,000 $4,100,000
Residential Building Removal Each 5 $25,000 $125,000
Pavement Drainage Centerline Mile 2.2 $1,530,000 $3,366,000
Roadway Lighting Centerline Mile 2.2 $200,000 $440,000
Roadway Signs Centerline Mile 2.2 $260,000 $572,000
FMS Centerline Mile 2.2 $500,000 $1,100,000
Landscaping Centerline Mile 2.2 $330,000 $726,000
Enclosed Median Centerline Mile 2.2 $260,000 $572,000
Outside Curb & Gutter Centerline Mile 1.7 $220,000 $379,167
Outside Concrete Barrier Centerline Mile 1.2 $750,000 $876,420
SYSTEM I - SR 210 TOTAL $95,356,281
MISCELLANEOUS WORK (15%) Lump Sum $14,303,442
SUBTOTAL $109,659,723
DUST PALLIATIVE (1%) Lump Sum $1,096,597
FURNISH WATER (1%) Lump Sum $1,096,597
MAINTENANCE OF TRAFFIC (8%) Lump Sum $8,772,778
EROSION CONTROL AND POLLUTION PREVENTION (1%)
Lump Sum $1,096,597
CONTRACTOR QUALITY CONTROL (2%) Lump Sum $2,193,194
CONSTRUCTION SURVEYING AND LAYOUT (1%)
Lump Sum $1,096,597
SUBTOTAL $125,012,085
MOBILIZATION (10%) Lump Sum $12,501,208
SUBTOTAL $137,513,293
CONTINGENCY (5%) Lump Sum $6,875,665
CONSTRUCTION ENGINEERING (15%) Lump Sum $20,626,994
INDIRECT COST ALLOCATION (10.39%) Lump Sum $14,287,631
SUBTOTAL $179,303,583
OTHER COSTS
ENGINEERING DESIGN (8%) Lump Sum $14,344,287
SYSTEM IV - SR 210 TOTAL $193,650,000