Embed Size (px)
Citation preview
1 EAGA Biodiversity Monitoring Framework 2015: Part II – Indicator
Implementation Guide
PREPARED FOR
THE CITY OF
BOROONDARA
EAGA BIODIVERSITY MONITORING
FRAMEWORK 2015 PART II – INDICATOR IMPLEMENTATION GUIDE
30 June 2015
Report by Caragh Threlfall, Lee
Harrison, Rodney van der Ree,
Nicholas Williams, Chris Jones

2 EAGA Biodiversity Monitoring Framework 2015: Part II – Indicator
Implementation Guide
Contents 1. Introduction ......................................................................................................................... 4
1.1 Purpose of this document ............................................................................................................. 4
1.2 Considerations for the use of this implementation guide ............................................................ 4
1.2.1 Setting monitoring targets ..................................................................................................... 4
1.2.2 Review of the monitoring data to assess the success of the framework .............................. 4
1.2.3 Cause of changes observed .................................................................................................... 5
1.2.4 Training of staff in correct data collection procedures .......................................................... 5
1.2.5 Reporting the results of the monitoring ................................................................................ 5
2. Indicator One - Vegetation Extent ......................................................................................... 6
2.1 Monitoring Questions ................................................................................................................... 6
2.2 Definition and Background ........................................................................................................... 6
2.3 Site Selection ................................................................................................................................. 6
2.4 Data Capture ................................................................................................................................. 7
2.4.1 Creation of new GIS spatial layers ......................................................................................... 7
2.4.2 Use of existing GIS spatial layers ............................................................................................ 8
2.5 Data Storage and Access ............................................................................................................... 8
2.6 Synthesis and Reporting Procedure .............................................................................................. 8
3. Indicator Two - Vegetation Change ....................................................................................... 9
3.1 Monitoring Questions ................................................................................................................... 9
3.2 Definition and Background ........................................................................................................... 9
3.2.1 Rapid assessment of vegetation condition versus monitoring change ................................. 9
3.2.2 Terminology ......................................................................................................................... 10
3.2.3 Survey aims .......................................................................................................................... 10
3.3 Site Selection and Number of Sites ............................................................................................. 10
3.4 Survey Design and Initial Quadrat Setup .................................................................................... 11
3.5 Data Capture ............................................................................................................................... 12
3.5.1 Survey of planted seedling survival ..................................................................................... 13
3.6 Detailed Vegetation Sampling Methods ..................................................................................... 14
3.6.1 Understorey and ground surface cover ............................................................................... 14
3.6.2 Species diversity, richness, and composition ....................................................................... 15
3.6.3 Species recruitment and mortality of woody species .......................................................... 15
3.6.4 Log length ............................................................................................................................. 16

3 EAGA Biodiversity Monitoring Framework 2015: Part II – Indicator
Implementation Guide
3.6.5 Tree density.......................................................................................................................... 16
3.6.6 Tree canopy and large shrub cover ...................................................................................... 18
3.7 Data Storage and Access ............................................................................................................. 21
3.7.1 Hard copy data sheets ......................................................................................................... 21
3.7.2 Electronic data ..................................................................................................................... 21
3.8 Synthesis and Reporting Procedure ............................................................................................ 21
4. Indicator Three - Phenology ................................................................................................ 23
4.1 Monitoring Questions ................................................................................................................. 23
4.2 Definition and Background ......................................................................................................... 23
4.3 Site Selection ............................................................................................................................... 23
4.4 Data Capture ............................................................................................................................... 25
4.4.1 Suggested species for monitoring phenology ...................................................................... 25
4.4.2 Suggested timing of data capture ........................................................................................ 25
4.4.3 Example of data captured for the Magpie-lark (Grallina cyanoleuca) ................................ 26
4.5 Data Storage and Access ............................................................................................................. 26
4.6 Synthesis and Reporting Procedure ............................................................................................ 27
5. Indicator Four - Local bird communities ............................................................................... 28
5.1 Monitoring Questions ................................................................................................................. 28
5.2 Definition and Background ......................................................................................................... 28
5.2.1 Climate affected bird species ............................................................................................... 28
5.2.2 Urban sensitive bird species ................................................................................................ 29
5.3 Site Selection ............................................................................................................................... 32
5.4 Data Capture ............................................................................................................................... 32
5.4.1 Bird surveys .......................................................................................................................... 32
5.4.2 Data collection options ........................................................................................................ 33
5.4.3 Site monitoring..................................................................................................................... 33
5.5 Data Storage and Access ............................................................................................................. 33
5.6 Synthesis and Reporting Procedure ............................................................................................ 34
6. References ......................................................................................................................... 35
Appendix A: GIS data set Metro_EVC data layer enquiry form ................................................. 36
Appendix B: Vegetation Extent data collation spreadsheet ...................................................... 37
Appendix C: Vegetation Change data collection field sheets .................................................... 38
Appendix D: Life form categories and definitions for understorey cover measurements. ........ 394

4 EAGA Biodiversity Monitoring Framework 2015: Part II – Indicator
Implementation Guide
1. Introduction
1.1 Purpose of this document
The purpose of this implementation guide is to detail the monitoring methods for the four
biodiversity indicators selected for the Eastern Alliance for Greenhouse Action (EAGA) region. These
indicators were selected after extensive consultation with EAGA Council staff, assisted by expert
advice provided by the Technical Reference Group and other consultants including Graeme Lorimer.
These stages are detailed in Part 1 - Discussion Paper.
From this process, the following four indicators were selected:
Vegetation extent
Vegetation change
Phenology
Local bird communities
The following document outlines methods to capture data for each of these indicators, and
recommends how data should be reported on. Each indicator can be measured independently, and
although complementary, the methods and terms used for each are specific to each indicator.
1.2 Considerations for the use of this implementation guide
1.2.1 Setting monitoring targets
No definitive targets have been set in this document, due to the differences in biodiversity assets
present across the region and differing goals and resources of each Council to undertake monitoring.
For each biodiversity indicator below, each Council should set a target for how much change is
acceptable, and how much change would trigger a management intervention. For example, the
acquisition of 5 ha of new vegetation extent may be considered an appropriate target in the Knox
Local Government Area (LGA), compared to 0.5 ha in Boroondara. Similarly, the addition or loss of
bird species included in this framework may also trigger further assessment and/or management
intervention. These targets have not been set explicitly in this document, and should be set by each
user in light of the context and resources of their organisation.
1.2.2 Review of the monitoring data to assess the success of the framework
The data collected over time from this framework should be used to refine the methods and number
of sites needed on an ongoing basis. For all indicators that require the collection of field data, sites
should be initially established in locations representative of the local native vegetation, preferably
using a stratified random sampling approach. This would entail stratifying sites based on factors
likely to be different across the region, such as topography, vegetation classes and urban context,
and then randomly (in an un-biased way) selecting sites within each category to adequately
represent the full range of sites that occur within the region. The ultimate number of sites and
quadrats to use across the region can then be reviewed using data collected, and periodically
commissioning an external assessment of the data (e.g. power analysis) by a consultant to revise

5 EAGA Biodiversity Monitoring Framework 2015: Part II – Indicator
Implementation Guide
how many sites need to be monitored. This will ensure that sufficient sites are monitored in the
future to be able to detect statistically significant change. For example, if only small change occurs
then a greater number of sites may need to be monitored to have a reasonable chance of detecting
this change, if it occurs.
1.2.3 Cause of changes observed
The use of any one of the four indicators in isolation will not provide direct evidence of any effect of
climate change or the impact of land management decisions made by Councils in the region. We
therefore recommend that all four indicators be measured within each LGA in a systematic
approach. If single indicators are monitored, the resulting data must be viewed as indicative only,
and may not identify the cause of any changes seen.
1.2.4 Training of staff in correct data collection procedures
The reliability and quality of data is dependent upon the surveys being undertaken by people who
are trained in the methods. While survey personnel do not need to be expert, they need minimum
levels of training to ensure a minimum standard in the quality of the data being collected. This is
especially pertinent to Indictor Two – Vegetation Change, where we recommend that only a person
with excellent botanical identification skills undertakes field surveys for this indicator. It is up to each
Council to decide whether they have the required expertise in-house, or if external consultants are
required.
1.2.5 Reporting the results of the monitoring
We recommend an external analysis of all data collected from each Council for each indicator is
collated and reported on every five years, where the suggested monitoring questions listed below
are addressed. We also recommend interim reports on phenology and bird communities are
compiled every two-three years, as these indicators may respond more quickly than purely
vegetation based indicators to extreme climate events, and/or to extreme increases or losses in
habitat. These questions can be added to or tailored to each Council as required.

6 EAGA Biodiversity Monitoring Framework 2015: Part II – Indicator
Implementation Guide
2. Indicator One - Vegetation Extent
2.1 Monitoring Questions
1. What is the extent of native vegetation in the region?
2. Has the extent of native vegetation changed over time and if so, where has it changed?
3. How much loss or gain has occurred?
4. How can this information be used to inform future management?
2.2 Definition and Background
This framework defines vegetation extent as the amount or area (ha) of native vegetation within
each local government area (LGA). For the purposes of this framework this can be measured in two
ways:
1. The extent of native vegetation in areas actively managed for conservation (e.g. Council
managed land, bushland reserves, sites of conservation significance)
2. The extent of native vegetation across all land within the LGA (Council managed land plus
private land)
Regionally, this indicator will allow Councils to track the amount and distribution of native
vegetation, and hence habitat, occurring within their actively managed land, and/or across their
entire LGA. The extent of vegetation within actively managed areas is unlikely to change rapidly over
time, and may only increase in response to restoration and revegetation activities, or if new areas
are acquired in the managed network. Vegetation extent may decline due to several factors,
including land clearing, fires and other significant climate events. Hence, this indicator cannot be
used to detect changes caused specifically by climate change. Instead, this indicator can indicate if
the extent of vegetation is changing over time, not why it has changed. However, when combined
with the knowledge and experience of the bushland management teams, the causes of any decline
or increase in the extent of native vegetation can probably be determined and recorded. Given the
extent of habitat loss and fragmentation in the region, the magnitude of change is likely to be small
and incremental.
2.3 Site Selection
As some LGA’s are larger than others, it is recommended that vegetation extent is mapped in order
of priority, as follows:
1. The extent of native vegetation in actively managed areas on Council land (e.g. Council
managed land, bushland reserves, sites of conservation significance);
2. The extent of native vegetation in sites of biological significance on private land; and/or
3. The extent of native vegetation across all other land within the LGA (i.e. Council managed
land plus private land)

7 EAGA Biodiversity Monitoring Framework 2015: Part II – Indicator
Implementation Guide
For the purposes of this framework, all Councils should initially map this extent following the
definition agreed to by EAGA Councils as “native vegetation in actively managed areas on Council
land” as a minimum requirement, using the method described in Section 2.4.
2.4 Data Capture
Vegetation extent may be captured in a variety of ways such as from existing soft and hard copy
reports, in addition to utilising existing spatial layers. For Councils where information only exists in
hard copy reports, the areas of vegetation must be manually entered into a spatial data layer using a
Geographic Information System (GIS). See Section 2.4.1 for instructions of how to do this.
2.4.1 Creation of new GIS spatial layers
All areas of existing native vegetation within each site need to be ‘digitised’ in a GIS layer. These
instructions should be carried out by Council staff such as GIS officers or consultants, as required.
The following steps should be conducted for each site. These instructions have been written for use
with ArcMap version 10.x (ESRI, Redlands, California, USA), however other programs will follow a
similar format. These instructions assume Councils have access to up-to-date aerial imagery for all
areas they wish to map.
1. Open ArcMap, or similar GIS program
2. Load aerial imagery into the map frame
3. Locate on aerial imagery the native vegetation you wish to map. This step can be assisted by
Council ground or bushland staff providing digital or hard copy maps to GIS staff depicting
areas of native vegetation in actively managed Council land, using the two categories listed
in point 6 below.
4. In ArcCatalog create a new shapefile (Polygon) and set coordinates to Projected>National
Grid> Australia>Projected GDA1994- MGA Zone 55
5. Open attribute table and add the following fields:
Name: VegetationType Type: text Length: 50
6. Within each site, classify different patches of vegetation based on the following
‘VegetationTypes’:
Type 1 - Existing native vegetation under management; OR
Type 2 - New, future extent (area proposed to be targeted for future bushland
renewal)
7. Use the ‘create features’ tool to create a polygon layer to define the boundaries of
vegetation within each site
8. Do not allow any gaps between polygons (use the ‘snapping’ functions to facilitate this)
9. For each polygon digitised, type the ‘VegetationType’ into the attribute table
10. You may also wish to add another field to the attribute table called ‘EVC ’, for which each
Ecological Vegetation Class (EVC) name is entered:
Name: EVC Type: text Length: 50
11. Additional fields can be created that describe vegetation condition if desired, linked to on-
ground measurements of vegetation condition, briefly described in Section Three below

8 EAGA Biodiversity Monitoring Framework 2015: Part II – Indicator
Implementation Guide
12. Create only one polygon layer that contains the digitised polygons of vegetation for all sites
you wish to map
13. Regularly save the polygon layer you are creating
14. In subsequent reporting periods, polygons created should be revised to assess if native
vegetation still occurs as mapped, if new areas need to be digitised (e.g. areas of
revegetation), or if areas of mapped vegetation need to be removed (e.g. due to land
clearing). In the instance of bushland renewal, it may also be necessary to revise these
classifications and report these changes in future reporting periods if areas classified as
‘Type 2- New, future extent’ can subsequently be considered ‘Type 1- Existing native
vegetation under management’. These decisions must be made by each Council, in
consultation with bushland and ground staff, in addition to GIS staff.
2.4.2 Use of existing GIS spatial layers
Much of the native vegetation within actively managed areas is already likely to be mapped within
existing vegetation layers, including:
NV2005_EXTENT (Department of Environment and Primary Industries)
Metro_EVC (Australian Research Centre for Urban Ecology, developed in 2001)
The quality and resolution of NV2005_EXTENT may be insufficient for the purposes of this
monitoring framework. Instead, the Metro_EVC layer may be more suitable for most Councils. The
Metropolitan EVC data set contains polygons that represent remnant native vegetation patches,
along with their EVC, in the metropolitan Melbourne region. The Metropolitan EVC data set is
complete for 20 LGAs in the region, including Councils within the EAGA region (except for the Yarra
Ranges). Using this layer as a base the extent of native vegetation in the area could be verified, and
revised if required using the above procedure. The contact details for requesting access to this data
layer is provided in Appendix A.
2.5 Data Storage and Access Each Council should create or obtain a single GIS polygon shapefile for their LGA. The shapefile
should contain attributes listed above under ‘VegetationType’ and ‘EVC’ for native vegetation within
either actively managed areas or across all land within the LGA. This data layer should be stored in
the corporate Council GIS system. This data layer should be accessible by all relevant employees of
the Council. Information needed for reporting can be extracted in a format compatible to use across
the region; a suggested format for data extraction is provided in Appendix B.
2.6 Synthesis and Reporting Procedure
Using the data extracted from the GIS layer, vegetation extent (ha) should be summarised across
each LGA. It is recommended that vegetation extent (ha) be reported on every 5 years. Vegetation
extent (ha) should be reported on for both Vegetation Type 1 and 2 across each LGA.
At each reporting period the following questions should be addressed:
1) Is the extent of native vegetation increasing, stable or declining?
2) Has the extent of native vegetation changed over time and where?
3) How can this information be used to inform future management?

9 EAGA Biodiversity Monitoring Framework 2015: Part II – Indicator
Implementation Guide
3. Indicator Two - Vegetation Change
3.1 Monitoring Questions
1. What is the current status of natural vegetation attributes across the region?
2. To what extent have the vegetation attributes that reflect condition changed over time?
3. In which sites and vegetation types have vegetation attributes changed?
4. How are monitoring data going to be used to inform future management?
3.2 Definition and Background
Vegetation monitoring is the recording of vegetation attributes with the specific aim of repeating
samples through time to identify and record change. Methods used should be sensitive enough to
allow detection of a ‘reasonable’ amount of change in a ‘reasonable’ amount of time, with
quantified uncertainty. The methods presented here are designed for the purposes of the Eastern
Alliance for Greenhouse Action (EAGA) region members to monitor vegetation within their
jurisdictions specifically, to allow assessment of change due to a range of influences, e.g. climate,
management, or disturbances.
In setting up these quadrats each Council is indicating a commitment to continue sampling via this
method (or with reviewed adjustments) into the future and store data appropriately for future
access.
3.2.1 Rapid assessment of vegetation condition versus monitoring change
Two common objectives of native vegetation surveys are to: 1) estimate the overall ‘condition’ or
‘quality’ of the vegetation (e.g. Habitat Hectares); and 2) monitor change through time. These are
very different objectives and require different survey methods. Overall condition estimates are
typically designed to be rapid and give a coarse indication of the relative quality of the vegetation
attributes relative to some pre-determined benchmark. They are used to inform managers of the
general state of their sites and to prioritise management. Monitoring change over time requires a
much more sensitive approach because an estimate of change is of little value if it is highly
uncertain. This generally requires measurements at multiple time steps rather than visual estimates.
Monitoring change of vegetation condition over time is no different to monitoring any individual
variable over time; it requires detailed measurements to give a reliable estimate of change.
When are rapid condition assessments useful?
There are a range of situations where a rapid condition assessment is useful to managers: 1) if there
is a mandated requirement to do condition assessments, such as for offsetting or to comply with
funding agreements; 2) there may be a desire to coarsely quantify condition to help identify sites
needing more or different management; or 3) managers may want an inventory of significant
conservation assets (condition being one aspect of significance) to manage the spatial arrangement
and area of these assets. However, rapid condition assessment information is generally too
imprecise to measure change over time and is inappropriate for use in quantitative analysis. These

10 EAGA Biodiversity Monitoring Framework 2015: Part II – Indicator
Implementation Guide
data are well suited though for spatial examination, i.e. mapping of sites or values for use in
management prioritisation. Strategic incorporation of these types of data into the Indicator One –
Vegetation Extent (see Section 2 above) may be an area for future consideration.
There are a number of different vegetation condition methods available to managers, the most
common in Victoria being Habitat Hectares. This method is currently being reviewed by DEWLP and
is likely to change in the coming years. Individual Councils should decide if in addition to the surveys
for monitoring change described here, they also have a need to do rapid condition assessments or
other visual surveys, and if so which method to use. We recommend these additional rapid
assessments only be done if there is a particular need for them and an explicit understanding of how
the information will be used.
3.2.2 Terminology
Throughout this document the following terms are used with reference to measuring vegetation
condition:
Site – the park or reserve which contains a quadrat
Survey – the collection of data within the quadrat
Quadrat – the 20 m x 20 m square sampling unit
Transect – a 20 m linear sampling unit that runs across each quadrat – there are 5 per
quadrat
3.2.3 Survey aims
The purpose of these surveys is to:
Objectively measure the attributes of a range of vegetation variables across multiple sites in
a way that will allow detection and assessment of change over time under multiple
influences, i.e., climate change, management actions, natural or anthropogenic disturbance,
etc.
Characterise examples of vegetation (structure, diversity, ‘condition’) across a range of
vegetation types and management regimes – but not characterise whole parks or reserves.
What these surveys do NOT do:
This sampling method is NOT specifically a vegetation condition assessment, such as Habitat
Hectares, and the values obtained are NOT intended to be combined in any way into some
metric or score of overall condition. Instead, each vegetation attribute is assessed on its own
merits, relevant to the requirements of the Council, which in itself is one form of ‘condition’
evaluation.
3.3 Site Selection and Number of Sites
The specific sites selected by each Council from the full set of parks/reserves within their jurisdiction
are ultimately the decision of the Council. This decision will depend on the number of possible sites,
the amount of funding available for sampling, the number of different vegetation types and
conditions present within the Council area, and the expectation of future change. Sites should cover
a range of vegetation types and conditions, particularly those where there is a particular interest in

11 EAGA Biodiversity Monitoring Framework 2015: Part II – Indicator
Implementation Guide
monitoring change, i.e. sites where there is high current or potential future management
investment, sites thought to be rapidly degrading or improving, sites vulnerable to decline from
climate change or other disturbance. It is recommended that sites used under Indicator Four – Bird
communities, are included as sites for monitoring vegetation change, where appropriate.
Ideally there would be two quadrats per site; this gives additional support to changes in that site but
also acts as insurance in case one is damaged or disturbed. For sites with only space for one quadrat,
then one will suffice. The number of sites for any one Council will depend on the level of funding and
the number of bushland parks available. We recommend that 10-20 sites (20-40 quadrats) per
Council be the initial target. New sites and quadrats can be added in future years if funding permits.
Depending on the vegetation to be surveyed, and the experience of the surveyors, we expect that
the vegetation survey of one quadrat could be completed within 40-90mins for two people (or 60-
120 for one person), once the corners have been marked out in the initial setup as described in
Section 3.4 below.
The location of a quadrat within a site is very important. The aim is not to fully characterise the site
with this sample, but the vegetation, soil conditions, slope, and disturbances within the quadrat
should be broadly indicative of the site. This will be the case for all quadrats unless there is a special
circumstance where the positioning of the quadrat is to target a specific set of conditions,
disturbance or vegetation (e.g. rare species). The quadrat should be located where it is less likely to
receive significant unwanted disturbance or vandalism.
Management interventions within the quadrat are at the discretion of the land managers, but should
be carefully considered as any change detected will be a result of both direct (e.g. management) and
indirect (e.g. climate) influences. If managers desire to quantify the vegetation change directly as a
result of management then management should be included within quadrats and carefully
documented. We recommend that if management is to be done within quadrats then it be restricted
to one quadrat per site where possible and the other quadrat untouched (e.g. no management
activities to occur) to act as a comparison.
3.4 Survey Design and Initial Quadrat Setup
The primary sampling unit is a 20 m x 20 m square quadrat (Figure 1). All vegetation attributes are
sampled within the boundaries of this quadrat. Corners of each quadrat should be permanently
marked with stakes and GPS referenced. Depending on the location of the quadrat and amenity
concerns, the stakes could be timber or metal, and could be hammered flush to the ground or
protrude above ground. The primary issue is to ensure the stake remains in place between surveys
to protect the integrity of the quadrat location. Efforts should be made to ensure that the
dimensions are accurate and the quadrat is square. The quadrat should be positioned in a north-
south orientation (Figure 1). A photo should be taken of each quadrat from the NE corner – this is
not a quantitative monitoring exercise, but instead is a record to help relocate the quadrat if the
permanent markers are removed and a simple visual record of each quadrat (see notes on data
storage). The photo should be taken a few metres back from the corner post so that the post is
visible within the photo and will act as a reference point.
12 EAGA Biodiversity Monitoring Framework 2015: Part II – Indicator
Implementation Guide
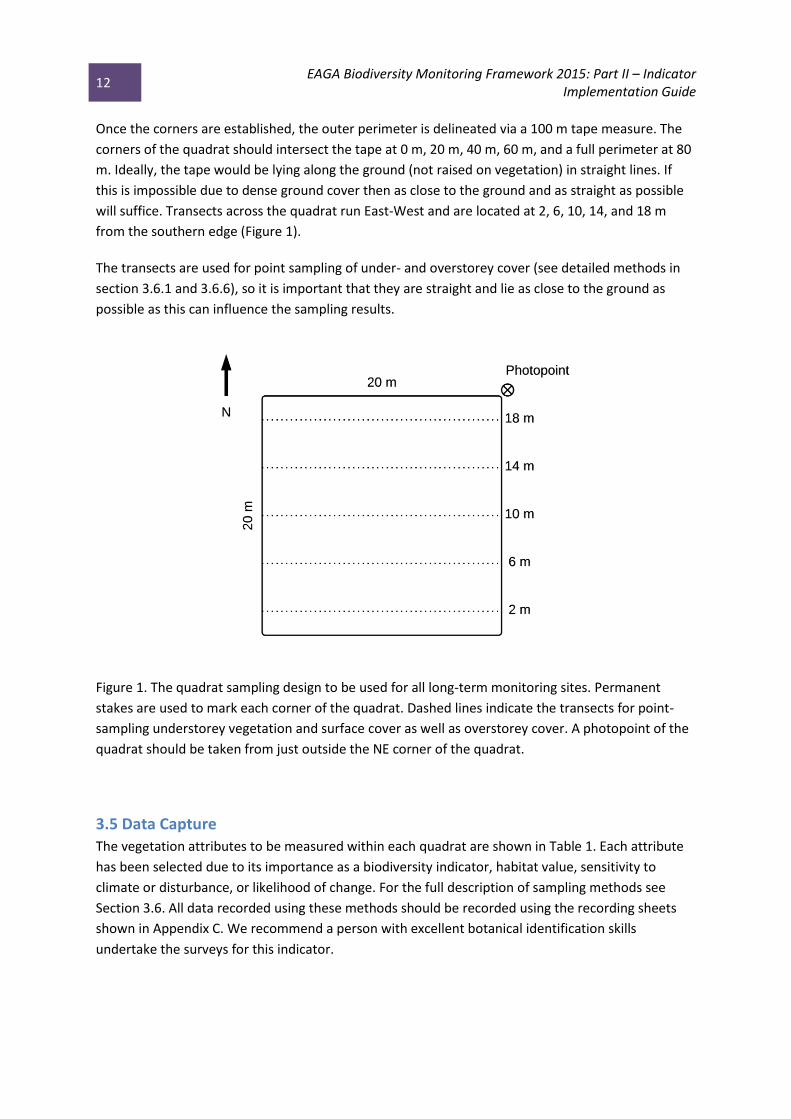
Once the corners are established, the outer perimeter is delineated via a 100 m tape measure. The
corners of the quadrat should intersect the tape at 0 m, 20 m, 40 m, 60 m, and a full perimeter at 80
m. Ideally, the tape would be lying along the ground (not raised on vegetation) in straight lines. If
this is impossible due to dense ground cover then as close to the ground and as straight as possible
will suffice. Transects across the quadrat run East-West and are located at 2, 6, 10, 14, and 18 m
from the southern edge (Figure 1).
The transects are used for point sampling of under- and overstorey cover (see detailed methods in
section 3.6.1 and 3.6.6), so it is important that they are straight and lie as close to the ground as
possible as this can influence the sampling results.
Figure 1. The quadrat sampling design to be used for all long-term monitoring sites. Permanent
stakes are used to mark each corner of the quadrat. Dashed lines indicate the transects for point-
sampling understorey vegetation and surface cover as well as overstorey cover. A photopoint of the
quadrat should be taken from just outside the NE corner of the quadrat.
3.5 Data Capture
The vegetation attributes to be measured within each quadrat are shown in Table 1. Each attribute
has been selected due to its importance as a biodiversity indicator, habitat value, sensitivity to
climate or disturbance, or likelihood of change. For the full description of sampling methods see
Section 3.6. All data recorded using these methods should be recorded using the recording sheets
shown in Appendix C. We recommend a person with excellent botanical identification skills
undertake the surveys for this indicator.
13 EAGA Biodiversity Monitoring Framework 2015: Part II – Indicator
Implementation Guide
Table 1. The vegetation attributes to be recorded in each quadrat.
Attribute Description What this indicates Sampling method
Understorey cover (native and exotic)
Cover of all plants less than 2 m tall and ground surface (e.g. litter, bare ground) within the quadrat
Rapid change, directly related to management, climate and disturbance sensitive.
Point sampling along line transects within quadrat
Species diversity and composition (native and exotic)
The number of different plant species in the quadrat
Rapid change, directly related to management, climate and disturbance sensitive.
Full species list in each quadrat
Recruitment of woody plants
The presence of non-planted immature individuals within the quadrat
Indicator of viable populations, vegetation condition, natural regeneration
Presence or absence of recruitment for each species listed
Mortality of woody plants
The presence of dead individuals within the quadrat
Indicator of non-viable populations, vegetation condition
Presence or absence of mortality for each species listed
Logs The combined length of logs in the quadrat
Habitat and vegetation condition
Measure combined length of all logs in the quadrat with > 10 cm diameter
Tree density Density of all eucalypt and non-eucalypt trees in the quadrat
Habitat and vegetation condition
Record the DBH of each individual tree in the quadrat
Tree and large shrub cover
Cover of all trees and large shrubs
Habitat and vegetation condition
Point sampling along line transects within quadrat
3.5.1 Survey of planted seedling survival
There are often monitoring targets that aren’t directly assessed by the quadrat sampling method
presented in this framework. One notable example is the monitoring of survival rates of planted
seedlings as part of vegetation restoration. The effectiveness of this management action and its cost-
efficiency is dependent on the survival rate of planted seedlings. The survey method recommended
is to count all seedlings planted (either total or in a defined area) at the actual time of planting, and
then count the number of living seedlings 1 year later. This gives a proportional amount of plant
survival. One year is sufficient to assess seedling survival, but not so long that planted individuals are
indistinguishable from naturally regenerating individuals. Methods such as this are an optional
consideration for managers and therefore, more detailed methods for this target are not presented
further in this manual.

14 EAGA Biodiversity Monitoring Framework 2015: Part II – Indicator
Implementation Guide
3.6 Detailed Vegetation Sampling Methods
All data recorded using these methods should be recorded using the recording sheets shown in
Appendix C. Surveys should be undertaken in mid to late Spring to maximise the chances of seeing
all species and to observe flowering which helps with species identification. Doing the surveys at the
same time of year will also ensure data are comparable between time periods. Ideally all surveys in a
single year would be done within a few weeks so that there are not large seasonal differences within
the set of surveys.
3.6.1 Understorey and ground surface cover
Understorey and ground surface cover is probably the most important attribute for evaluating
vegetation change because of the short life cycles of the plants and their subsequent potential for
rapid responses to climate or disturbance. The aim is to estimate the foliage projective cover of all
understorey plants (native and exotic) up to 2 m tall. Species can be recorded one of two ways: by
individual species, or by life form. In the first method, the species name of every plant is recorded at
each sampling point, whereas in the second option species are grouped into life form categories
rather than individually; life form definitions are stated in Appendix D. Ground covers include bare
ground, organic litter, bryophyte/lichen, logs and rocks and will occur at every point that is not
occupied by a plant at ground level e.g. the centre of a grass tussock.
Councils choosing to do the surveys by life form should use ‘Understorey point transect survey:
Option 1’; while those choosing instead to do surveys by species should use the ‘Understorey point
transect survey: Option 2’ (Appendix C). It is our strong recommendation that Option 1 be the
default, due to the difficulty in consistently and reliably making accurate species identifications in
Option 2. If Option 2 is used then it should be done by an observer with excellent botanical ID skills
and able to identify species to scientific name.
Foliage projective cover (referred to as cover in this framework) can be measured using point
sampling along line transects. At 20 cm intervals along each transect a long, narrow pole is placed
vertically and each life form that touches the pole is recorded (a ‘hit’) as well as the ground layer
(e.g. bare ground, litter, rock, etc.). The percentage cover is calculated as the number of times a
particular life form is ‘hit’ divided by the total number of points (then multiplied by 100 to get
percentage). Each life form can only score a hit once per point, regardless of the number of parts of
the plant touching the pole, or the number of individual plants of the same life form touching the
pole.
Pointing at 20 cm intervals (starting at 20 cm and ending on the tape at 20 m for each transect) gives
100 points per transect, i.e., 500 points per quadrat when 5 transects are surveyed. Based on this
number of points, 250 ‘hits’ of a particular life form is 50% cover, and 1 ‘hit’ is 0.2% cover.
Equipment:
- 1 x 100 m measuring tape (for outer perimeter of quadrat)
- 5 x 20 m measuring tapes (for each of the five transects)
- 1 x 2 m narrow rigid pole (such as dowel, metal or plastic tube/rod, for pointing, approx. 0.5 cm
diameter)
15 EAGA Biodiversity Monitoring Framework 2015: Part II – Indicator
Implementation Guide
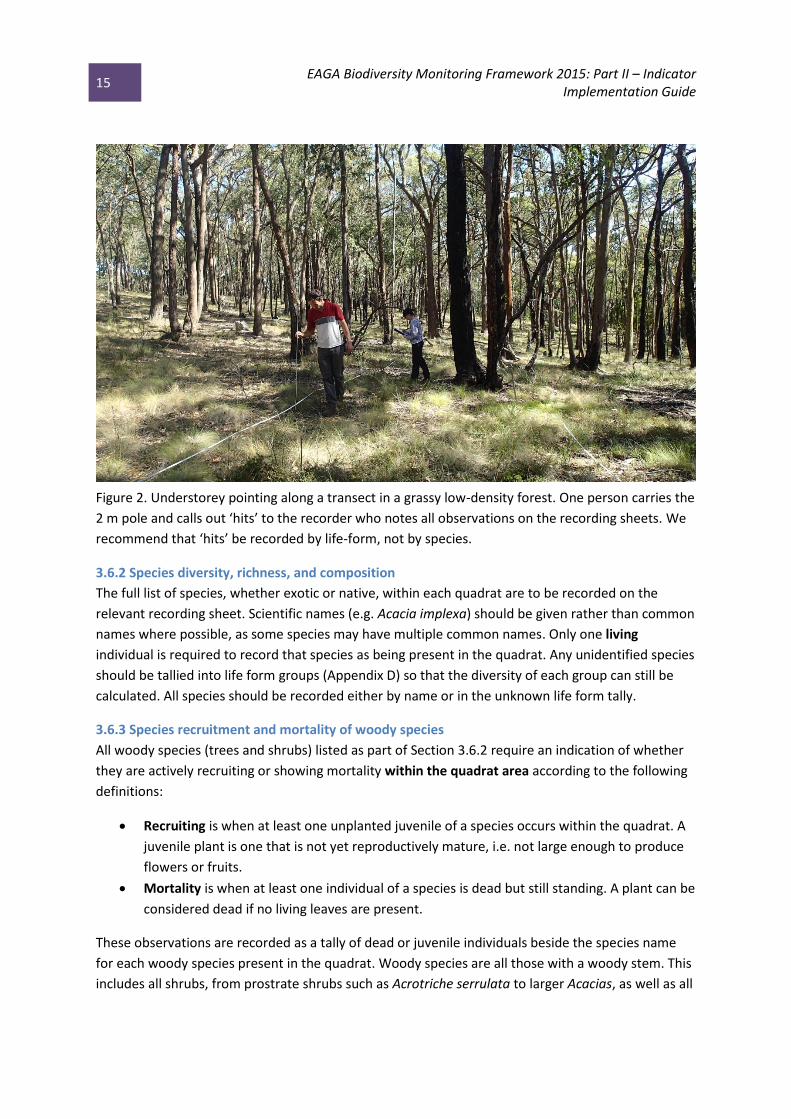
Figure 2. Understorey pointing along a transect in a grassy low-density forest. One person carries the
2 m pole and calls out ‘hits’ to the recorder who notes all observations on the recording sheets. We
recommend that ‘hits’ be recorded by life-form, not by species.
3.6.2 Species diversity, richness, and composition
The full list of species, whether exotic or native, within each quadrat are to be recorded on the
relevant recording sheet. Scientific names (e.g. Acacia implexa) should be given rather than common
names where possible, as some species may have multiple common names. Only one living
individual is required to record that species as being present in the quadrat. Any unidentified species
should be tallied into life form groups (Appendix D) so that the diversity of each group can still be
calculated. All species should be recorded either by name or in the unknown life form tally.
3.6.3 Species recruitment and mortality of woody species
All woody species (trees and shrubs) listed as part of Section 3.6.2 require an indication of whether
they are actively recruiting or showing mortality within the quadrat area according to the following
definitions:
Recruiting is when at least one unplanted juvenile of a species occurs within the quadrat. A
juvenile plant is one that is not yet reproductively mature, i.e. not large enough to produce
flowers or fruits.
Mortality is when at least one individual of a species is dead but still standing. A plant can be
considered dead if no living leaves are present.
These observations are recorded as a tally of dead or juvenile individuals beside the species name
for each woody species present in the quadrat. Woody species are all those with a woody stem. This
includes all shrubs, from prostrate shrubs such as Acrotriche serrulata to larger Acacias, as well as all
16 EAGA Biodiversity Monitoring Framework 2015: Part II – Indicator
Implementation Guide
trees, e.g. Eucalyptus spp. or Allocasuarina spp. All grasses and herbs that are non-woody should not
be included in this section.
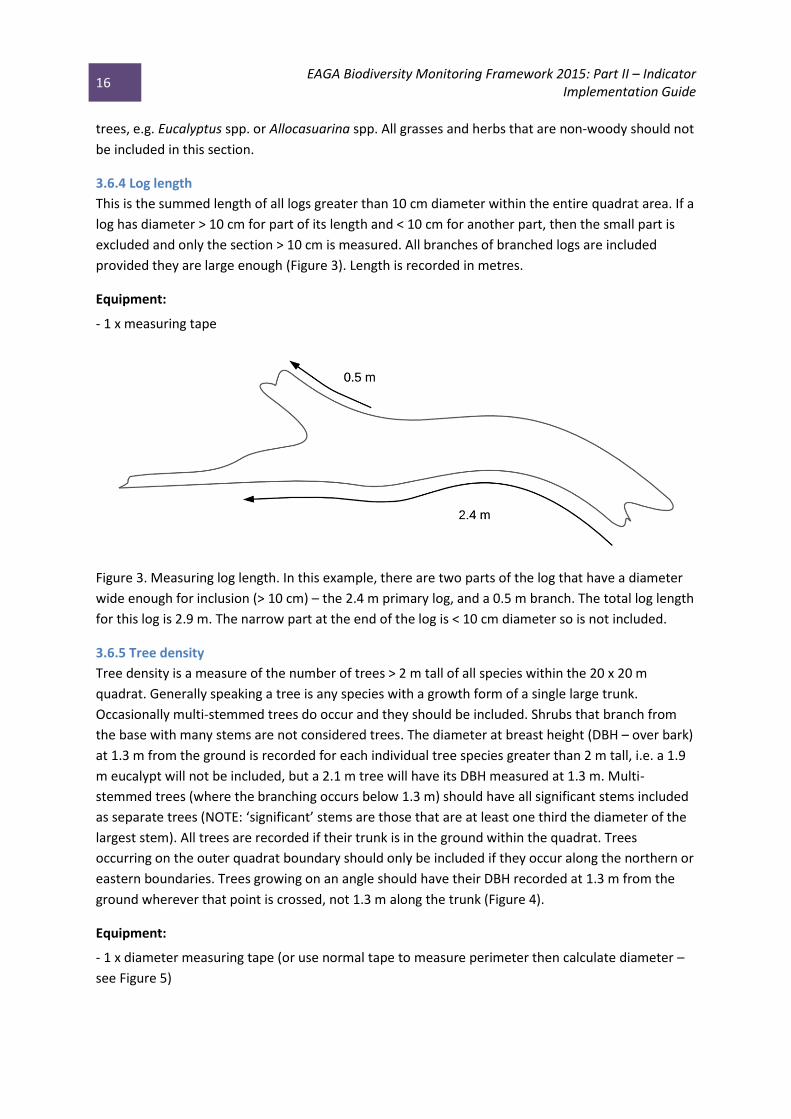
3.6.4 Log length
This is the summed length of all logs greater than 10 cm diameter within the entire quadrat area. If a
log has diameter > 10 cm for part of its length and < 10 cm for another part, then the small part is
excluded and only the section > 10 cm is measured. All branches of branched logs are included
provided they are large enough (Figure 3). Length is recorded in metres.
Equipment:
- 1 x measuring tape
Figure 3. Measuring log length. In this example, there are two parts of the log that have a diameter
wide enough for inclusion (> 10 cm) – the 2.4 m primary log, and a 0.5 m branch. The total log length
for this log is 2.9 m. The narrow part at the end of the log is < 10 cm diameter so is not included.
3.6.5 Tree density
Tree density is a measure of the number of trees > 2 m tall of all species within the 20 x 20 m
quadrat. Generally speaking a tree is any species with a growth form of a single large trunk.
Occasionally multi-stemmed trees do occur and they should be included. Shrubs that branch from
the base with many stems are not considered trees. The diameter at breast height (DBH – over bark)
at 1.3 m from the ground is recorded for each individual tree species greater than 2 m tall, i.e. a 1.9
m eucalypt will not be included, but a 2.1 m tree will have its DBH measured at 1.3 m. Multi-
stemmed trees (where the branching occurs below 1.3 m) should have all significant stems included
as separate trees (NOTE: ‘significant’ stems are those that are at least one third the diameter of the
largest stem). All trees are recorded if their trunk is in the ground within the quadrat. Trees
occurring on the outer quadrat boundary should only be included if they occur along the northern or
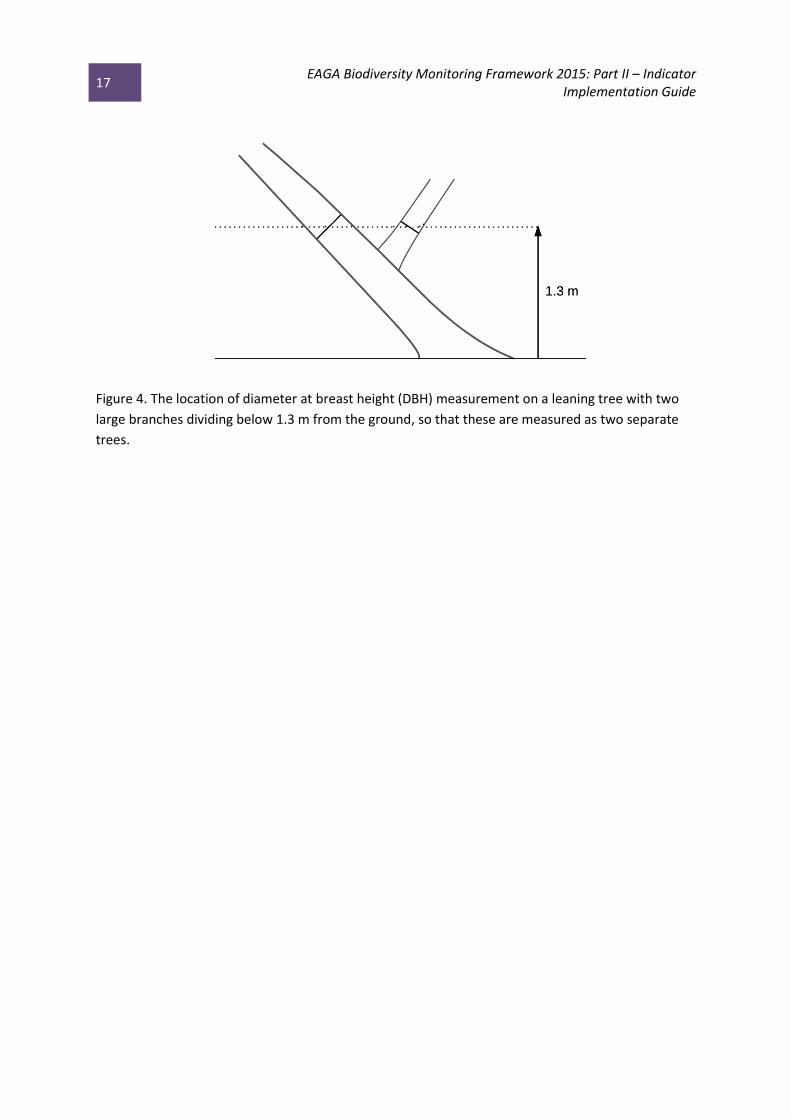
eastern boundaries. Trees growing on an angle should have their DBH recorded at 1.3 m from the
ground wherever that point is crossed, not 1.3 m along the trunk (Figure 4).
Equipment:
- 1 x diameter measuring tape (or use normal tape to measure perimeter then calculate diameter –
see Figure 5)
17 EAGA Biodiversity Monitoring Framework 2015: Part II – Indicator
Implementation Guide
Figure 4. The location of diameter at breast height (DBH) measurement on a leaning tree with two
large branches dividing below 1.3 m from the ground, so that these are measured as two separate
trees.
18 EAGA Biodiversity Monitoring Framework 2015: Part II – Indicator
Implementation Guide
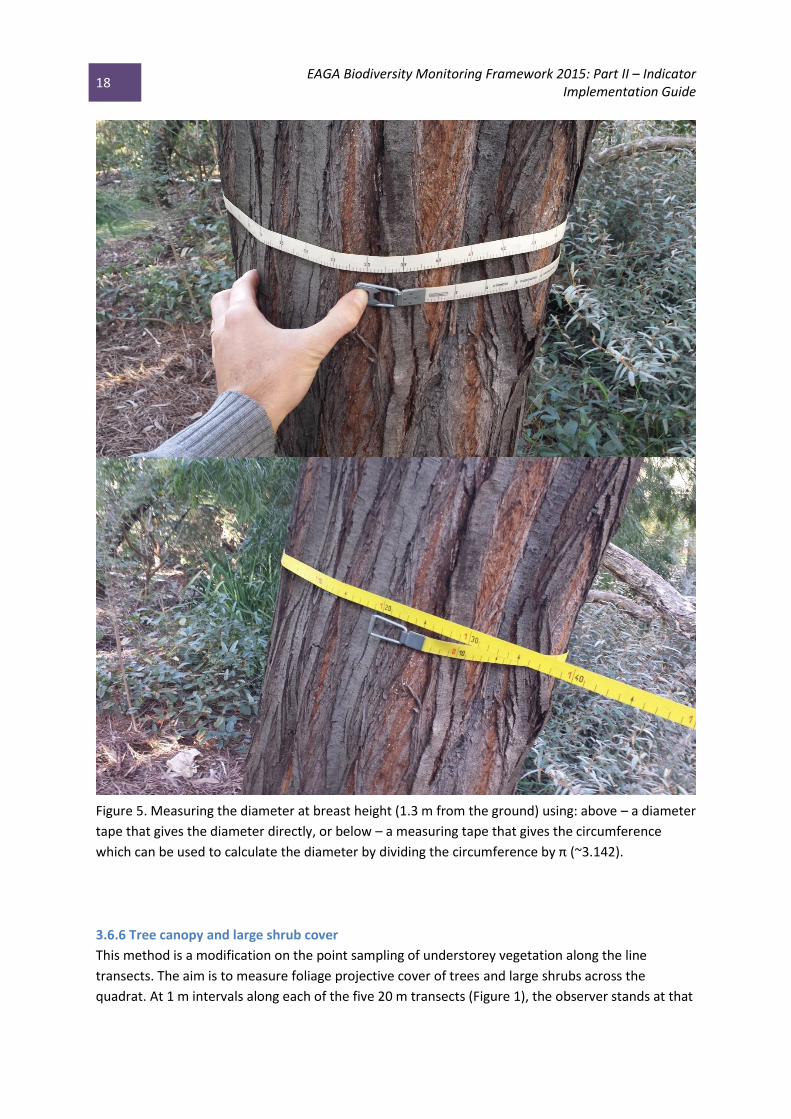
Figure 5. Measuring the diameter at breast height (1.3 m from the ground) using: above – a diameter
tape that gives the diameter directly, or below – a measuring tape that gives the circumference
which can be used to calculate the diameter by dividing the circumference by π (~3.142).
3.6.6 Tree canopy and large shrub cover
This method is a modification on the point sampling of understorey vegetation along the line
transects. The aim is to measure foliage projective cover of trees and large shrubs across the
quadrat. At 1 m intervals along each of the five 20 m transects (Figure 1), the observer stands at that

19 EAGA Biodiversity Monitoring Framework 2015: Part II – Indicator
Implementation Guide
point and records the presence or absence of foliage directly above them (Figure 6). The observer
should alternate starting at 0 m and 1 m along adjacent transects to balance the spread of points
across the quadrat.
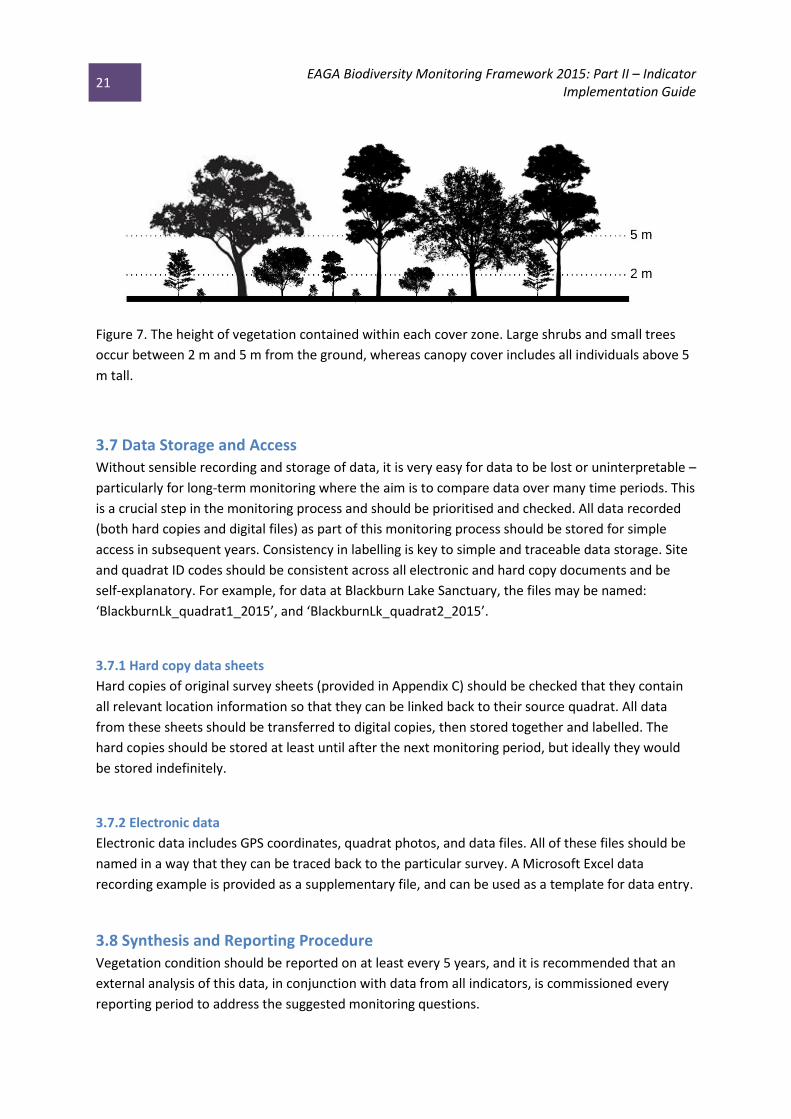
The presence or absence of cover is recorded for four categories: eucalypt trees (>5 m tall), non-
eucalypt trees (>5 m), juvenile eucalypt trees (2–5 m), and all non-eucalypts (2–5 m), see Figure 7.
Determining which plants are within each height range can be simplified using the 2 m understorey
pointing pole. All plants taller than this pole should be included in this section. If the observer stands
tall and holds the end of the 2 m pole directly above them then the combined height of the observer
and pole should reach to approximately 4.5–5 m. This method can also be used to do the pointing
where the pole raised above the head at each point can give the observer a reference to determine
if a large shrub or tree has foliage directly above that point.
Records at every metre along the five transects gives a number of ‘hits’ from a total of 100 points,
i.e. the number of hits is the percentage cover. In recording foliage projective cover, this can show if
there is a decline in the amount of leaf, which is related to canopy health.

20 EAGA Biodiversity Monitoring Framework 2015: Part II – Indicator
Implementation Guide
Figure 6. Point sampling of canopy cover. Cover is recorded if the point directly above the observer
contains leaf cover – in these examples the upper panel would score a ‘hit’ while the lower panel
would not.
21 EAGA Biodiversity Monitoring Framework 2015: Part II – Indicator
Implementation Guide
Figure 7. The height of vegetation contained within each cover zone. Large shrubs and small trees
occur between 2 m and 5 m from the ground, whereas canopy cover includes all individuals above 5
m tall.
3.7 Data Storage and Access
Without sensible recording and storage of data, it is very easy for data to be lost or uninterpretable –
particularly for long-term monitoring where the aim is to compare data over many time periods. This
is a crucial step in the monitoring process and should be prioritised and checked. All data recorded
(both hard copies and digital files) as part of this monitoring process should be stored for simple
access in subsequent years. Consistency in labelling is key to simple and traceable data storage. Site
and quadrat ID codes should be consistent across all electronic and hard copy documents and be
self-explanatory. For example, for data at Blackburn Lake Sanctuary, the files may be named:
‘BlackburnLk_quadrat1_2015’, and ‘BlackburnLk_quadrat2_2015’.
3.7.1 Hard copy data sheets
Hard copies of original survey sheets (provided in Appendix C) should be checked that they contain
all relevant location information so that they can be linked back to their source quadrat. All data
from these sheets should be transferred to digital copies, then stored together and labelled. The
hard copies should be stored at least until after the next monitoring period, but ideally they would
be stored indefinitely.
3.7.2 Electronic data
Electronic data includes GPS coordinates, quadrat photos, and data files. All of these files should be
named in a way that they can be traced back to the particular survey. A Microsoft Excel data
recording example is provided as a supplementary file, and can be used as a template for data entry.
3.8 Synthesis and Reporting Procedure
Vegetation condition should be reported on at least every 5 years, and it is recommended that an
external analysis of this data, in conjunction with data from all indicators, is commissioned every
reporting period to address the suggested monitoring questions.

22 EAGA Biodiversity Monitoring Framework 2015: Part II – Indicator
Implementation Guide
At each reporting period the following questions should be addressed:
1) Is the current status of measured attributes of native vegetation improving, stable or
declining? And by how much?
2) Is the current status of measured attributes of vegetation within different vegetation types
changing equally?
3) Are different vegetation types changing equally across all LGAs?
4) What are the likely causes of the observed changes?
5) How can this information be used to inform future management?

23 EAGA Biodiversity Monitoring Framework 2015: Part II – Indicator
Implementation Guide
4. Indicator Three - Phenology
4.1 Monitoring Questions
1. Is the timing or duration of breeding or flowering of targeted species changing over time?
2. Where is this occurring and for what species?
3. How much change has occurred?
4. How can this information be used to inform future management?
4.2 Definition and Background
Phenology is the term given to the observations of cyclic and seasonal natural phenomena,
especially in relation to climate and plant and animals, involving seasonal or cyclical observations,
such as the timing of fruiting or flowering, or the arrival or departure time of migratory species of
animal. Plants and animals may begin flowering or breeding earlier or later in the season, or for
longer if climatic conditions change.
ClimateWatch was developed by Earthwatch with the Bureau of Meteorology and The University of
Melbourne to understand how changes in temperature and rainfall are affecting the seasonal
behaviour of Australia's plants and animals. The first continental phenology project in the Southern
Hemisphere, ClimateWatch enables every Australian to be involved in collecting and recording data
that will help shape the country’s scientific response to climate change. ClimateWatch has an
established website (http://www.climatewatch.org.au/) and process for engaging citizens, including
a phone app, school material and the establishment of dedicated ClimateWatch ‘trails’. The
information recorded is publically available via the Atlas of Living Australia. This information can be
used by all Councils in the EAGA region to track changes in target species occurring locally, via the
establishment of a series of ‘trails’, specific to the region. Incidental observations can also be
captured, from across each LGA if desired.
This indicator will allow Councils to track the amount of change occurring across the region and in
targeted locations for a set list of plant and animal species. The extent of phenological change is
weather dependant; hence, this indicator can be used to detect changes caused by climate change.
The magnitude of change will depend on the species selected for observation, which can be
developed through collaboration with ClimateWatch and targeted towards species predicted to
change the most. It is recommended that the same species be monitored within each Council area,
to facilitate data comparison, however optional additional species can also be used where required.
4.3 Site Selection
Phenology should be primarily measured using established ClimateWatch trails in the region. A
partnership with EarthWatch to establish a set number of trails in the EAGA region is being
developed currently, subject to commitments made by each LGA.

24 EAGA Biodiversity Monitoring Framework 2015: Part II – Indicator
Implementation Guide
To enable sufficient data collection under this indicator it is recommended that a minimum of three
trails (but preferably more) be established in the region, each set within vegetation communities
known to differ in their sensitivity to climate change.
Modelling research conducted as part of Phase 1 of this project (Meacher and Blair 2013) found that the range of some species would change markedly, particularly Eucalyptus ovata and E. rubida. The research also suggested that species within vegetation communities may respond independently to each other, resulting in changes to community composition and; different types of vegetation communities would vary in their vulnerability to climate change. Ecological Vegetation Classes (EVCs) of greatest concern as a result of the Phase 1 modelling were:
Grassy Woodland (City of Boroondara)
Swampy Woodland (Cities of Knox, Monash and Whitehorse)
Swampy Riparian Woodland (Cities of Knox, Monash and Whitehorse)
Valley Grassy Forest (Yarra Ranges Council) EVCs of significant concern were:
Damp Forest (Yarra Ranges Council)
Herb-rich Foothill Forest (Yarra Ranges Council)
Lowland Forest (Yarra Ranges Council)
Riparian Forest (Yarra Ranges Council)
Shrubby Foothill Forest (Yarra Ranges Council)
Wet Forest (Yarra Ranges Council) EVC of concern was:
Floodplain Riparian Woodland (City of Boroondara)
Hence, it is recommended that a ClimateWatch trail be established in native vegetation in actively
managed areas (e.g. Council managed land, bushland reserves, sites of conservation significance)
that contain any combination of the above listed species or vegetation communities. It is also
recommended that in addition to the trails being established within Monash, Knox and Stonnington,
additional trails are considered in Whitehorse and Yarra Ranges, as Phase 1 modelling suggests
changes will be greatest within these LGA’s. If trails cannot be established, observations can still be
made on an ad-hoc basis, although trails are recommended so that the causes of change can more
easily be assessed.
For the greatest uptake by the community, it is recommended that these sites are also areas of high
public visitation, where an associated ‘Friends of’ group, or nearby School or higher education
facility will allow for greater exposure to the public and could be included within curriculum. For
Councils without these listed EVCs, it is recommended that places containing a mix of native and
exotic plant species that are often visited by the public be considered. Once established, each
ClimateWatch trail will have a map developed and instructions for data capture, including a list of
species of interest. This is detailed below.

25 EAGA Biodiversity Monitoring Framework 2015: Part II – Indicator
Implementation Guide
4.4 Data Capture
Phenology information should be captured using existing tools within the ClimateWatch program.
Data should be captured primarily along established climate trails, however additional incidental
observations can also be promoted by each Council and collected by any interested party. Once
trails have been established in conjunction with ClimateWatch, the EAGA region will be able to
access its own webpage for documenting observed changes in phenology along the trails, in addition
to harvesting incidental observations for the region.
4.4.1 Suggested species for monitoring phenology
Once the trails are established, the EAGA region Councils can work alongside ClimateWatch to select
species most relevant to monitor, although this will largely be determined by the position of the trail
and the species found along it. It is recommended that most of the plant and animal species
recommended by ClimateWatch be included allowing for overlap in the species monitored across
the region, including a particular focus on a subset of the following bird species (Table 2), to
complement the Local Bird Communities Indicator (Section 5). The species lists can be revised in the
future, and are periodically updated by ClimateWatch to expand species being monitored.
Table 2: ClimateWatch Bird Species for Victoria. These species were selected by ClimateWatch
because they are conspicuous and their phenology is likely to be affected by a changing climate.
1. Australian Magpie 2. Black Swan 3. Black-eared Cuckoo 4. Black-faced Cuckoo-shrike 5. Channel-billed Cuckoo 6. Common Blackbird 7. Common Starling 8. Crested Pigeon 9. Dusky Moorhen 10. Eastern Koel (formerly Common Koel) 11. Eastern Spinebill 12. Eastern Yellow Robin 13. Fan-tailed Cuckoo 14. Flame Robin 15. Golden Whistler 16. Grey Butcherbird
17. Grey Fantail 18. Horsfield's Bronze-cuckoo 19. Lewin’s Honeyeater 20. Magpie-lark 21. Masked Lapwing 22. Pallid Cuckoo 23. Pied Butcherbird 24. Rainbow Bee-eater 25. Rufous Whistler 26. Shining Bronze-cuckoo 27. Swift Parrot 28. Welcome Swallow 29. White-faced Heron 30. Willie Wagtail 31. Yellow-faced Honeyeater
4.4.2 Suggested timing of data capture
It is recommended that phenology data be collected along the established trails, or via incidental
records, four times per year, or once per season (Summer, Autumn, Winter, Spring). Data capture
can be facilitated by advertising the trail to local school or community groups, installing signage at
each trail, and by providing information to residents about the ClimateWatch program, website and
apps. This promotion should be undertaken by each Council using their existing networks and via
ClimateWatch’s large database of registered participants.

26 EAGA Biodiversity Monitoring Framework 2015: Part II – Indicator
Implementation Guide
4.4.3 Example of data captured for the Magpie-lark (Grallina cyanoleuca)
The ClimateWatch website describes each species listed, and why it should be monitored. For
example, the website states that for the Magpie-lark,
(http://www.climatewatch.org.au/species/birds/magpie-lark, ClimateWatch 2012) climate change is
most likely to affect this species by enabling it to expand its range into the currently arid parts of
Australia. The main factor limiting its distribution in drier areas is the availability of mud for nest-
building, so it is often confined to watercourses or areas where water is permanently available. If
climate change leads to increasing rainfall in some areas, this may enable Magpie-larks to expand
into areas where it was previously unable to breed. The effects of climate change may also influence
the timing of when Magpie-larks start to breed and the duration of their breeding activities.
The type of data that ClimateWatch requests for each species includes the date of observation, the
species, an observation about its behaviour or fruiting/flowering status, habitat type and location. In
addition, a photo can be uploaded, allowing others to confirm the record, although this is not
mandatory. The specific information required for a complete observation of the Magpie Lark is as
follows:
Data recorded:
Abundance
Date/time
Sighting photo
Species attributes to observe:
Behaviour
Courting/mating
Calling
Feeding
Bird on chicks
Bird on eggs
Bird on nest
Bird feeding young
Nest present yes/no
Habitat type (select) from list: urban, peri urban, rural, botanic garden, nature reserve,
parkland, backyard, near a natural water source, near an artificial water source, not near
water, near rocky outcrop, on open plain, near a road, in medium vegetation, in dense
vegetation.
Location: Latitude and longitude
4.5 Data Storage and Access
The information recorded is stored and made publically available via the Atlas of Living Australia
(http://www.ala.org.au/). The information recorded per trail and for the region can also be
requested from ClimateWatch at agreed times under a data sharing agreement, for use in EAGA
regional reporting.

27 EAGA Biodiversity Monitoring Framework 2015: Part II – Indicator
Implementation Guide
4.6 Synthesis and Reporting Procedure
Using the data collected, phenology can be summarised across each LGA. Phenological changes per
listed species should be reported on every 2-3 years.
At each reporting period the following questions should be addressed:
1) Is the timing and duration of flowering changing, for which species and in what direction?
2) Is the timing and duration of breeding changing, for which species and in what direction?
3) Where are these changes being observed?
4) What is the magnitude of these changes in comparison to the last reporting period?
5) How can this information be used to inform future management?

28 EAGA Biodiversity Monitoring Framework 2015: Part II – Indicator
Implementation Guide
5. Indicator Four - Local bird communities Birdlife Australia is a non-government conservation organisation dedicated to conserving bird
species and habitat (http://birdlife.org.au/). Birdlife Australia and their predecessors have been
conducting Australia-wide bird surveys (Atlas of Australian Birds and Birdata) since 1977 and
maintain a large database of distribution and abundance data supplied mostly by citizen scientists. It
is the intention of this framework to utilise existing BirdLife sites and volunteers in the EAGA region
in partnership with BirdLife Australia.
5.1 Monitoring Questions
Bird monitoring data should be collected using the standard BirdLife two hectare 20 minute surveys
to record all birds seen or heard, predominantly from already established BirdLife sites within the
EAGA region. From the list of all bird species, two specific monitoring questions can be asked:
1) What species of climate-affected birds are occurring or disappearing in your LGA over time?
2) What species of urban-sensitive birds are occurring or disappearing in your LGA over time (e.g.
Council managed land, bushland reserves, sites of conservation significance)?
3) Is the abundance or phenology of these species changing over time?
4) How can this information be used to inform future management?
Some species within the bird community will respond to changing climatic conditions (e.g. especially
water birds), while others may respond more directly to management actions, such as revegetation
or weed control activities. Field surveys should record the full inventory of birds seen or heard in
each survey site, but it is recommended that the analysis of the monitoring data is directed to focus
on climate affected bird species and urban sensitive bird species specifically.
5.2 Definition and Background
5.2.1 Climate affected bird species
The species of birds found in an area can be used as an indicator of many different things such as
changes in weather and climate patterns, shifting flowering, water and other food resources in an
area, or local and landscape scale changes in habitat. For example, for questions relating to climate
change, monitoring across a temperature or altitudinal gradient may indicate cool-climate adapted
species’ distributions moving to encompass cooler climate regions. Alternatively, some warm-
climate species may extend or shift their distributions into the Melbourne region from areas like east
Gippsland or southern NSW as Melbourne becomes warmer or as northern regions of the state
become hotter and drier, especially in the north-east (Loyn and Menhorst 2011). The way this
pattern could emerge is unclear, but may begin with species that were once considered rare
vagrants becoming regular summer visitors and then on to overwintering or breeding in the region.
For example, Eastern Koel’s were once considered rare vagrants in Melbourne, but are now
considered regular summer visitors (Loyn and Menkhorst 2011) and eventually they may be
considered residents of Greater Melbourne. This species and others are listed as likely to be affected
by a changing climate in Victoria, and are listed in Table 2 above for use as indicator species in the

29 EAGA Biodiversity Monitoring Framework 2015: Part II – Indicator
Implementation Guide
EAGA region. However, because all species of bird seen or heard in the surveys are recorded, the
analysis of data is not restricted to these potential indicator species.
When new species are detected or become resident in Melbourne, further analysis will be required
to determine what each species potentially indicates. Reliably identifying the cause of the change in
species abundance or distribution will depend on knowing a number of factors including:
Species previous distribution (e.g. southern NSW vs north QLD species)
Possible modes of travel (e.g. did they fly on their own, escaped pets, etc?)
What resources are they exploiting to survive in Melbourne (e.g. are they feeding on Morton Bay
figs)?
What are the likely ecological consequences of the new species (e.g. competition, predation,
seed dispersal, pollination etc.)?
5.2.2 Urban sensitive bird species
Many bird species, especially small woodland birds, have declined dramatically in Victoria due to
land cover change, land management change and disruption to the natural competitive interaction
between native species and dominant hyper-aggressive species such as the Noisy and Bell Miners.
The Victorian Flora and Fauna Guarantee Act 1988 lists the community of Victorian Temperate
Woodland birds comprising of 24 species as threatened. These are important species that can
indicate woodland and forest condition for birds. Woodland or forest was the dominant vegetation-
type in the EAGA region before 1750, so for the purposes of this framework, we will focus on
woodland bird species, and species known to be sensitive to habitat condition in urban areas as the
second indicator group. These species are sensitive to common management actions, but sufficiently
abundant and tolerant of urbanisation to occur throughout the region and be detected in managed
areas. These bird species respond rapidly to increases in patch size, habitat structure, insect
abundance and competition from larger aggressive disturbance tolerant species.
Patch size was recently found to be a very important factor in determining bird species richness
within urban remnants (Palmer et al. 2008). Other factors that influence bird communities in the
region include shrub or canopy complexity and the presence of riparian vegetation (Palmer et al.
2008). A dominant factor altering the density and richness of small bird communities is the presence
of noisy miner colonies in a habitat patch (Piper and Catterall 2003). This hyper-aggressive species
competitively excludes many bird species, and will influence the richness of woodland birds
recorded in the EAGA region. Other factors influencing the sensitivity of birds to management
actions or urban impacts are their diet, mode of foraging, and morphological traits. For example, a
study by Conole and Kirkpatrick (2011) found that the species most sensitive to urbanisation are
likely to be ground/shrub/canopy nesters and specialist feeders (eg. insectivores) with small or large
body size.
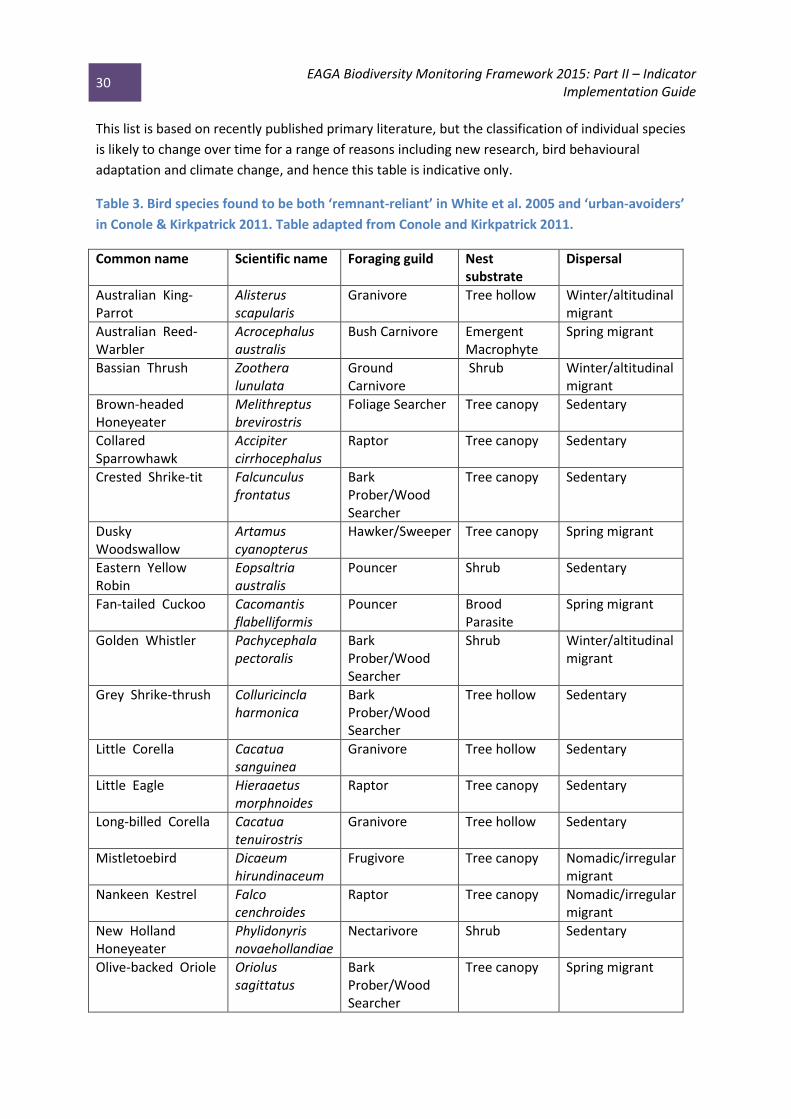
In the Greater Melbourne area, the following species (Table 3) are currently classified as ‘remnant-
reliant’ and ‘urban avoiders’, meaning they are not commonly found outside remnant vegetation
and their distribution is correlated with lower urban intensity (White et al. 2005, Palmer et al. 2008,
Conole and Kirkpatrick 2011). The presence of these ‘urban sensitive’ species in patches of urban
bushland indicates an area contains habitat in a more ‘natural’ or ‘healthy’, and functional state.
30 EAGA Biodiversity Monitoring Framework 2015: Part II – Indicator
Implementation Guide
This list is based on recently published primary literature, but the classification of individual species
is likely to change over time for a range of reasons including new research, bird behavioural
adaptation and climate change, and hence this table is indicative only.
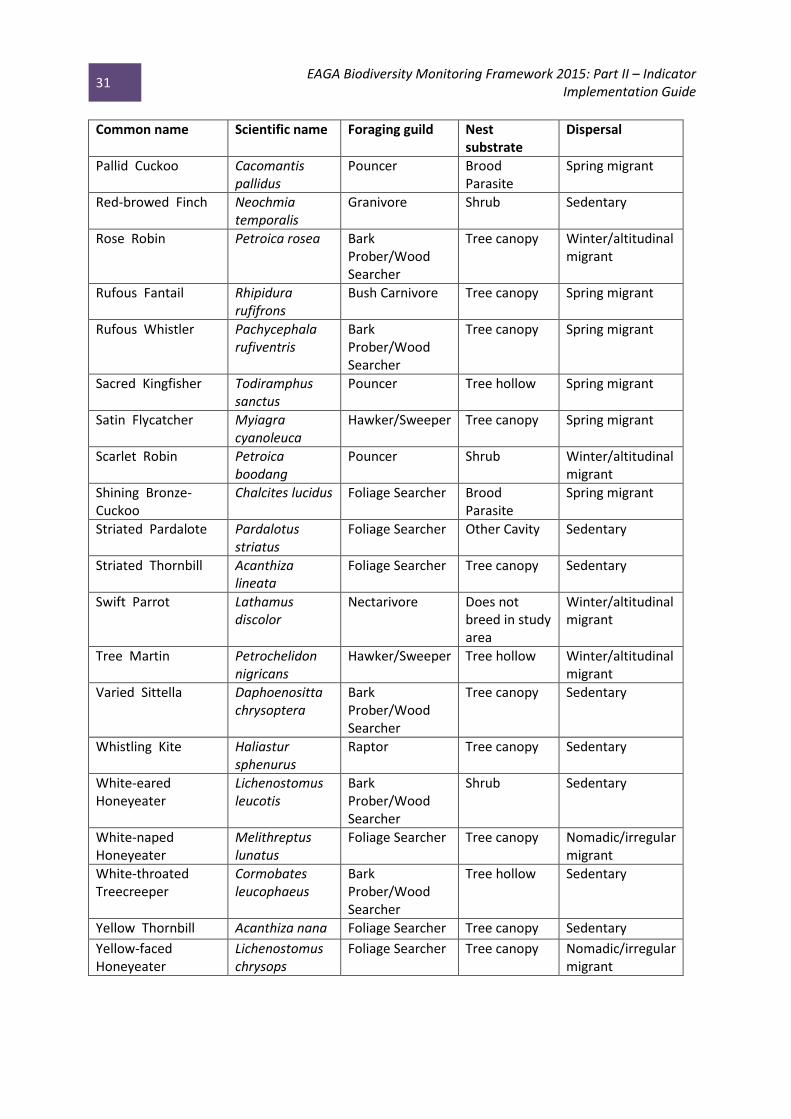
Table 3. Bird species found to be both ‘remnant-reliant’ in White et al. 2005 and ‘urban-avoiders’
in Conole & Kirkpatrick 2011. Table adapted from Conole and Kirkpatrick 2011.
Common name Scientific name Foraging guild Nest substrate
Dispersal
Australian King-Parrot
Alisterus scapularis
Granivore Tree hollow Winter/altitudinal migrant
Australian Reed-Warbler
Acrocephalus australis
Bush Carnivore Emergent Macrophyte
Spring migrant
Bassian Thrush Zoothera lunulata
Ground Carnivore
Shrub Winter/altitudinal migrant
Brown-headed Honeyeater
Melithreptus brevirostris
Foliage Searcher Tree canopy Sedentary
Collared Sparrowhawk
Accipiter cirrhocephalus
Raptor Tree canopy Sedentary
Crested Shrike-tit Falcunculus frontatus
Bark Prober/Wood Searcher
Tree canopy Sedentary
Dusky Woodswallow
Artamus cyanopterus
Hawker/Sweeper Tree canopy Spring migrant
Eastern Yellow Robin
Eopsaltria australis
Pouncer Shrub Sedentary
Fan-tailed Cuckoo Cacomantis flabelliformis
Pouncer Brood Parasite
Spring migrant
Golden Whistler Pachycephala pectoralis
Bark Prober/Wood Searcher
Shrub Winter/altitudinal migrant
Grey Shrike-thrush Colluricincla harmonica
Bark Prober/Wood Searcher
Tree hollow Sedentary
Little Corella Cacatua sanguinea
Granivore Tree hollow Sedentary
Little Eagle Hieraaetus morphnoides
Raptor Tree canopy Sedentary
Long-billed Corella Cacatua tenuirostris
Granivore Tree hollow Sedentary
Mistletoebird Dicaeum hirundinaceum
Frugivore Tree canopy Nomadic/irregular migrant
Nankeen Kestrel Falco cenchroides
Raptor Tree canopy Nomadic/irregular migrant
New Holland Honeyeater
Phylidonyris novaehollandiae
Nectarivore Shrub Sedentary
Olive-backed Oriole Oriolus sagittatus
Bark Prober/Wood Searcher
Tree canopy Spring migrant
31 EAGA Biodiversity Monitoring Framework 2015: Part II – Indicator
Implementation Guide
Common name Scientific name Foraging guild Nest substrate
Dispersal
Pallid Cuckoo Cacomantis pallidus
Pouncer Brood Parasite
Spring migrant
Red-browed Finch Neochmia temporalis
Granivore Shrub Sedentary
Rose Robin Petroica rosea Bark Prober/Wood Searcher
Tree canopy Winter/altitudinal migrant
Rufous Fantail Rhipidura rufifrons
Bush Carnivore Tree canopy Spring migrant
Rufous Whistler Pachycephala rufiventris
Bark Prober/Wood Searcher
Tree canopy Spring migrant
Sacred Kingfisher Todiramphus sanctus
Pouncer Tree hollow Spring migrant
Satin Flycatcher Myiagra cyanoleuca
Hawker/Sweeper Tree canopy Spring migrant
Scarlet Robin Petroica boodang
Pouncer Shrub Winter/altitudinal migrant
Shining Bronze-Cuckoo
Chalcites lucidus Foliage Searcher Brood Parasite
Spring migrant
Striated Pardalote Pardalotus striatus
Foliage Searcher Other Cavity Sedentary
Striated Thornbill Acanthiza lineata
Foliage Searcher Tree canopy Sedentary
Swift Parrot Lathamus discolor
Nectarivore Does not breed in study area
Winter/altitudinal migrant
Tree Martin Petrochelidon nigricans
Hawker/Sweeper Tree hollow Winter/altitudinal migrant
Varied Sittella Daphoenositta chrysoptera
Bark Prober/Wood Searcher
Tree canopy Sedentary
Whistling Kite Haliastur sphenurus
Raptor Tree canopy Sedentary
White-eared Honeyeater
Lichenostomus leucotis
Bark Prober/Wood Searcher
Shrub Sedentary
White-naped Honeyeater
Melithreptus lunatus
Foliage Searcher Tree canopy Nomadic/irregular migrant
White-throated Treecreeper
Cormobates leucophaeus
Bark Prober/Wood Searcher
Tree hollow Sedentary
Yellow Thornbill Acanthiza nana Foliage Searcher Tree canopy Sedentary
Yellow-faced Honeyeater
Lichenostomus chrysops
Foliage Searcher Tree canopy Nomadic/irregular migrant

32 EAGA Biodiversity Monitoring Framework 2015: Part II – Indicator
Implementation Guide
5.3 Site Selection
We recommend that sites with a history of being surveyed by Birdlife continue to be surveyed under
this framework. New sites can also be added where necessary. BirdLife runs many community
monitoring projects around Australia, and relevant sites for each scheme are pooled and termed
“Group Sites”, each with dedicated web pages and instructions specific to that group. The current
BirdLife sites that have been adopted under this framework for the EAGA Group can be viewed at
the project website: http://www.birdlife.org.au/projects/biodiversity-monitoring-in-melbournes-
east. This web-page describes the survey methodology, sites (including a map), directions, and
survey instructions, enabling any registered Birdlife volunteer to choose a site from the Group Sites
list and undertake a survey. People who visit the website can download a list of recent surveys done
at that site and view the data collected.
It is recommended that vegetation monitoring (Indicator Two) be undertaken at all Group Sites
where bird data is being recorded. Hence, additional sites added to the current list should be
suitable for both bird surveys and vegetation monitoring.
5.4 Data Capture
Birdlife Australia are well equipped to capture, store and maintain data on bird species distribution
and abundance, as well as assisting to engage citizen scientists in capturing data. Given their well-
established methodology and participant base, a partnership between the EAGA Councils and
BirdLife has been developed to capture and promote the standardised collection of bird data on land
managed by Councils.
5.4.1 Bird surveys
Bird surveys should be conducted by using standard 20 min 2 hectare bird searches in actively
managed areas (e.g. Council managed land, bushland reserves, sites of conservation significance).
This data should be collected at least once per season, or four times per year (Summer, Autumn,
Winter, Spring). Data collected should be recorded on standard Bird Atlas forms, given to
participants once they register at the website. All data collectors should register with BirdLife, using
the instructions listed below at the BirdLife methodology website.
The data collected should be used to assess 1) the occurrence or disappearance of climate affected
bird species listed in Table 2; and 2) the occurrence or disappearance of urban sensitive bird species
listed in Table 3.
The data collected on the standard Bird Atlas forms can be uploaded to the website, where the
following is required:
Date, time and duration of survey.
Type of search (2 ha 20 minute search)
No. of people undertaking the survey
Bird species recorded, including breeding status, and abundance (number of individuals).
For the purposes of this framework, the abundance and breeding status of each species seen is
required as this information can also be used under the Phenology Indicator (Section 4).

33 EAGA Biodiversity Monitoring Framework 2015: Part II – Indicator
Implementation Guide
Detailed instructions for bird surveys using the Birdlife methods can be found at
https://docs.google.com/viewer?url=http%3A%2F%2Fwww.birdlife.org.au%2Fdocuments%2FATL-
Starter-Kit-2012.pdf
5.4.2 Data collection options
There are several ways bird data can be collected, including:
1. Train Council staff via training workshops run by BirdLife* to record birds in specified locations as
part of regular work programs
2. Start a Council bird survey volunteer group
3. Use friends or local field naturalist groups and the community, and train participants in bird survey
methods via training workshops run by BirdLife*
4. Engage consultants to undertake surveys
5. Develop University research links for honours or third year programs
* BirdLife have indicated they are willing to run additional training workshops to train participants in
bird survey methods, the use of the BirdLife Atlas, and data upload. They can also assign new bird
watchers a mentor if requested, allowing for the ongoing training of people in bird survey
techniques.
Data capture can be facilitated by advertising the program and sites to local residents, schools and
community groups and by installing signage at each site. This promotion should occur via each
Councils networks, and via utilising BirdLife’s existing networks.
5.4.3 Site monitoring
Each Council should monitor the number of surveys conducted at each site on a seasonal basis by
viewing the project website. This will allow Councils to check if any sites have not been surveyed at
all, allowing for targeted surveys to be commissioned via the above pathways.
5.5 Data Storage and Access
All data captured is entered by the observer at the website dedicated to the EAGA region
http://www.birdlife.org.au/projects/biodiversity-monitoring-in-melbournes-east. All users must
register to use the website, where detailed instructions are provided.
All data entered using this system is screened by bird experts at BirdLife and entered into the Birds
of Australia Atlas. Councils can then request this data from BirdLife at agreed times under a data
sharing agreement, for use in EAGA regional reporting. It is recommended that data requests include
all bird species recorded per site (both current and historic records); species abundance and
breeding status; survey details (date, time, survey type); and a category that flags if the listed species
are either a) climate affected or b) urban sensitive to facilitate reporting under this framework.

34 EAGA Biodiversity Monitoring Framework 2015: Part II – Indicator
Implementation Guide
5.6 Synthesis and Reporting Procedure
Bird data should be reported on in conjunction with the phenology indicator (Indicator Three, every 2-3 years), and in conjunction with using data collected under the vegetation extent and change indictors (Indicator One and Two, every 5th year). At each reporting period the following questions should be addressed: 1) What was the number and abundance of climate affected species occurring or disappearing per
LGA and in which locations?
2) What is the number and abundance of urban sensitive species occurring or disappearing per LGA
and in which locations?
3) What is the magnitude of these changes in comparison to the last reporting period?
4) Has the phenology of these species changed over time?
5) Why are these changes occurring? Has there been a parallel improvement or decline in vegetation
condition or extent?
6) How can this information be used to inform future management?
35 EAGA Biodiversity Monitoring Framework 2015: Part II – Indicator
Implementation Guide
6. References Conole, L. & J. Kirkpatrick (2011). Functional and spatial differentiation of urban bird assemblages at
the landscape scale. Landscape and Urban Planning 100: 11-23
DEPI (2014) DRAFT: Habitat Hectare Version 2 Assessment Manual. Victorian Government
Department of Environment and Primary Industries, Melbourne.
DSE (Department of Sustainability and Environment) 2004. Vegetation Quality Assessment Manual-
Guidelines for applying the Habitat Hectares scoring method. Version 1.3. Victorian Government
Department of Sustainability and Environment, Melbourne.
Garnett, S. & D. Franklin (Eds) (2014). Climate change adaptation for Australian birds. CSIRO
Publishing, Melbourne.
Loyn, R. & P. Menkhorst (2011). The bird fauna of Melbourne: changes over a century of urban
growth and climate change, using a benchmark from Keartland (1900). The Victorian Naturalist 128:
210-232
Palmer, G., J. Fitzsimons, Antos, M. & J. White (2008). Determinates of native avian richness in
suburban remnant vegetation: Implications for conservation planning. Biological Conservation 141:
2329-2341
Piper, S. and Catterall, C. (2003) A particular case and a general pattern: hyper-aggressive behaviour
by one species may mediate avifaunal decreases in fragmented Australian forests. Oikos 101: 602 -
614
White, J., M. Antos, J. Fitzsimons, G. Palmer (2005). Non-uniform bird assemblages in urban
environments: the influence of streetscape vegetation. Landscape and Urban Planning 71: 123-135

EAGA Biodiversity Monitoring Framework 2015: Part II – Indicator
Implementation Guide
Appendix A: GIS data set Metro_EVC data layer enquiry form
Name: METRO_EVC
Full name: Metropolitan Ecological Vegetation Classes (EVC)
Spatial Extent: Metropolitan Melbourne
Owner: Australian Research Centre for Urban Ecology (ARCUE)
Custodian: ARCUE
Abstract: The Metropolitan EVC data set contains polygons that represent remnant native vegetation patches, along with their EVC, in the metropolitan Melbourne region.
The Metropolitan EVC data set is supplied free of charge for research and non-commercial purposes,
on the agreement that any updates or corrections performed on the data set be provided back to
ARCUE. It is also required that ARCUE is acknowledged as the owner of the data set on all published
material that reproduces the data set or refers to it in any way.
ARCUE cannot warrant the accuracy or completeness of the Metropolitan EVC data set, and any
person using or relying upon this information does so on the basis that ARCUE shall bear no
responsibility.
Contact:
Dr Amy Hahs GIS Ecologist Email : [email protected] Ph: 03 8344 0116
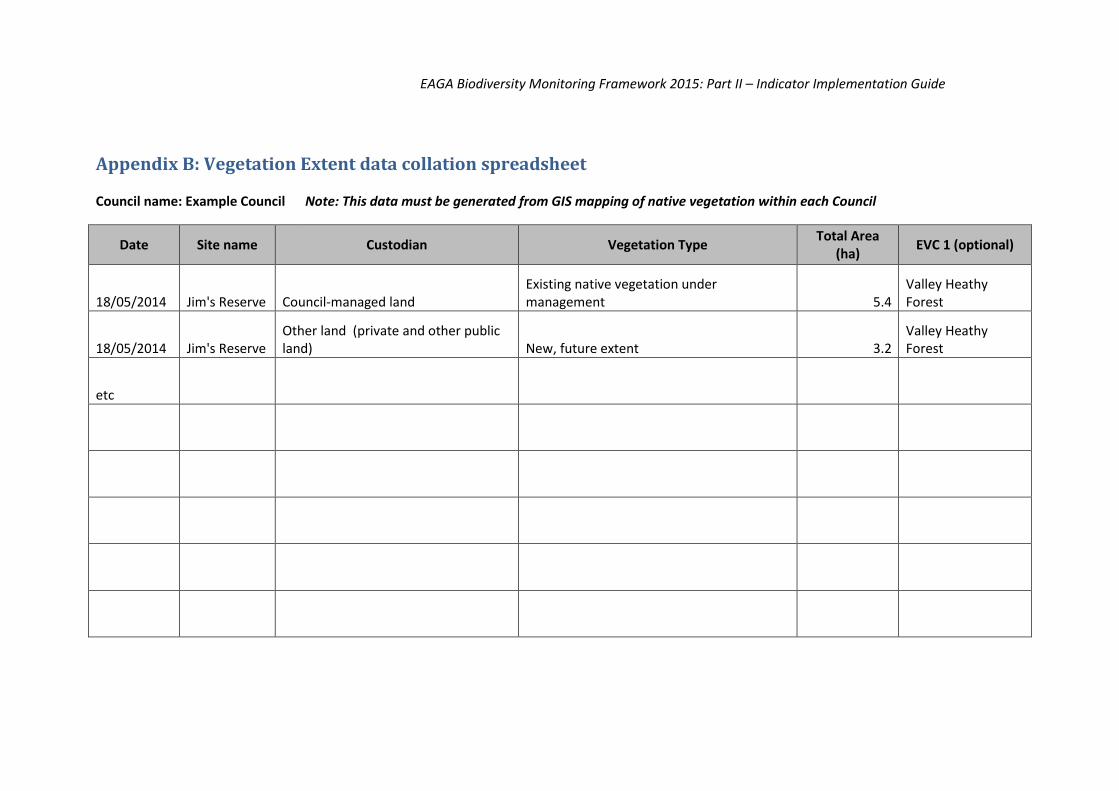
EAGA Biodiversity Monitoring Framework 2015: Part II – Indicator Implementation Guide
Appendix B: Vegetation Extent data collation spreadsheet
Council name: Example Council Note: This data must be generated from GIS mapping of native vegetation within each Council
Date Site name Custodian Vegetation Type Total Area
(ha) EVC 1 (optional)
18/05/2014 Jim's Reserve Council-managed land Existing native vegetation under management 5.4
Valley Heathy Forest
18/05/2014 Jim's Reserve Other land (private and other public land) New, future extent 3.2
Valley Heathy Forest
etc

EAGA Biodiversity Monitoring Framework 2015: Part II – Indicator Implementation Guide
Appendix C: Vegetation Change data collection field sheets
1. Understorey vegetation point transect - Option 1: recording by life form
2. Understorey vegetation point transect - Option 2: recording by species
3. Tree and large shrub cover, tree DBH, and log length
4. Full species list in quadrat - includes native and exotic species

Understorey vegeta.on point transect -‐ Op.on 1: recording by life form
Site and plot:______________________________________ Date:_________________
Observer:___________________________
Na:ve Exo:c Na:ve Exo:c Na:ve Exo:c Na:ve Exo:c Na:ve Exo:c
Tu?ed grass
Annual grass
Other monocot
Small shrub
Medium shrub
Tree seedling
Small herb
Large herb
Climber
Fern
Bryophyte/ Lichen
Bare ground
LiHer
Log
Rock
Life form
Tally of hits per life form in each transect
Transect 1 Transect 2 Transect 3 Transect 4 Transect 5

Understorey vegeta.on point transect -‐ Op.on 2: recording by species
Site and plot:__________________ Date:_________________
Observer:_____________________ Transect number:_______ (one sheet per transect)
Species name Tally of hits
Uniden.fied spp. Na:ve Exo:c Ground cover
Tu?ed grass Bryophyte/
Annual grass lichen
Other monocot
Small shrub
Medium shrub
Tree seedling
Small herb
Large herb
Climber
Fern*Note: tallies of ground covers do not need to sum to 100 for each transect, they can sum to less but not more
Bare ground
LiHer
Log
Rock

Tree and large shrub cover cover, tree DBH, and log length
Site and plot:_______________________ Date:_________________
Observer:__________________________
Tree canpy and large shrub point transects
Exo:c Exo:c
Exo:c Exo:c
* Note: The sum of all tallies can be less than or exceed 100
Tree DBH: record diameter (at 1.3 m from the ground) of every tree >2 m tall
Log length: record the length (m.cm) for each log in the plot
Notes:
Na:veNa:ve
Na:ve Exo:c
Tally of eucalypt trees (2-‐5 m tall) Tally of eucalypt trees (>5 m tall)
Tally of large shrubs (2-‐5 m tall) Tally of non-‐eucalypt trees (>5 m tall)
Na:ve Na:ve

Full species list in quadrat - includes native and exotic species
Site and plot:__________________ Date:_________________
Observer:_____________________
Scientific names should be given where possible
Species Recruitment tally Mortality tallyWoody species
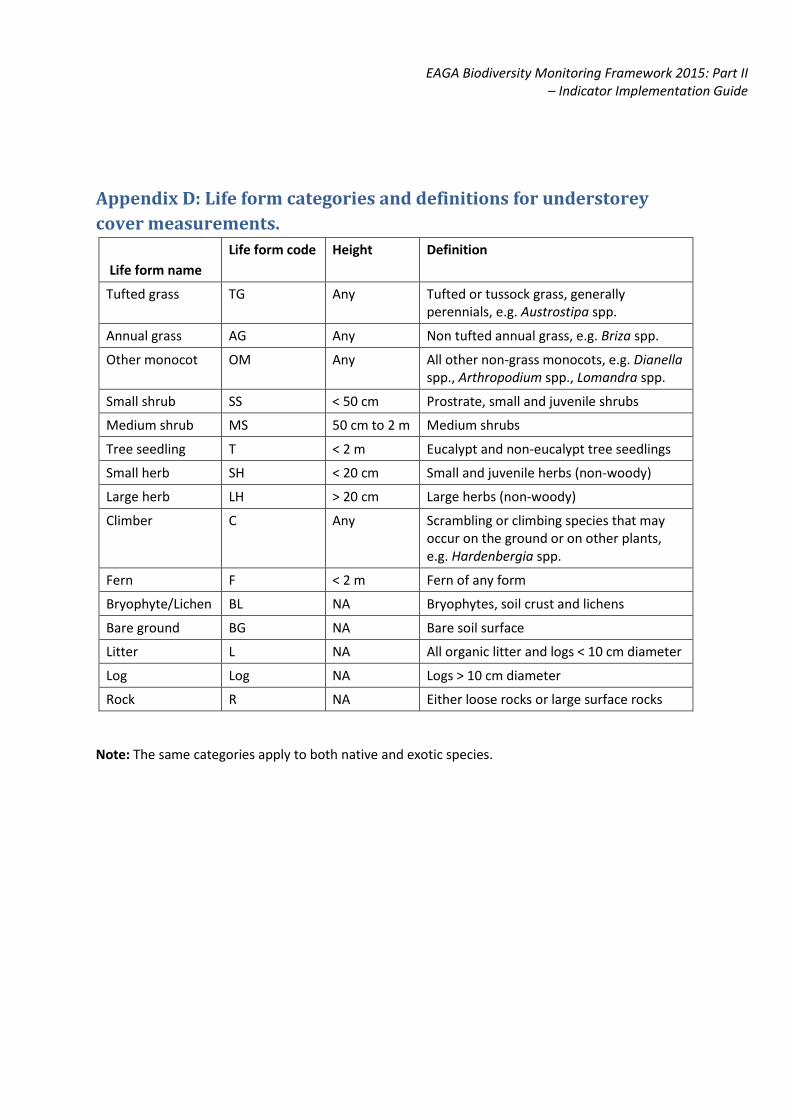
EAGA Biodiversity Monitoring Framework 2015: Part II – Indicator Implementation Guide
Appendix D: Life form categories and definitions for understorey
cover measurements.
Life form name
Life form code Height Definition
Tufted grass TG Any Tufted or tussock grass, generally perennials, e.g. Austrostipa spp.
Annual grass AG Any Non tufted annual grass, e.g. Briza spp.
Other monocot OM Any All other non-grass monocots, e.g. Dianella spp., Arthropodium spp., Lomandra spp.
Small shrub SS < 50 cm Prostrate, small and juvenile shrubs
Medium shrub MS 50 cm to 2 m Medium shrubs
Tree seedling T < 2 m Eucalypt and non-eucalypt tree seedlings
Small herb SH < 20 cm Small and juvenile herbs (non-woody)
Large herb LH > 20 cm Large herbs (non-woody)
Climber C Any Scrambling or climbing species that may occur on the ground or on other plants, e.g. Hardenbergia spp.
Fern F < 2 m Fern of any form
Bryophyte/Lichen BL NA Bryophytes, soil crust and lichens
Bare ground BG NA Bare soil surface
Litter L NA All organic litter and logs < 10 cm diameter
Log Log NA Logs > 10 cm diameter
Rock R NA Either loose rocks or large surface rocks
Note: The same categories apply to both native and exotic species.