Embed Size (px)
Citation preview

Industry overview
and economic
impact
assessment for
the South African
medical
technology
industry
Prepared for the South African
Medical Device Industry
Association (SAMED)
Glossary
ANVISA Agencia Nacional de Vigilancia Sanitaria [National Health Surveillance Agency]
ARGMD Australian Regulatory Guidelines for Medical Devices
ARTG Australian Register of Therapeutic Goods
BBBEE Broad Based Black Economic Empowerment
CAGR Compound Annual Growth Rate
CE Conformité Européenne [European Conformity]
CSIR Council for Scientific and Industrial Research
DBSA Development Bank of Southern Africa
DST Department of Science and Technology
DTI Department of Trade and Industry
EUCOMED European Confederation of Medical Suppliers Association
EIA Economic Impact Assessment
FDA Food and Drug Administration (USA)
GHTF Global Harmonization Task Force
GMDN Global Medical Device Nomenclature
GMP Good Manufacturing Practice
HTA Health Technology Assessment
IDC Industrial Development Corporation
IMDRF International Medical Device Regulators Forum
ISO International Organisation for Standardisation
MCC Medicines Control Council
MRC Medical Research Council
NDOH National Department of Health
NDP National Development Plan
NHI National Health Insurance
PBS Pharmaceutical Benefits Scheme [Australia]
PIC Public Investment Corporation
PFMA Public Finance Management Act
R&D Research & Development
ROI Return On Investment
SABS South African Bureau of Standards
SADC Southern African Development Community
SAHPRA South African Health Products Regulatory Authority
SALDA South African Laboratory Diagnostics Association
SAMED South African Medical Device Industry Association
SHIP Strategic Health Innovation Partnership
SME Small and Medium Enterprises
TGA Therapeutics Goods Administration [Australia]
TIA Technology Innovation Agency
TUV Technischer Uberwachungsverein [Technical Inspection Association]
WHO World Health Organisation

Executive Summary
About medical technology
Medical technologies are described as medical devices, in vitro diagnostics, imaging equipment and
e-health solutions used to diagnose, monitor, assess predispositions and treat patients suffering from
a wide range of conditions1. It covers a broad range of products like wheelchairs, hip prosthesis,
cardiac stents, syringes and MRI-scanners to name a few. Medical technology helps people live
healthier and longer lives and is an indispensable necessity to any health system. Moreover
continuous innovations in medical technology enhance the effectiveness and quality of care.
Why this document?
SAMED has commissioned KPMG to estimate the size of the medical technology market in South
Africa, the medical technology market’s impact on the economy and to explore what lessons can be
learnt from other countries in terms of regulating the medical technology industry. The information
presented in this document is based on survey results of 47 medical technology companies.
Global medical technology market
The global medical technology market is estimated at a value of US $ 270 billion. Drivers for growth
in the medical technology market are; demographic trends in both developed (ageing) and developing
countries (move from communicable to non-communicable diseases); convergence across all
segments of healthcare and innovation in technology.
South African medical technology market
The South African medical technology market has an estimated value of US $ 1.0 billion and
constitutes 0.4% of the global medical technology market. The average revenue for multinational
medical technology companies (R 283 million per annum, per company) is more than the revenue for
local medical technology companies (R 75.2 million per annum, per company). The majority of
companies import medical technology products from other parts of the world. It is therefore no
surprise that the volume of imported products exceed the volume of exported products in monetary
terms. In terms of exports, most products are exported to other African countries (80% of total
export of medical technology products).
South Africa’s health system is described as a dichotomous system with well-developed private
sector and a burdened public sector. The medical technology market derives most of its revenues
from clients in the private sector (70%) when compared with clients in the public sector (30%). The
medical technology industry employs over 3 600 people and medical technology companies are on
average BBBEE level 4 contributors. The average BBBEE rating is lower for local manufacturers when
compared to multinationals. Medical technology companies spent a total of R 23.7 million on
sponsorship and R 31.7 million on training healthcare professionals that use their products.
Sector contribution
Medical technology industry respondents to the industry survey raised concerns regarding the import
of substandard medical technology products. According to respondents this hampers fair
competition, specifically on price for quality products, and is exacerbated by the lack of a quality
regulator for medical devices in South Africa. The majority of medical technology companies would
support the establishment of a quality regulator. Other matters raised by respondents include the lack
of transparency in government tender processes, delayed payment from major public sector clients,
the relative power of private sector healthcare funders in approving reimbursement for medical
technology products or not, the limited appreciation for and availability of funds for Research &
Development (R&D) of medical technology products in South Africa.
Economic impact
The medical technology industry’s overall contribution to the national economy is estimated at R 3.88
billion. The associated economic multiplier is calculated at 1.25, this means that for every additional R
1 spent in the national economy by the medical technology industry, an additional 25 cents is
1 Medical Technology – Contribution to Europe’s Health, Innovation and Economy, MedTech Europe, 2013.

generated in economic activity. Capital and operational expenditure by the medical technology
industry resulted in supporting a total of 20 901 jobs. Lastly, the tax revenue generated by the
medical technology industry during the period under review is estimated at R 1.86 billion. All the
numbers presented above are the consequence of direct, indirect and induced impact expenditures
of the medical technology industry have on the broader economy. Besides economic impact, medical
technology adds value to patients, healthcare professionals and, more generally, the health system.
Regulation
The South African medical technology industry is mainly unregulated, except for a few regulated
medical technology product categories (e.g. products that emit a radio frequency and electromagnetic
products). Although the government intends to establish a national quality regulator, SAHPRA (South
African Health Products Regulatory Authority), it is uncertain at this point in time when this regulatory
body will be established and start operating. Although most respondents of the survey strongly
support the implementation of quality regulation, most oppose price regulation. Brazil and Australia
are two countries included in this report to serve as a benchmark for quality regulation. Lessons
learnt from these countries (i.e. regulations implemented that had a positive impact on the medical
technology industry) are the establishment of a quality regulator, forming free trade zones with
neighbouring countries (Brazil), and a highly educated population (Australia).
Conclusion
This document contains three takeaways for the broader health economy:
■ Continue the drive for quality regulation.
■ Use existing innovation-platforms and incentivise industry to grow R&D investments
■ Unite, collaborate and share insights with key stakeholders and the population.
SAMED invested significantly in this project and hence the following applies; for those who wish to obtain a
copy of the report:
■ One hard copy of the report will be provided free of charge to those who participated in the survey.
■ The cost of additional hard copies for participants will be R 500 per copy.
■ SAMED members who did not participate, but wish to have a copy will be charged R 500 per copy.
■ For all other parties, the cost of a hard copy will be R 2 000.

Contents
1 Introduction 1
1.1 Why this report? 1
1.2 Reading guide for this report 1
1.3 The information used in this report 1
1.4 Limitations of scope 2
1.5 Disclaimer 2
2 Industry Analysis 3
2.1 Introduction 4
2.2 South Africa’s healthcare system 4
2.3 What is medical technology? 6
2.4 The global medical technology market 9
2.5 The South African medical technology market 11
3 Economic Impact Assessment 27
3.1 Overview of approach 28
3.2 Introduction to the economic modelling impact results 31
3.3 The value medical technology brings to people’s lives, beyond economic impact on
the country 34
3.4 Economic Impact on the National development plan 35
4 Regulatory Environment 37
4.1 Introduction 38
4.2 South African regulatory environment 38
4.3 A brief overview of the countries involved 42
4.4 Brazil 43
4.5 Australia 45
4.6 Lessons learnt 46
5 Conclusion 48
5.1 Three key takeaways 49
5.2 Closing remarks 50

Appendix 1 Background information on National Health Insurance (NHI) 52
Appendix 2 Survey 54
Appendix 3 Theory and application of macroeconomic
impact assessments 65
Figures
Figure 1 - Comparison between public and private healthcare expenditure, ......................................... 5
Figure 2 - Number of hospitals in public and private sector .................................................................... 5
Figure 3 - Product ranges in medical technology .................................................................................... 8
Figure 4 - The Global Medical Technology market (2006 - 2015) ............................................................ 9
Figure 5 - The Global Medical Technology market (2006 - 2015 / percentage) .................................... 10
Figure 6 - Revenue per company split between multinationals and local companies .......................... 12
Figure 7 – Nature of business survey responses .................................................................................. 12
Figure 8 - Revenue per Province ........................................................................................................... 13
Figure 9 - average revenue per product category ................................................................................. 14
Figure 10 - classification of medical technology products .................................................................... 15
Figure 11 - Employment split per employment skills level ................................................................... 17
Figure 12 - Employment split per race medical technology .................................................................. 18
Figure 13 - BBBEE levels medical technology sector ........................................................................... 19
Figure 14 - Expenditure on training medical technology ....................................................................... 20
Figure 15: Split of total operational spend ............................................................................................ 25
Figure 16 - How the Economic Impact Model works ........................................................................... 29
Figure 17: Description of economic linkages ........................................................................................ 30
Figure 18 - Survey respondents views on quality and price regulation ................................................ 40
Figure 19 - Quality management systems ............................................................................................ 41
Figure 20 - product quality standards .................................................................................................... 42
Figure 21 - Proposed NHI reforms ........................................................................................................ 53
Figure 22: Determining the Leontief inverse matrix ............................................................................. 66
Figure 23: Flow of income as represented by a SAM .......................................................................... 66
Figure 24: Determining the relationship between sectors in the SAM ................................................ 67
Figure 25: The multiplier effect ............................................................................................................. 67
Tables
Table 1 - Scheme membership change from 2010 to 2012 ................................................................... 6
Table 2: Impact of capital expenditure on GDP..................................................................................... 32
Table 3: Impact of capital expenditure on employment ........................................................................ 32
Table 4: Impact of capital expenditure on Government revenue .......................................................... 33
Table 5: Impact of operational expenditure on GDP ............................................................................. 33
Table 6: Impact of operational expenditure on employment ................................................................ 34
Table 7: Impact of operational expenditure on Government revenue .................................................. 34
Table 8 - Overview of health indicators South Africa, Brazil and Australia ........................................... 43

1
1 Introduction
Introduction
1

1
1.1 Why this report?
The South African Medical Device Industry Association (further “SAMED”) seeks to continuously
engage with its stakeholders, to ensure a sustainable medical technology industry in South Africa.
This report estimates the size of the medical technology market in South Africa and, more
importantly, demonstrates the potential impact the industry has had on the broader economy and the
country as a whole. Lastly, current medical technology regulations in other countries are used to
provide insights and potential considerations for South Africa in possibly creating a business
environment where both the patient, the government and the industry could benefit.
As such, this report forms part of SAMED’s ongoing endeavours to inform and involve government,
SAMED’s members and other stakeholders on the medical technology industry.
SAMED has commissioned KPMG Services (Pty) Ltd (further “KPMG”) to undertake this
assessment. This report is prepared by KPMG, in collaboration with SAMED Board Members and
Secretariat.
1.2 Reading guide for this report
Section 2 – Industry Analysis
Before going into the detail of the South African medical technology market, an overview is given of
what is generally understood as ‘medical technology’ and a brief overview of the global medical
technology market. A summary of the South African healthcare market is included for the reader to
understand the environment medical technology companies operate in. Lastly, this section of the
report sketches the industry profile, using information provided by SAMED members. Data points
that are included in this analysis are, amongst others; company structure; product range; levels of
import and export; and lastly, SAMED members’ views on the sector contribution to South Africa’s
economy.
Section 3 – Economic Impact Assessment
The question answered in this section of the report is what the direct and indirect impact of the
industry is in South Africa. The macroeconomic variables included in this assessment are: Gross
Domestic Product (GDP); job creation; tax revenue and the impact that the industry indirectly has on
other industries. In addition, the section summarises how the industry contributes to the
achievement of government policy initiatives such as the Industry Policy Action Plan and the National
Development Plan.
Section 4 – Regulatory environment
The medical technology industry is heavily regulated in other parts of the world like the United States
(US) and the European Union. This section sets out what local regulation applies to the industry in
South Africa and seeks to gain insights from legislation and regulation from Brazil and Australia. It
furthermore includes the industry’s views on how regulation on price and quality could, or could not,
act as a driver for growth for the industry.
1.3 The information used in this report
A representation of SAMED and SALDA members have responded to a survey sent out by KPMG on
behalf of SAMED. The information in this report is presented at an aggregated level to ensure no data
could be traced back to individual companies. The information acquired through this survey is used
throughout the different sections in the report and is complemented with additional information from
market intelligence databases KPMG has access to. Where applicable this information was verified
through KPMG’s international network of member firms.
2
1.4 Limitations of scope
We have relied upon the sources of information referred to in this report. Except where specifically
stated, we have not sought to establish the reliability of those sources. We have however reviewed
the information and have sought explanations for key trends and salient features identified by us. We
have also satisfied ourselves, as far as possible, that the information presented is consistent with
other information obtained by us in the course of the work undertaken to prepare this report.
Our engagement does not comprise a due diligence review or constitute an audit or review, other
assurance engagement or an agreed-upon procedures engagement, performed in accordance with
International Standards on Auditing (ISAs), International Standards on Review Engagements (ISAEs)
or International Standards on Related Services (ISRS). Consequently, an audit opinion or assurance
conclusion will not be expressed nor will there be a report on factual findings. As such, this report
may not necessarily disclose all significant matters about the project or reveal errors or irregularities,
if any, in the information and representations made to us in order to undertake the valuation and upon
which we have relied.
Estimations made embody assumptions on the behaviour of factors in the macro and micro
economy, and the project itself. These assumptions were based on evidence available as at the time
of this report. Users of the forecasts may consider other assumptions to be more appropriate, which
may materially change the outcome of the forecasts. Please note that any advice, opinion, statement
of expectation, forecast or recommendation supplied by us as part of the service shall not amount to
any form of guarantee that we have determined or predicted future events or circumstances.
1.5 Disclaimer
This report has been compiled by KPMG for the sole and exclusive use of SAMED. It should not be
quoted in whole or in part, by any party other than SAMED, without our prior written consent.
KPMG’s findings in connection with this report are intended solely and exclusively for the benefit,
information, and use by SAMED. No party, other than SAMED, may rely on the findings, either in
whole or in part. KPMG (including its directors or employees or anybody or entity controlled, owned
or associated with KPMG) accepts no liability or responsibility whatsoever, resulting directly or
indirectly from the disclosure of our findings to any third party and/or the reliance of any third party on
the findings, either in whole or in part. KPMG’s findings are related to prevailing conditions and
information available at the time of issuing our report.

3
2 Industry Analysis
Industry Analysis
2

4
2.1 Introduction
When talking “medical technology”, one needs to understand what it exactly entails and within what
environment the medical technology market operates. This specifically refers to the relationship
between a country’s health system and medical technology. This section therefore starts with an
introduction into South Africa’s health system. It then continues with a brief overview of the global
medical technology market before unpacking the South African medical technology industry’s size
and value using the survey results.
2.2 South Africa’s healthcare system
South Africa’s two healthcare markets
South Africa’s healthcare spend is 8.9% of GDP2, which is often quoted as being comparable to the
spending of many developing countries and even some well-developed health systems, like
Australia3. However, this hides disparity between the public and private sectors, as 4% of GDP is
spent by the Government on the public health system, which meets the needs of approximately 80%
of the population4. Yet, even the increasingly public debate about the disparity between private and
public sector resourcing hides critical issues of the capability and capacity of management at a
Provincial Government level, where the public health systems are operationally managed. Over the
past 12 – 18 months these management issues have increasingly come to the fore and the National
Department of Health has placed pressure on Provincial Departments of Health to improve, even
putting some Provincial Departments of Health under administration, including the Limpopo and
Gauteng Department of Health.
The South African healthcare system suffers from the ‘growing pains’ characteristic of many
emerging economies – strong economic growth, a young population and a growing and demanding
middle class. In the public sector, challenges in making the best use of available capacity result in
poor access to healthcare. This, combined with poor infrastructure and problems with the availability
of staff, medicines and medical technology, create a strong public perception that the public sector
lacks capacity and is under-resourced. There is growing pressure on politicians and health sector
leaders at all levels to deliver better services.
The above strongly contrasts with a private sector that is well-funded and well-equipped, serving
almost nine million people, but using half of the healthcare expenditure in the country. However,
there is currently a great deal of pressure on the cost of private healthcare, both from the
Government and from consumers – and medical schemes through their members – who are
becoming increasingly aware of the high and rising costs of healthcare and who are becoming
increasingly selective about the level and type of health insurance they purchase. Healthcare pricing
is not currently regulated but the Government has recently announced an inquiry into the competitive
aspects in the healthcare sector through the Competition Commission.
The health sector in South Africa is often characterised as being split between entirely separate
public and private systems. However, this ignores the realities of a clinical workforce that commonly
works in both sectors and increasingly large sections of society that are combining limited health
insurance packages with public sector provision to cover the rest of their needs. The two systems
are closely interdependent. This is likely to increase in the coming years with joint regulation and,
potentially, large-scale private sector provision of publicly funded healthcare potentially under a NHI
umbrella.
2 WHO, NHA Indicators 2012
3 Based on World Bank data, www.worldbank.org, accessed in November 2013.
4 Business Monitor International, 2013.
5
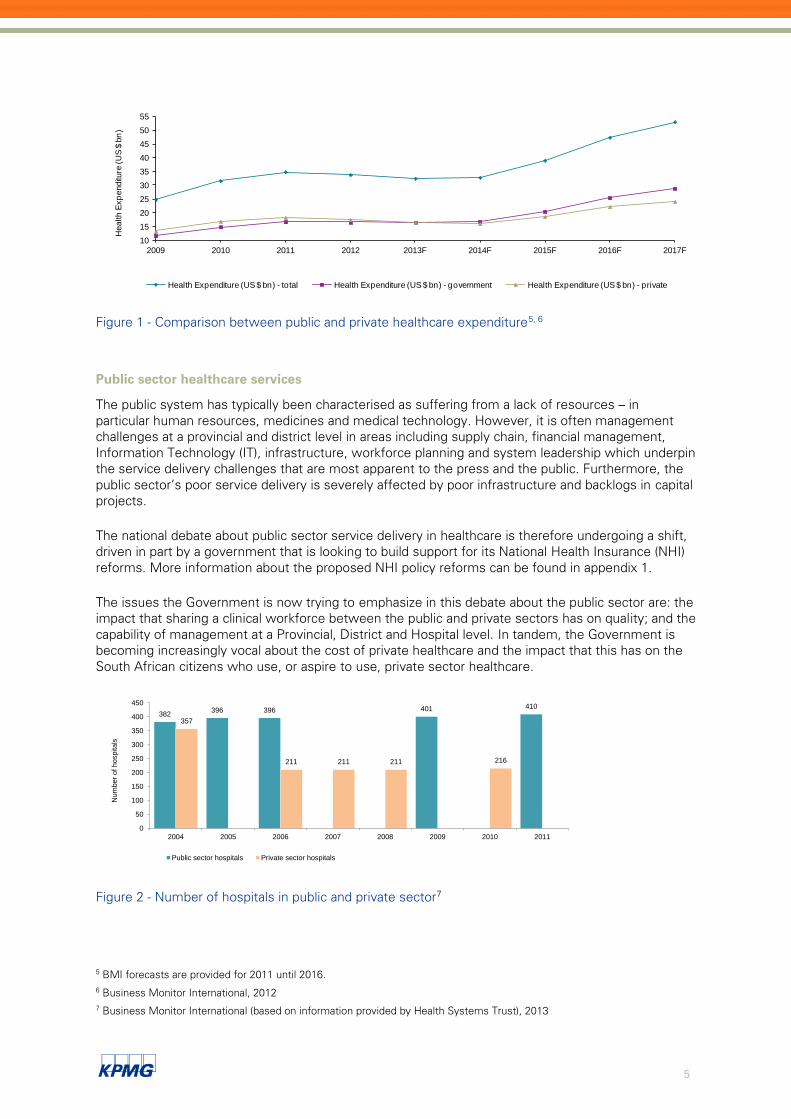
Figure 1 - Comparison between public and private healthcare expenditure5, 6
Public sector healthcare services
The public system has typically been characterised as suffering from a lack of resources – in
particular human resources, medicines and medical technology. However, it is often management
challenges at a provincial and district level in areas including supply chain, financial management,
Information Technology (IT), infrastructure, workforce planning and system leadership which underpin
the service delivery challenges that are most apparent to the press and the public. Furthermore, the
public sector’s poor service delivery is severely affected by poor infrastructure and backlogs in capital
projects.
The national debate about public sector service delivery in healthcare is therefore undergoing a shift,
driven in part by a government that is looking to build support for its National Health Insurance (NHI)
reforms. More information about the proposed NHI policy reforms can be found in appendix 1.
The issues the Government is now trying to emphasize in this debate about the public sector are: the
impact that sharing a clinical workforce between the public and private sectors has on quality; and the
capability of management at a Provincial, District and Hospital level. In tandem, the Government is
becoming increasingly vocal about the cost of private healthcare and the impact that this has on the
South African citizens who use, or aspire to use, private sector healthcare.
Figure 2 - Number of hospitals in public and private sector7
5 BMI forecasts are provided for 2011 until 2016.
6 Business Monitor International, 2012
7 Business Monitor International (based on information provided by Health Systems Trust), 2013
10
15
20
25
30
35
40
45
50
55
2009 2010 2011 2012 2013F 2014F 2015F 2016F 2017F
Health
Exp
enditu
re (U
S $
bn
)
Health Expenditure (US $ bn) - total Health Expenditure (US $ bn) - government Health Expenditure (US $ bn) - private
382396 396 401 410
357
211 211 211 216
0
50
100
150
200
250
300
350
400
450
2004 2005 2006 2007 2008 2009 2010 2011
Num
ber
of hospitals
Public sector hospitals Private sector hospitals

6
Private sector healthcare services
At the moment, only 17% of the South African population is able to afford private health insurance
and this has remained fairly stagnant over the past decade8.
The rise in private medical costs over the past decade is of growing concern, not just for the
government, but also for private payers – i.e. the medical schemes – who are keen to grow their
member populations but are facing significant challenges in doing so in a way that is sustainable. The
large medical aid administrators are beginning to implement more innovative commissioning models
to try to drive down the costs of acute care and, consequently, allow them to offer lower-cost health
insurance products to a broader spectrum of the population. This is largely achieved through
designated service provider (DSP) arrangements. However, the scale and impact of these products
remain constrained by the costs of hospital care and some of these lower-cost options are currently
running at a loss to the administrators.
In addition to the constraints that high medical costs put on medical schemes’ abilities to tap into
new segments of the population, medical schemes and administrators are also concerned about the
level of cover that new members are choosing and the risk profile of those members. Medical
schemes have seen many new members buying only very limited cover. This is particularly true for
the ‘emerging middle class’ members who may not have the financial support of previous
generations to allow them to buy comprehensive cover at a young age and therefore buy (and retain)
only limited cover.
Table 1 - Scheme membership change from 2010 to 20129
2.3 What is medical technology?
Global organisations use different definitions to describe and define the medical technology industry.
Some definitions commonly used are summed below.
The International Medical Device Regulators Forum (IMDRF, previously the Global Harmonization
Task Force, GHTF) describes Medical Devices as:
“...any instrument, apparatus, implement, machine, appliance, implant, reagent for in vitro use,
software, material or other similar or related article, intended by the manufacturer to be used, alone
or in combination, for human beings, for one or more of the specific medical purpose(s) of:
■ diagnosis, prevention, monitoring, treatment or alleviation of disease;
8 Council for Medical Scheme annual report 2012.
9 Council for Medical Scheme data, 2011, 2012, 2013
Type of scheme Type of membership 2010 2011 2012
Principal members 2 172 723 2 182 562 2 197 454
Dependants 2 627 192 2 577 552 2 562 540
Beneficiaries 4 799 915 4 760 114 4 759 994
Principal members 1 439 339 1 548 003 1 617 977
Dependants 2 076 464 2 218 292 2 301 502
Beneficiaries 3 515 803 3 766 295 3 919 479
Principal members 3 612 062 3 730 565 3 815 431
Dependants 4 703 656 4 795 844 4 864 042
Beneficiaries 8 315 718 8 526 409 8 679 473
Open schemes
Restricted schemes
Total schemes

7
■ diagnosis, monitoring, treatment, alleviation of or compensation for an injury;
■ investigation, replacement, modification, or support of the anatomy or of a physiological process;
■ supporting or sustaining life;
■ control of conception;
■ disinfection of medical devices;
■ providing information by means of in vitro examination of specimens derived from the human
body; and,
■ does not achieve its primary intended action by pharmacological, immunological or metabolic
means, in or on the human body, but which may be assisted in its intended function by such
means.”10
The World Health Organisation tends to follow this definition in its publications11 12.
Espicom, a renowned global market intelligence firm describes medical equipment as “...any piece of
equipment or apparatus used to treat or diagnose an illness, which comes into direct contact with the
patient”13
.
The US Food and Drug Administration (FDA) describes medical devices as “an instrument, apparatus,
implement, machine, contrivance, implant, in vitro reagent, or other similar or related article, including
a component part, or accessory which is:
■ recognized in the official National Formulary, of the Unites States Pharmacopoeia, or any
supplement to them,
■ intended for use in the diagnosis of disease or other conditions, or in the cure, mitigation,
treatment, or prevention of disease, in man or other animals, or
■ intended to affect the structure or any function of the body of man or other animals, and which
does not achieve its primary intended purposes through chemical action within or on the body of
man or other animals and which is not dependent upon being metabolized for the achievement of
any of its primary intended purposes”14
.
The European Commission defines a medical device as “...any instrument, apparatus, appliance,
software, material or other article, whether used alone or in combination, together with any
accessories, including the software intended by its manufacturer to be used specifically for diagnostic
and/or therapeutic purposes and necessary for its proper application, intended by the manufacturer to
be used for human beings for the purpose of:
■ diagnosis, prevention, monitoring, treatment or alleviation of disease,
■ diagnosis, monitoring, treatment alleviation or compensation for an injury or handicap,
■ investigation, replacement or modification of the anatomy or a physiological process,
■ control of conception,
10 GHTF, Definition of the Terms ‘Medical Device’ and ‘In Vitro Diagnostic (IVD) Medical Device’, 2012.
11 Medical Device Regulation – Global Overview and Guiding Principles, WHO, 2003.
12 Local Production and Technology Transfer to Increase Access to Medical Devices, WHO, 2012.
13 Medistat – Worldwide Medical Market Forecasts to 2015, Espicom, 2010.
14 FDA website, accessed 25 November 2013,
http://www.fda.gov/medicaldevices/deviceregulationandguidance/overview/classifyyourdevice/ucm051512.htm

8
and which does not achieve its principal intended action in or on the human body by pharmacological,
immunological or metabolic means, but which may be assisted in its function by such means”15
.
To summarise the above definitions one can say that there is a strong overlap between them.
Recurring themes include that medical technology is used for human beings (or patients), it is a
medical solution or has a medical purpose. Medical technology is furthermore used for diagnostic,
preventative, monitoring, alleviating and therapeutic purposes. Lastly, it is explicitly not technology
that is pharmacological.
In this document, the description put forward by EUCOMED (European Confederation of Medical
Suppliers Association) is used:
“Medical technologies are medical devices, in vitro diagnostics, imaging equipment and e-
health solutions used to diagnose, monitor, assess predispositions and treat patients suffering
from a wide range of conditions”16
.
Medical technology covers a broad, diverse range of products currently estimated to surpass the
number of 500 000 products. As such the global medical technology community has established
Global Medical Device Nomenclature consisting of sixteen categories. Again, in this report however,
the classification as put forward by EUCOMED is followed and displayed in the figure below.
Figure 3 - Product ranges in medical technology17
Class A represents low-hazard products such as bandages, tongue depressors, hospital beds, splints,
stethoscopes, syringes without needles, handheld mirrors, impression trays, reusable scalpels,
15 Directive 2007/47/EC of the European Parliament and the Council, 2007.
16 Medical Technology – Contribution to Europe’s Health, Innovation and Economy, MedTech Europe, 2013.
17 The European Medical Technology Industry in Figures. MedTech Europe, 2013.
Class C
Class D
Class B
Class A
9
forceps, wheelchairs, patient chairs, corrective glasses and frames, incision drapes, conductive gels,
non-invasive electrodes, etc.
Class B represents low-moderate products such as hypodermic needles, suction equipment, tracheal
tubes, orthodontic wires, needles for suturing, suckers, staplers, spinal needles, clamps, bridges and
crowns, muscle stimulators, cryosurgery equipment, powered drills, hearing aids, ultrasound, etc.
Class C represents moderate high-hazard products. Examples are lung ventilator, bone fixation plate,
blood bags, urethral stents, insulin pens, ligaments, internal closure devices, shunts, warming
blankets, blood warmers, surgical lasers, suction equipment, etc.
Lastly, class D represents high-hazard products such as heart valves, implantable defibrillators,
cardiovascular catheters, neurological catheters, cortical electrodes, cardiac output probes, biological
adhesives, spinal stents, intra-aortic balloon pumps, absorbable sutures, bioactive implants (surface
coatings), breast implants, infusion pumps, etc.
The classes above were included in the survey and are reported on in section 2.5 of this report.
Additional categorisation was surveyed and based on KPMG’s global segmentation of the medical
technology market supplemented with additional insights from SAMED. The results of this are set
out in the section mentioned above.
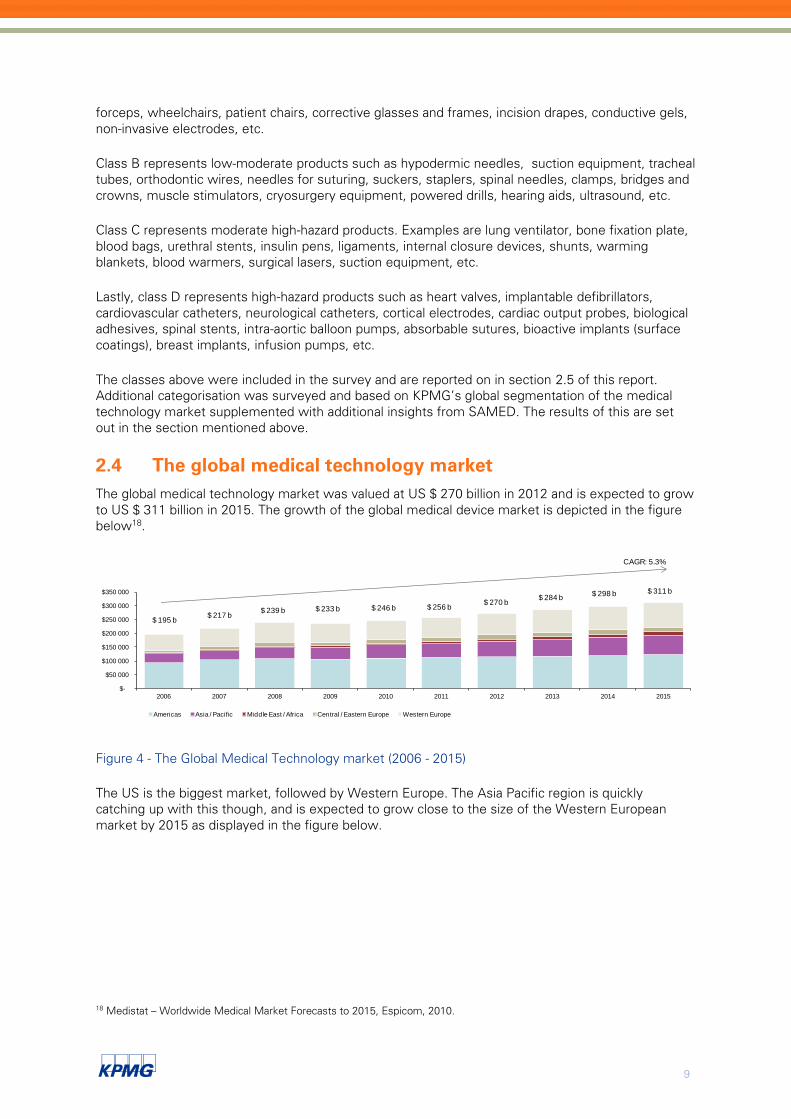
2.4 The global medical technology market
The global medical technology market was valued at US $ 270 billion in 2012 and is expected to grow
to US $ 311 billion in 2015. The growth of the global medical device market is depicted in the figure
below18
.
Figure 4 - The Global Medical Technology market (2006 - 2015)
The US is the biggest market, followed by Western Europe. The Asia Pacific region is quickly
catching up with this though, and is expected to grow close to the size of the Western European
market by 2015 as displayed in the figure below.
18 Medistat – Worldwide Medical Market Forecasts to 2015, Espicom, 2010.
$-
$50 000
$100 000
$150 000
$200 000
$250 000
$300 000
$350 000
2006 2007 2008 2009 2010 2011 2012 2013 2014 2015
Americas Asia / Pacific Middle East / Africa Central / Eastern Europe Western Europe
$ 195 b$ 217 b
$ 239 b $ 233 b $ 246 b $ 256 b$ 270 b
$ 284 b$ 298 b $ 311 b
CAGR: 5.3%
10
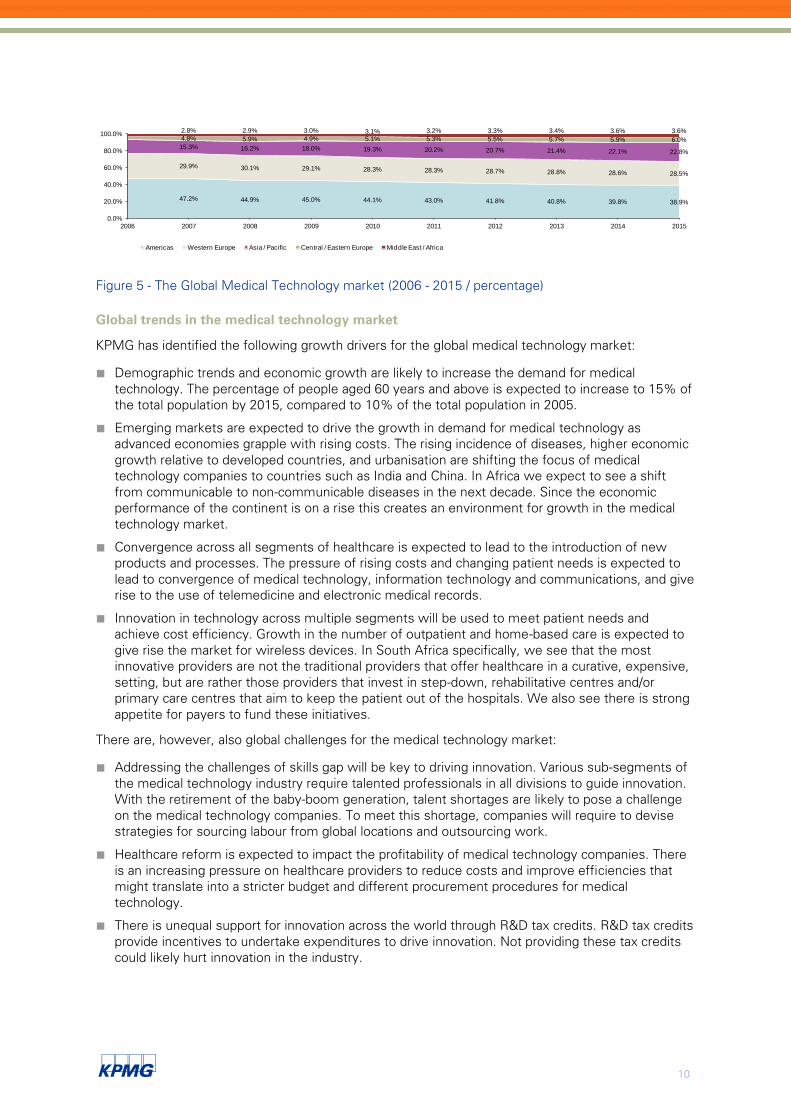
Figure 5 - The Global Medical Technology market (2006 - 2015 / percentage)
Global trends in the medical technology market
KPMG has identified the following growth drivers for the global medical technology market:
■ Demographic trends and economic growth are likely to increase the demand for medical
technology. The percentage of people aged 60 years and above is expected to increase to 15% of
the total population by 2015, compared to 10% of the total population in 2005.
■ Emerging markets are expected to drive the growth in demand for medical technology as
advanced economies grapple with rising costs. The rising incidence of diseases, higher economic
growth relative to developed countries, and urbanisation are shifting the focus of medical
technology companies to countries such as India and China. In Africa we expect to see a shift
from communicable to non-communicable diseases in the next decade. Since the economic
performance of the continent is on a rise this creates an environment for growth in the medical
technology market.
■ Convergence across all segments of healthcare is expected to lead to the introduction of new
products and processes. The pressure of rising costs and changing patient needs is expected to
lead to convergence of medical technology, information technology and communications, and give
rise to the use of telemedicine and electronic medical records.
■ Innovation in technology across multiple segments will be used to meet patient needs and
achieve cost efficiency. Growth in the number of outpatient and home-based care is expected to
give rise the market for wireless devices. In South Africa specifically, we see that the most
innovative providers are not the traditional providers that offer healthcare in a curative, expensive,
setting, but are rather those providers that invest in step-down, rehabilitative centres and/or
primary care centres that aim to keep the patient out of the hospitals. We also see there is strong
appetite for payers to fund these initiatives.
There are, however, also global challenges for the medical technology market:
■ Addressing the challenges of skills gap will be key to driving innovation. Various sub-segments of
the medical technology industry require talented professionals in all divisions to guide innovation.
With the retirement of the baby-boom generation, talent shortages are likely to pose a challenge
on the medical technology companies. To meet this shortage, companies will require to devise
strategies for sourcing labour from global locations and outsourcing work.
■ Healthcare reform is expected to impact the profitability of medical technology companies. There
is an increasing pressure on healthcare providers to reduce costs and improve efficiencies that
might translate into a stricter budget and different procurement procedures for medical
technology.
■ There is unequal support for innovation across the world through R&D tax credits. R&D tax credits
provide incentives to undertake expenditures to drive innovation. Not providing these tax credits
could likely hurt innovation in the industry.
47.2% 44.9% 45.0% 44.1% 43.0% 41.8% 40.8% 39.8% 38.9%
29.9% 30.1% 29.1% 28.3% 28.3% 28.7% 28.8% 28.6% 28.5%
15.3% 16.2% 18.0% 19.3% 20.2% 20.7% 21.4% 22.1% 22.8%
4.8% 5.9% 4.9% 5.1% 5.3% 5.5% 5.7% 5.9% 6.0%
2.8% 2.9% 3.0% 3.1% 3.2% 3.3% 3.4% 3.6% 3.6%
0.0%
20.0%
40.0%
60.0%
80.0%
100.0%
2006 2007 2008 2009 2010 2011 2012 2013 2014 2015
Americas Western Europe Asia / Pacific Central / Eastern Europe Middle East / Africa

11
2.5 The South African medical technology market
This part of the report includes information on the South African medical technology market. Where
possible we have compared the outcomes of the survey with market intelligence reports that were
available to KPMG and with other publicly available information. We report back on sections 1, 2, 4
and 5 from the survey. The survey is included in appendix 2 of this report.
Survey response
The survey was sent to 159 companies consisting of SAMED and SALDA19
members. Companies
that are not a member of the aforementioned bodies but that showed an appetite to participate in
this market investigation also received the survey. A total of 47 surveys (30%) were returned. From
the 47 companies that responded, 35 (74%) are SAMED members, 5 (11%) are SALDA members
and 7 (15%) or not members of SAMED or SALDA.
In the graphs displayed below, where applicable, the results are split between multinational
companies and local companies. The following definition is used to describe multinational companies:
all companies that operate in South Africa and distribute their own products manufactured abroad
and/or in South Africa. Local companies are described as all companies that originated and are based
in South Africa that distribute locally manufactured products and/or act as distributors/agents for
multinational companies that do not operate in South Africa. Multinationals with local manufacturing
capacity are regarded as multinationals. From the 47 surveys received, 23 (49%) came from
multinational companies and the remaining 24 (51%) are from local companies. The figures
presented below are based on the information provided by the survey participants. All figures are
based on the aggregated data of 47 companies unless otherwise stated.
Medical technology industry profile
Various sources estimate the total size of the South African market for medical technology to be
around the R 10 billion mark (US $ 1 billion, 0.4% of the global medical technology market)20 21 22
.
Total revenue based on the outcome of the survey adds up to R 8.3 billion. Based on the earlier
survey carried out in 2009, this is an increase of R 1.3 billion (19%)23
.
If we extrapolate the revenue, based on SAMED members that participated in the survey against the
total number of SAMED members, we calculate the total revenue of SAMED to be in the region of
about R12.1 billion24
25
. We can therefore fairly accurately comment on a sizeable part of the medical
technology market.
How companies’ revenue is split between multinationals and local companies is demonstrated in the
figure below.
19 Southern African Laboratory Diagnostics Association
20 Medistat – Worldwide Medical Market Forecasts to 2015, Espicom, 2010.
21 Manufacture of Medical and Surgical Equipment and Orthopaedic Appliances, Siccode 3741, Who Owns Whom, 2012
22 Extrapolation of SAMED membership data
23 Sample size in 2009 was 49 companies.
24 The extrapolation process only included companies that responded to the survey and are a member of SAMED. Using the
number of SAMED members per revenue category range [information provided by SAMED, based on the full list of SAMED
members, i.e. not only those that responded to the survey] we were able to extrapolate the survey revenue data into the same
revenue categories. Once we identified which revenue category each of the survey respondents fell into, we then calculated
how many of each revenue category responded to the survey. We then calculated the average revenue for each non-
responder within each revenue band and multiplied that by the number of non-responders within each revenue category. This
enabled us to provide a rough estimate of revenue unaccounted for by non-responders, which we calculated to be about R5.2
billion, whereas the total revenue of SAMED members that responded to the survey amounted to R6.95 billion.
25 The highest response rates to the questionnaire fell within the he higher revenue categories. Hence we are confident that
the survey provides accurate information for 75%-80% of the total market size.
12
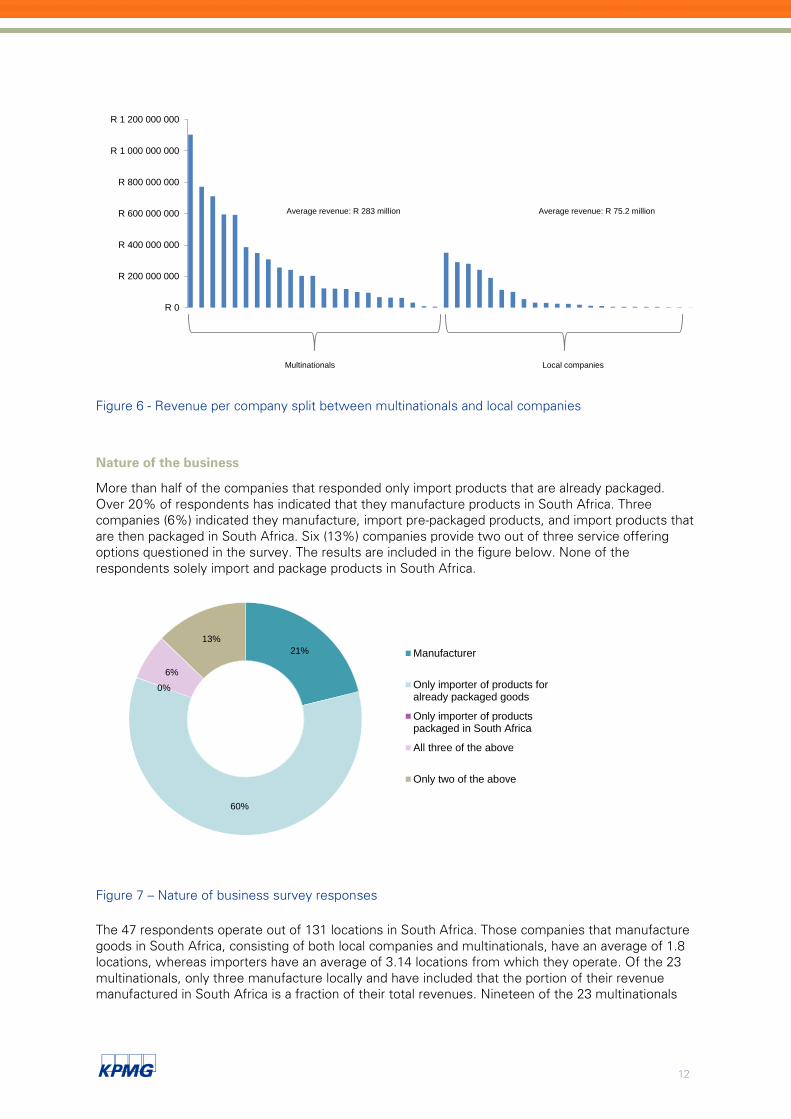
Figure 6 - Revenue per company split between multinationals and local companies
Nature of the business
More than half of the companies that responded only import products that are already packaged.
Over 20% of respondents has indicated that they manufacture products in South Africa. Three
companies (6%) indicated they manufacture, import pre-packaged products, and import products that
are then packaged in South Africa. Six (13%) companies provide two out of three service offering
options questioned in the survey. The results are included in the figure below. None of the
respondents solely import and package products in South Africa.
Figure 7 – Nature of business survey responses
The 47 respondents operate out of 131 locations in South Africa. Those companies that manufacture
goods in South Africa, consisting of both local companies and multinationals, have an average of 1.8
locations, whereas importers have an average of 3.14 locations from which they operate. Of the 23
multinationals, only three manufacture locally and have included that the portion of their revenue
manufactured in South Africa is a fraction of their total revenues. Nineteen of the 23 multinationals
R 0
R 200 000 000
R 400 000 000
R 600 000 000
R 800 000 000
R 1 000 000 000
R 1 200 000 000
Multinationals Local companies
Average revenue: R 283 million Average revenue: R 75.2 million
21%
60%
0%
6%
13%
Manufacturer
Only importer of products foralready packaged goods
Only importer of productspackaged in South Africa
All three of the above
Only two of the above

13
only import products into South Africa. The local companies consist of local manufacturers (9 out of
24) and importers (also 9 out of 24). The remaining 6 offer a mixture of services.
National footprint
The participants in the survey have been running operations in South Africa for an average of 26.5
years. One participant has been resident in South Africa for as long as 150 years, whereas the
youngest company was established just over a year ago. This average is higher for multinationals (38
years) compared to local companies (15 years).
The respondents were asked to split their revenue per province as presented in the figure below.
Figure 8 - Revenue per Province
Most revenue is generated in those provinces where most economic activity is centred, i.e. in
Gauteng, Western Cape and KwaZulu-Natal. The numbers are fairly consistent between
multinationals and local companies.
Product categories
There are several product categorisation mechanisms that are used globally. Probably the most well-
known is the Global Medical Device Nomenclature system that categorises medical technology
products into sixteen categories. However, following discussions with SAMED, it was decided to use
a more detailed categorisation, splitting the medical technology products into the overarching
categories of ‘wound care’, ‘implants’, ‘surgical equipment’, ‘non-surgical equipment’ and ‘other’ like
active medical devices, IVD, disinfecting devices and imaging devices, amongst others. The results
presented on the next page show the percentage revenue per product category for 46 respondents.
Based on the information provided, most revenue is generated through IVD products. The biggest
combined product range, in terms of revenue, is implants – whether that be orthopaedic, cardiac or
other implants. Surgical devices are the third in row with an average of 10% revenue. The ‘other’
category is made up of sterilisation packaging and monitoring devices, mobile clinics, dialysis
equipment and radioactive implants. On average, companies sell products in three different
categories. Thirteen companies (28%) have indicated that they only sell products in one product
category, i.e. advanced wound care. Those respondents that have products ranging over multiple
categories can typically be grouped at higher level, i.e. “implants” or “surgical devices”. International
publications show that the global medical technology sector is dominated by small and medium
enterprises (SMEs) and that companies within the industry are typically small companies employing
40 people on average26
.
26 Technical Barriers to Trade: Evaluating the Trade Effects of Supplier’s Declaration of Conformity, OECD Trade Policy Working
Paper No 78, 2008.
5% 7%
43%
16%
2% 3% 2% 3%
21%
0%
5%
10%
15%
20%
25%
30%
35%
40%
45%
Average revenue percentage
Eastern Cape Free State Gauteng Kwa-Zulu Natal Limpopo Mpumalanga Northern Cape North West Western Cape

14
Figure 9 - average revenue per product category
13%
11%
10%
9%
8%
7%
6%
6%
6%
4%
3%
3%
2%
2%
2%
2%
1%
1%
1%
1%
0%
0%
0%
0%
0%
0%
0%
0% 2% 4% 6% 8% 10% 12% 14% 16%

15
In addition to the grouping discussed above, respondents were also asked to split their revenue
according to the four product classifications as per the GHTF risk categorisations. These four
categories overlap with the ones in figure 4 in this report. The results shown in the figure below only
include the responses of 46 respondents.
Figure 10 - classification of medical technology products
Please note that the answers received to this question in the survey have not been answered
consistently and the results in the figure above should therefore be interpreted with caution.
Import and export
We have asked what percentage of the companies’ products are imported and exported, as a share
of total revenue. 46 respondents answered the question related to import and the results show that,
on average, 76% of products is imported. When looking at absolute numbers, 33 of the 46
companies import more than 80% of their products. These are predominantly multinationals. A WHO
publication estimates the value of medical technology imports in South Africa to be US $ 670
million.27
When it comes to exports, an average of 14.3% of revenues is generated by exporting products. This
was 8% in the 2009 survey. This average is higher for local companies (17.3%) compared to
multinationals (11.1%). There is quite a large variance in the revenues generated by exports between
the respondents: One company generates 90% of its revenues through exporting products, where
the minimum percentage of revenue consisting of exports for another is 0.5%. Out of the top ten
exporting companies that participated in the survey, six are local companies and four are
multinationals. For these top ten, export, on average, makes up 46% of their revenues. Of the total
exports, almost 80% is exported to other African countries – as such one can say that South Africa
plays an important role in providing medical technology to the rest of the continent. Products are
furthermore exported to the US, Europe, Latin America, the Middle East and the Indian Ocean
islands.
27 World Health Organization, Local Production and Technology Transfer to Increase Access to Medical Devices – Addressing
the barriers and challenges in low- and middle-income countries, 2012.
Class A - Low Hazard
31%
Class B - Low Moderate
22%
Class C - Moderate High Hazard
20%
Class D - High Hazard
27%

16
Public versus private sector clients
An average of 70% of revenues was earned through sales in the private sector, 30% through public
sector. These numbers are based on 34 respondents and don’t differ significantly compared with the
numbers collected in 2009 survey. The results seem to be consistent between multinationals and
local companies.
Employment
The 46 respondents that answered this section of the survey currently provide employment for 3 655
people. The top 10 largest companies in terms of staff numbers, employ 2 582 people (71% of the
total). This top 10 consists of 7 multinationals and 3 local companies. Included in the total number of
3 842, are 294 temporary employees. A further breakdown per job level and race is provided in the
figures on the following pages. Based on these figures one can see that the industry is dominated by
female employees (58.5% of the total), a phenomenon that is seen throughout the healthcare
industry. The medical technology is also predominantly a ‘white’ industry with 44% of employees
being white (53% in 2009), 30% are African (27.3% in 2009), 15% Coloured (8.7% in 2009) and 11%
Indian (11% in 2009).

17
Figure 11 - Employment split per employment skills level
8 9
38
117
177
121
42
4 7 19 37 54
31
11
3 11 26
78
31
4 7
80
75
187
276
26
2 16
2 8
29
123
105
209
96
3 8
33 5
8
56
146
83
8 11 3
1
95
44
40
1329
87
211
466
107
4
26
0
50
100
150
200
250
300
350
400
450
500
Top management Senior management Professionally qualified andexperienced specialists and
mid-management
Skilled technical andacademically qualified
workers, juniormanagement, supervisors,
foremen andsuperintendents
Semi-skilled anddiscretionary decision
makers
Unskilled and defineddecision makers
Temporary employees
African Male Coloured Male Indian Male White Male African Female Coloured Female Indian Female White Female Foreign nationals - male Foreign nationals - female
3.9% 6.0% 15.9% 34.4% 16.4% 15.3% 8.0%

18
Figure 12 - Employment split per race medical technology
8 4 3
80
2 3 8
29
5 19 7 11
75
8 8 11
87
3 2
38
19 26
187
29 33
31
211
6 2
117
37
78
276
123
58
95
466
5 2
177
54
31
26
105
56
44
107
0 0
121
31
4 2
209
146
40
4 1 0
42
11
7 16
96
83
13 26
0 0
0
50
100
150
200
250
300
350
400
450
500
African Male Coloured Male Indian Male White Male African Female Coloured Female Indian Female White Female Foreign nationals -male
Foreign nationals -female
Top management
Senior management
Professionally qualified and experienced specialists and mid-management
Skilled technical and academically qualified workers, junior management, supervisors, foremen and superintendents
Semi-skilled and discretionary decision makers
Unskilled and defined decision makers
Temporary employees
14.0% 4.5% 4.4% 18.1% 15.6% 10.6% 6.6%
25.4%
0.5% 0.2%

19
BBBEE Levels
Further to the conclusions presented above, top management in the medical technology industry is
largely white. Total top and senior management, based on 46 surveys, consists of 364 people. From
this number, 271 are white (74%), 27 are African (7%), 22 are coloured (6%), 33 are Indian (9%) and
11 are foreign nationals (3%). These numbers are reflected in the average BBBEE levels in the
industry as shown in the figure below. Compared to the 2009 industry overview, where total top and
senior management was 83% white, one can conclude that the industry is transforming, though be
at a steady pace.
Figure 13 - BBBEE levels medical technology sector
There are four medical technology companies that do not comply with BBBEE regulation. Most
companies (32%) are a level 4 contributor. When splitting these numbers between multinationals and
local companies, the mode for multinationals is a level 5 contributor whereas the mode for local
manufacturers is a level 4 contributor28
. Local companies also score higher, in absolute terms, on the
BBBEE levels 2 and 3. A cautious conclusion that can be drawn is that local companies are perhaps
better aware and have a better understanding of BBBEE regulation compared to multinational
companies. Another reason provided by multinationals is that to move beyond level 5 they would
need to sell equity which is something multinationals are reluctant to do due to the way their
business is structured and organised. When asked if respondents expect their BBBEE levels to
increase next year a majority answered ‘no’ (32 respondents, or 68%). The main reasons mentioned
in this regard were:
■ New BBBEE codes, that are considered to be ‘stricter’, that come into effect within the next
twelve months. The new targets of these codes are 88% blacks in junior management, 75% in
middle management and 60% in senior management; and,
■ The argument raised above relating to multinationals that are restricted in selling their equity.
The companies that indicate that their BBBEE levels will improve use the following arguments for it:
■ Planned restructuring of the business that will include a heavier investment on bursaries;
■ Employing more black staff in senior positions; and,
■ More investments in partnerships and social development.
28 The mode is the value that appears most often in the dataset.
01
8
15
9
5
0
54
BB
BE
E le
vel 1
con
trib
uto
r
BB
BE
E le
vel 2
con
trib
uto
r
BB
BE
E le
vel 3
con
trib
uto
r
BB
BE
E le
vel 4
con
trib
uto
r
BB
BE
E le
vel 5
con
trib
uto
r
BB
BE
E level 6
con
trib
uto
r
BB
BE
E le
vel 7
con
trib
uto
r
BB
BE
E le
vel 8
con
trib
uto
r
Non c
om
plia
nt

20
Investment in sponsorship and training
The respondents spent a total of R 23.7 million on sponsorship in the last audited financial year. This
is an average of R 504 000 per company if all companies – also those that do not spend any money
on sponsorships – are taken into account. When excluding companies that do not spend money on
sponsorship, the average is R 696 772. We found no correlation between total company revenue and
expenditure on training. Of the ten companies with the highest expenditure on sponsorship, seven
are multinationals.
Further to the expenditure on sponsorship, survey respondents have also shared their expenditure on
training split between the five categories in the figure below.
Figure 14 - Expenditure on training medical technology
Total expenditure on training is R 31.7 million. As can be seen in the figure above, half of it goes to
CME training for doctors in the private sector, followed by CME training for doctors in the public
sector. Consequently, over 80% of training is spent on training doctors. The remainder is set aside
for the training of allied health professionals in both the public and private sector. The category ‘other’
consists of specific training for employees. The expenditure on training by multinationals is
significantly higher (R 20.5 million) when compared with local companies (R 11.3 million). In section
3.3 of this report we further set out the value the medical technology delivers beyond its impact on
economic indicators. As can be seen in the figure above, the industry invests over R 30 million in
training health professionals and, as is further set out in section 3.3 of this report, this is but one of
the values the industry brings for health professionals.
Medical Technology sector contribution to South Africa – discussion
The survey is purposely designed to capture the – perhaps more qualitative and emotional –
arguments on the industry’s contribution to South Africa. With regards to this, we have agreed with
SAMED in the preparation of this survey, to ask the following four questions:
1. In your opinion, how can the contribution to the South African economy by the Medical
Device industry be increased?
2. What barriers should be removed to enable the expansion of the Medical Device industry in
South Africa?
Continuing Medical Education (CME ) training
for doctors in private sector50%
Continuing Medical Education (CME) training
for allied health professionals in the private
sector 8%
Continuing Medical Education (CME) training for doctors in public sector
31%
Continuing Medical Education (CME) training
for allied health professionals in the public
sector 7%
Other4%
R 15.8 million
R 2.6 million
R 9.8 million
R 2.1 million
R 1.4 million

21
3. In your opinion, how do you think the Medical Device industry contributes to Research &
Development in South Africa?
4. What barriers should be removed, to increase Research & Development spending in South
Africa?
No less than 44 respondents answered these open-ended questions of which the most common
themes brought forward by the respondents are summarised below.
2.5.1 Question 1: In your opinion, how can the contribution to the South African economy by
the Medical Device industry be increased?
The answers received are generally consistent and can be broken down into the following categories.
■ Promote local manufacturing
The vast majority of respondents, specifically the local companies, felt that an increase of local
manufacturing would have a significant impact on the nation’s economy in terms of supporting job
creation and its positive contribution to the balance of payments. The arguments most frequently
mentioned are further discussed hereafter.
Several companies have suggested that export incentives be created for products that are locally
manufactured. Besides creating incentives for locally manufacturing products, it would also nicely fit
into South Africa’s reputation in acting as a gateway for doing business in the rest of the continent
and specifically in the SADC countries. On the flipside and mentioned by several respondents is
penalising, through increasing tax or import levies, imported low and medium risk commodity
products that could have been manufactured locally. By only focussing on this product range it
excludes the more capital intensive products like CTs and MRIs. Other companies have argued that
incentives could be put in place by government to create an environment in which it is more
attractive, also for multinationals, to increase local manufacturing of medical technology. These
incentives could be put forward by the Department of Trade and Industry (dti). This Department could
play a role in prioritising the medical technology sector as was done previously by this Department for
the pharmaceuticals market. As such, dti could also create awareness of what the industry means for
the country’s economy. The respondents also suggest better and easier access for funds to invest in
R&D. Again, this could form part of incentives impose by government. However another example
mentioned in this respect is to set-up and invest in formal programmes at universities that exclusively
focus on medical technology.
■ Improve legislation/regulation
The second category of answers given by respondents is around improving legislation and regulation
in the industry. Several companies reason that less onerous labour legislation and a more stable
labour market are imperative for local manufacturers to be successful. Several companies mention
that regulation, and specifically registration of companies and/or products, of the industry would have
a positive impact specifically on quality of the medical devices. It prevents import of products that are
currently cheaper but are considered to be of sub-standard quality. In line with this reasoning, one
company strongly urged that MCC should improve its performance. Both local companies and
multinationals have commented on how BBBEE regulation in some cases hampers growth. The
smaller companies prefer a situation in which they would be subjected to stringent BBBEE models,
and/or, a situation in which BBBEE points are rewarded for those companies making local
investments. Multinationals agree with this as they believe that changes in ownership structures,
as was set in the previous section of this report, are not achievable.
There is a slight contradiction in the answers given as some companies indicate that less regulation
would benefit the economy and others argue more regulation is needed. Having said that, more
companies were in favour of ‘more regulation’ compared to ‘less regulation’.

22
■ Turnaround of the current practice and thinking for procurement and payment for our major payers
The major funders in private sector are the medical schemes that, in turn, have influence in what
medical technology is covered and thus preferred by patients and providers alike. Another important
payer is government. In general, respondents feel too much emphasis is placed on price and less so
on the long-term savings that new medical technology brings. In line with this reasoning; the
respondents feel there should be more focus on quality instead of price.
Many respondents have raised concerns related to delayed payments, or not paying according to
payment terms, by government. Indeed, this poses a financial risk for those companies whose main
clientele is within the public sector as cash flows become unpredictable resulting in a need to raise
finance that again results in additional, preventable, costs. This is a particular risk for small and
medium enterprises. Some respondents also commented on government procurement processes
saying that it could be improved in terms of transparency. Additionally, more focus should be placed
on quality and less on price and, so is felt in industry, also on BBBEE compliance. Lastly, respondents
claim that government indeed has a role play to increase the usage of locally manufactured products
and should therefore, in its procurement processes, award more credits to those companies that are
local manufacturers.
SAMED’s position on public procurement of medical technology is29
:
– Medical technology products are not commodities. They undergo rapid cycles of improvement
and variation to meet patient and doctor needs. A system in which low price alone prevails
over a combined consideration of cost and quality, fails to account for costs and value for the
entire episode of care. Many medical devices often remain in a patient or in use at a hospital
for many years. According to SAMED it favours older and simpler technology and does not
consider the long-term value and cost as replacing low-quality devices leads to additional
hospital expenditure and thus costs.
– When procuring medical technology, maintenance and the in- or exclusion of a maintenance
contract in price, should be considered. In the UK, for example, medical technology tenders are
evaluated not only on price but also on; functional characteristics; product support; quality; and,
delivery performance.
– Medical technology contracts should not be exclusive to one brand and/or product. This will
allow to cater for different patient, clinical and doctor needs. In addition, there should be a way
for new technology to be introduced during the term of the contract, this would specifically
apply to longer term contracts.
– Make contracting terms and conditions clear and transparent before publishing a tender to
increase competitiveness and create a level playing field between bidders.
– Procurement is most efficient when it is closer to the end-users and at the critical point of care.
As such, SAMED believes that decentralised procurement should be preferred over centralised
procurement; this will be specifically true for critical items. Another reason put forward by
SAMED is that central procurement would require a national database of all medical items
including stock-levels as procurement without such a system can lead to shortages or
oversupply.
– Competitive tendering should not artificially control the number of organisations that can exist
in a healthcare system. A maximum threshold should be established to limit the total monetary
value per tender. A way to circumvent this is to use multiple source contracts so that a diverse
range of brands, products and services is available to the clinical workforce.
■ Remaining issues
Not all the arguments provided by the survey respondents could be categorised. We do, however,
strongly feel that the remaining issues stated below are relevant and should be put forward in this
29 Draft SAMED position on public procurement of medical devices, 2012.

23
report. Several companies said that the main factor for growth for the medical technology industry is
the growth of the health sector in general, whether that be growth in private healthcare (through, for
example, GEMS) or in public sector (through NHI). Another company had a strong view that public
sector providers and the medical technology industry should improve collaboration to support and
revitalise the public sector hospitals. Through collaboration the medical technology industry could
lower costs and improve patient care in the public sector. There was one company who argued that
the trade association [SAMED] should aim, through its board members and secretariat
representation, to increase its visibility at government level.
Other remaining issues that were mentioned were related to increasing the training of health
professionals in actually using medical technology. Lastly, it was argued that South Africa is the
perfect place to create ‘domestic centres of global excellence’.
2.5.2 Question 2: What barriers should be removed to enable the expansion of the Medical
Device industry in South Africa?
The arguments put forward by the respondents are clearly in line with the arguments given under the
first question. The four main themes are reflected below:
■ Implement regulation and registration processes
The general tone in the answers provided to us is that there is a big need for more regulation and the
registration of products and companies that work in the sector. On the other hand, several
companies argue for less stringent regulation in the BBBEE space. One multinational specifically said
that removal of BBBEE legislation would allow multinationals to tender in NHI. There is only one
company that says less regulation would enable the expansion of the medical technology industry.
The main argument to increase regulation is to better regulate imported products and thus protect
patients from products that are of inferior quality. Multinationals tend to reason that they are reluctant
to invest in a country with a medical technology market that is minimally regulated. One company
suggested the creation of more free trade zones in Africa. For South Africa, this would create
incentives to export products manufactured in-country. Regarding the registration of products,
comments were made that the MCC should base its registration on the Health Technology
Assessment (HTA) framework and then specifically on the outcomes medical technology achieves,
rather than costs. Another company desired the processes to obtain CE-mark for locally
manufactured product to be simplified.
■ Incentivise the market
Lowering the cost-base for companies’ results in money being freed up for investments,
employment and profit. The market can be incentivised through, indeed, making sure the incurred
costs for companies decrease, through the creation of subsidies, grants and other ways of support.
The latter is further discussed under the following two questions related to R&D. Many companies
have stated that tax incentives can contribute significantly in terms of increasing investments in the
industry. Another argument shared is to remove import duties for raw materials used by local
manufacturers. Survey participants would welcome an investment fund set up by government.
Organisations that could play a role in providing investment funding are dti and the Department of
Science and Technology (DST), and parastatals like the Public Investment Corporation (PIC),
Development Bank of Southern Africa (DBSA), the Technology Innovation Agency (TIA) and the
Industrial Development Corporation (IDC) are well positioned to make medical technology a priority
industry as was done with pharmaceuticals in the last decade. One company explicitly mentioned
that public awareness of the industry should be a focal point, for example through the introduction of
a “made in SA” banner similar to the initiative in the food and retail industry with the “proudly South
African” logo.
There were a few companies that raised concerns about the relative power some dominant
healthcare funders (medical schemes) have in terms of approving medical technology products.

24
Some experience this environment, specifically to get medical technology on the ‘approved’ list of
medical devices, to be restricted. The main concern is around the limits set by funders. One
respondent said that ‘exclusion lists’ hamper the industry’s growth. In line with this argument, one
company suggested the creation of stronger links between HTA resource and reimbursement
models where HTA should rather focus on outcomes and longer-term cost impacts as opposed to
merely looking at current costs incurred.
■ Work more closely with government and raise general awareness of the medical technology
industry
A large portion of the respondents expressed concerns about the knowledge base with regards to
medical technology across the different spheres of government. According to the industry this has an
impact on national policies, but is also felt on a day-to-day basis when it comes to responding to
tenders and, once a tender is won, payment for services and products delivered. The feeling is that
there is a lack of transparency in the procurement process and some companies showed their
dissatisfaction if adjudication of a bid is delayed or cancelled.
Industry players indicated they’d appreciate a clear direction from government in terms of health
policies that is more open to innovation. Also, a clear path for the implementation of NHI is
something respondents feel is lacking.
Lastly, an important point was made about recognition. The industry feels they are more often than
not being incorrectly blamed for the increasing costs of healthcare. Some players indicated that
recognition of the impact the industry has on the economy would be very much welcomed.
■ Better education and training to be put in place
Arguments mentioned around this theme are:
– To increase the number of people that receive dedicated (engineering) education in the
medical technology industry;
– To create bursaries for product development engineers and execute on these bursaries
together with universities; and,
– To increase physicians skill and awareness in the use of medical technology.
2.5.3 Question 3: In your opinion, how do you think the Medical Device industry contributes to
Research & Development in South Africa?
The majority of the respondents answered by saying that the contribution of the medical technology
industry to R&D is not significant. This is evident from survey results as members have indicated that
total spend on R&D amounts to approximately R21 million on R&D. This equates to less than 1% of
their total average operational expenditure.

25
Figure 15: Split of total operational spend
The underpinning argument why this is the case is the limited local manufacturing base that,
following the reasoning of most respondents, is an existential criterion to have in place for R&D.
Because of this base being so small, no critical mass is created for R&D investments to result in a
positive Return-On-Investment (ROI). Some multinationals confirmed this by stating that most R&D
was done abroad. Another reason is the lack of funding, whether it be through universities, subsidies
from government or medical schemes. One company argued that the R&D investment climate is
more business friendly in other African countries like Kenya thus resulting in decisions to move R&D
activities outside South Africa. Lastly, the respondents feel there is no true R&D culture in the
country and there is little appetite and uptake from universities to invest in this field.
On a more positive note it was mentioned that, specifically the multinationals, could draw upon global
skills and as such contribute more to R&D in the country through collaboration with academia and
tertiary hospitals. Indeed, some companies indicated they already have R&D projects with several
universities in the country and contribute to learners at academic institutions. Others have indicated
they invest in training. One participant suggested that South Africa could act as a regional, and
perhaps African hub, when it comes to R&D.
2.5.4 Question 4: What barriers should be removed to increase Research & Development
spending in South Africa
The answers given to this questions covered a wide range of options. There were, however, two
common themes under which the answers can be grouped.
■ Create a process to access R&D funding
The first step that goes under this argument is to create funds that can be used for R&D purposes.
This could be done via tax incentives, for example, but it was indicated that national coordination is
required. Incentives could also be combined with research done at universities, thus creating thesis
opportunities for PhD and Master Students. One company contributed by saying there should be a
clearer link between the medical technology sector, specifically R&D, and the National Development
Plan (NDP).
Salaries and wages35.0%
Taxes (e.g. company tax, land tax, import duties)
10.6%
Rental and levies2.8%
Depreciation4.3%
Financing costs0.9%
Research and Development (R&D)
0.5%
All other operational expenditure
45.9%
26
When it comes to the process of conducting R&D, a concern raised by the respondents are the
delays experienced with the MCC. It was mentioned that it is hard to contact the MCC and concerns
were raised around the medical technology knowledge base at the MCC. This creates gaps and little
incentives for the medical technology market to heavily invest in R&D and as one respondent put it
“…there is now too much responsibility for manufacturers”. In line with this, and not necessarily
connected to the MCC’s service delivery is the preferred streamlining of processes for the ethical
approval of clinical trials.
The overarching debate picked up from the answers is whether or not the South African medical
technology market is at the tipping point where R&D investments would work. Most companies
agree that this tipping point has not been reached yet as the technical infrastructure cannot compete
with global standards and there would need to be a solid base of local manufacturers to conduct R&D
to the fullest. Most companies agree that this base of local manufacturers is too small.
■ Creating an R&D environment and culture
R&D is relatively new to the South African market and the industry believes that this is one reason
why R&D investments have been low. One responded approached this dilemma by saying that
regulation is needed first before multinationals start considering investing in R&D since through
regulation, regulatory compliance can also be assessed. This in line with another matter raised saying
that a more stable business climate is required and that, in general, political unrest discourages
multinationals to invest.
Some respondents referred to the skills shortage in this field and that there is only a few people that
know how to conduct R&D and/or clinical trials. One company mentioned that it is not always about
the money, but more about getting the ‘how to do it’ right. Another argument put forward was that
R&D in medical technology should become a priority area within the Council for Scientific and
Industrial Research (CSIR).
The principal matter raised was the absence of national policy on R&D and what benefits could be
derived from R&D.

27
3 Economic Impact Assessment
Economic Impact
Assessment
3

28
3.1 Overview of approach
This section provides an overview of the approach and methodology used to quantify the
macroeconomic impact of the medical device industry on the national economy for the following
macroeconomic and socio-economic indicators:
Both the capital expenditure and operational expenditure of the medical technology industry were
considered in the analysis.
Economic modelling methodology
The economic impact modelling for this project was undertaken by using an Economic Impact
Assessment (EIA) approach that makes use of the 2011 Social Accounting Matrix (“SAM”) of the
South African economy. The SAM represents the structure of a national economy at a specific point
in time. A brief outline of the modelling methodology is contained in the boxes below and more detail
on the methodology can be found in appendix 3.
The EIA approach applied, is based on the theory of input-output (IO) analysis designed by Wassilly
Leontief. The basis of IO analysis is that by mapping the flows of funds between the various
economic role players, it shows the interdependencies between different sectors of the economy in
matrix format. SAM-based EIA models are often used to study the structure of both national and
regional economies within a country, as well as tools for national and regional planning.
The central use of the SAM-based EIA model is for estimating the economic impacts of major events,
public investment projects or government policy initiatives and programmes. SAMs can also be used
to identify economically related industry clusters and so-called "key" or "target" industries that are
industries that are most likely to increase the internal coherence of a specified economy. This is done
by analysing the linkages between the different sectors in the economy.
The diagram below describes how initial expenditure is transmitted through the economy given the
existing structure of the economy and the relationship between the various sectors and economic
institutions or agents.
Impact on GDPImpact on employment by
skills level
Impact on government
revenue
Impact on the National
Development Plan (NDP)

29
An example of how the model works
The diagram above shows the importance of economic linkages and the transmission mechanism of
expenditure in an economy. This can be further explained through an example: if the medical technology
industry decides to construct a new manufacturing plant, the construction business that is contracted will
undertake additional business activity. This increase in business activity means that the construction
company must now increase the number of people it employs and it demands additional goods and
services in order to build and equip the manufacturing plant.
The additional people that are employed in the construction of the manufacturing plant now have more
money to spend in the economy and they consume more goods and services, hence generating more tax
revenue that is directed back to national government.
As business activity increases for the construction company directly, additional corporate tax is also
generated and directed back into tax revenue. In addition to this, other businesses that supply the
construction company with goods and services also experience an increase in their business activity as the
construction company demands more. It is important to note that as business activity increases
employment also increases and additional profit is generated. This results in some re-investment back into
business and increases the corporate tax base.
Medical
technology
industry
expenditure
Increased
business activity
Job creation and
second round
increases in
business activity
Increased
consumption,
savings and
investments
The increase in employment, consumption
and business activity results in an increase
in tax revenue that is collected by
government and therefore enables
additional government expenditure.
Figure 16 - How the Economic Impact Model works
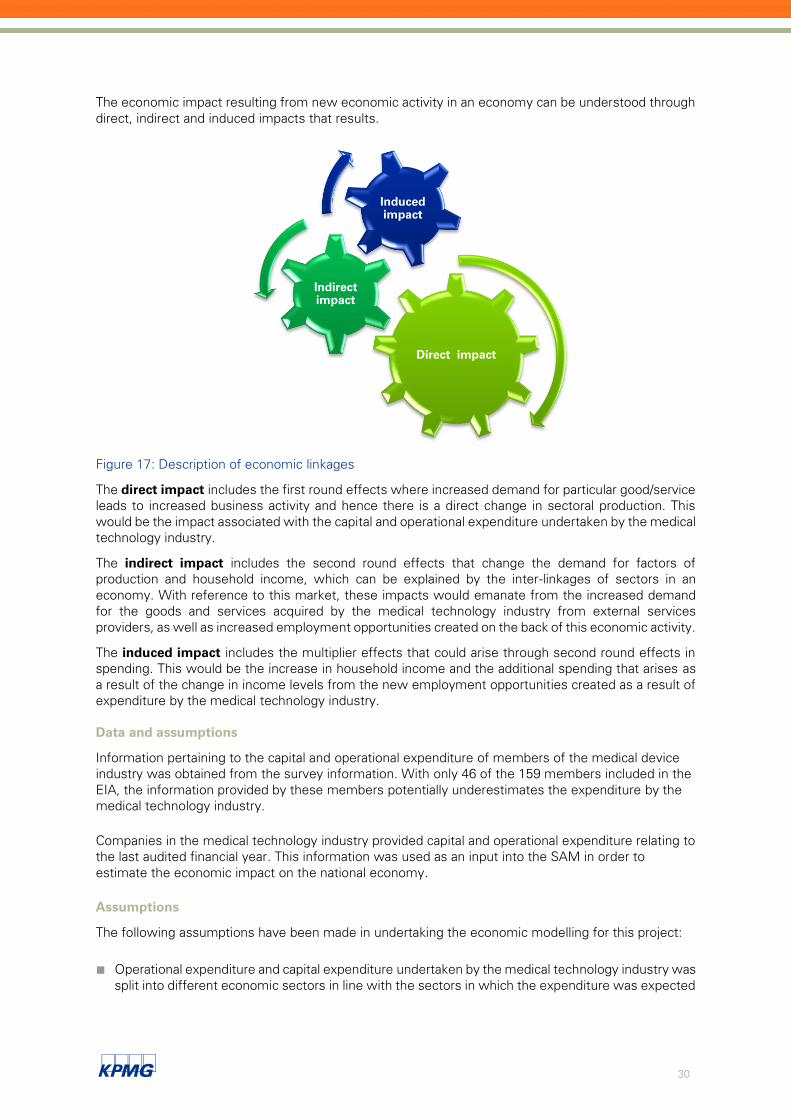
30
The economic impact resulting from new economic activity in an economy can be understood through
direct, indirect and induced impacts that results.
Figure 17: Description of economic linkages
The direct impact includes the first round effects where increased demand for particular good/service
leads to increased business activity and hence there is a direct change in sectoral production. This
would be the impact associated with the capital and operational expenditure undertaken by the medical
technology industry.
The indirect impact includes the second round effects that change the demand for factors of
production and household income, which can be explained by the inter-linkages of sectors in an
economy. With reference to this market, these impacts would emanate from the increased demand
for the goods and services acquired by the medical technology industry from external services
providers, as well as increased employment opportunities created on the back of this economic activity.
The induced impact includes the multiplier effects that could arise through second round effects in
spending. This would be the increase in household income and the additional spending that arises as
a result of the change in income levels from the new employment opportunities created as a result of
expenditure by the medical technology industry.
Data and assumptions
Information pertaining to the capital and operational expenditure of members of the medical device
industry was obtained from the survey information. With only 46 of the 159 members included in the
EIA, the information provided by these members potentially underestimates the expenditure by the
medical technology industry.
Companies in the medical technology industry provided capital and operational expenditure relating to
the last audited financial year. This information was used as an input into the SAM in order to
estimate the economic impact on the national economy.
Assumptions
The following assumptions have been made in undertaking the economic modelling for this project:
■ Operational expenditure and capital expenditure undertaken by the medical technology industry was
split into different economic sectors in line with the sectors in which the expenditure was expected
Direct impact
Indirect
impact
Induced
impact

31
to take place. Based on KPMG’s previous experience on a range of EIA projects undertaken we
made assumptions around the sector shocks30
to be applied to the various expenditure items.
■ Only expenditure that takes place within South Africa’s borders should be included as an input into
the model. The expenditure that occurs outside of the country is essentially a leakage out of the
system. Information provided by the survey members regarding imported costs was excluded from
the total operational and capital expenditure and only the local expenditure was used as inputs into
the model.
■ The SAM used in this project has a 2011 base year. All impacts introduced into the model are in
current prices and there after all results are reported in current prices.
■ The direct jobs that were supported over the review period are taken from the headcount accounted
for during operational phases. This information was obtained from the survey sent out to SAMED
members.
3.2 Introduction to the economic modelling impact results
This section of the report presents the results of the economic and socio-economic impact of the
medical devices industry on the South African economy for the assessment of the following
macroeconomic and socio-economic indicators:
■ Impact on GDP;
■ Impact on employment by skills level; and,
■ Impact on government revenue.
The impacts related to the capital and operational expenditure of the industry were determined
separately. Capital impacts consist of the capital expenditure that occurred over the last financial year.
Impacts from the operational phase consist of operational expenditure by medical device companies
over the last financial year.
3.2.1 The macroeconomic impact assessment of capital expenditure
This section focuses on the impact of total capital expenditure on economic activity, employment31
and
tax revenue on the South African economy for the last audited financial year.
Capital expenditure activities are considered to be a major source of economic growth, development
and economic activity. It is regarded as a mechanism for generating employment opportunities to
millions of unskilled, semi-skilled and skilled workers.
Impact on GDP
Over the period under review, companies within the medical technology industry of South Africa
spent approximately R166.4 million32
on various capital related activities. As such, the associated
expenditure potentially contributed to an overall increase in national GDP of R202 million.
The associated economic multiplier of this expenditure on the national economy is 1.21, implying
that, for every R1 spent, an additional 21 cents in economic activity is generated. The sectors that
30 A shock implies the initial expenditure run through the EIA model to determine the impact it has on the economy.
31 It is important to note that the employment numbers are reported in job opportunities and should be interpreted as one job
per year which could potentially be sustained in the next year.
32 The total capital expenditure excludes the proportion spent on imported goods and services. It is the sum total of the capital
expenditure figures received during the survey process.
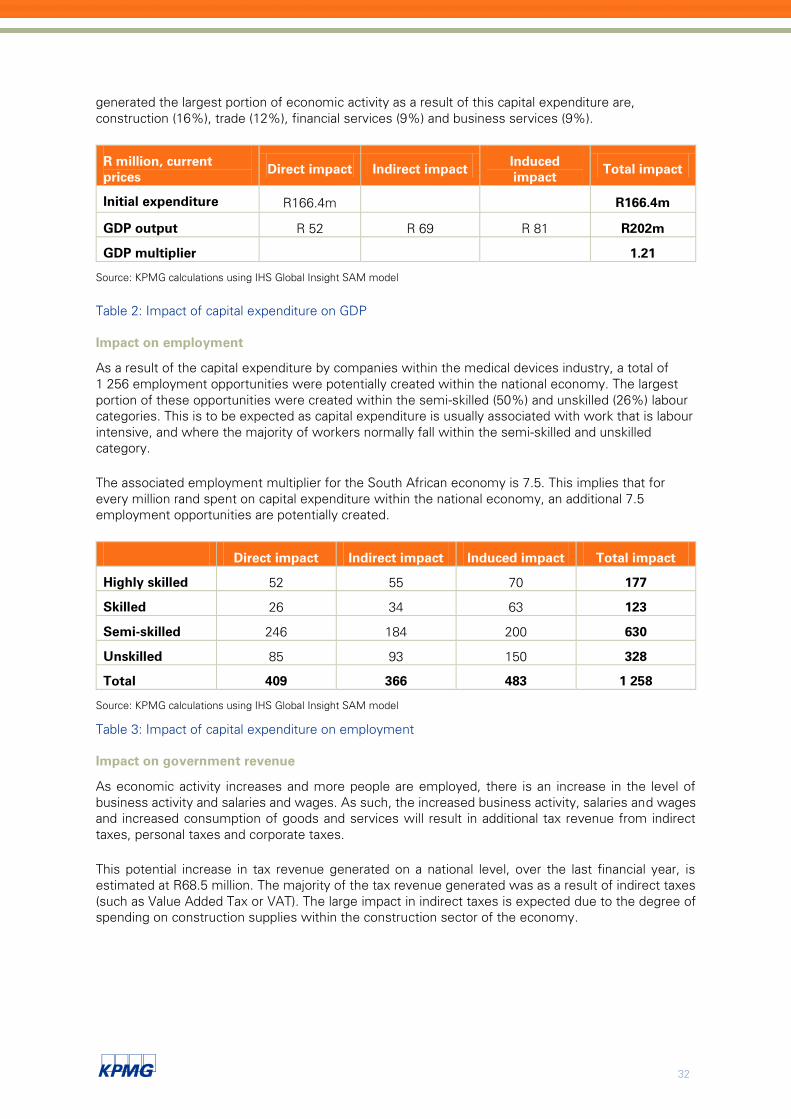
32
generated the largest portion of economic activity as a result of this capital expenditure are,
construction (16%), trade (12%), financial services (9%) and business services (9%).
R million, current
prices Direct impact Indirect impact
Induced
impact Total impact
Initial expenditure R166.4m R166.4m
GDP output R 52 R 69 R 81 R202m
GDP multiplier 1.21
Source: KPMG calculations using IHS Global Insight SAM model
Table 2: Impact of capital expenditure on GDP
Impact on employment
As a result of the capital expenditure by companies within the medical devices industry, a total of
1 256 employment opportunities were potentially created within the national economy. The largest
portion of these opportunities were created within the semi-skilled (50%) and unskilled (26%) labour
categories. This is to be expected as capital expenditure is usually associated with work that is labour
intensive, and where the majority of workers normally fall within the semi-skilled and unskilled
category.
The associated employment multiplier for the South African economy is 7.5. This implies that for
every million rand spent on capital expenditure within the national economy, an additional 7.5
employment opportunities are potentially created.
Direct impact Indirect impact Induced impact Total impact
Highly skilled 52 55 70 177
Skilled 26 34 63 123
Semi-skilled 246 184 200 630
Unskilled 85 93 150 328
Total 409 366 483 1 258
Source: KPMG calculations using IHS Global Insight SAM model
Table 3: Impact of capital expenditure on employment
Impact on government revenue
As economic activity increases and more people are employed, there is an increase in the level of
business activity and salaries and wages. As such, the increased business activity, salaries and wages
and increased consumption of goods and services will result in additional tax revenue from indirect
taxes, personal taxes and corporate taxes.
This potential increase in tax revenue generated on a national level, over the last financial year, is
estimated at R68.5 million. The majority of the tax revenue generated was as a result of indirect taxes
(such as Value Added Tax or VAT). The large impact in indirect taxes is expected due to the degree of
spending on construction supplies within the construction sector of the economy.

33
Government revenue generated (R million)
Personal and company taxes R16.73
Indirect taxes R51.80
Total R68.53
Source: KPMG calculations using IHS Global Insight SAM model
Table 4: Impact of capital expenditure on Government revenue
3.2.2 The macroeconomic impact assessment of operational expenditure
This section focuses on the impact of total capital expenditure on economic activity, employment33
and tax revenue on the South African economy for the last audited financial year.
Impact on GDP
During the period under review, companies within the medical technology industry spent
approximately R2.93 billion34
on their operational expenditure locally. This expenditure created an
estimated increase in overall national economic activity of R3.68 billion. The associated economic
multiplier for this expenditure amounted to 1.32, implying that for every additional R1 spent in the
national economy by the medical technology companies, an additional 32 cents in economic activity
is generated.
The multipliers depend on the strength of linkages between these sectors. The sectors of the South
African economy that recorded the largest impacts were the health, trade, financial intermediation
and the real estate sectors of the economy which contributed 29%,10%, 9% and 8% of the total
impact respectively. The health sector recorded the largest impact, as it was directly impacted by the
type of operational expenditure associated with the medical device industry.
R million, current
prices Direct impact Indirect impact
Induced
impact Total impact
Initial expenditure R2 933 R2 933
GDP output R 1 035 R 920 R 1 913 R 3 868
GDP multiplier 1.32
Source: KPMG calculations using IHS Global Insight SAM model
Table 5: Impact of operational expenditure on GDP
Impact on employment
As a result of the capital expenditure by the medical technology companies, a total of 19 583
employment opportunities could have potentially been created within the South African economy.
The medical technology companies were directly responsible for 3 36135
employment opportunities
33 It is important to note that the employment numbers are reported in job opportunities and should be interpreted as one job
per year which could potentially be sustained in the next year.
34 This figure excludes all operational expenditure related to imported goods purchased. This money is considered to have left
the country and would have not contributed to the economy.
35 Total number of direct employment opportunities s provided by survey respondents. Excludes temporary employees.

34
within the industry during the period under review. The largest number of opportunities were created
within the semi-skilled (40%) and unskilled (27%) labour categories.
The associated employment multiplier for the South African economy is 7. This implies that for every
million rand spent on operational expenditure within the national economy, an additional 7
employment opportunities are potentially created.
Direct impact36
Indirect impact Induced impact Total impact
Highly skilled 946 791 1 652 3 389
Skilled 1 257 503 1 484 3 244
Semi-skilled 600 2 301 4 740 7 641
Unskilled 558 1 239 3 572 5 369
Total 3 361 4 834 11 448 19 643
Source: KPMG calculations using IHS Global Insight SAM model
Table 6: Impact of operational expenditure on employment
Impact on government revenue
The potential increase in tax revenue on a national level is estimated at R1.8 billion over the period
under review. The majority of the tax revenue generated was as a result of indirect taxes (such as Value
Added Tax or VAT). The large impact in indirect taxes is expected due to the degree of spending on
construction supplies within the construction sector of the economy.
Government revenue generated (R million)
Personal and company taxes R529.82
Indirect taxes R1 260.1
Total R1 789.92
Source: KPMG calculations using IHS Global Insight SAM model
Table 7: Impact of operational expenditure on Government revenue
3.3 The value medical technology brings to people’s lives,
beyond economic impact on the country
Besides the impact on economic indicators as set out above, the medical technology industry’s
biggest impact is on the day-to-day lives of the population. The value of medical technology can be
broken down into the value for the patient, the health professional and the health system.
Firstly, value for the patient. The development and usage of medical technology has resulted in safer
and improved delivery of care over the past decades. This in turn improves quality of life for millions
of patients. Improvements in medical technology also leads to faster recovery and a more productive
life.
36 Total number of direct employment opportunities s provided by survey respondents. Excludes temporary employees.

35
Secondly, value for the health professional. Medical technology has contributed towards meeting and
improving standards of care, for example better management of hypertension with the use of blood
pressure monitoring machines. Perhaps more importantly, medical technology has led – and still
leads to – conducting procedures safely with less room for human error. Lastly, medical technology
companies provide ongoing training for health professionals as is shown in figure 14 of this report.
Thirdly, for the health system in general, applying medical technology – whether it be low-tech or
cutting-edge high-tech medical technology – leads to improved effectiveness and efficiency of health
facilities, and thus the health system. Due to less invasive treatment techniques, patients have lower
risks of hospital-borne infections, are discharged faster and recover quicker. In addition to this,
medical technology, through the use of ‘mobile health’ or ‘eHealth’ enables the, remote, efficient
management of chronic diseases and prevents unneccesary patient visits to their care facilities.
Medical technology enables people to live healthier and longer lives. This in turn, results in increased
productivity that positively contributes to the economy of a country. Estimates show that a one-year
increase in a nation’s ‘average life expectancy’ can lead to a 4% increase in GDP per capita in the
end. Having a healthier labour force can contribute to an increase in productivity. Based on
international studies, labour force productivity can increase between 20% and 47.5%37
.
3.4 Economic Impact on the National development plan
The National Development Plan (“NDP”) Vision 2030 identified some of the major challenges to
preventing the health sector from achieving its full potential to be high levels of unemployment,
inadequate infrastructure, exclusionary spatial patterns and unsustainable use of resources. With this
in mind, certain objectives and targets were identified in the NDP to address the challenges in the
health sector.
The NDP objectives that relate to the role that the health sector could play in the South African
economy, are:
■ To create 11 million more jobs in the economy by 2030 by:
– Improving economic policy coordination and implementation
– Building partnerships between the public sector, business and labour to facilitate, direct and
promote investment in labour-intensive areas
– Raising competitiveness and export earnings through better infrastructure and public services,
lowering the costs of doing business, improving skills and innovation, and targeting state
support to specific sectors
– Strengthening the functioning of the labour market to improve skills acquisition, match job
seekers and job openings, and reduce conflict.
37 Funding NHI: A spoonful of sugar? An economic analysis of the NHI. Publication by KPMG South Africa.

36
■ Providing healthcare for all by:
– Deploying primary healthcare teams to provide care to families and communities.
– Everyone must have access to an equal standard of care,
regardless of their income.
– Filling posts with skilled, committed and competent individuals.
– Significantly reducing prevalence of non-communicable chronic
diseases.
This macroeconomic assessment could
assists in illustrating how the medical
technology industry aligns with the NDP
objectives such as job creation, economic
growth and helping people to live healthier lives.
The medical technology industry forms part of the South African government’s commitment to dealing
with the aforementioned challenges in the heath sector as well as within the economy. The medical
technology Industry is well positioned to open doors to new global business and trade opportunities,
whilst creating vital employment opportunities and stimulating economic growth in the economy.
The medical technology industry also plays an essential role in the health sector, helps people live
healthier, more productive and socially active lives and also makes individuals more employable.
Continuous innovation in medical technology enhances the quality and effectiveness of healthcare
and in doing so contributes to steering the healthcare sector onto a sustainable path.

37
4 Regulatory Environment
Regulatory Environment
4

38
4.1 Introduction
The sections above have set out what the medical technology industry is about, into what direction it
wants to develop in future and what support from stakeholders is needed and what the impact of the
industry on the economy is. This section sets out the current regulations that apply to medical
technology and uses two benchmarking countries, Brazil and Australia, to see what lessons in terms
of regulation and incentives can be learnt for South Africa. These countries have been selected as
they are often used as benchmarking countries in government policy research and because of their
similarities with the South African health system. An example of a similarity for both countries is that
healthcare provision is delivered through public and private health systems. This section also includes
the results on the final part of the survey where we’ve asked the industry to respond to the potential
impact of regulation on quality and price.
4.2 South African regulatory environment
Earlier sections of this report have made clear that there is only limited regulation in place for medical
technology companies and devices in South Africa. This is specifically true when comparing this with
the extensive legislation that is practiced in countries like the US and European Union member
countries.
Currently, all electro-medical devices need to be registered with the Radiation Control Directorate of
the National Department of Health (NDOH). This is governed by the Hazardous Substances Act (Act
15 of 1973) and regulations No 1332 of 3 August 197338
. The Radiation Control Directorate issues
importation licenses for ionising and radioactive equipment and sources39
. Licensing is split between
product licenses and premises licenses. An application for a license must be submitted to the
Directorate not less than 90 days prior to the expected date of performing the functions
contemplated. The Directorate may grant a temporary license and can also decide not to grant a
license if “Two or more listed electronic products are … situated near enough to-one another to be
regarded as one installation” 40
. Licenses are not transferable and are issued:
■ To a specific person or institution
■ For specific equipment and its application, and;
■ For a specific premises.
The code of practice states that 30 days are needed to process applications.
No other regulation in terms of price, quality and/or safety exist. The gap created due to the lack of
regulation has been largely taken up by healthcare providers and payers. The last group, specifically
the dominant players in the market that tend to be followed by the smaller medical schemes, have
set up dedicated policy and regulation divisions that test the safety and efficacy of medical
technology. Normally these divisions require minimum criteria to be in place, like having a CE mark or
being FDA and/or SABS approved. Payers are quite powerful in controlling what medical technology
is ‘approved’, i.e. will be reimbursed and thus used by the hospitals. Given that 70 percent of the
industries revenue is generated in the private sector, ‘self-imposed regulation’ put forward by medical
schemes has a significant influence on the quality of medical devices used in the health sector.
In 2011 the NDOH released notice R 586, Medicines and Related Substances Control Act (Act 101 of
1965) – Regulations Relating to Medical Devices through which interested persons were given a
three month time frame to submit comments. The notice makes provision for (amongst others):
■ Eight categories of medical devices
■ Four classes of medical devices, in line with the four classes earlier presented in this report.
38 Code of Practice for users of medical X-ray equipment, NDOH, 2010.
39 Annual Performance Plan 2013/2014 – 2015/2015, NDOH, 2013.
40 http://www.doh.gov.za/show.php?id=2963 accessed December 2013.

39
■ Registration of medical devices by the MCC, accompanied by an application fee.
■ MCC has the ability to subject a medical device to an assessment or abbreviated assessment
process.
■ The notification of medical devices available on the market.
■ Combination devices – those devices that have a medicinal component in it are subject to
regulation R 586, only in respect of its component that is not a medical component and its medical
component shall be dealt with as a medicine.
■ Licensing of manufacturers, exporters and importers.
■ Cancellation of registration.
■ Advertisement and promotion.
■ Labelling and instructions for use, stating that these should at least be in English.
■ Recalling and disposal of medical devices.
■ The use of refurbished medical devices41
.
The publication of this notice came when a parallel process was undertaking by government related
to the Medicines and Related Substances Amendment Act (Act 72 of 2008). This Act contains the
rules for the first comprehensive medical device regulatory system. It entails:
■ A definition of medical device.
■ Provisions for the establishment of the South African Health Products Regulatory Authority
(SAHPRA).
■ SAHPRA to registered products, medical devices and IVDs.
The publication of regulation R 586 not too long after Act 72 of 2008 indicates a change of direction
from government. There were two reasons for this change. The first one was the publication of the
Consumer Protection Act. The second is that there were governance related issues to the proposed
structure of SAHPRA42
.
It is yet still foreseen that SAHPRA will replace the MCC. The latest news published around SAHPRA
was that amendments to the Bill were published for comments in March 2013. These amendments
addresses one of the concerns expressed above regarding the proposed structure for SAHPRA.
SAHPRA is now foreseen to be a public entity with an independent Board chaired by a CEO. This
differs from earlier submissions where the CEO was appointed by the Minister of Health and gave
final authority for the approval for new products to the Minister of Health43
. The latest word from the
NDOH is that SAHPRA could potentially replace MCC at the end of 2014.
How the industry views regulation
SAMED has, on several occasions, submitted commentary to the National Department of Health, on
the regulation of the medical technology industry. In general, SAMED strongly supports a legislative
and regulatory framework to control the manufacture, distribution and marketing of medical devices
and IVDs to ensure that South African patients have access to products that are safe, effective and of
good quality. SAMED backs the general principles of regulation of safety, quality and efficacy as
proposed in Act 72, however does not support the introduction of economic criteria for registration,
as this imposes a second barrier to market entry which is unprecedented in other countries and will
cause delays, and limit access to healthcare choices for the South African public. Unnecessary and
duplicative product testing should be avoided.
41 Regulation 586, Government Notices, published: 22 July 2011.
42 Manufacture of Medical and Surgical Equipment and Orthopaedic Appliances, Siccode 3741, Who Owns Whom, 2012
43 http://www.bdlive.co.za/national/health/2013/06/04/new-medicines-regulator-delayed, accesses November 2013.

40
SAMED’s view on licensing and registration is in line with the proposed legislative changes, i.e. all
medical devices and IVDs to be registered and all persons importing, manufacturing and selling
medical devices and IVDs to have a license. SAMED’s principle is that the registration process must
be simple and efficient, responsive to the needs of the applicant with short lead times. HTA should
be separated from the registration process44
.
Specifically for quality regulation, SAMED proposes that where relevant and depending on the class
and type of medical device they are selling and/or manufacturing, companies should be certified
against the international manufacturing standard for medical devices (ISO 13485) and that companies
should have three to five years to achieve this accreditation from the date that regulations are
gazetted45
. SAMED supports a staged approach of medical device regulation.
Survey results
In the survey we’ve assessed the views of participating companies with regards to regulation. The
answers given to these questions – whether price and quality regulation would have a positive or
negative impact on the industry – are displayed below.
Figure 18 - Survey respondents views on quality and price regulation
The two arguments most often mentioned to implement quality regulation are first of all that it will
have a positive impact on the quality, safety and effectiveness for the patient and, secondly, that it
will prevent inferior, low-quality and sub-standard products from entering the market – whether these
products are manufactured locally or imported. It will create a level playing field because products can
be better compared with each other. Local manufacturers indicated that quality regulation is
inevitable for products produced in South Africa and will raise the bar for and bring South African
manufactures to the same level as developed countries. Lastly, quality regulation will protect the
industry’s reputation. Two concerns once quality regulation should come into effect is how this
would be enforced and also that assessments of products should be efficient, not costly and equal
for all participants. The five companies that answered that quality regulation would have a negative
impact on the industry indicated that they already spent a lot of time on regulatory requirements
instead of spending time on product development and sales. Other companies indicated there is no
need for quality regulation because they already use international regulation.
The picture looks entirely different when asked what the impact of price regulation on the industry
would be. 38 companies said it would have a negative impact and 9 companies said it would have a
positive impact. The main arguments against price regulations are based on the same reasoning: it
will put even more pressure on prices, margins will be pushed down and this would perhaps result in
bankruptcy for some companies and lower investments in innovation and R&D. Another argument
often mentioned is that it hampers competition and has a negative impact on South Africa as an
investment destination. Some say it is difficult to achieve because of the wide range of products
44 Position Paper – Recommended Principles of Medical Device Regulation for South Africa, SAMED, 2012.
45 Medical Device Regulations: Update and SAMED’s position, M. Pearce, 2011.
42
59
38
0
5
10
15
20
25
30
35
40
45
Quality regulation -positive impact
Quality regulation -negative impact
Price regulation -positive impact
Price regulation -negative impact
Num
ber
of re
spondennts
(to
tal =
47)
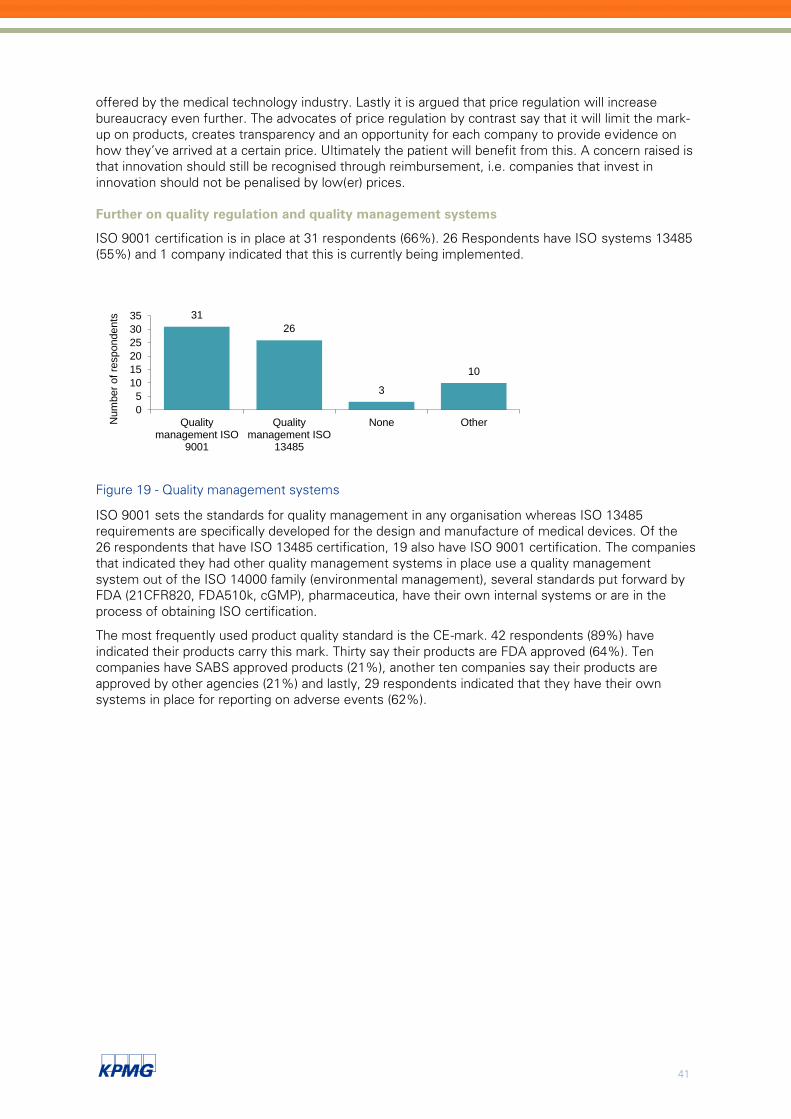
41
offered by the medical technology industry. Lastly it is argued that price regulation will increase
bureaucracy even further. The advocates of price regulation by contrast say that it will limit the mark-
up on products, creates transparency and an opportunity for each company to provide evidence on
how they’ve arrived at a certain price. Ultimately the patient will benefit from this. A concern raised is
that innovation should still be recognised through reimbursement, i.e. companies that invest in
innovation should not be penalised by low(er) prices.
Further on quality regulation and quality management systems
ISO 9001 certification is in place at 31 respondents (66%). 26 Respondents have ISO systems 13485
(55%) and 1 company indicated that this is currently being implemented.
Figure 19 - Quality management systems
ISO 9001 sets the standards for quality management in any organisation whereas ISO 13485
requirements are specifically developed for the design and manufacture of medical devices. Of the
26 respondents that have ISO 13485 certification, 19 also have ISO 9001 certification. The companies
that indicated they had other quality management systems in place use a quality management
system out of the ISO 14000 family (environmental management), several standards put forward by
FDA (21CFR820, FDA510k, cGMP), pharmaceutica, have their own internal systems or are in the
process of obtaining ISO certification.
The most frequently used product quality standard is the CE-mark. 42 respondents (89%) have
indicated their products carry this mark. Thirty say their products are FDA approved (64%). Ten
companies have SABS approved products (21%), another ten companies say their products are
approved by other agencies (21%) and lastly, 29 respondents indicated that they have their own
systems in place for reporting on adverse events (62%).
31
26
3
10
0
5
10
15
20
25
30
35
Qualitymanagement ISO
9001
Qualitymanagement ISO
13485
None OtherNum
ber
of re
spondents

42
Figure 20 - product quality standards
Other agencies that were mentioned who approved products were TUV, SGS – an international
inspection, verification, testing and certification company – and MCC. All companies that indicated
their products are FDA approved all carry the CE mark as well. 21 of these companies are
multinationals and 9 are local manufacturers.
4.3 A brief overview of the countries involved
Before going into more detail regarding medical device legislation and regulation in Brazil and
Australia, a short overview of the countries’ population, expenditure on healthcare, healthcare
indicators and health system are provided in the table below.
42
30
10 10
29
0
5
10
15
20
25
30
35
40
45
Our productshave a CE
Mark (Europeanstandards)
Our productsare Food and
DrugAdministration
(FDA)approved
Our productsare SABSapproved
Our productsare approved
by otheragencies
We havesystems inplace for
reporting ofadverseproducts
Num
ber
of re
spondents

43
South Africa Brazil Australia
Indicators
Population 51 189 307 198 656 019 22 683 600
Population 0 – 14 (% of total) 30% 25% 19%
Population 15 – 65 (% of total) 65% 68% 67%
Population 65 > (% of total) 5% 7% 14%
Health expenditure, total (% of
GDP)
8.7% 9% 9%
Health expenditure, private (%
of GDP)
4.6% 4.7% 2.8%
Health expenditure, public (% of
GDP)
4.1% 4.3% 6.2%
Hospital beds (per 1 000 people) 2.84 2.40 3.86
Life expectancy 55 73 82
Description of health system Please refer to
section 2.2 in this
report
Brazil runs a public health
system called Sistema Unico
de Saude (SUS). This NHS-
type system is funded by tax
revenues and aims to provide
universal coverage to the
population. The system has a
clear purchaser-provider split
which enables the purchaser
of healthcare (SUS) to buy
healthcare provision from both
public and private sector
providers.
Brazil has a large private
insurance sector that
reimburses private health care
providers using Fee For
Service arrangements. This is
considered to be a key driver
for medical technology in Brazil
as public sector’s focus has
been on reducing costs using
price regulation.
The health system in
Australia is primarily funded
by the public sector via
general taxation. There is a
compulsory public health
insurance scheme
(Medicare). Private
insurance is optional and
used to complement the
public system by offering a
choice of hospitals and
specialists. In 2011, 45% of
the population was covered
under private insurance.
Regulatory powers are
divided between Federal
and State governments.
Table 8 - Overview of health indicators South Africa, Brazil and Australia
Note: Totals may not add up to 100% due to rounding.
Note: Hospital beds per 1 000 – South Africa based on 2005 data.
Source: Worldbank data, years 2010 - 2013
4.4 Brazil46
Brazil has the largest medical technology market in Latin America. It is estimated to generate
revenues worth US $ 2.8 billion, roughly three times the size of the South African market. The
46 The following sources were used:
Medistat – Worldwide Medical Market Forecasts to 2015, Espicom, 2010.
Kennedy Information, 2011
Local Production and Technology Transfer to Increase Access to Medical Devices, WHO, 2012.
www.anviso.gov.br

44
industry consists of 448 manufacturers. The Brazilian industry predominantly serves the domestic
market as 91% of production goes towards filling local demand. This is further broken down, with
68% of sales to private sector clients and 21% of sales to public sector clients.
The import of medical technology products outweighs exports. Most import consists of high-tech
medical technology, although Philips and GE have opened their own manufacturing plants over the
past five years. What is further incentivising the import of medical technology is the fact that
hospitals and public institutions are tax-exempted for imported products compared to buying them
locally. Current laws exempt them from significant import taxes. Unfortunately for local
manufacturers, the tax benefits do not extend to products bought domestically, as sales tax is levied
over these products.
An important contributor to Brazil’s medical technology industry is the Mercosul trade agreement
with Argentina, Paraguay Uruguay and Venezuela. Mercosul promotes the free trade of goods,
people and currency between the member countries. Benefits established through this trade
agreement are; unified customs regulation, establishing trade agreements with other countries or
international entities like the EU, and the development of free-trade zones. These all create a
favourable business environment as import levies and tax payments are softened.
The market for medical technology shows strong growth with a compound annual growth rate of 9%.
The biggest drivers for growth in Brazil are:
■ Ongoing, large capital investments in the hospital industry, both public and private sector;
■ Brazil’s strong currency that resulted in greater purchasing power for both private and public
hospitals;
■ The growth of the private health insurance market, resulting in patients demanding the latest
technology, and;
■ The public sector’s upgrade of old and obsolete equipment.
The medical technology industry is regulated by the Agencia Nacional de Vigilancia Sanitaria
(ANVISA). ANVISA is an autonomous regulatory body working at arm’s length from the Ministry of
Health and was established in 1999. ANVISA also houses the office of the Ombudsman that conduct
investigations about complaints regarding medical technology products, amongst others. All product
manufacturers and importers must register their products with the ANVISA prior to selling products in
Brazil.
A similar risk categorisation as is used in the EU, applies to medical technology products in Brazil.
There are four risk categories that instruct the registration processes for products in Brazil. Both
products and company need to be registered before goods can be imported and/or sold in Brazil.
Approval times for medical devices tend to be long, with the low risk devices (class I and class II)
being registered within 10 months, and the high-risk devices (class III and class IV) being registered
within 30 months. This can even take longer, up to 36 months or more, if the company that imports
and/or produces the devices is not a member of ABIMED, the Brazilian Medical Device Association.
For companies to be registered in Brazil, ISO 13485 is strongly recommended as it can serve as
temporary proof of quality management system compliance while awaiting a Good Manufacturing
Practice (GMP) audit carried out by ANVISA. The Brazil Good Manufacturing Practice (BGMP)
complies with ISO 13485. Under the BGMP, ANVISA undertakes two-yearly audits of manufacturers
of class III and class IV devices. Registrations are valid for five years.
KPMG Life Sciences specialists from Brazilian KPMG firm.

45
4.5 Australia47
Australia’s medical technology market is estimated at US $ 4.5 billion, over four times the size of the
South African market. There are more than 600 medical technology companies in Australia employing
19 000 people. As is the case in other jurisdictions and in South Africa, companies tend to be
relatively small with 60% employing less than 20 people.
There are a few high-tech manufacturers in Australia, however, most locally manufactured products
are basic hospital supplies. This results in the Australian market being primarily supplied by imports
(estimated value US $ 4 billion), predominantly from the US. Contrary to what one may expect, 90%
of locally produced medical technology products are exported (estimated value US $ 1.7 billion) and
as such, the domestic medical device market does not supply the local market and one can say that
there is disconnect between local demand and supply. Most exported products go to the US, New
Zealand and the UK. Given this import-export gap there is net deficit of trade for the medical
technology sector. This doesn’t however slow down growth, as the market for medical technology
grows at a compound annual growth rate of 9%. The main reasons for this are:
■ Australia’s geographic position in the AsiaPacific region being close to the emerging markets in
Asia;
■ Rapid time-to-market approval processes;
■ A highly-skilled workforce. Over 50% working in the medical technology industry have a tertiary
qualification and 21% have a postgraduate qualification.
The Therapeutic Goods Administration (TGA), a division of the Australian Government Department of
Health and Ageing, is responsible for administering the Therapeutic Goods Act. As such it is
responsible for regulating medicines and medical devices ensuring that therapeutic goods in Australia
meet acceptable standards of quality, safety and efficacy. As is the case for Brazil’s ANVISA, TGA
executes an ombudsman function through investigating reports and complaints received from the
population, healthcare professionals and industry. The TGA regulates the medical technology industry
through:
■ Pre-market assessments, registration of medical devices through issuing a Certificate of Inclusion;
■ Post-market monitoring and enforcement of standards;
■ Licensing of Australian manufacturers and verifying overseas manufacturers’ compliance with the
same standards as their Australian counterparts; and,
■ Issuing a Conformity Assessment Certificate for manufacturers. Their quality management
systems must comply with a recognised QMS standard like ISO or any other Good Manufacturing
Practice (GMP).
Before a medical device is released to be sold on the market, the TGA is involved. Medical devices
must be registered in the Australian Register of Therapeutic Goods (ARTG), managed by the TGA,
47 The following sources were used:
Medistat – Worldwide Medical Market Forecasts to 2015, Espicom, 2010.
Kennedy Information, 2011
http://www.tga.gov.au/
Australian Regulatory Guidelines for Medical Devices (ARGMD), TGA, 2011.
Guidance on licencing/certification inspections, TGA, 2013.
Medical and Scientific Equipment Wholesaling in Australia, www.ibisworld.com.au, 2013.
Medical Technology: Key facts and figures 2013, Medical Technology Association of Australia, 2013.
Review of Health Technology Assessment in Australia, December 2009.
KPMG Life Sciences specialists from Australian KPMG firm.

46
before they can be sold in, or exported from, Australia. The level of regulatory control increases with
the level of risk the medical device can pose. The TGA can conduct assessments and/or inspections
before a device is supplied to the Australian market and when a medical device is available on the
market. TGA registers products that have a CE mark and uses the Global Medical Device
Nomenclature codes to categorise the registered medical devices. Those medical devices that fall
into the high-risk category are subject to an application audit carried out by the TGA, however TGA
reserves to right to conduct these audits on low-risk products as well. Registrations, rather
Certificates of Inclusion, do not expire unless changes to products or its intended use, are made. An
annual ARTG listing fee must be paid and when applying for a Certificate of Inclusion an application
fee must be paid. This allows the TGA to work on a full cost-recovery basis. Registration throughput
times are 3 months for low-risk products, those not subject to inspection and up to 14 months for
high-risk products. Registration submission are submitted electronically. To minimalize the
administrative burden on manufactures, the TGA negotiates agreements with international regulatory
bodies for medical devices.
Medical device standards are developed by Standards Australia48
. Regulation is performance based
rather than based on physical specifications so that advances in technology can be incorporated
without the need for regulatory change. Standards apply to locally-produced devices only, however
the majority of imports come from countries in which similar codes apply.
Where quality regulation sits with TGA, the power to approve reimbursement of medical devices is
managed through the Pharmaceutical Benefits Scheme (PBS) another organisation residing under the
wings of the Australian Department of Health. The PBS base their assessment on health economics
analysis and therapy trends. Once a product is approved and thus funded it is available for the
Australian population through public funding. If a product is not approved by PBS but is registered in
the ARTG, the product can also be made available and may be funded through private medical aid or
be paid for out-of-pocket.
4.6 Lessons learnt
Although no country is the same, there are a few similarities to be seen between South Africa, Brazil
and Australia. All three health systems comprise a public sector and relatively large private sector and
import of medical technology products exceeds export.
There are several features from the Brazilian and Australian regulatory systems that could be
beneficial for the South African medical technology market. The lessons we’ve identified are:
■ The quality of medical technology products is ensured through a regulatory authority. In Brazil, this
authority, ANVISA, functions at arm’s length of the Ministry of Health, whereas in Australia TGA is
part of it.
– Registration: Manufacturers of medical devices and medical technology products themselves
are registered in national databases in both Brazil and Argentina. In both instances this is done
to protect an influx of substandard quality products that could harm patients. It also creates a
level playing field between products manufactured locally and imported products. There is
however one important aspect that comes with regulation and that is enforcement of
regulation. There have been cases in Brazil that non-registered products were used in
healthcare provider settings and, in these cases, has left ANVISA in an uncomfortable position.
What can be learnt from the Australian approach is that regular audits should be conducted.
Ultimately a regulator could have the power to withdraw products from the market.
– Not more bureaucracy. When establishing a regulatory authority there is a risk of increasing
the level of bureaucracy. Australia has sought to minimize this through the implementation of
regulation that is closely linked and follows international regulation thus seeking to limit the
administrative burden for medical technology companies to get their product registered in the
country.
48 Standards Australia is responsible for developing Australian standards for different industries. They can be compared with
the South African Bureau of Standards (SABS).

47
– Financing: SAHPRA is foreseen to be established as a 3A public entity under the Public
Finance Management Act (PFMA). Such an entity is responsible for raising its own budget,
either through grants from National Treasury or through raising its own funds, for example
through levying inspection and registration fees. An attractive cost-neutral option for
government would be to opt for the Australian approach where applicants for new medical
technology pay a fee for registration and an annual listing fee.
– Ombudsman: In both Brazil and Australia, the regulator also executes the role of ombudsman.
This entails the collection, and if required, the investigation of complaints. Having such a
function built into a regulator’s mandate will enable a regulator to detect misconduct and take
action against it.
■ The establishment of a free trade zone, like the Mercosul trade agreement Brazil forms part of,
could create incentives that promote export. Australia is considered to benefit from its
geographical position to Asia and, slightly further away, the West-Coast of the US. From both
countries South Africa can draw important lessons as South Africa is already known for its
established position in the southern African region, acting as a business hub for surrounding
countries and beyond. Leveraging off existing collaborations such as the SADC could help ease
export restrictions for South Africa, but more importantly potentially relax levied import duties in
those countries South Africa exports to, thus creating the opportunity to grow the medical
technology market.
■ Australia’s medical technology has prospered because of the highly educated population. As we
mentioned above, over 50% working in the medical technology industry have a tertiary
qualification and 21% have a postgraduate qualification. Australia exports 90% of its locally
manufactured medical devices.

48
5 Conclusion
Conclusion
5
49
5.1 Three key takeaways
There is no doubt about the value that the medical technology industry contributes to a country, such
as South Africa. Medical technology products helps people live healthier and longer lives and are an
indispensable necessity to any health system. This document describes the impact that the medical
technology industry in South Africa, estimated to be worth R 10 billion, has on the country’s GDP,
employment, tax revenues and the National Development Plan. The medical technology industry
employs more than 3 600 people and comprises of a combination of both multi-national and local
manufacturer companies. Most revenues are generated in the IVD (In Vitro Diagnostic), implants and
surgical devices product ranges. The volume of imported products far exceed the volume of exported
products, similar to the trends observed in the two benchmarking countries, Brazil and Australia, that
are also discussed in this report. Medical technology companies generate most of its revenues from
sales to clients in the private sector (70%) and the remainder (30%) of revenues is generated from
sales to clients in the public sector.
The survey that was conducted amongst SAMED and SALDA members, highlighted concerns raised
with regard to regulation – or the lack thereof – and the industry’s investment in R&D.
Based on the concerns expressed by SAMED and SALDA members and incorporating the lessons
from the two benchmarking countries Brazil and Australia, we have identified three key takeaways for
consideration:
Continue the drive for quality regulation
The majority of SAMED and SALDA members (90%) have expressed strong support for regulating
the quality of medical technology products. The implementation of medical technology regulations
will prevent inferior quality products from entering the market and it will have a positive effect on the
medical technology industry’s reputation. A regulated environment can furthermore act as a catalyst
for growth of the local manufacturing industry, as regulated environment creates more transparency
and a level playing field between companies that import products and companies that manufacture
products locally. Important lessons in this regard, can be learnt from Brazil and Australia. Both
countries have established a regulatory body that works at arm’s length from government (Brazil) and
is self-funded (Australia). A compelling argument to put forward to government is that regulating the
quality of medical technology products, does not per se have to incur a huge financial investment by
government. SAMED, as the medical technology industry organisation, has an important role to play
when moving toward a regulated industry. This would address concerns raised by members stating
that more regulation will result in bureaucracy and incur more costs. The impact of regulating quality
on administrative processes, can be minimised by learning from the Australian approach, where local
regulation is, where possible, aligned with global categorisation (GMDN) and regulation (all products
carry a CE-mark). In conclusion, establishing a quality regulatory authority that can solely focus on
quality, will shift power away from medical schemes to government. Medical schemes currently
exercise extensive influence on the usage of medical technology products in the market by approving
medical technology products for reimbursement.
Use existing innovation-platforms and incentivise industry to grow
Research & Development (R&D) investments
SAMED members expressed serious concerns about the low level of R&D activity and investment in
the country. The main reasons provided were the limited number of local manufacturers,
multinationals conducting their R&D abroad and lastly, the more attractive business environments in
other (African) countries. Members also raised concern that funds secured for R&D purposes were
insufficient. Several platforms containing funds earmarked for ‘innovation’ already exist. An example
of such a platform is the Strategic Health Innovation Partnership (SHIP) under the banner of the MRC
and DST. There already exists some collaborative efforts between medical technology firms and

50
universities. This is a cautious first step to bridge the gap between the academia and industry and a
prerequisite for innovation and R&D, in the long-term.
Based on the outcomes of the survey and taking the above-mentioned into consideration, we would
like to make the following comments:
■ Firstly, that a significant amount of respondents are not always (fully) aware of the existing
platforms that contain funds for innovation and R&D. Having said that, these innovation and R&D
platforms also struggle to push and release the funds they manage towards the market. The
conclusion is that it is clearly worth exploring bringing these parties together. The ideal would be
to leverage off existing structures and relationships, for example the existing relationships with
universities.
■ Secondly, and in line with the argument posed above, serious consideration should be given on
ways to create direct incentives that will positively stimulate R&D spend at a company level in the
country. Examples of incentives could be tax rebates or government subsidies.
R&D could further strengthen South Africa’s position as the business hub for the rest of (Southern)
Africa in the long term. Government should consider following the example of Brazil, securing free-
trade zones with neighbouring countries that include the import and export of medical technology
products. Another lesson from pharmaceutical multinationals is the inclusion of South Africa in clinical
trial research design.
Unite, collaborate and share insights
Combining the first two suggestions above, we suggest that an encompassing consideration for
SAMED is to indeed continuously involve, inform and collaborate with stakeholders. The information
presented in this document can help create more awareness of the importance and economic
footprint of the industry in South Africa. Internationally, innovation is considered an important means
of bridging the gap for government and businesses collaboration. SAMED has a crucial role to play to
activate its members in sharing their knowledge and experience in the field of R&D. In conclusion,
SAMED should play an active role throughout the establishment of SAHPRA and, once established, in
helping SAHPRA operate effectively.
5.2 Closing remarks
When considering the above three factors SAMED could make an even bigger impact on the
population’s health and the economy – specifically GDP, tax and the support of job creation – and in
this way contribute to the NDP and NHI. This report contributes to better understanding the industry,
its national impact and understanding your members’ views on topics like regulation, R&D and
quality. We’re keen for this report to form part of a longer term series of market monitoring that
continuously seeks to demonstrate the value the medical technology industry brings to South Africa.
51
Ppendices
Appendices

52
Appendix 1 Background information on National Health Insurance
(NHI)
National Health Insurance policy – the August 2011 Green Paper
In August 2011 the Government published a policy paper (commonly referred to as the Green Paper)
setting out proposals for National Health Insurance in South Africa. The policy intentions described in
this policy paper included structural financing reforms intended to make public healthcare available
freely to the whole population (rather than as a system based on means-tested co-payment) as well
as far more operational reforms designed to improve service delivery in the public health systems
institutions.
The Green Paper has had the effect of creating a focal point for the national debate around quality in,
and access to, the public health system. In the short term, the debate was focused on the cost of
National Health Insurance, particularly in light of the fact that NHI will require an increase in taxation,
with this increase likely to be felt most by the income tax-paying portion of the population, many of
whom do not use public-sector healthcare.
Delivering National Health Insurance – piloting and implementation
More recently, however, the debate around National Health Insurance has shifted away from
affordability and has focused on the Government’s ability to achieve the service delivery changes
described in the Green Paper. There are pilots underway in 10 pilot Districts, in which selected
policies associated with NHI are being piloted. There is some variation in the policies being piloted
but the new focus on primary care is being piloted in all sites. The results of these pilots will inform
the debate around the ability of Provincial and District health authorities to deliver the significant
service improvements associated with NHI policies.
The NHI Green Paper included a large number of proposed reforms, to be implemented gradually
over the course of a 15 year timeframe. Below is a short summary of some of the key policy
proposals. The Ministerial Advisory Committee is currently working on a White Paper, which should
provide more detail on the implementation plans for some, if not all, NHI policies. However, details of
the planned release of this White Paper remain unclear.
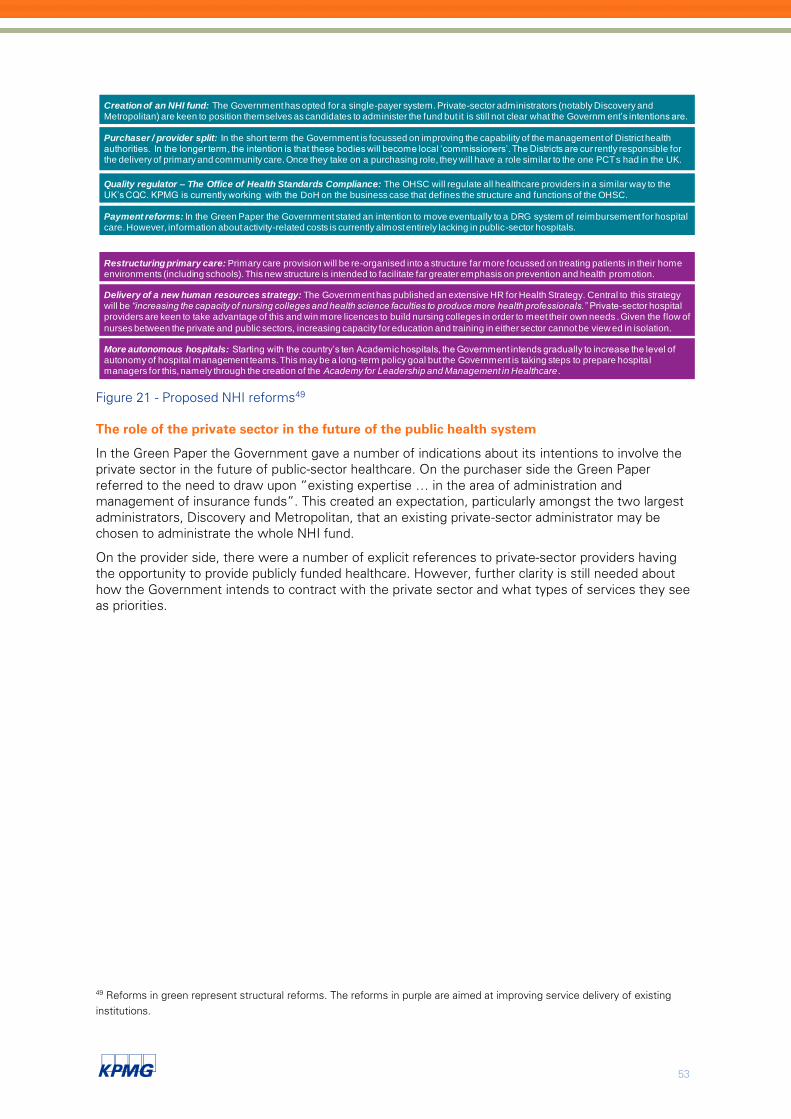
53
Figure 21 - Proposed NHI reforms49
The role of the private sector in the future of the public health system
In the Green Paper the Government gave a number of indications about its intentions to involve the
private sector in the future of public-sector healthcare. On the purchaser side the Green Paper
referred to the need to draw upon “existing expertise … in the area of administration and
management of insurance funds”. This created an expectation, particularly amongst the two largest
administrators, Discovery and Metropolitan, that an existing private-sector administrator may be
chosen to administrate the whole NHI fund.
On the provider side, there were a number of explicit references to private-sector providers having
the opportunity to provide publicly funded healthcare. However, further clarity is still needed about
how the Government intends to contract with the private sector and what types of services they see
as priorities.
49 Reforms in green represent structural reforms. The reforms in purple are aimed at improving service delivery of existing
institutions.
Creation of an NHI fund: The Government has opted for a single-payer system. Private-sector administrators (notably Discovery and Metropolitan) are keen to position themselves as candidates to administer the fund but it is still not clear what the Governm ent’s intentions are.
Purchaser / provider split: In the short term the Government is focussed on improving the capability of the management of District health authorities. In the longer term, the intention is that these bodies will become local ‘commissioners’. The Districts are cur rently responsible for the delivery of primary and community care. Once they take on a purchasing role, they will have a role similar to the one PCTs had in the UK.
Restructuring primary care: Primary care provision will be re-organised into a structure far more focussed on treating patients in their home environments (including schools). This new structure is intended to facilitate far greater emphasis on prevention and health promotion.
Delivery of a new human resources strategy: The Government has published an extensive HR for Health Strategy. Central to this strategy will be “increasing the capacity of nursing colleges and health science faculties to produce more health professionals.” Private-sector hospital providers are keen to take advantage of this and win more licences to build nursing colleges in order to meet their own needs . Given the flow of
nurses between the private and public sectors, increasing capacity for education and training in either sector cannot be view ed in isolation.
More autonomous hospitals: Starting with the country’s ten Academic hospitals, the Government intends gradually to increase the level of autonomy of hospital management teams. This may be a long-term policy goal but the Government is taking steps to prepare hospita l managers for this, namely through the creation of the Academy for Leadership and Management in Healthcare.
Quality regulator – The Office of Health Standards Compliance: The OHSC will regulate all healthcare providers in a similar way to the UK’s CQC. KPMG is currently working with the DoH on the business case that defines the structure and functions of the OHSC.
Payment reforms: In the Green Paper the Government stated an intention to move eventually to a DRG system of reimbursement for hospital care. However, information about activity-related costs is currently almost entirely lacking in public-sector hospitals.
54
Appendix 2 Survey
SAMED SURVEY
Start Survey
ECONOMIC IMPACT ASSESSMENT AND INDUSTRY OVERVIEW REPORT FOR THE
MEDICAL DEVICES INDUSTRY IN SOUTH AFRICA
Instruction to SAMED survey
IntroductionThe South African Medical Devices Industry Association (SAMED) has commissioned KPMG Services (Pty) Ltd to undertake an economicimpact assessment and industry overview report for the medical devices industry in South Africa. This initiative forms part of SAMED’s continued engagement with government around the future and growth of this industry in South Africa. The report produced by KPMG is intended to provide insights into the size, the economic impact of our market and the value we bring to South Africa’s people. It will provide an important basis to illustrate to government how further incentives, investments and support for the industry might benefit the country as a whole.Additionally, it will provide insights into the industry, in terms of understanding of the importance of the industry for the South African economy as a whole as well as for the health care sector.
Your support is neededIn order to gather accurate and up to date information for the report, SAMED requests your cooperation in completing this industry survey prepared by KPMG. We will appreciate it if you could complete the survey before 4 November 2013. Please note that individual company responses will be treated as confidential and no company information will be disclosed on an individual basis.
Confidentiality of informationKPMG shall respect the confidentiality of information acquired in the course of providing professional services and shall use such information only for authorised purposes. KPMG further confirms that they will restrict the dissemination of the confidential information to only those of their personnel, advisors, agents and consultants who are actively involved in providing services. The following processes will be followed to ensure confidentiality of information:- All received information will be aggregated to such an extent it cannot be identified and traced back to individual companies . - SAMED members are allowed to password protect their spreadsheets when sending the information to KPMG, this password should b e provided via e-mail to KPMG’s contact person in order to access the information.- In addition, KPMG has attached a blank Non Disclosure Agreement (NDA) to the survey, which will be signed and return within 24 hours if required by any of the SAMED members.
Approval of survey contentBy submitting the survey we assume that the information provided, fairly represents the current position of the company and has been approved as such by senior management.
ClosureWe would like to thank you in advance for participating in this survey as it will help SAMED,to raise awareness with its stakeholders in terms of your contribution to South Africa and the healthcare industry in particular. Should you require any assistance with the survey, please do not hesitate to contact the following people.
Thank you for your time.
Lullu Krugel (KPMG) 082 708 [email protected]
Tanya Vogt (SAMED) (011) 704 2440083 6010343
Confidentiality disclaimerKPMG shall respect the confidentiality of information acquired in the course of providing professional services and shall use such information only for authorised purposes. KPMG further confirms that they will restrict the dissemination of the confidential information to only those of their personnel, advisors, agents and consultants who are actively involved in providing services.
Limitation of ScopeThe data collection will not be performed by KPMG in the capacity of a Registered Auditor and the engagement does not constitute an audit or review, other assurance
engagement or an agreed-upon procedures engagement, performed in accordance with International Standards on Auditing (IASs), International Standards on Review Engagements (ISREs), International Standards on Assurance Engagements (ISAEs) or International Standards on Engagements to perform Agreed-upon Procedures regarding Financial Information.
Accordingly, these services will not result in the issue of a written report by KPMG directly expressing any form of assurance.
© 2013 KPMG Services Proprietary Limited, a South African company and a member firm of the KPMG network of independent member firms affiliated with KPMG International, a Swiss

55
The period under review refers to the last financial year for which you have audited financial statements available.
1.1
Please click on the following link for definitions
relating to question 1.1
Please Click
Here
TickNumber of factories/locations in South
Africa
Manufacturer
Only importer of products for already packaged goods
Only importer of products packaged in South Africa
All three of the above
Only two of the above, please specify.
1.1.1
Please click on the following link for definitions
relating to question 1.1.1
Please Click
Here
SAMED SURVEY
ECONOMIC IMPACT ASSESSMENT AND INDUSTRY OVERVIEW REPORT FOR THE MEDICAL DEVICES INDUSTRY IN SOUTH AFRICA
1. Company profile
Please take note of the following:
Should your company operate within the medical device and pharmaceutical industry only information pertaining operations of medical
device business should be reported on.
Please indicate what percentage of your company's revenue is derived from locally manufactured products? Please note that this question is only applicable to companies that
manufacture in South Africa.
Which of the below options best describes your company? Please tick the relevant box with a 'x' and indicate the number of factories/locations in South Africa

56
1.2
Percentage of
total revenue
Percentage of
total revenue
Wound care - Traditional wound care Non Surgical Devices - Medical laser devices
Wound care - Advanced wound care Non Surgical Devices - Pain-management devices
Wound care - Other wound care Non Surgical Devices - Operating room devices
Implants - Orthopedic implants Non Surgical Devices - Physiotherapy devices
Implants - Dental implants Non Surgical Devices - Other devices
Implants - Cardiac implants Active medical devices
Implants - Hearing implants Other non-invasive devices (toothbrushes, tongue
depressors etc)
Implants - Other implants Contraceptive Devices
Surgical Devices - Electrosurgical devices Disinfecting Devices
Surgical Devices - Hand instruments Devices containing Animal Tissue
Surgical Devices - Closure devices Image Devices (x-rays, scans)
Surgical Devices - Other devices IVD
Non Surgical Devices - Cosmetic/Aesthetic
devices
Other (list product categories)
Non Surgical Devices - Non-invasive/minimally
invasive devices
Which of the following best describes the categories of products your company supplies? Please feel free to select more than one option below. Please provide us with the product categories
percenatge of total revenue..

57
1.3 What class of Medical Devices does your company manufacture?
Please click on the following link for definitions
of the below mentioned Medical Device classes
Please click
here
Class Level Device Examples Percentage of
revenue
A Low Hazard Bandages / tongue depressers Hospital beds,
splints, stethoscope, syringes without needles,
handheld mirrors, impression trays, Enema
devices, reusable scalpels, forceps, wheelchairs,
patient chairs, corrective glasses and frames,
Incision drapes, Conductive gels, non-invasive
electrodes, etc
B Low Moderate Hypodermic needles / suction equipment
Tracheal tubes, orthodontic wires, needles for
suturing, suckers, staplers, spinal needles, clamps,
bridges and crowns, muscle stimulators,
Cryosurgery equipment, powered drills, hearing
aids, ultrasound, etc
Hypodermic needles / suction equipment
Tracheal tubes, orthodontic wires, needles for
suturing, suckers, staplers, spinal needles, clamps,
bridges and crowns, muscle stimulators,
Cryosurgery equipment, powered drills, hearing
aids, ultrasound, etc
C Moderate High
Hazard
Lung ventilator / bone fixation plate
Bloodbags, urethral stents, insulin pens,
ligaments, nails and plates, internal closure
devices, shunts, lung ventilators, warming
blankets, blood warmers, surgical lasers, suction
equipment, etc
D High Hazard Heart valves / implantable defrib
Cardiovascular catheters, Neurological catheters,
Cortical Electrodes, cardiac output probes,
biological adhesives, spinal stents, intra-aortic
balloon pumps, absorbable sutures, bioactive
implants (surface coatings), breast implants,
infusion pumps, etc.
Please Note: The examples of medical devices provided in the above Figure are for illustration only and a manufacturer/seller of such a
device should not rely on it appearing as an example but should instead make an independent decision on classification taking account
of its particular design and intended use.

58
1.4
Percentage of revenue
Eastern Cape
Free State
Gauteng
Kwa-Zulu Natal
Limpopo
Mpumalanga
Northern Cape
North West
Western Cape
1.5 How long has your company been operating within South Africa?
1.6
1.7
1.8
Percentage (%)
Africa
Other ( Please specify)
In which South African provinces do you operate?
If you operate in more than one province, please enter estimated percentages for the applicable options.
What percentage of your company's products are exported? This should be based on the percentage of your company's total revenue.
If you export products, are they exported to Africa or elsewhere in the world? Please feel free to choose more than one answer and indicate the percentage of exports per
region based on the share of total revenue.
What percentage of your company's products are imported? This should be based on the percentage of your company's total revenue.
Previous page Next page

59
The period under review refers to the last financial year for which you have provided an Employment Equity Report.
2.1
Please click on the following link for definitions relating to question 2.1 Please Click Here
Employees / Year African Male
Coloured
Male
Indian
Male
White
Male
African
Female
Coloured
Female
Indian
Female
White
Female Male Female Total
Top Management
Senior Management
Professionally qualified and experienced specialists and mid-
management
Skilled technical and academically qualified workers, junior
management, supervisors, foremen and superintendents
Semi-skilled and discretionary decision makers
Unskilled and defined decision makers
Total permanent
Temporary employees
Grand Total
ECONOMIC IMPACT ASSESSMENT AND INDUSTRY OVERVIEW REPORT FOR THE MEDICAL DEVICES INDUSTRY IN
SOUTH AFRICA
Should your company operate within the medical device and pharmaceutical industry only information pertaining
operations of medical device business should be reported on.
SAMED SURVEY
2. Labour and skills
How many employees in the following categories are currently employed in your South African based company?
Please note: you can use your latest Employment Equity Report to fill out this table.
Foreign Nationals
Employment by designation and race
Please take note of the following:
2.2
Training Rand Value spent
Continuing Medical Education (CME ) training for doctors in private
sector
Continuing Medical Education (CME) training for allied health
professionals in the private sector
Continuing Medical Education (CME) training for doctors in public sector
Continuing Medical Education (CME) training for allied health
professionals in the public sector
Other (specify)
Previous page Next page
How much does your company spend annually on the following categories of training?
Please provide the total amount spent per training category in the last audited financial year end.

60
SAMED SURVEY
The period under review refers to the last financial year for which you have audited financial statements available
3.1
Please click on the following link for definitions relating
to question 3.1
Please Click
Here
3.2
Please click on the following link for definitions relating
to question 3.2
Please Click
Here
2012/13
Salaries and wages
Taxes (e.g. company tax, land tax, import duties)
Rental and levies
Depreciation
Financing costs
Research and Development (R&D)
All other operational expenditure
Total operational expenditure R 0.00
3.3
3.4
Please click on the following link for definitions relating
to question 3.4
Please Click
Here
3.5
3.6 What is the Rand value spent on sponsorship in the last audited financial year?
Please click on the following link for definitions relating
to question 3.6
Please Click
Here
What was your company's capital expenditure in the last audited financial year?
Previous page Next page
3. Revenue and expenses
What was your company's total revenue in the last audited financial year?
What percentage of your company's total capital expenditure, related to South African operations, is paid
to product and/or service providers outside of South Africa?
For example: if you bought machinery or equipment from a company outside of South Africa
ECONOMIC IMPACT ASSESSMENT AND INDUSTRY OVERVIEW REPORT FOR THE MEDICAL DEVICES
INDUSTRY IN SOUTH AFRICA
What percentage of your company's total operational expenditure, related to South African operations,
is paid to product and/or service providers outside of South Africa?
For example: if your IT services are provided by a company outside of South Africa.
What were your company's operational expenses - broken down in the following categories?
Please take note of the following:
Total operational expenditure
Should your company operate within the medical device and pharmaceutical industry only information
pertaining operations of medical device business should be reported on.

61
4.1
BBBEE level 1 contributor
BBBEE level 2 contributor
BBBEE level 3 contributor
BBBEE level 4 contributor
BBBEE level 5 contributor
BBBEE level 6 contributor
BBBEE level 7 contributor
BBBEE level 8 contributor
Non compliant
4.2 Do you expect an improvement in your current BBBEE rating in next financial year?
Yes
No
Reason
4. BEE ratings
SAMED SURVEY
ECONOMIC IMPACT ASSESSMENT AND INDUSTRY OVERVIEW REPORT FOR THE MEDICAL DEVICES
INDUSTRY IN SOUTH AFRICA
Previous page Next page
What is your company's current BBBEE status, as awarded by an accredited rating agency? Please select the appropriate option by ticking the box with an 'x'.
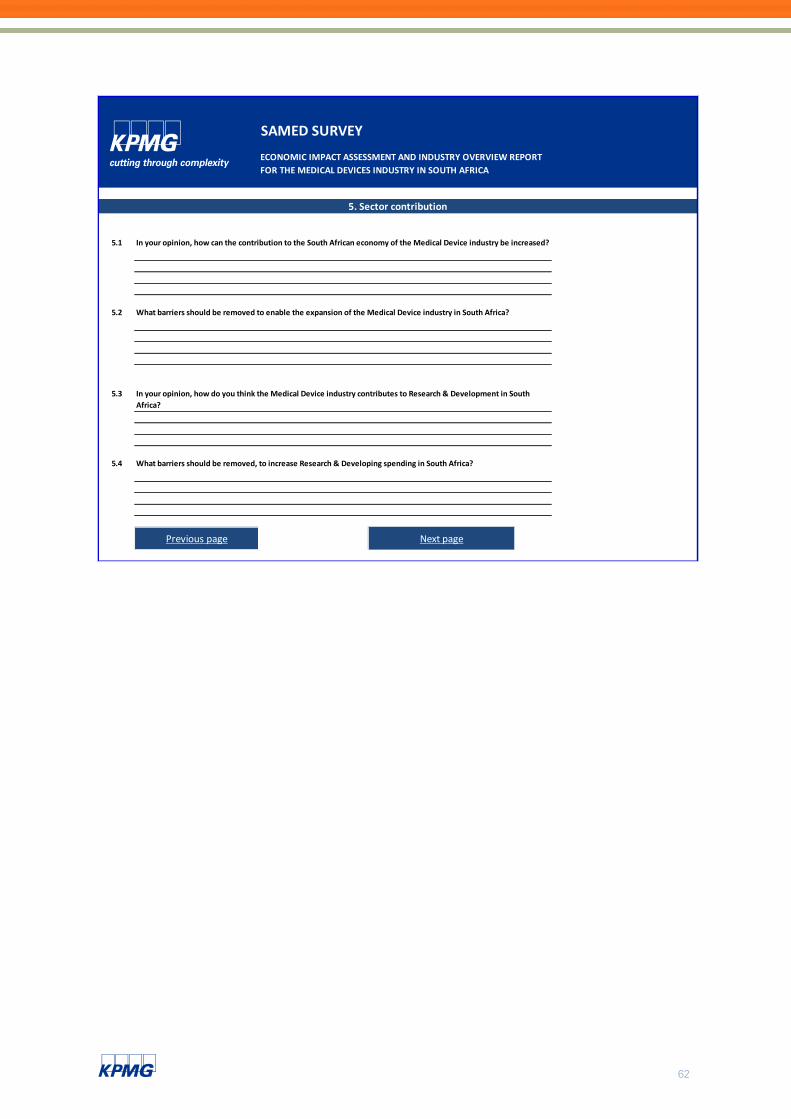
62
5.1
5.2
5.3
5.4
Previous page Next page
5. Sector contribution
SAMED SURVEY
ECONOMIC IMPACT ASSESSMENT AND INDUSTRY OVERVIEW REPORT
FOR THE MEDICAL DEVICES INDUSTRY IN SOUTH AFRICA
In your opinion, how can the contribution to the South African economy of the Medical Device industry be increased?
In your opinion, how do you think the Medical Device industry contributes to Research & Development in South
Africa?
What barriers should be removed to enable the expansion of the Medical Device industry in South Africa?
What barriers should be removed, to increase Research & Developing spending in South Africa?

63
6.1
Positive impact
Negative impact
Reason
6.2
Positive impact
Negative impact
Reason
6.3
x
We have quality management ISO 9001
We have quality management ISO 13485
None
Other ( please specify)
6.4
x
Our products have a CE Mark ( European
standards)
Our products are Food and Drug
Administration (FDA) approved
Our products are SABS approved
Our products are approved by other agencies
(please specify)
We have systems in place for reporting of
adverse products
Previous page Next page
What quality management standards has your company adopted?
Please tick the relevant boxes with an 'x'.
Quality management standards
What would the impact of price regulation on the industry be?
Please select the appropriate box below and provide a reason for your answer.
What product quality standards has your company adopted?
Please tick the relevant boxes with an 'x'.
Quality management standards
What would the impact of quality regulation on the industry be?
Please select the appropriate box below and provide a reason for your answer.
SAMED SURVEY
ECONOMIC IMPACT ASSESSMENT AND INDUSTRY OVERVIEW REPORT FOR THE MEDICAL DEVICES INDUSTRY IN
SOUTH AFRICA
6. Regulations

64
SAMED SURVEY
ECONOMIC IMPACT ASSESSMENT AND INDUSTRY OVERVIEW REPORT FOR THE MEDICAL DEVICES
INDUSTRY IN SOUTH AFRICA
Previous page
ConclusionThank you for taking the time to complete this questionnaire. Your input is appreciated and will be treated with the utmost confidentiality.
Please email the completed survey to:
Approval of survey content
By submitting the survey we assume that the information provided fairly represents the current position of the company and has
been approved as such by senior management.

65
Appendix 3 Theory and application of macroeconomic impact
assessments
In order to estimate the direct and indirect impact of the capital and operational expenditure of the
medical devices, calculations using a First Generation Economic Impact Assessment (EIA) model,
based on a Social Accounting Matrix (SAM), were undertaken. An Input-Output table is a simplified
version of a SAM, but the same principles apply. The 2011 IHS Global Insight Input-Output table for
South African economy and the Mpumalanga province was used. This Input-Output table is in 2011
prices.
A SAM is a set of accounts written in a matrix format. These accounts map the flows in an economy,
where entries in the rows represent the inflow of funds, while entries in the columns represent the
outflow of funds that occurred during a specific period, usually a year. Accounts traditionally found in a
SAM include activities; commodities; trade margins; households; firms; Government; labour; capital;
the rest of the world and savings and investment.
Social Accounting Matrices are useful tools due to the fact that:
■ they provide a framework for organising information about economic and social structures of a
particular country, province or region, for a period of a year; and
■ a SAM has a distributional element that shows how a certain change in the economy will affect
not only production and output but also income distribution of the households (consumers).
By utilizing a SAM, the economy wide impact (in this case the impact on the National economy) of a
particular change on the different sectors of the economy at a particular time can be assessed. There
are both direct and indirect effects on the economy, and the SAM is equipped to measure these
effects.
SAMs are developed from input-output tables. Input-output tables depict the supply and use of
resources between industries. The earliest modelling using input-output tables can be attributed to
Leontief (1941). The basic assumption that Leontief made was that to produce a unit of output a fixed
proportion of inputs is required. The assumption imposes linearity in terms of inputs and outputs. A
10% increase in demand of output will require a 10% increase in the fixed proportion of inputs. In
order to assess the direct and indirect effects of small changes on the sectors of the economy, the
Leontief inverse (a matrix of multipliers), is applied.
A column in the Leontief Inverse produces a vector showing the total increase in gross output required
to meet a one unit rise in final demand for a specific sector. The table below shows the mathematical
determination of the Leontief inverse matrix.

66
Note: I = the Identity Matrix and (I-B)-1is the Leontief Inverse Matrix
Figure 22: Determining the Leontief inverse matrix
The Leontief input-output tables have a shortfall in that they do not include institutions (household and
government) and therefore do not show the distributional impacts of changes in the economy. This is
where the SAM becomes useful. SAMs include households and government to show the distributional
element in the economy. The direct and indirect economic impact of changes on the incomes of
households can be established in this way. Modelling the economic impact of changes in the economy
using a SAM, still applies the Leontief approach of linearity and the Leontief inverse.
Figure 23: Flow of income as represented by a SAM
The entries in the rows of a SAM represent the inflow of funds (or supply), while entries in the columns
represent the outflow of funds (or use) occurring during a specific period, usually a year. Accounts
traditionally found in a SAM include, activities; commodities; trade margins; households; firms;
government; labour; capital; and the rest of the world.
A SAM is generally used in monitoring the impact of government policies and/or external influences on
non-monetary variables such as employment levels, skills development and demographic changes.
SAMs represent the economy at a point in time. However, the structure of the economy only changes
every 5-10 years, so using the 2008 SAM, as we do in this analysis, is still viable and an accepted
practice. The relationship between sectors is shown in the diagram below.
Labour Capital Households Government
Rest of the
World
Total
Agriculture Mining Agriculture Mining
Agriculture Final Output
Mining
Agriculture Intermediate output Final demand Gov demand Exports
Mining
Labour wages
Capital Rent
Households Wages Rent
Government Tax Tax Tax Tax
Rest of the
World
Imports
Total
Activities Commodities
Activ
itie
sC
om
mo
ditie
s
OtherHHAgricManuf
h23Yh
h13Yh
Final Demand
Yhh32X2h31X1Payments to HH
X2F2a22X2a21X1Agric
X1F1a12X2a11X1Manuf
Gross
Output
Intermediate
Demand
OtherHHAgricManuf
h23Yh
h13Yh
Final Demand
Yhh32X2h31X1Payments to HH
X2F2a22X2a21X1Agric
X1F1a12X2a11X1Manuf
Gross
Output
Intermediate
Demand
BX F X 1( )I B F X
B
11 12 13 1 1 1
21 22 23 2 2 2
31 2 0 0h h
a a h X F X
a a h X F X
h h Y Y

67
Figure 24: Determining the relationship between sectors in the SAM
From the figure below, one can assess the impact of expenditure within the transport and business
services sector. The direct impact is the first round effect that changes sector production. The indirect
impact is the second round effect that changes the demand for the factors of production and household
income. The induced impact includes that changes that result from the change in household income
that we cannot control from a modelling perspective, i.e. changes in government expenditure and the
rest of the world. We can generate results that look specifically at the impact on GDP, employment
and relative sector contributions.
Figure 25: The multiplier effect
Using the data gathered at the start of the project the economic impact of the South African Medical
Devices construction and operational phases were estimated using a SAM-based EIA for the South
African economy.
The SAM will enable analysis in respect of the following areas:
■ The change in GDP;
■ The change in employment; and
■ The change in tax revenue.
MODEL
Financial, Real
Estate & Business
Services
Construction
Wholesale & Retail
Trade
Social, Personal &
Community
Services
Transport, Storage
& Communication
Electricity, Gas &
Water
Mining &
Quarrying
Agriculture,
Forestry & Fishing
Manufacturing
*Figures in R Million
Multiplier Effect
Disclaimer
© 2014 KPMG Services Proprietary Limited, a South African company and a member firm of the KPMG
network of independent member firms affiliated with KPMG International, a Swiss cooperative. All rights
reserved. Printed in South Africa.