Embed Size (px)
Citation preview
Preparing Australia’s future oil and gas workforce THREE SCENARIOS FOR WORKFORCE CHANGE

Registered office:Australian Resources Research Centre Level 3, 26 Dick Perry Avenue Kensington WA 6151
ABN 24 609 540 285
This report was commissioned by NERA (National Energy Resources Australia) and prepared by AlphaBeta. All information is derived from AlphaBeta analysis using both proprietary research and publicly available data and uses statistical techniques to provide insights on some of the drivers of defined scenarios, but is not intended to be statistically rigorous. Where information has been obtained from third-party sources, this is clearly referenced in the footnotes.
NERA is one of six Growth Centres established by the Australian Government under the Industry Growth Centres Initiative. It is an incorporated not-for-profit company governed by a board of industry experts to help drive projects to benefit the whole energy ecosystem in Australia. Through a national focus, NERA’s role is to grow collaboration and innovation to assist the energy resources industry manage cost structures and productivity, direct research to industry needs, deliver the future work skills required and promote fit for purpose regulation.
T: 1300 589 310E: [email protected]: www.nera.org.au
@NERAnetwork NERA – National Energy Resources Australia
EXECUTIVE SUMMARY 4
AUSTRALIA’S OIL AND GAS WORKFORCE HAS DOUBLED OVER THE LAST DECADE 8The direct oil and gas industry employs 19,000 people 9
Every job in the oil and gas industry sustains another 10 jobs elsewhere in the economy 10
The oil and gas workforce has doubled since 2006 11
The mix of roles in the oil and gas industry has changed 12
Case study 1: Legacy assets and the oil and gas workforce 16
How automation technology is changing the oil and gas workforce 16
PREPARING AUSTRALIA’S OIL AND GAS WORKFORCE FOR THE FUTURE 20Scenario-planning as a tool to manage uncertainty 21
Constructing scenarios based on past workforce changes 22
THREE SCENARIOS FOR THE FUTURE OIL AND GAS WORKFORCE 28Operational efficiency: companies will need more workers with operational, maintenance and technology skills 29
Case study 2: How maintenance roles may change in an operational efficiency scenario 31
Case study 3: How field operator roles may change in an operational efficiency scenario 33
Industry growth: rapid expansion may lead to a worker shortage and the need to lift workforce skills 35
Case study 4: How workers would operate in a highly automated LNG plant 38
Production decline: downturn could require a large number of workers to leave the industry 39
Case study 5: Transitioning workers in the oil and gas industry 42
Roles in the oil and gas workforce will continue to change due to greater use of new energy, automation, and decommissioning of plants 43
HOW NERA WILL USE THESE SCENARIOS 44Inform the sector of potential workforce change 45
Prepare the sector for a variety of outcomes 45
Enable firms in the industry to collaborate and plan for the future 45
TECHNICAL APPENDIX 46How changes in the workforce composition were calculated 47
Details on the assumptions underpinning each workforce scenario 48
Supply chain and wider economy employment 51
Contents
3
Australia has developed one of the strongest natural gas industries in the world and is on track to become the biggest exporter of liquefied natural gas (LNG) globally following an unparalleled investment boom. Between 2009 and 2017, resources companies invested an estimated A$320 billion into new oil and gas extraction projects across Australia, including developing a completely new coal seam gas (CSG) industry in Queensland.1 As a result, the country’s LNG processing capacity has tripled since 2012. Today, the oil and gas industry contributes $28 billion to the Australian economy, or roughly 1.6% of the total GDP.2
The strong expansion of the LNG industry has caused Australia’s core oil and gas workforce to more than double from 9,000 workers in 2006 to 19,000 workers in 2016. More importantly, the indirect employment created by the oil and gas industry is substantial.3 Analysis used in this report shows that each oil and gas worker in Australia currently sustains another 10 jobs across the supply chain and wider economy – generating five times more indirect employment than an average worker in other industries. Oil and gas workers are also among the highest qualified in the country, with 44% employed in high-skill occupations, such as subsea engineers, geophysicists and production superintendents.
However, the future of the oil and gas workforce is uncertain. The industry’s ability to create new jobs has always been heavily dependent on a range of external factors that are difficult to predict, including the oil price, global supply and demand, and government policy. For example, the oil price has been highly volatile over the past five years and workforce growth has plateaued. An ongoing debate over CSG exploration and proposed resources taxes is affecting corporate investment decisions. As these sources of uncertainty are set to persist, it is challenging to reliably forecast the workforce needs of the oil and gas industry over the long, or even medium term.
This report, commissioned by NERA (National Energy Resources Australia), intends to offer guidance in uncertain times. Designed as a scenario-planning tool, it seeks to map the potential trajectory of the oil and gas workforce in Australia in the years ahead, so that companies, workers and policymakers can make informed decisions and prepare for a volatile future.
NERA, as an industry growth centre, has a mandate to foster collaboration and innovation, so that the oil and gas industry can deliver the future skills it requires. This includes informing the sector about expected workforce trends, liaising with education and training providers to ensure they are building and maintaining an adequate pipeline of skilled personnel, and helping the current workforce master periods of change driven by economic and technological trends.
This report uses scenario analysis to describe how Australia’s oil and gas workforce might look in 2030. It sets out three scenarios to estimate the potential direction of industry growth and employment. The three scenarios are by no means an attempt to predict the future. Rather, they should be seen as an exercise to test how the oil and gas workforce might react in a range of situations – from a sharp drop in oil prices to a reversal of current government policy.
1 Australian Bureau of Statistics (ABS), 2010 to 2018, Private new capital exp. and expected exp., cat. no. 5625.0. 2 Industry Gross Value Added for December 2017. See: ABS (March 2018), Australian National Accounts: National Income, Expenditure and Product,
cat. no. 5206.0. 3 This report defines the direct (core) oil and gas workforce as people directly employed by oil and gas extraction or production companies, while
the indirect workforce comprises of people in the supply chain and wider economy whose jobs indirectly rely on the oil and gas industry.
Executive Summary
4 National Energy Resources Australia – Preparing Australia’s Future Oil and Gas Workforce
4 The average price for Brent crude since the start of 2018 to end of June 2018 was US$67.33/barrel, according to Statista. See: HYPERLINK “http://www.statista.com/statistics/262860/uk-brent-crude-oil-price-changes-since-1976/” www.statista.com/statistics/262860/uk-brent-crude-oil-price-changes-since-1976/.
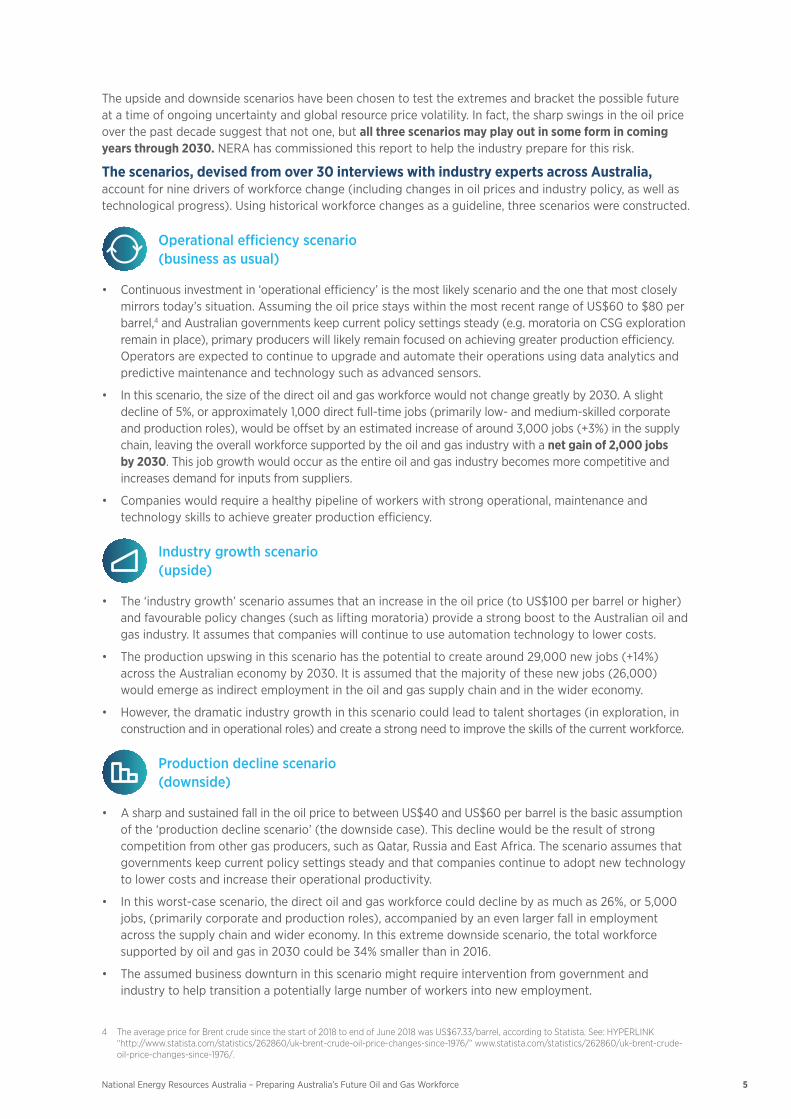
The upside and downside scenarios have been chosen to test the extremes and bracket the possible future at a time of ongoing uncertainty and global resource price volatility. In fact, the sharp swings in the oil price over the past decade suggest that not one, but all three scenarios may play out in some form in coming years through 2030. NERA has commissioned this report to help the industry prepare for this risk.
The scenarios, devised from over 30 interviews with industry experts across Australia, account for nine drivers of workforce change (including changes in oil prices and industry policy, as well as technological progress). Using historical workforce changes as a guideline, three scenarios were constructed.
Operational efficiency scenario (business as usual)
• Continuousinvestmentin‘operationalefficiency’isthemostlikelyscenarioandtheonethatmostcloselymirrors today’s situation. Assuming the oil price stays within the most recent range of US$60 to $80 per barrel,4 and Australian governments keep current policy settings steady (e.g. moratoria on CSG exploration remain in place), primary producers will likely remain focused on achieving greater production efficiency. Operators are expected to continue to upgrade and automate their operations using data analytics and predictive maintenance and technology such as advanced sensors.
• Inthisscenario,thesizeofthedirectoilandgasworkforcewouldnotchangegreatlyby2030.Aslightdecline of 5%, or approximately 1,000 direct full-time jobs (primarily low- and medium-skilled corporate and production roles), would be offset by an estimated increase of around 3,000 jobs (+3%) in the supply chain, leaving the overall workforce supported by the oil and gas industry with a net gain of 2,000 jobs by 2030. This job growth would occur as the entire oil and gas industry becomes more competitive and increases demand for inputs from suppliers.
• Companieswouldrequireahealthypipelineofworkerswithstrongoperational,maintenanceandtechnology skills to achieve greater production efficiency.
Industry growth scenario (upside)
• The‘industrygrowth’scenarioassumesthatanincreaseintheoilprice(toUS$100perbarrelorhigher) and favourable policy changes (such as lifting moratoria) provide a strong boost to the Australian oil and gas industry. It assumes that companies will continue to use automation technology to lower costs.
• Theproductionupswinginthisscenariohasthepotentialtocreatearound29,000newjobs(+14%)across the Australian economy by 2030. It is assumed that the majority of these new jobs (26,000) would emerge as indirect employment in the oil and gas supply chain and in the wider economy.
• However,thedramaticindustrygrowthinthisscenariocouldleadtotalentshortages(inexploration,inconstruction and in operational roles) and create a strong need to improve the skills of the current workforce.
Production decline scenario (downside)
• AsharpandsustainedfallintheoilpricetobetweenUS$40andUS$60perbarrelisthebasicassumptionofthe‘productiondeclinescenario’(thedownsidecase).Thisdeclinewouldbetheresultofstrongcompetition from other gas producers, such as Qatar, Russia and East Africa. The scenario assumes that governments keep current policy settings steady and that companies continue to adopt new technology to lower costs and increase their operational productivity.
• Inthisworst-casescenario,thedirectoilandgasworkforcecoulddeclinebyasmuchas26%,or5,000jobs, (primarily corporate and production roles), accompanied by an even larger fall in employment across the supply chain and wider economy. In this extreme downside scenario, the total workforce supported by oil and gas in 2030 could be 34% smaller than in 2016.
• Theassumedbusinessdownturninthisscenariomightrequireinterventionfromgovernmentandindustry to help transition a potentially large number of workers into new employment.
5National Energy Resources Australia – Preparing Australia’s Future Oil and Gas Workforce
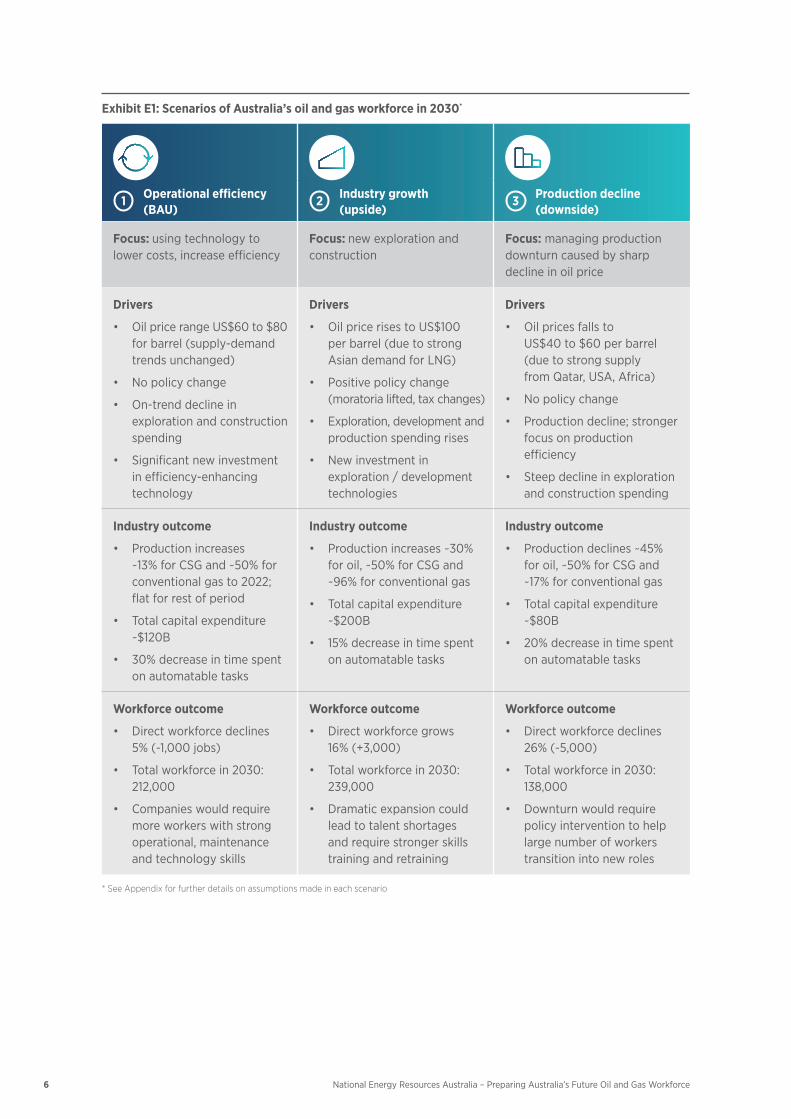
Exhibit E1: Scenarios of Australia’s oil and gas workforce in 2030*
1 Operational efficiency (BAU)
2 Industry growth (upside)
3 Production decline (downside)
Focus: using technology to lower costs, increase efficiency
Focus: new exploration and construction
Focus: managing production downturn caused by sharp decline in oil price
Drivers
• OilpricerangeUS$60to$80for barrel (supply-demand trends unchanged)
• Nopolicychange
• On-trenddeclineinexploration and construction spending
• Significantnewinvestmentin efficiency-enhancing technology
Drivers
• OilpricerisestoUS$100 per barrel (due to strong Asian demand for LNG)
• Positivepolicychange(moratoria lifted, tax changes)
• Exploration,developmentandproduction spending rises
• Newinvestmentinexploration / development technologies
Drivers
• Oilpricesfallsto US$40 to $60 per barrel (due to strong supply from Qatar, USA, Africa)
• Nopolicychange
• Productiondecline;strongerfocus on production efficiency
• Steepdeclineinexplorationand construction spending
Industry outcome
• Productionincreases ~13% for CSG and ~50% for conventionalgasto2022;flat for rest of period
• Totalcapitalexpenditure~$120B
• 30%decreaseintimespenton automatable tasks
Industry outcome
• Productionincreases~30%for oil, ~50% for CSG and ~96% for conventional gas
• Totalcapitalexpenditure~$200B
• 15%decreaseintimespenton automatable tasks
Industry outcome
• Productiondeclines~45% for oil, ~50% for CSG and ~17% for conventional gas
• Totalcapitalexpenditure~$80B
• 20%decreaseintimespenton automatable tasks
Workforce outcome
• Directworkforcedeclines 5% (-1,000 jobs)
• Totalworkforcein2030:212,000
• Companieswouldrequiremore workers with strong operational, maintenance and technology skills
Workforce outcome
• Directworkforcegrows 16% (+3,000)
• Totalworkforcein2030:239,000
• Dramaticexpansioncouldlead to talent shortages and require stronger skills training and retraining
Workforce outcome
• Directworkforcedeclines26% (-5,000)
• Totalworkforcein2030:138,000
• Downturnwouldrequirepolicy intervention to help large number of workers transition into new roles
* See Appendix for further details on assumptions made in each scenario
6 National Energy Resources Australia – Preparing Australia’s Future Oil and Gas Workforce

7National Energy Resources Australia – Preparing Australia’s Future Oil and Gas Workforce
The scenarios have been developed with significant industry input, based on what is possible and most relevant. The upside and downside case represent theoretical extremes that are meant to bracket a range of future outcomes. In fact, it is likely that the oil and gas industry will need to brace for all three scenarios to play out to some extent in coming years. Heavy swings in the oil price over the past decade (from around US$61 per barrel in 2009 to more than US$111 per barrel in 2011 and back to around US$43 in 2016) show just how unpredictable some of the drivers of the Australian oil and gas workforce are.
Regardless of the scenario, this report expects that a number of new occupations will emerge in the oil and gas industry, for example in specialist roles related to technology (Artificial Intelligence (AI)/machine learning specialists). The decommissioning of plants is seen as a growing business, which will create new jobs. Further job growth is likely if the industry decides to embrace opportunities around renewables and carbon capture, as well as other forms of unconventional energy to complement existing oil and gas extraction methods.
How NERA will use these scenariosThese scenarios have been devised to be used as an educational and planning tool for the industry, government, current and future workers and general public.
Inform industry and public. This report will be disseminated widely and launched on the NERA website with a simple and interactive occupation-level tool that will allow workers to plan their own futures and firms to prepare for workforce change.
Prepare for workforce transitions. The scenarios will also help firms in the industry plan to build a strong pipeline of skilled workers, inform the upskilling decisions that may be needed and the workforce transitions that may occur.
Enable further collaboration. The scenarios in this report will allow further industry-wide collaboration to improve training initiatives, competency frameworks, infrastructure planning and engagement of the supply chain.
8
Australia’s oil and gas workforce has doubled over the last decade
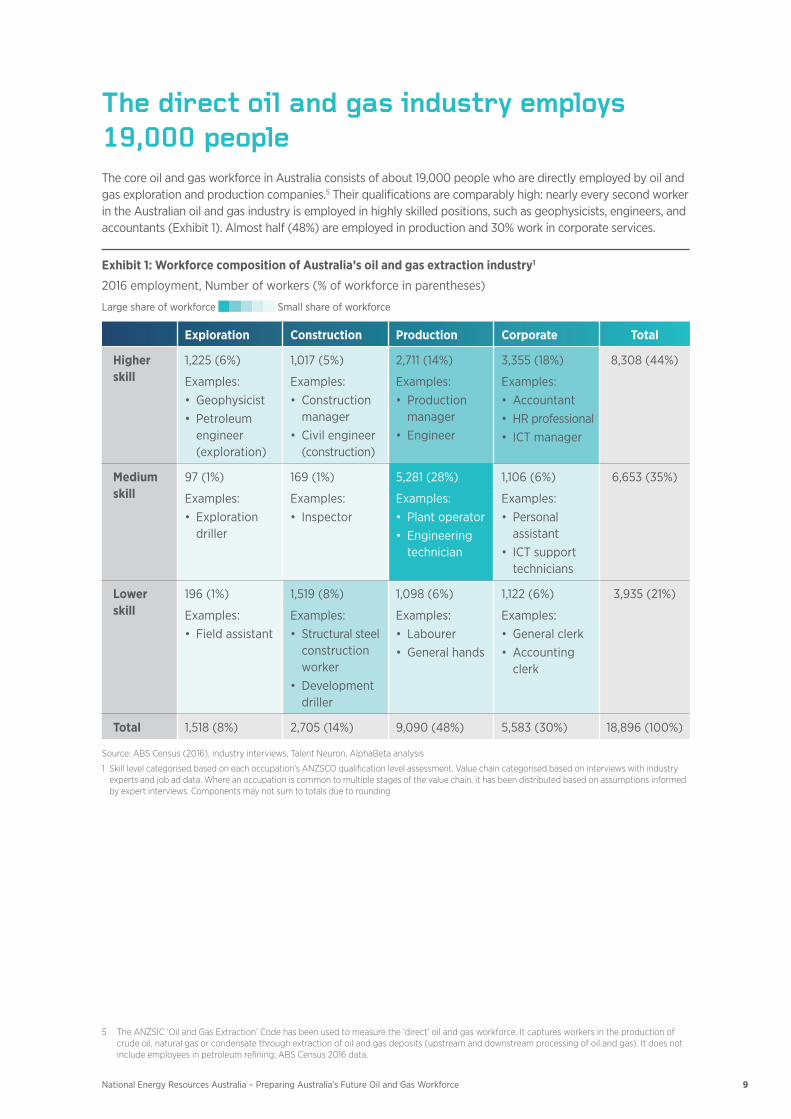
The direct oil and gas industry employs 19,000 peopleThe core oil and gas workforce in Australia consists of about 19,000 people who are directly employed by oil and gas exploration and production companies.5 Their qualifications are comparably high: nearly every second worker in the Australian oil and gas industry is employed in highly skilled positions, such as geophysicists, engineers, and accountants (Exhibit 1). Almost half (48%) are employed in production and 30% work in corporate services.
Exhibit 1: Workforce composition of Australia’s oil and gas extraction industry1
2016 employment, Number of workers (% of workforce in parentheses)
Large share of workforce Small share of workforce
Exploration Construction Production Corporate Total
Higher skill
1,225 (6%) 1,017 (5%) 2,711 (14%) 3,355 (18%) 8,308 (44%)
Examples:• Geophysicist• Petroleum
engineer (exploration)
Examples:• Construction
manager• Civilengineer
(construction)
Examples:• Production
manager• Engineer
Examples:• Accountant• HRprofessional• ICTmanager
Medium skill
97 (1%) 169 (1%) 5,281 (28%) 1,106 (6%) 6,653 (35%)
Examples:• Exploration
driller
Examples:• Inspector
Examples:• Plantoperator• Engineering
technician
Examples:• Personal
assistant• ICTsupport
technicians
Lower skill
196 (1%) 1,519 (8%) 1,098 (6%) 1,122 (6%) 3,935 (21%)
Examples:• Fieldassistant
Examples:• Structuralsteel
construction worker
• Developmentdriller
Examples:• Labourer• Generalhands
Examples:• Generalclerk• Accounting
clerk
Total 1,518 (8%) 2,705 (14%) 9,090 (48%) 5,583 (30%) 18,896 (100%)
Source: ABS Census (2016), industry interviews, Talent Neuron, AlphaBeta analysis
1 Skill level categorised based on each occupation’s ANZSCO qualification level assessment. Value chain categorised based on interviews with industry experts and job ad data. Where an occupation is common to multiple stages of the value chain, it has been distributed based on assumptions informed by expert interviews. Components may not sum to totals due to rounding
9National Energy Resources Australia – Preparing Australia’s Future Oil and Gas Workforce
5 The ANZSIC ‘Oil and Gas Extraction’ Code has been used to measure the ‘direct’ oil and gas workforce. It captures workers in the production of crude oil, natural gas or condensate through extraction of oil and gas deposits (upstream and downstream processing of oil and gas). It does not include employees in petroleum refining; ABS Census 2016 data.
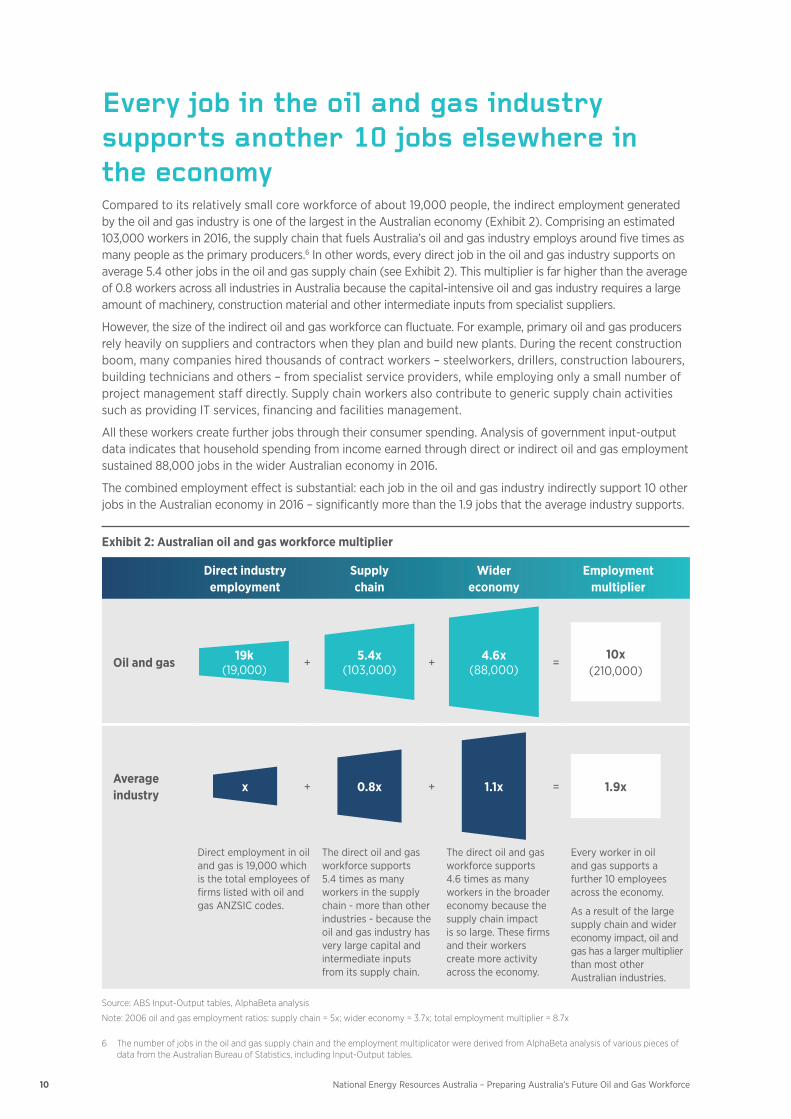
Every job in the oil and gas industry supports another 10 jobs elsewhere in the economyCompared to its relatively small core workforce of about 19,000 people, the indirect employment generated by the oil and gas industry is one of the largest in the Australian economy (Exhibit 2). Comprising an estimated 103,000 workers in 2016, the supply chain that fuels Australia’s oil and gas industry employs around five times as many people as the primary producers.6 In other words, every direct job in the oil and gas industry supports on average 5.4 other jobs in the oil and gas supply chain (see Exhibit 2). This multiplier is far higher than the average of 0.8 workers across all industries in Australia because the capital-intensive oil and gas industry requires a large amount of machinery, construction material and other intermediate inputs from specialist suppliers.
However,thesizeoftheindirectoilandgasworkforcecanfluctuate.Forexample,primaryoilandgasproducersrely heavily on suppliers and contractors when they plan and build new plants. During the recent construction boom, many companies hired thousands of contract workers – steelworkers, drillers, construction labourers, building technicians and others – from specialist service providers, while employing only a small number of project management staff directly. Supply chain workers also contribute to generic supply chain activities such as providing IT services, financing and facilities management.
All these workers create further jobs through their consumer spending. Analysis of government input-output data indicates that household spending from income earned through direct or indirect oil and gas employment sustained 88,000 jobs in the wider Australian economy in 2016.
The combined employment effect is substantial: each job in the oil and gas industry indirectly support 10 other jobs in the Australian economy in 2016 – significantly more than the 1.9 jobs that the average industry supports.
Exhibit 2: Australian oil and gas workforce multiplier
Direct industry employment
Supply chain
Wider economy
Employment multiplier
Oil and gas 19k (19,000) + 5.4x
(103,000) + 4.6x (88,000) =
10x (210,000)
Average industry
x + 0.8x + 1.1x = 1.9x
Direct employment in oil and gas is 19,000 which is the total employees of firms listed with oil and gas ANZSIC codes.
The direct oil and gas workforce supports 5.4 times as many workers in the supply chain - more than other industries - because the oil and gas industry has very large capital and intermediate inputs from its supply chain.
The direct oil and gas workforce supports 4.6 times as many workers in the broader economy because the supply chain impact is so large. These firms and their workers create more activity across the economy.
Every worker in oil and gas supports a further 10 employees across the economy.
As a result of the large supply chain and wider economy impact, oil and gas has a larger multiplier than most other Australian industries.
Source: ABS Input-Output tables, AlphaBeta analysis
Note: 2006 oil and gas employment ratios: supply chain = 5x; wider economy = 3.7x; total employment multiplier = 8.7x
10 National Energy Resources Australia – Preparing Australia’s Future Oil and Gas Workforce
6 The number of jobs in the oil and gas supply chain and the employment multiplicator were derived from AlphaBeta analysis of various pieces of data from the Australian Bureau of Statistics, including Input-Output tables.
11National Energy Resources Australia – Preparing Australia’s Future Oil and Gas Workforce
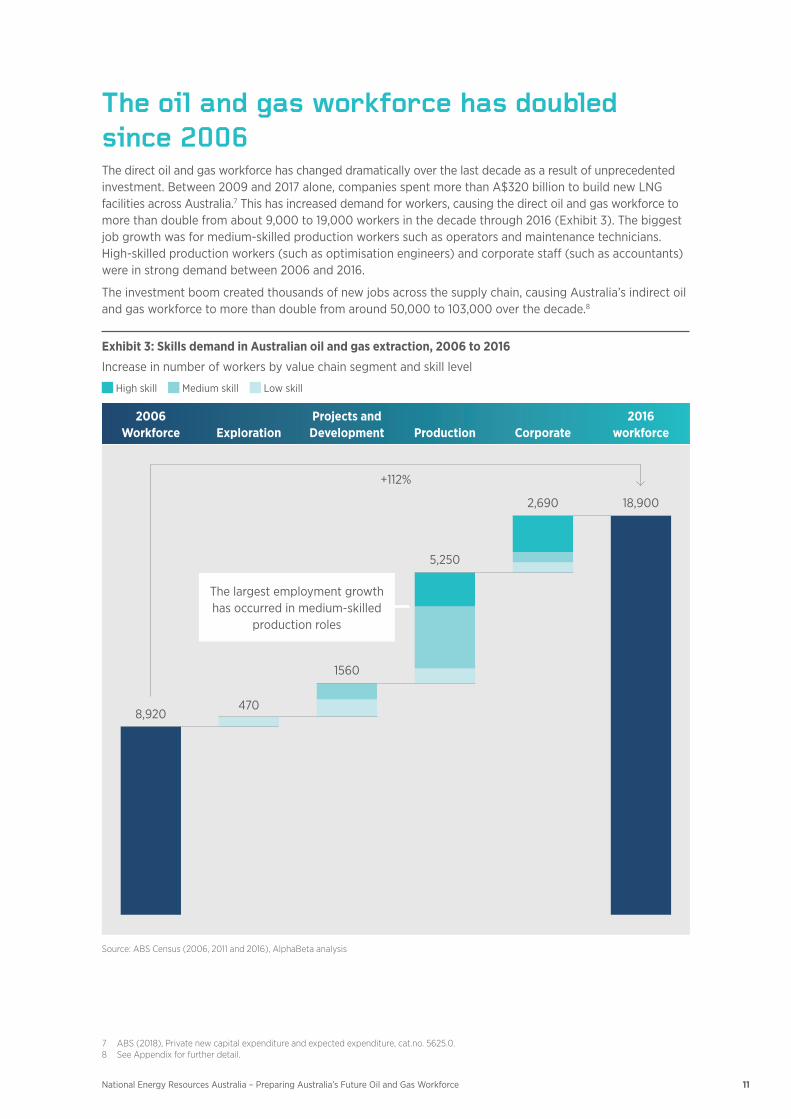
The oil and gas workforce has doubled since 2006The direct oil and gas workforce has changed dramatically over the last decade as a result of unprecedented investment. Between 2009 and 2017 alone, companies spent more than A$320 billion to build new LNG facilities across Australia.7 This has increased demand for workers, causing the direct oil and gas workforce to more than double from about 9,000 to 19,000 workers in the decade through 2016 (Exhibit 3). The biggest job growth was for medium-skilled production workers such as operators and maintenance technicians. High-skilled production workers (such as optimisation engineers) and corporate staff (such as accountants) were in strong demand between 2006 and 2016.
The investment boom created thousands of new jobs across the supply chain, causing Australia’s indirect oil and gas workforce to more than double from around 50,000 to 103,000 over the decade.8
Exhibit 3: Skills demand in Australian oil and gas extraction, 2006 to 2016
Increase in number of workers by value chain segment and skill level
High skill Medium skill Low skill
2006 Workforce Exploration
Projects and Development Production Corporate
2016 workforce
8,920470
1560
5,250
2,690 18,900
The largest employment growth has occurred in medium-skilled
production roles
+112%
Source: ABS Census (2006, 2011 and 2016), AlphaBeta analysis
7 ABS (2018), Private new capital expenditure and expected expenditure, cat.no. 5625.0. 8 See Appendix for further detail.
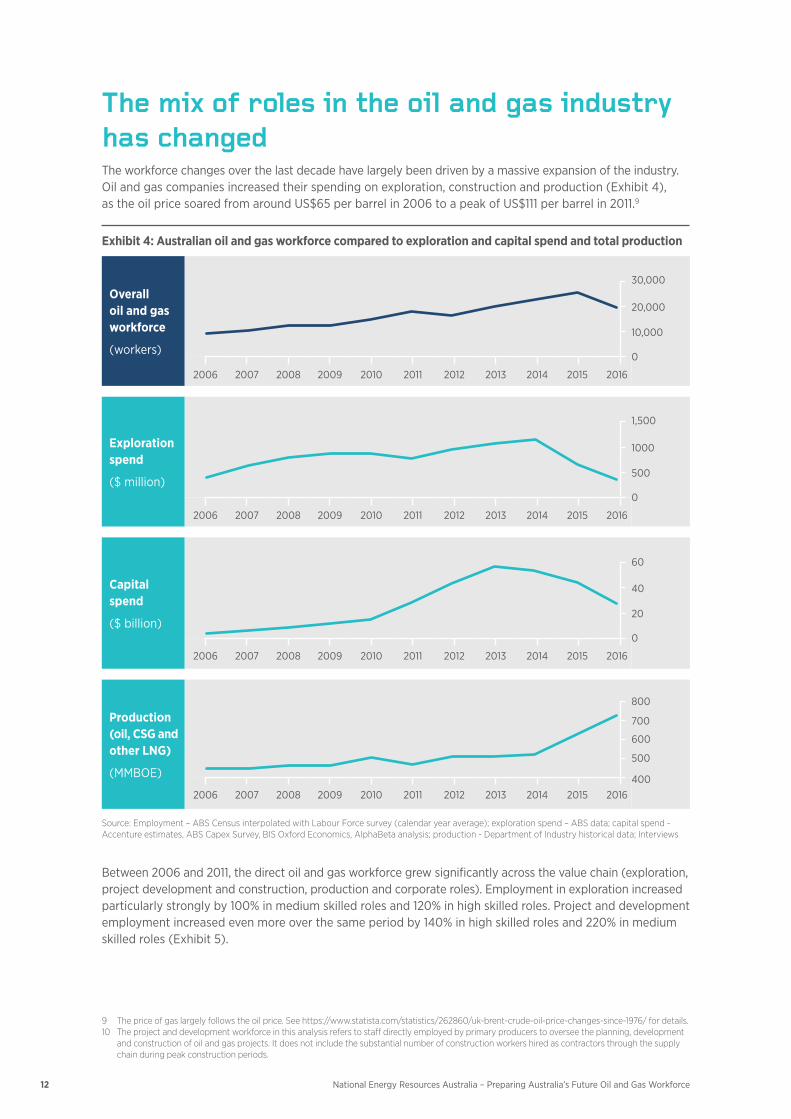
The mix of roles in the oil and gas industry has changedThe workforce changes over the last decade have largely been driven by a massive expansion of the industry. Oil and gas companies increased their spending on exploration, construction and production (Exhibit 4), as the oil price soared from around US$65 per barrel in 2006 to a peak of US$111 per barrel in 2011.9
Exhibit 4: Australian oil and gas workforce compared to exploration and capital spend and total production
Overall oil and gas workforce
(workers)
30,000
20,000
10,000
0
2006 2007 2008 2009 2010 2011 2012 2013 2014 2015 2016
Exploration spend
($ million)
1,500
1000
500
0
2006 2007 2008 2009 2010 2011 2012 2013 2014 2015 2016
Capital spend
($ billion)
60
40
20
0
2006 2007 2008 2009 2010 2011 2012 2013 2014 2015 2016
Production (oil, CSG and other LNG)
(MMBOE)
800
700
600
500
4002006 2007 2008 2009 2010 2011 2012 2013 2014 2015 2016
Source: Employment – ABS Census interpolated with Labour Force survey (calendar year average); exploration spend – ABS data; capital spend - Accenture estimates, ABS Capex Survey, BIS Oxford Economics, AlphaBeta analysis; production - Department of Industry historical data; Interviews
Between 2006 and 2011, the direct oil and gas workforce grew significantly across the value chain (exploration, project development and construction, production and corporate roles). Employment in exploration increased particularly strongly by 100% in medium skilled roles and 120% in high skilled roles. Project and development employment increased even more over the same period by 140% in high skilled roles and 220% in medium skilled roles (Exhibit 5).
12 National Energy Resources Australia – Preparing Australia’s Future Oil and Gas Workforce
9 The price of gas largely follows the oil price. See https://www.statista.com/statistics/262860/uk-brent-crude-oil-price-changes-since-1976/ for details.10 The project and development workforce in this analysis refers to staff directly employed by primary producers to oversee the planning, development
and construction of oil and gas projects. It does not include the substantial number of construction workers hired as contractors through the supply chain during peak construction periods.
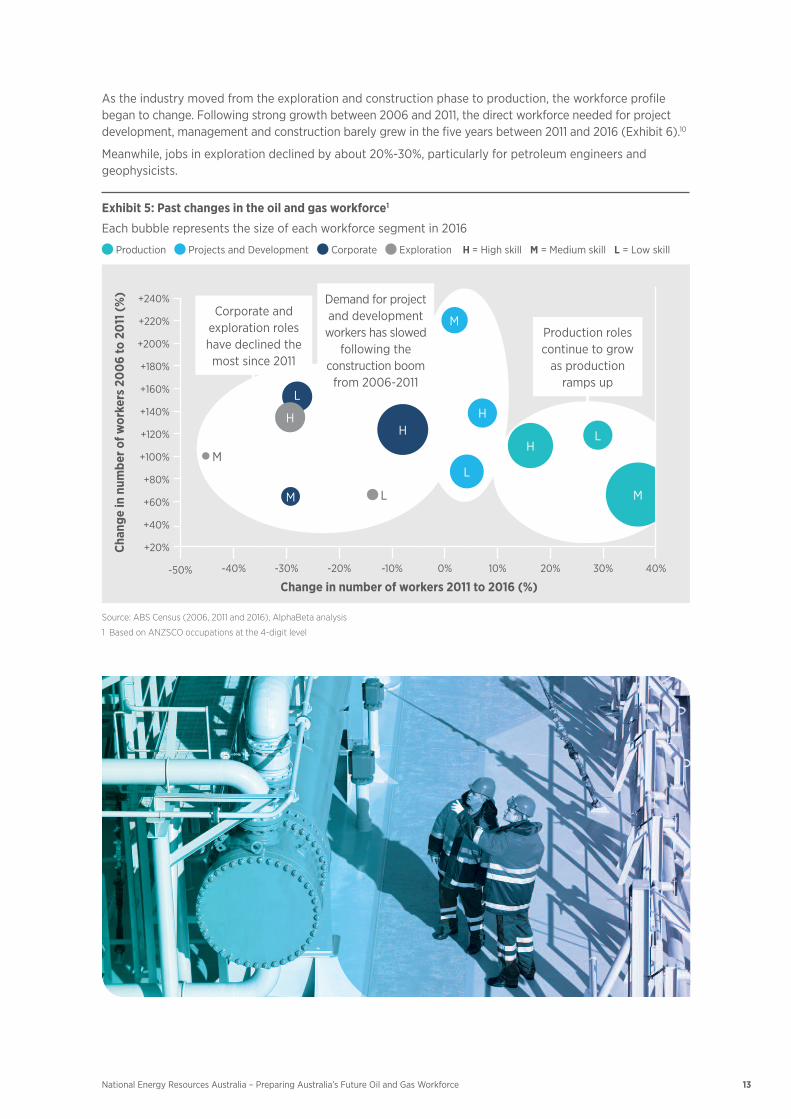
As the industry moved from the exploration and construction phase to production, the workforce profile began to change. Following strong growth between 2006 and 2011, the direct workforce needed for project development, management and construction barely grew in the five years between 2011 and 2016 (Exhibit 6).10
Meanwhile, jobs in exploration declined by about 20%-30%, particularly for petroleum engineers and geophysicists.
Exhibit 5: Past changes in the oil and gas workforce1
Eachbubblerepresentsthesizeofeachworkforcesegmentin2016
Production Projects and Development Corporate Exploration H = High skill M = Medium skill L = Low skill
LH
H
M
L
H
LM
H
L
M
M
Production roles continue to grow
as production ramps up
Corporate and exploration roles have declined the most since 2011
Demand for project and development
workers has slowed following the
construction boom from 2006-2011
Chan
ge in
num
ber o
f wor
kers
20
06
to 2
011 (
%) +240%
+220%
+200%
+180%
+160%
+140%
+120%
+100%
+80%
+60%
+40%
+20%
-50% -40% -30% -20% -10% 0% 10% 20% 30% 40%
Change in number of workers 2011 to 2016 (%)
Source: ABS Census (2006, 2011 and 2016), AlphaBeta analysis
1 Based on ANZSCO occupations at the 4-digit level
13National Energy Resources Australia – Preparing Australia’s Future Oil and Gas Workforce
14 National Energy Resources Australia – Preparing Australia’s Future Oil and Gas Workforce
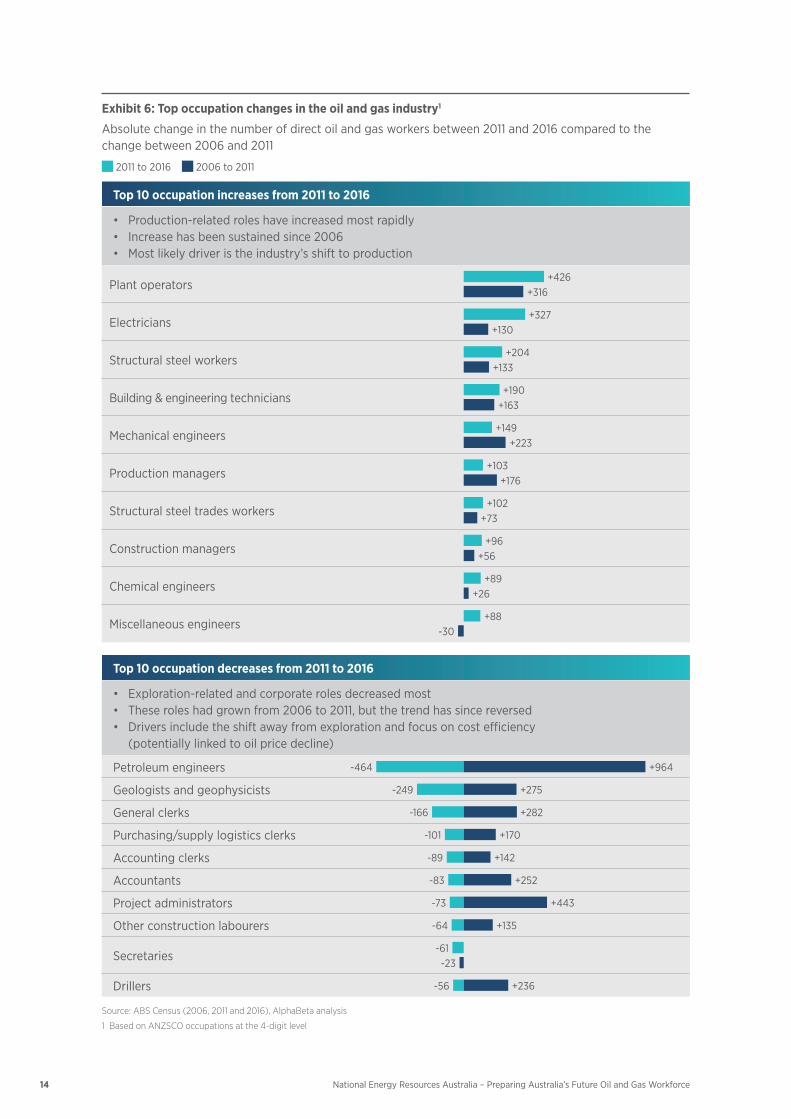
Exhibit 6: Top occupation changes in the oil and gas industry1
Absolute change in the number of direct oil and gas workers between 2011 and 2016 compared to the change between 2006 and 2011
2011 to 2016 2006 to 2011
Top 10 occupation increases from 2011 to 2016
• Production-relatedroleshaveincreasedmostrapidly• Increasehasbeensustainedsince2006• Mostlikelydriveristheindustry’sshifttoproduction
Plant operators+426
+316
Electricians+327
+130
Structural steel workers+204
+133
Building & engineering technicians+190
+163
Mechanical engineers+149
+223
Production managers+103
+176
Structural steel trades workers+102
+73
Construction managers+96
+56
Chemical engineers+89
+26
Miscellaneous engineers-30
+88
Top 10 occupation decreases from 2011 to 2016
• Exploration-relatedandcorporaterolesdecreasedmost• Theseroleshadgrownfrom2006to2011,butthetrendhassincereversed• Driversincludetheshiftawayfromexplorationandfocusoncostefficiency
(potentially linked to oil price decline)
Petroleum engineers -464 +964
Geologists and geophysicists -249 +275
General clerks -166 +282
Purchasing/supply logistics clerks -101 +170
Accounting clerks -89 +142
Accountants -83 +252
Project administrators -73 +443
Other construction labourers -64 +135
Secretaries-61-23
Drillers -56 +236
Source: ABS Census (2006, 2011 and 2016), AlphaBeta analysis
1 Based on ANZSCO occupations at the 4-digit level
15National Energy Resources Australia – Preparing Australia’s Future Oil and Gas Workforce
A collapse in the oil price to around US$43 per barrel between 2014 and 2016 forced companies to cut operating costs. Between 2011 and 2016, the industry shed on average around 15% of corporate roles, such as general clerks and accountants.11 On the other hand, production roles continued to grow between 2011 and 2016 as new plants came online and bolstered production volumes. In production, plant operators, electricians, and structural steel workers were most needed between 2011 and 2016 (Exhibit 6).
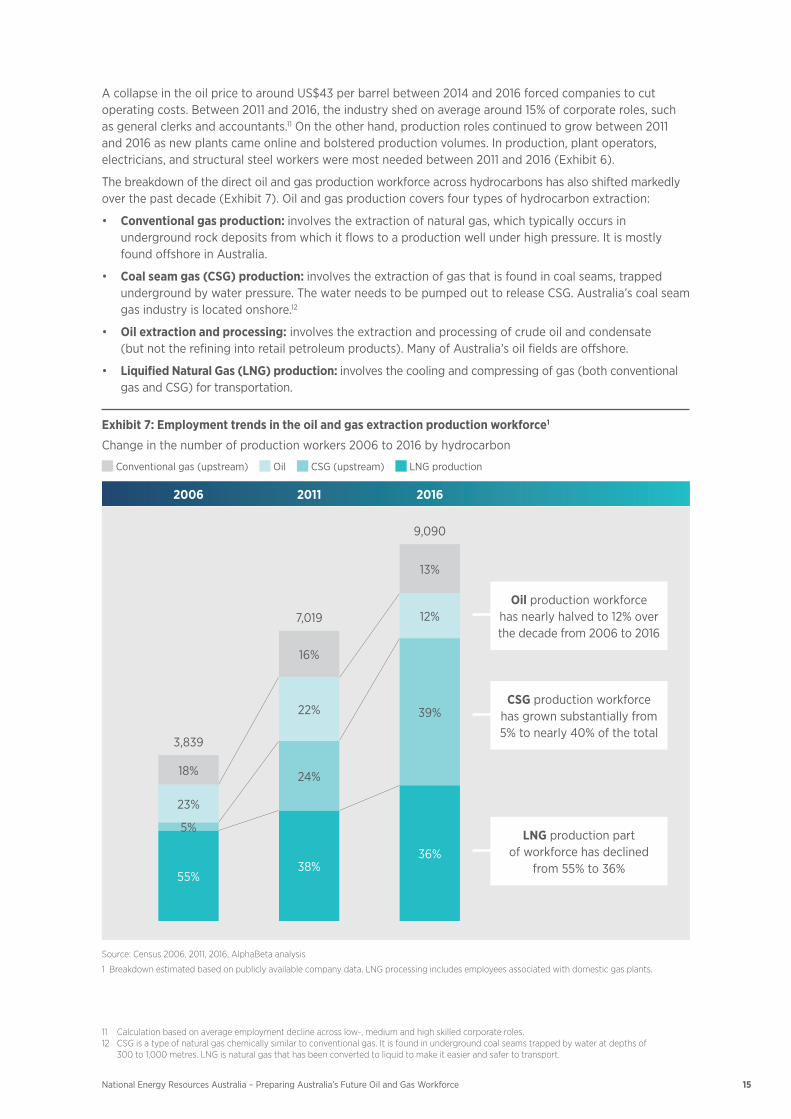
The breakdown of the direct oil and gas production workforce across hydrocarbons has also shifted markedly over the past decade (Exhibit 7). Oil and gas production covers four types of hydrocarbon extraction:
• Conventional gas production: involves the extraction of natural gas, which typically occurs in underground rock deposits from which it flows to a production well under high pressure. It is mostly found offshore in Australia.
• Coal seam gas (CSG) production: involves the extraction of gas that is found in coal seams, trapped underground by water pressure. The water needs to be pumped out to release CSG. Australia’s coal seam gas industry is located onshore.12
• Oil extraction and processing: involves the extraction and processing of crude oil and condensate (but not the refining into retail petroleum products). Many of Australia’s oil fields are offshore.
• Liquified Natural Gas (LNG) production: involves the cooling and compressing of gas (both conventional gas and CSG) for transportation.
Exhibit 7: Employment trends in the oil and gas extraction production workforce1
Change in the number of production workers 2006 to 2016 by hydrocarbon
Conventional gas (upstream) Oil CSG (upstream) LNG production
2006 2011 2016
Oil production workforce has nearly halved to 12% over the decade from 2006 to 2016
9,090
13%
12%
39%
36%
7,019
16%
22%
24%
38%
3,839
18%
23%
55%
5%
CSG production workforce has grown substantially from 5% to nearly 40% of the total
LNG production part of workforce has declined
from 55% to 36%
Source: Census 2006, 2011, 2016, AlphaBeta analysis
1 Breakdown estimated based on publicly available company data. LNG processing includes employees associated with domestic gas plants.
11 Calculation based on average employment decline across low-, medium and high skilled corporate roles. 12 CSG is a type of natural gas chemically similar to conventional gas. It is found in underground coal seams trapped by water at depths of
300 to 1,000 metres. LNG is natural gas that has been converted to liquid to make it easier and safer to transport.
16 National Energy Resources Australia – Preparing Australia’s Future Oil and Gas Workforce
The CSG production workforce grew particularly rapidly between 2006 and 2016, increasing from 5% to nearly 40% of all oil and gas workers in Australia as three new plants on Curtis Island in Queensland came online. Compared to offshore oil and gas, the onshore upstream CSG industry is comparatively labour-intensive, requiring considerable numbers of workers to drill, service and operate thousands of onshore wells and gas facilities that are often spread over large distances.13
While the LNG production workforce continued to grow in absolute terms over the past decade, it reduced as a percentage of the total oil and gas production workforce in Australia. This is partly due to the emerging dominance of the CSG industry but also a result of the growing number of modern, high-tech LNG plants such as Pluto, Wheatstone and Gorgon, which require comparatively smaller workforces. The oil workforce has decreased from around 23% of Australia’s total oil and gas production workforce to nearly 10%, due to more efficient technology and declining production levels.
Case study 1: Legacy assets and the oil and gas workforceA substantial number of workers in Australian oil and gas production are currently employed in mature facilities. Automation technology could change this.
Despite the recent construction boom, around 50% of the LNG plants are more than a decade old.14 Such older LNG plants make up approximately 30% of all LNG plants in Australia and include Woodside’s Karratha and ConocoPhillip’s Darwin plant. The situation is similar in the CSG industry where around 30% of extraction workers perform tasks at legacy wells and gas facilities, even though these assets make up only 15% of all wells and facilities.15
There are several reasons for the relatively large workforce in older assets. Older assets typically require more frequent maintenance and hence more workers to repair and replace ageing parts. Older assets also tend to be less automated, which means they still rely predominantly on humans, rather than sensors and robots, to operate them. Companies will perform a cost-benefit analysis at each plant on a case-by-case basis to decide whether to retrofit ageing plants with updated automation technology.16 By contrast, newer assets are more easily automated because they are more likely to have been designed with new technology in mind.
How automation technology is changing the oil and gas workforceAutomation is changing the oil and gas workforce. New technologies, such as sensor technology and machine learning, are beginning to transform the way the industry operates and also changing the way workers do their jobs. For example, maintenance technicians are now likely to use data to determine which pieces of equipment require attention instead of working to pre-set schedules. In future, the ability to use and interpret data will only become more important for oil and gas occupations.
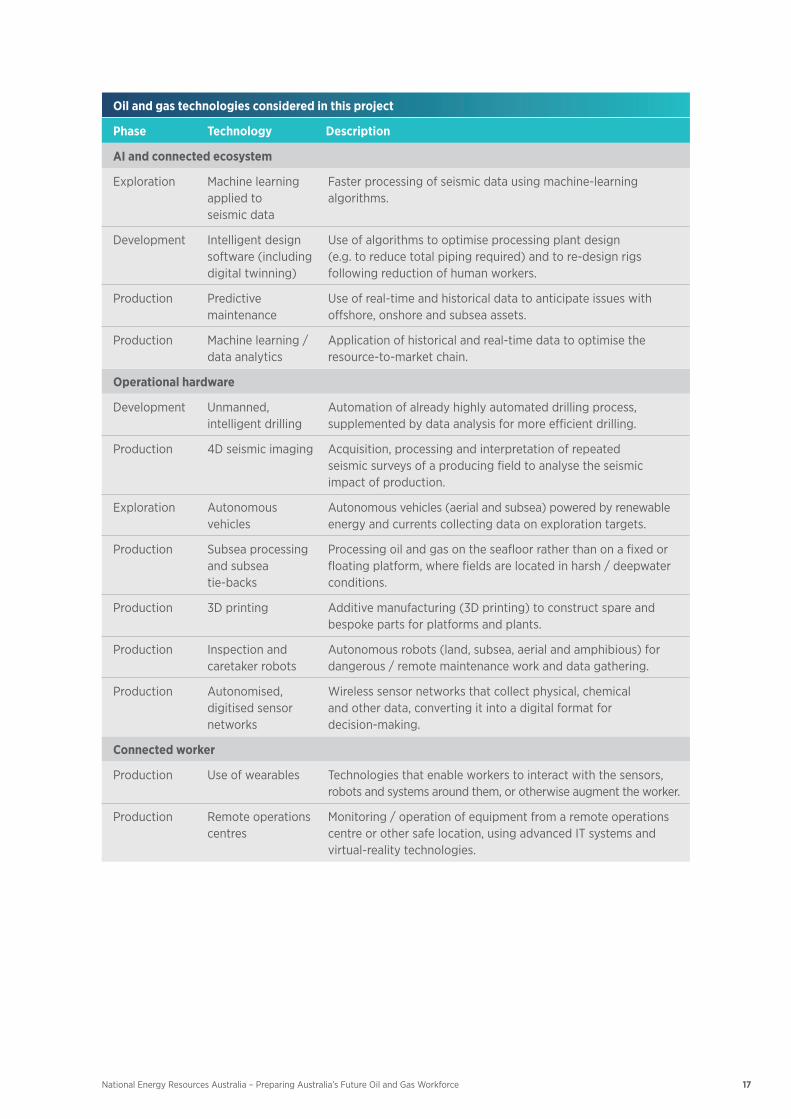
This report considers about 15 different technologies that have the potential to significantly increase the productivity and efficiency of oil and gas operations (see table below).
13 Upstream CSG production is defined as CSG field facilities including drilling, plant and pipeline components of the project.14 Estimates based on expert interviews and publicly available information. 15 Estimates based on expert interviews. 16 Such analysis has not been carried out in this report due to a lack of data.
17National Energy Resources Australia – Preparing Australia’s Future Oil and Gas Workforce
Oil and gas technologies considered in this project
Phase Technology Description
AI and connected ecosystem
Exploration Machine learning applied to seismic data
Faster processing of seismic data using machine-learning algorithms.
Development Intelligent design software (including digital twinning)
Use of algorithms to optimise processing plant design (e.g. to reduce total piping required) and to re-design rigs following reduction of human workers.
Production Predictive maintenance
Use of real-time and historical data to anticipate issues with offshore, onshore and subsea assets.
Production Machine learning / data analytics
Application of historical and real-time data to optimise the resource-to-market chain.
Operational hardware
Development Unmanned, intelligent drilling
Automation of already highly automated drilling process, supplemented by data analysis for more efficient drilling.
Production 4D seismic imaging Acquisition, processing and interpretation of repeated seismic surveys of a producing field to analyse the seismic impact of production.
Exploration Autonomous vehicles
Autonomous vehicles (aerial and subsea) powered by renewable energy and currents collecting data on exploration targets.
Production Subsea processing and subsea tie-backs
Processing oil and gas on the seafloor rather than on a fixed or floating platform, where fields are located in harsh / deepwater conditions.
Production 3D printing Additive manufacturing (3D printing) to construct spare and bespoke parts for platforms and plants.
Production Inspection and caretaker robots
Autonomous robots (land, subsea, aerial and amphibious) for dangerous / remote maintenance work and data gathering.
Production Autonomised, digitised sensor networks
Wireless sensor networks that collect physical, chemical and other data, converting it into a digital format for decision-making.
Connected worker
Production Use of wearables Technologies that enable workers to interact with the sensors, robots and systems around them, or otherwise augment the worker.
Production Remote operations centres
Monitoring / operation of equipment from a remote operations centre or other safe location, using advanced IT systems and virtual-reality technologies.
18 National Energy Resources Australia – Preparing Australia’s Future Oil and Gas Workforce
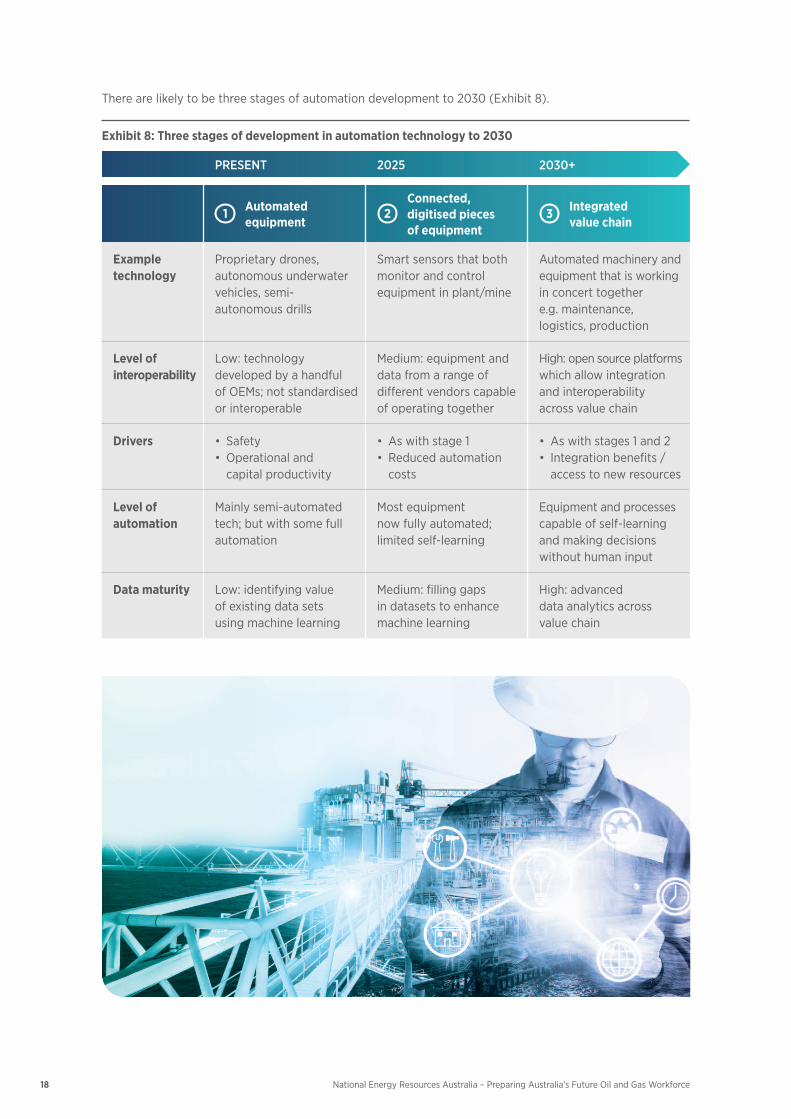
There are likely to be three stages of automation development to 2030 (Exhibit 8).
Exhibit 8: Three stages of development in automation technology to 2030
PRESENT 2025 2030+
1 Automated equipment
2Connected, digitised pieces of equipment
3 Integrated value chain
Example technology
Proprietary drones, autonomous underwater vehicles, semi-autonomous drills
Smart sensors that both monitor and control equipment in plant/mine
Automated machinery and equipment that is working in concert together e.g. maintenance, logistics, production
Level of interoperability
Low: technology developed by a handful ofOEMs;notstandardisedor interoperable
Medium: equipment and data from a range of different vendors capable of operating together
High: open source platforms which allow integration and interoperability across value chain
Drivers • Safety• Operationaland
capital productivity
• Aswithstage1• Reducedautomation
costs
• Aswithstages1and2• Integrationbenefits/
access to new resources
Level of automation
Mainly semi-automated tech;butwithsomefullautomation
Most equipment nowfullyautomated; limited self-learning
Equipment and processes capable of self-learning and making decisions without human input
Data maturity Low: identifying value of existing data sets using machine learning
Medium: filling gaps in datasets to enhance machine learning
High: advanced data analytics across value chain
19National Energy Resources Australia – Preparing Australia’s Future Oil and Gas Workforce
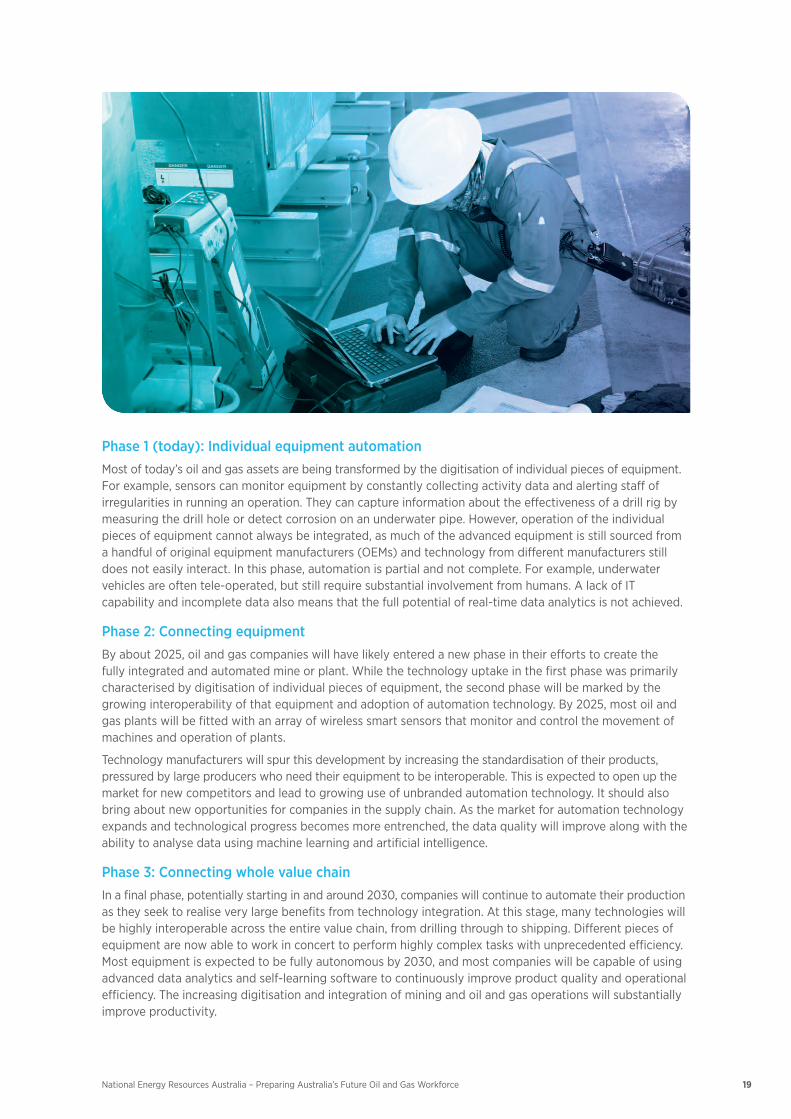
Phase 1 (today): Individual equipment automation Most of today’s oil and gas assets are being transformed by the digitisation of individual pieces of equipment. For example, sensors can monitor equipment by constantly collecting activity data and alerting staff of irregularities in running an operation. They can capture information about the effectiveness of a drill rig by measuring the drill hole or detect corrosion on an underwater pipe. However, operation of the individual pieces of equipment cannot always be integrated, as much of the advanced equipment is still sourced from a handful of original equipment manufacturers (OEMs) and technology from different manufacturers still does not easily interact. In this phase, automation is partial and not complete. For example, underwater vehicles are often tele-operated, but still require substantial involvement from humans. A lack of IT capability and incomplete data also means that the full potential of real-time data analytics is not achieved.
Phase 2: Connecting equipment By about 2025, oil and gas companies will have likely entered a new phase in their efforts to create the fully integrated and automated mine or plant. While the technology uptake in the first phase was primarily characterised by digitisation of individual pieces of equipment, the second phase will be marked by the growing interoperability of that equipment and adoption of automation technology. By 2025, most oil and gas plants will be fitted with an array of wireless smart sensors that monitor and control the movement of machines and operation of plants.
Technology manufacturers will spur this development by increasing the standardisation of their products, pressured by large producers who need their equipment to be interoperable. This is expected to open up the market for new competitors and lead to growing use of unbranded automation technology. It should also bring about new opportunities for companies in the supply chain. As the market for automation technology expands and technological progress becomes more entrenched, the data quality will improve along with the ability to analyse data using machine learning and artificial intelligence.
Phase 3: Connecting whole value chainIn a final phase, potentially starting in and around 2030, companies will continue to automate their production as they seek to realise very large benefits from technology integration. At this stage, many technologies will be highly interoperable across the entire value chain, from drilling through to shipping. Different pieces of equipment are now able to work in concert to perform highly complex tasks with unprecedented efficiency. Most equipment is expected to be fully autonomous by 2030, and most companies will be capable of using advanced data analytics and self-learning software to continuously improve product quality and operational efficiency. The increasing digitisation and integration of mining and oil and gas operations will substantially improve productivity.
20
Preparing Australia’s oil and gas workforce for the future
21National Energy Resources Australia – Preparing Australia’s Future Oil and Gas Workforce
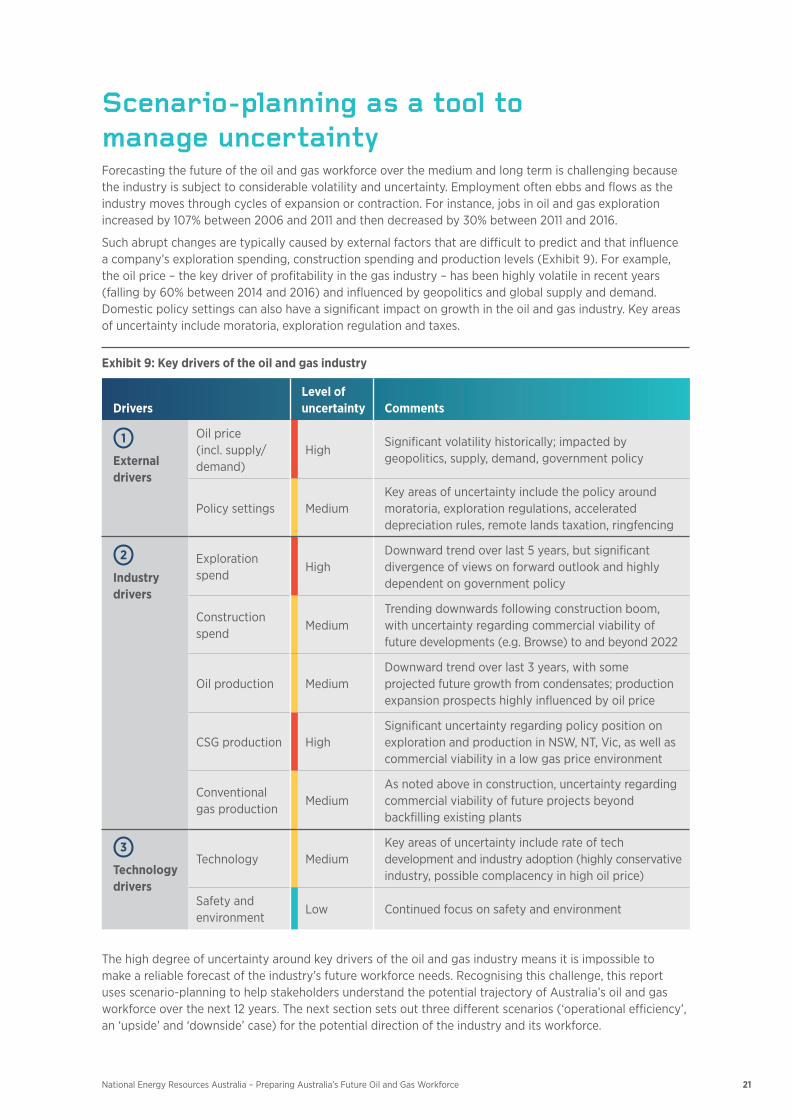
Scenario-planning as a tool to manage uncertaintyForecasting the future of the oil and gas workforce over the medium and long term is challenging because the industry is subject to considerable volatility and uncertainty. Employment often ebbs and flows as the industry moves through cycles of expansion or contraction. For instance, jobs in oil and gas exploration increased by 107% between 2006 and 2011 and then decreased by 30% between 2011 and 2016.
Such abrupt changes are typically caused by external factors that are difficult to predict and that influence a company’s exploration spending, construction spending and production levels (Exhibit 9). For example, the oil price – the key driver of profitability in the gas industry – has been highly volatile in recent years (falling by 60% between 2014 and 2016) and influenced by geopolitics and global supply and demand. Domestic policy settings can also have a significant impact on growth in the oil and gas industry. Key areas of uncertainty include moratoria, exploration regulation and taxes.
Exhibit 9: Key drivers of the oil and gas industry
DriversLevel of uncertainty Comments
1
External drivers
Oil price (incl. supply/ demand)
HighSignificantvolatilityhistorically;impactedbygeopolitics, supply, demand, government policy
Policy settings MediumKey areas of uncertainty include the policy around moratoria, exploration regulations, accelerated depreciation rules, remote lands taxation, ringfencing
2
Industry drivers
Exploration spend
HighDownward trend over last 5 years, but significant divergence of views on forward outlook and highly dependent on government policy
Construction spend
MediumTrending downwards following construction boom, with uncertainty regarding commercial viability of future developments (e.g. Browse) to and beyond 2022
Oil production MediumDownward trend over last 3 years, with some projectedfuturegrowthfromcondensates;productionexpansion prospects highly influenced by oil price
CSG production HighSignificant uncertainty regarding policy position on exploration and production in NSW, NT, Vic, as well as commercial viability in a low gas price environment
Conventional gas production
MediumAs noted above in construction, uncertainty regarding commercial viability of future projects beyond backfilling existing plants
3
Technology drivers
Technology MediumKey areas of uncertainty include rate of tech development and industry adoption (highly conservative industry, possible complacency in high oil price)
Safety and environment
Low Continued focus on safety and environment
The high degree of uncertainty around key drivers of the oil and gas industry means it is impossible to make a reliable forecast of the industry’s future workforce needs. Recognising this challenge, this report uses scenario-planning to help stakeholders understand the potential trajectory of Australia’s oil and gas workforceoverthenext12years.Thenextsectionsetsoutthreedifferentscenarios(‘operationalefficiency’,an‘upside’and‘downside’case)forthepotentialdirectionoftheindustryanditsworkforce.
22 National Energy Resources Australia – Preparing Australia’s Future Oil and Gas Workforce
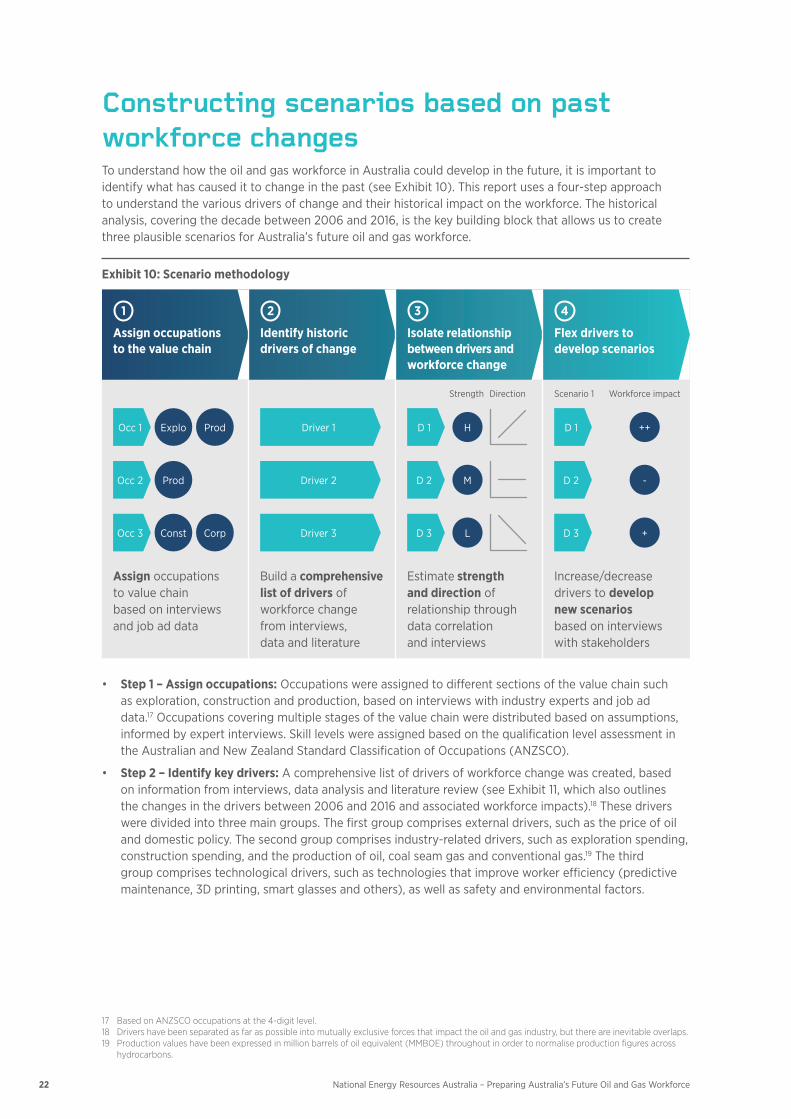
Constructing scenarios based on past workforce changesTo understand how the oil and gas workforce in Australia could develop in the future, it is important to identify what has caused it to change in the past (see Exhibit 10). This report uses a four-step approach to understand the various drivers of change and their historical impact on the workforce. The historical analysis, covering the decade between 2006 and 2016, is the key building block that allows us to create three plausible scenarios for Australia’s future oil and gas workforce.
Exhibit 10: Scenario methodology
1
Assign occupations to the value chain
2
Identify historic drivers of change
3
Isolate relationship between drivers and workforce change
4
Flex drivers to develop scenarios
Strength Direction Scenario 1 Workforce impact
Explo ProdOcc 1 Driver 1 HD 1 ++D 1
ProdOcc 2 Driver 2 MD 2 -D 2
Const CorpOcc 3 Driver 3 LD 3 +D 3
Assign occupations to value chain based on interviews and job ad data
Build a comprehensive list of drivers of workforce change from interviews, data and literature
Estimate strength and direction of relationship through data correlation and interviews
Increase/decrease drivers to develop new scenarios based on interviews with stakeholders
• Step 1 – Assign occupations: Occupations were assigned to different sections of the value chain such as exploration, construction and production, based on interviews with industry experts and job ad data.17 Occupations covering multiple stages of the value chain were distributed based on assumptions, informed by expert interviews. Skill levels were assigned based on the qualification level assessment in the Australian and New Zealand Standard Classification of Occupations (ANZSCO).
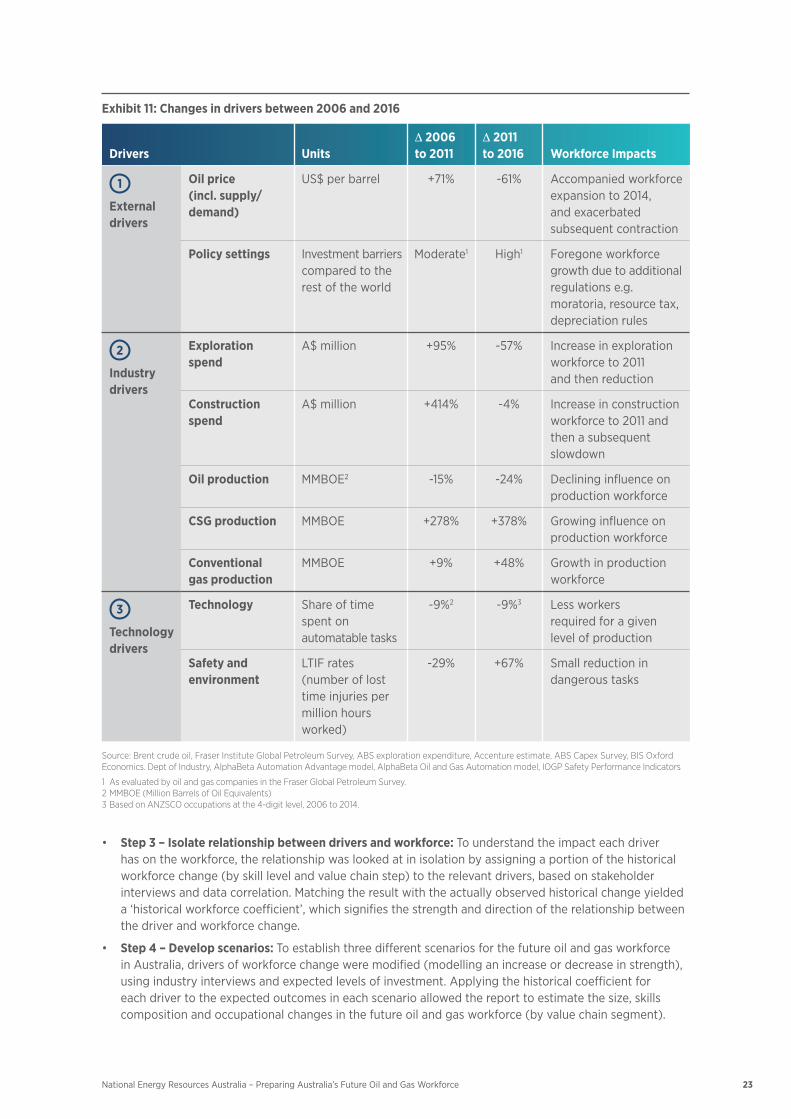
• Step 2 – Identify key drivers: A comprehensive list of drivers of workforce change was created, based on information from interviews, data analysis and literature review (see Exhibit 11, which also outlines the changes in the drivers between 2006 and 2016 and associated workforce impacts).18 These drivers were divided into three main groups. The first group comprises external drivers, such as the price of oil and domestic policy. The second group comprises industry-related drivers, such as exploration spending, construction spending, and the production of oil, coal seam gas and conventional gas.19 The third group comprises technological drivers, such as technologies that improve worker efficiency (predictive maintenance, 3D printing, smart glasses and others), as well as safety and environmental factors.
17 Based on ANZSCO occupations at the 4-digit level.18 Drivers have been separated as far as possible into mutually exclusive forces that impact the oil and gas industry, but there are inevitable overlaps.19 Production values have been expressed in million barrels of oil equivalent (MMBOE) throughout in order to normalise production figures across
hydrocarbons.
23National Energy Resources Australia – Preparing Australia’s Future Oil and Gas Workforce
Exhibit 11: Changes in drivers between 2006 and 2016
Drivers Units∆ 2006 to 2011
∆ 2011 to 2016 Workforce Impacts
1
External drivers
Oil price (incl. supply/ demand)
US$ per barrel +71% -61% Accompanied workforce expansion to 2014, and exacerbated subsequent contraction
Policy settings Investment barriers compared to the rest of the world
Moderate1 High1 Foregone workforce growth due to additional regulations e.g. moratoria, resource tax, depreciation rules
2
Industry drivers
Exploration spend
A$ million +95% -57% Increase in exploration workforce to 2011 and then reduction
Construction spend
A$ million +414% -4% Increase in construction workforce to 2011 and then a subsequent slowdown
Oil production MMBOE2 -15% -24% Declining influence on production workforce
CSG production MMBOE +278% +378% Growing influence on production workforce
Conventional gas production
MMBOE +9% +48% Growth in production workforce
3
Technology drivers
Technology Share of time spent on automatable tasks
-9%2 -9%3 Less workers required for a given level of production
Safety and environment
LTIF rates (number of lost time injuries per million hours worked)
-29% +67% Small reduction in dangerous tasks
Source: Brent crude oil, Fraser Institute Global Petroleum Survey, ABS exploration expenditure, Accenture estimate, ABS Capex Survey, BIS Oxford Economics. Dept of Industry, AlphaBeta Automation Advantage model, AlphaBeta Oil and Gas Automation model, IOGP Safety Performance Indicators
1 As evaluated by oil and gas companies in the Fraser Global Petroleum Survey.2 MMBOE (Million Barrels of Oil Equivalents)3 Based on ANZSCO occupations at the 4-digit level, 2006 to 2014.
• Step 3 – Isolate relationship between drivers and workforce: To understand the impact each driver has on the workforce, the relationship was looked at in isolation by assigning a portion of the historical workforce change (by skill level and value chain step) to the relevant drivers, based on stakeholder interviews and data correlation. Matching the result with the actually observed historical change yielded a‘historicalworkforcecoefficient’,whichsignifiesthestrengthanddirectionoftherelationshipbetweenthe driver and workforce change.
• Step 4 – Develop scenarios: To establish three different scenarios for the future oil and gas workforce in Australia, drivers of workforce change were modified (modelling an increase or decrease in strength), using industry interviews and expected levels of investment. Applying the historical coefficient for eachdrivertotheexpectedoutcomesineachscenarioallowedthereporttoestimatethesize,skillscomposition and occupational changes in the future oil and gas workforce (by value chain segment).
24 National Energy Resources Australia – Preparing Australia’s Future Oil and Gas Workforce
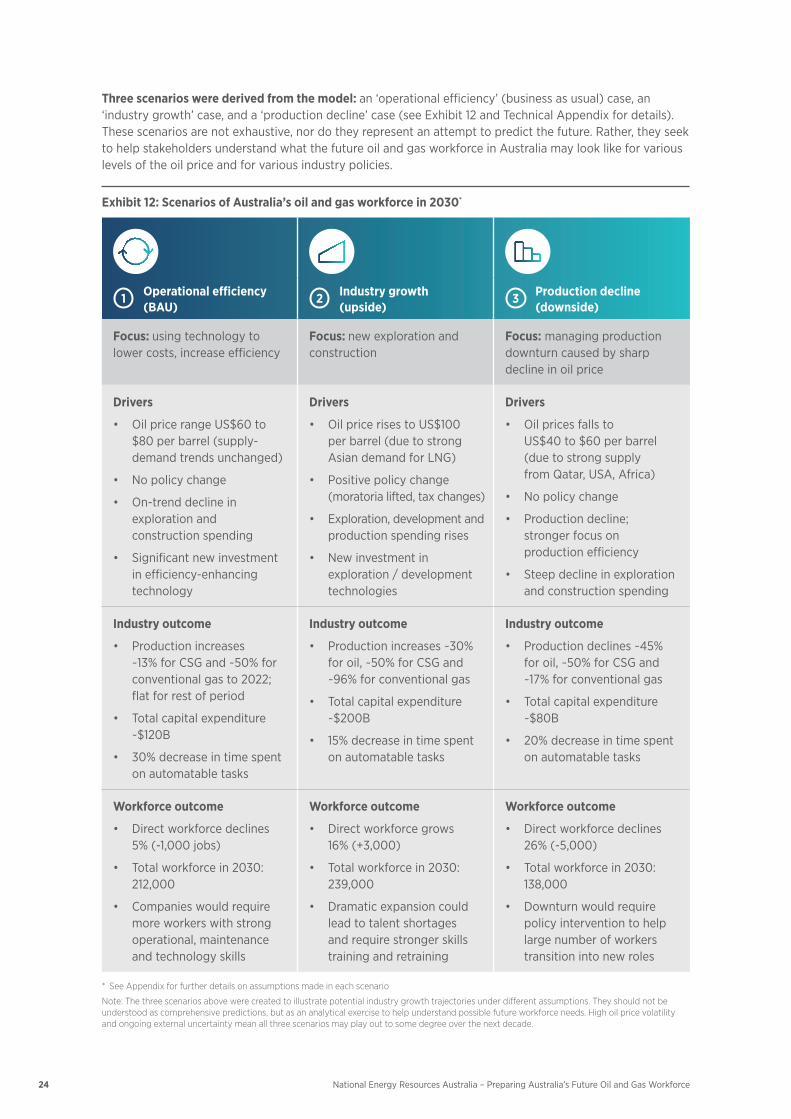
Three scenarios were derived from the model: an‘operationalefficiency’(businessasusual)case,an‘industrygrowth’case,anda‘productiondecline’case(seeExhibit12andTechnicalAppendixfordetails).These scenarios are not exhaustive, nor do they represent an attempt to predict the future. Rather, they seek to help stakeholders understand what the future oil and gas workforce in Australia may look like for various levels of the oil price and for various industry policies.
Exhibit 12: Scenarios of Australia’s oil and gas workforce in 2030*
1 Operational efficiency (BAU)
2 Industry growth (upside)
3 Production decline (downside)
Focus: using technology to lower costs, increase efficiency
Focus: new exploration and construction
Focus: managing production downturn caused by sharp decline in oil price
Drivers
• OilpricerangeUS$60to $80 per barrel (supply-demand trends unchanged)
• Nopolicychange
• On-trenddeclineinexploration and construction spending
• Significantnewinvestmentin efficiency-enhancing technology
Drivers
• OilpricerisestoUS$100 per barrel (due to strong Asian demand for LNG)
• Positivepolicychange(moratoria lifted, tax changes)
• Exploration,developmentandproduction spending rises
• Newinvestmentinexploration / development technologies
Drivers
• Oilpricesfallsto US$40 to $60 per barrel (due to strong supply from Qatar, USA, Africa)
• Nopolicychange
• Productiondecline; stronger focus on production efficiency
• Steepdeclineinexplorationand construction spending
Industry outcome
• Productionincreases ~13% for CSG and ~50% for conventionalgasto2022;flat for rest of period
• Totalcapitalexpenditure~$120B
• 30%decreaseintimespenton automatable tasks
Industry outcome
• Productionincreases~30%for oil, ~50% for CSG and ~96% for conventional gas
• Totalcapitalexpenditure~$200B
• 15%decreaseintimespenton automatable tasks
Industry outcome
• Productiondeclines~45% for oil, ~50% for CSG and ~17% for conventional gas
• Totalcapitalexpenditure~$80B
• 20%decreaseintimespenton automatable tasks
Workforce outcome
• Directworkforcedeclines 5% (-1,000 jobs)
• Totalworkforcein2030:212,000
• Companieswouldrequiremore workers with strong operational, maintenance and technology skills
Workforce outcome
• Directworkforcegrows 16% (+3,000)
• Totalworkforcein2030:239,000
• Dramaticexpansioncouldlead to talent shortages and require stronger skills training and retraining
Workforce outcome
• Directworkforcedeclines26% (-5,000)
• Totalworkforcein2030:138,000
• Downturnwouldrequirepolicy intervention to help large number of workers transition into new roles
* See Appendix for further details on assumptions made in each scenario
Note: The three scenarios above were created to illustrate potential industry growth trajectories under different assumptions. They should not be understood as comprehensive predictions, but as an analytical exercise to help understand possible future workforce needs. High oil price volatility and ongoing external uncertainty mean all three scenarios may play out to some degree over the next decade.
25National Energy Resources Australia – Preparing Australia’s Future Oil and Gas Workforce
The scenarios have been developed with significant industry input, based on what is possible and most relevant. The upside and downside scenarios represent theoretical extremes that are meant to bracket a range of future outcomes. In fact, it is likely that the oil and gas industry will need to brace for all three scenarios to play out to some extent in coming years. Heavy swings in the oil price over the past decade (from around US$61 per barrel in 2009 to more than US$111 per barrel in 2011 and back to around US$43 in 2016) show just how unpredictable some of the drivers of the Australian oil and gas workforce are.
This report does not consider any scenario that would reflect a large structural change in the use of energy by 2030. Industry stakeholders deemed such a structural change less likely (over the modelled time frame) and uncertain in consequences. For simplicity reasons, the report assumes that differences between the oil workforce and the gas workforce are limited.
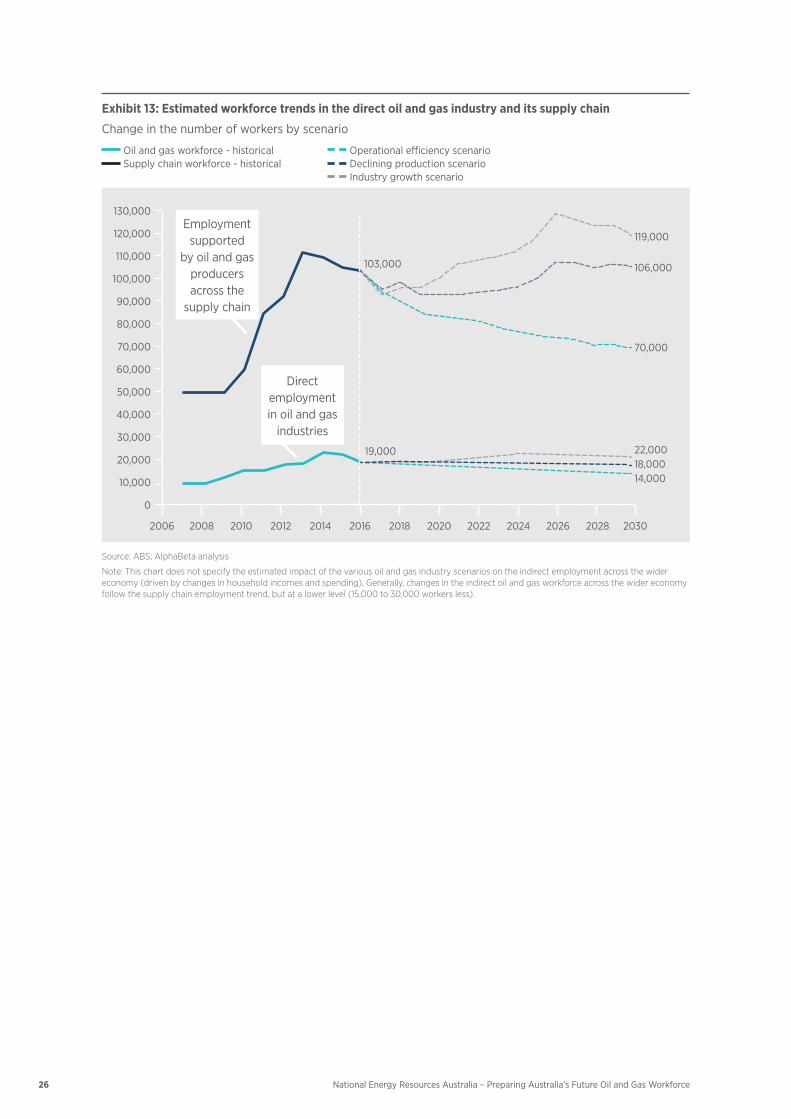
Each scenario implies different challenges for Australia’s oil and gas workforce (see Exhibit 13 and Exhibit 14).
• Inthe‘operational efficiency scenario’ (business as usual), which assumes the oil price remains within a range of US$60 to $80 per barrel and companies continue to use latest technology to make operations more cost-effective, the direct oil and gas workforce would shrink by 1,000 workers, or 5%. However, this slight decline would be offset by growing employment across the supply chain, resulting in a potential net gain of +2,000 new jobs and an increase in the total workforce supported by the oil and gas industry to 212,000 by 2030.
• The‘growth scenario’ assumes that an increase in the oil price to US$100 per barrel or higher and positive policy changes, such as lifting of moratoria, will spur strong production growth. In this case, the total number of jobs supported by the oil and gas industry (including in the supply chain and the wider economy) is expected to increase by 29,000 people, or 14%, to 239,000 in the years to 2030.
• However,asharpdeclineintheoilpricetoaslowasUS$40to$60perbarrelcouldleadtoanegativeemploymentoutcome,asseeninthe‘decline scenario’, which illustrates the risk that the core oil and gas workforce could shrink by 5,000 (26%) in the years to 2030 – with an even more substantial employment decline across the oil and gas supply chain and wider economy.
26 National Energy Resources Australia – Preparing Australia’s Future Oil and Gas Workforce
Exhibit 13: Estimated workforce trends in the direct oil and gas industry and its supply chain
Change in the number of workers by scenario Oil and gas workforce - historical Operational efficiency scenario Supply chain workforce - historical Declining production scenario
Industry growth scenario
Employment supported
by oil and gas producers across the
supply chain
Direct employment in oil and gas
industries
103,000
119,000
106,000
70,000
22,00018,00014,000
19,000
130,000
120,000
110,000
100,000
90,000
80,000
70,000
60,000
50,000
40,000
30,000
20,000
10,000
0
2006 2008 2010 2012 2014 2016 2018 2020 2022 2024 2026 2028 2030
Source: ABS; AlphaBeta analysis
Note: This chart does not specify the estimated impact of the various oil and gas industry scenarios on the indirect employment across the wider economy (driven by changes in household incomes and spending). Generally, changes in the indirect oil and gas workforce across the wider economy follow the supply chain employment trend, but at a lower level (15,000 to 30,000 workers less).

27National Energy Resources Australia – Preparing Australia’s Future Oil and Gas Workforce
Exhibit 14: Estimated employment trends under various oil and gas industry scenarios
Number of workers, 2016 and 2030
Employment generated by O&G in the wider economy Employment generated by O&G in supply chain Direct O&G workforce
2016
Operational Efficiency
2030
Industry Growth
2030
Declining Production
2030
+29,000
138,000
239,000
212,000210,000
70,000
14,000
55,000
98,000
119,000
22,000
88,000
106,000
18,000
88,000
103,000
19,000
Source: ABS; AlphaBeta analysis
Note: Supply chain consists of all industries which supply oil and gas extraction sector or supply those firms which supply oil and gas. Future supply chain and wider economy employment modelled by using historical employment relationships between oil and gas, its supply chain and the wider economy, adjusted for future OandG construction spending and production

28
Three scenarios for the future oil and gas workforce
29National Energy Resources Australia – Preparing Australia’s Future Oil and Gas Workforce
Operational efficiency: companies will need more workers with operational, maintenance and technology skills
SUMMARY • Underthisscenariooilandgascompanieswillcontinuethedeploymentofemergingtechnology
to maximise production efficiency. The oil price is assumed to remain at a moderate level of US$60 to $80 per barrel.
• Thesizeofthefutureoilandgasworkforcewouldbesimilartotoday.Primaryproducerswouldrequire around 1,000 workers less in 2030 compared to 2016, mostly shedding low to medium skilled corporate and production roles such as drillers, project development workers and clerks.
• Thedirectworkforcedeclinewouldbeoffsetbygrowingemploymentinthesupplychainasprimaryfirms would become more competitive and demand more inputs. The result would be a net gain of 2,000 jobs supported by the oil and gas industry in 2030.
• Thetrendtowardsahigherproductionefficiencywouldrequireoilandgasworkerstobecomemoretechnologically adept and improve their operations management skills.
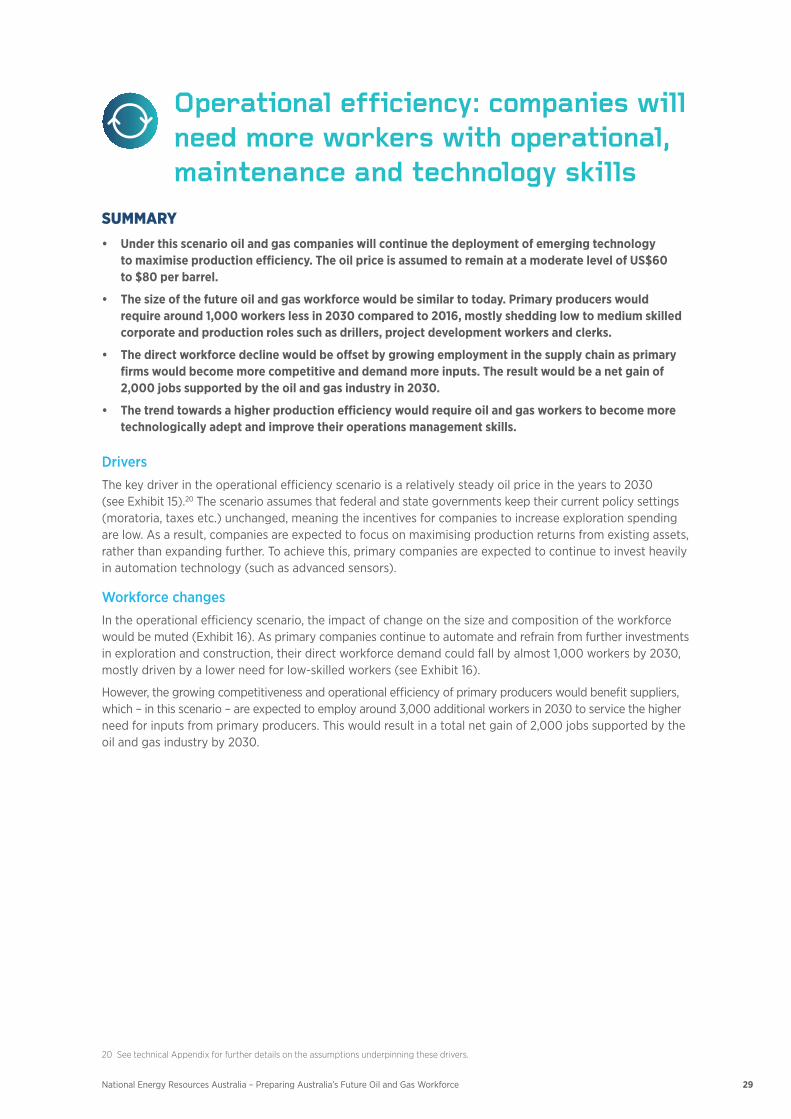
DriversThe key driver in the operational efficiency scenario is a relatively steady oil price in the years to 2030 (see Exhibit 15).20 The scenario assumes that federal and state governments keep their current policy settings (moratoria, taxes etc.) unchanged, meaning the incentives for companies to increase exploration spending are low. As a result, companies are expected to focus on maximising production returns from existing assets, rather than expanding further. To achieve this, primary companies are expected to continue to invest heavily in automation technology (such as advanced sensors).
Workforce changesIntheoperationalefficiencyscenario,theimpactofchangeonthesizeandcompositionoftheworkforcewould be muted (Exhibit 16). As primary companies continue to automate and refrain from further investments in exploration and construction, their direct workforce demand could fall by almost 1,000 workers by 2030, mostly driven by a lower need for low-skilled workers (see Exhibit 16).
However, the growing competitiveness and operational efficiency of primary producers would benefit suppliers, which – in this scenario – are expected to employ around 3,000 additional workers in 2030 to service the higher need for inputs from primary producers. This would result in a total net gain of 2,000 jobs supported by the oil and gas industry by 2030.
20 See technical Appendix for further details on the assumptions underpinning these drivers.
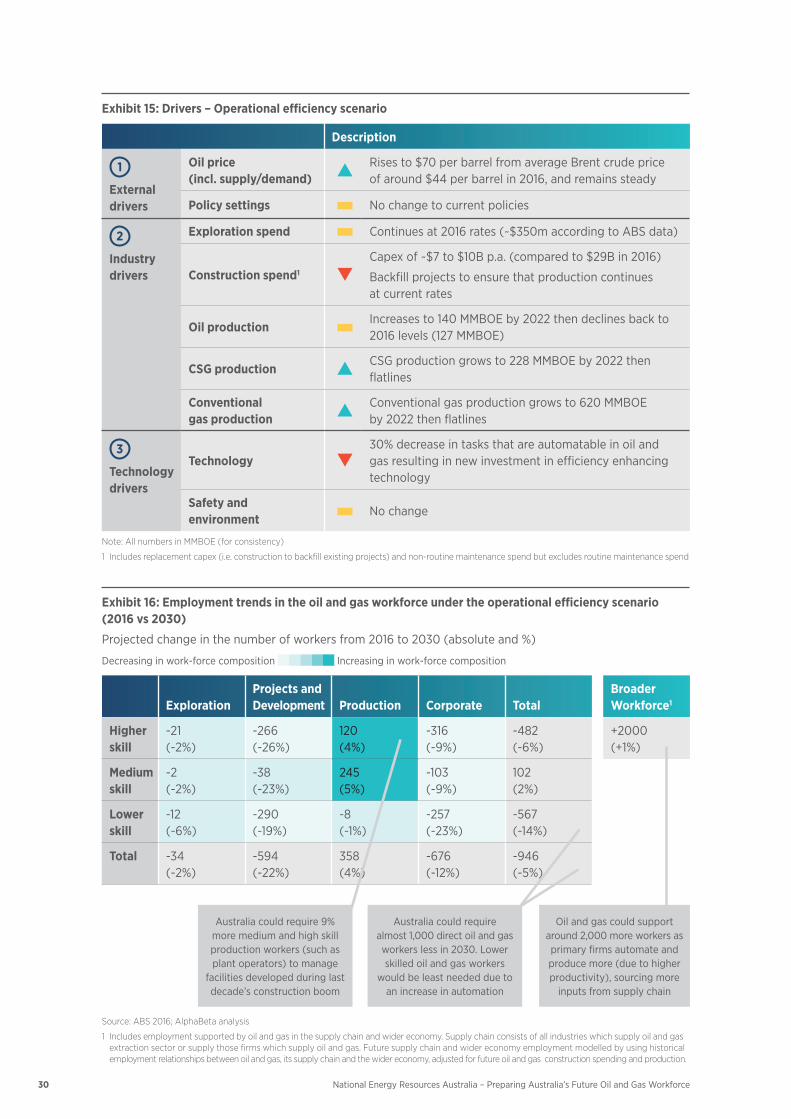
Exhibit 15: Drivers – Operational efficiency scenario
Description
1
External drivers
Oil price (incl. supply/demand)
Rises to $70 per barrel from average Brent crude price of around $44 per barrel in 2016, and remains steady
Policy settings No change to current policies
2
Industry drivers
Exploration spend Continues at 2016 rates (~$350m according to ABS data)
Construction spend1
Capex of ~$7 to $10B p.a. (compared to $29B in 2016)
Backfill projects to ensure that production continues at current rates
Oil productionIncreases to 140 MMBOE by 2022 then declines back to 2016 levels (127 MMBOE)
CSG productionCSG production grows to 228 MMBOE by 2022 then flatlines
Conventional gas production
Conventional gas production grows to 620 MMBOE by 2022 then flatlines
3
Technology drivers
Technology30% decrease in tasks that are automatable in oil and gas resulting in new investment in efficiency enhancing technology
Safety and environment
No change
Note: All numbers in MMBOE (for consistency)
1 Includes replacement capex (i.e. construction to backfill existing projects) and non-routine maintenance spend but excludes routine maintenance spend
Exhibit 16: Employment trends in the oil and gas workforce under the operational efficiency scenario (2016 vs 2030)
Projected change in the number of workers from 2016 to 2030 (absolute and %)
Decreasing in work-force composition Increasing in work-force composition
ExplorationProjects and Development Production Corporate Total
Broader Workforce1
Higher skill
-21 (-2%)
-266 (-26%)
120 (4%)
-316 (-9%)
-482 (-6%)
+2000 (+1%)
Medium skill
-2 (-2%)
-38 (-23%)
245 (5%)
-103 (-9%)
102 (2%)
Lower skill
-12 (-6%)
-290 (-19%)
-8 (-1%)
-257 (-23%)
-567 (-14%)
Total -34 (-2%)
-594 (-22%)
358 (4%)
-676 (-12%)
-946 (-5%)
Australia could require almost 1,000 direct oil and gas workers less in 2030. Lower skilled oil and gas workers
would be least needed due to an increase in automation
Australia could require 9% more medium and high skill production workers (such as plant operators) to manage
facilities developed during last decade’s construction boom
Oil and gas could support around 2,000 more workers as primary firms automate and produce more (due to higher productivity), sourcing more
inputs from supply chain
Source: ABS 2016; AlphaBeta analysis
1 Includes employment supported by oil and gas in the supply chain and wider economy. Supply chain consists of all industries which supply oil and gas extraction sector or supply those firms which supply oil and gas. Future supply chain and wider economy employment modelled by using historical employment relationships between oil and gas, its supply chain and the wider economy, adjusted for future oil and gas construction spending and production.
30 National Energy Resources Australia – Preparing Australia’s Future Oil and Gas Workforce

31National Energy Resources Australia – Preparing Australia’s Future Oil and Gas Workforce
Case study 2: How maintenance roles may change in an operational efficiency scenarioMaintenance technicians are a crucial part of the oil and gas workforce. They ensure
that a plant is running at maximum capacity and that all of its electrical and mechanical equipment are in good condition. A steady rise in new electronic equipment has led to significant growth in electrical and instrumental technician roles, and this trend is expected to continue. However, new technology could significantly shift the day-to-day activities of technicians over the next decade.
Maintenance technicians are typically split into two categories: electrical and instrumental technicians, who maintain monitoring, control and electrical equipment such as metering, power supply and generators and account for about 70% of maintenance roles, and mechanical technicians, who perform maintenance and repairs on equipment such as rotating equipment. Both tend to carry out similar activities: maintenance and testing, fault finding in systems and equipment, modifying, repairing and replacing parts, and preparing reports on the work done.
Historically, maintenance technicians have done a large amount of scheduled routine inspections to ensure equipment is working. In the future, much of that routine maintenance could be supported by robotics and supplemented with predictive maintenance technology. With the rise of advanced sensors and growing amounts of real-time data, workers could be required to only maintain equipment on a case-by-case basis when they receive a data alert. Advances in technology mean maintenance work will likely shift from scheduled routine maintenance to more diagnostic tasks and ad-hoc repairs. However, these changes are likely to have only a small impact on maintenance workers numbers as workers will shift towards more diagnostic activities (Exhibit 17).
Exhibit 17: Potential evolution of maintenance roles, now to 2016 (Production efficiency scenario)
Mechanical
Electrical & Instrumental Tool time (reactive)
Tool time (routine)
Tool time (predictive including diagnosis)
Logs
Permitry
2016 2030 2016 2030
65%
20%
80%
35%
30%
10%
20%
10%
24%
24%
12%
10%
50%
10%
Shift away from field mechanical rolesMaintenance roles will require
much less routine maintenance
32 National Energy Resources Australia – Preparing Australia’s Future Oil and Gas Workforce
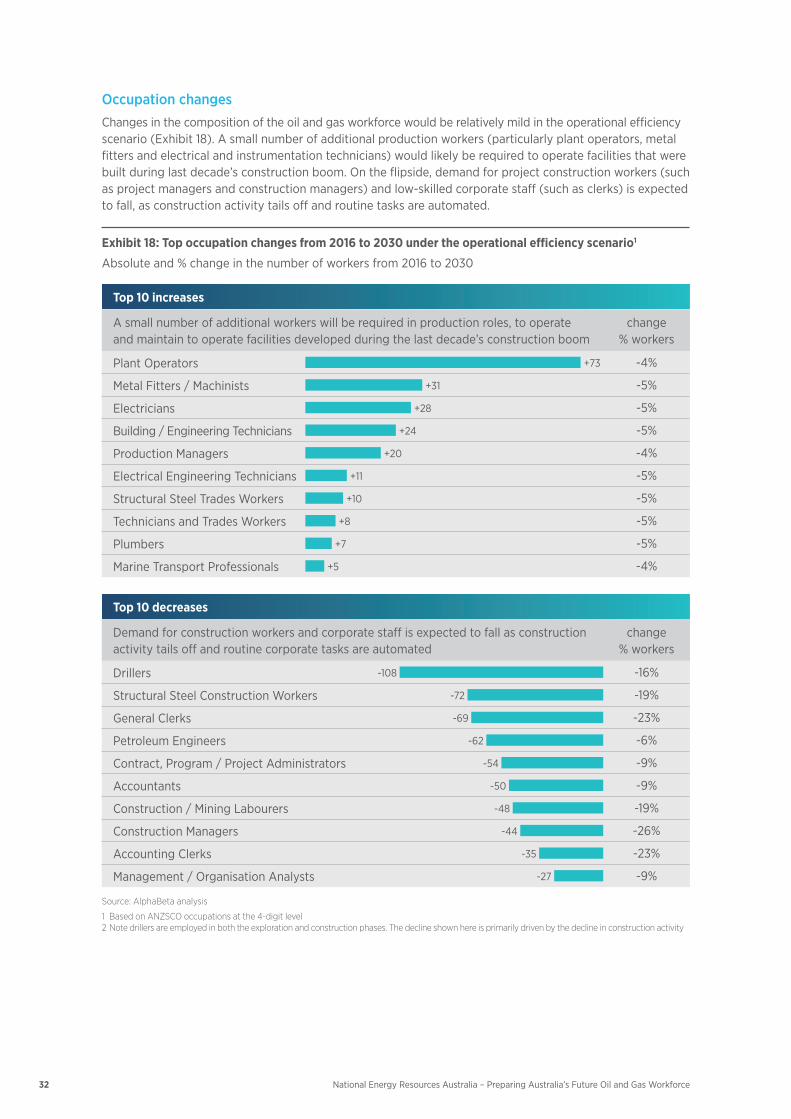
Occupation changesChanges in the composition of the oil and gas workforce would be relatively mild in the operational efficiency scenario (Exhibit 18). A small number of additional production workers (particularly plant operators, metal fitters and electrical and instrumentation technicians) would likely be required to operate facilities that were built during last decade’s construction boom. On the flipside, demand for project construction workers (such as project managers and construction managers) and low-skilled corporate staff (such as clerks) is expected to fall, as construction activity tails off and routine tasks are automated.
Exhibit 18: Top occupation changes from 2016 to 2030 under the operational efficiency scenario1
Absolute and % change in the number of workers from 2016 to 2030
Top 10 increases
A small number of additional workers will be required in production roles, to operate and maintain to operate facilities developed during the last decade’s construction boom
change% workers
Plant Operators +73 -4%
Metal Fitters / Machinists +31 -5%
Electricians +28 -5%
Building / Engineering Technicians +24 -5%
Production Managers +20 -4%
Electrical Engineering Technicians +11 -5%
Structural Steel Trades Workers +10 -5%
Technicians and Trades Workers +8 -5%
Plumbers +7 -5%
Marine Transport Professionals +5 -4%
Top 10 decreases
Demand for construction workers and corporate staff is expected to fall as construction activity tails off and routine corporate tasks are automated
change% workers
Drillers -108 -16%
Structural Steel Construction Workers -72 -19%
General Clerks -69 -23%
Petroleum Engineers -62 -6%
Contract, Program / Project Administrators -54 -9%
Accountants -50 -9%
Construction / Mining Labourers -48 -19%
Construction Managers -44 -26%
Accounting Clerks -35 -23%
Management / Organisation Analysts -27 -9%
Source: AlphaBeta analysis
1 Based on ANZSCO occupations at the 4-digit level2 Note drillers are employed in both the exploration and construction phases. The decline shown here is primarily driven by the decline in construction activity
33National Energy Resources Australia – Preparing Australia’s Future Oil and Gas Workforce
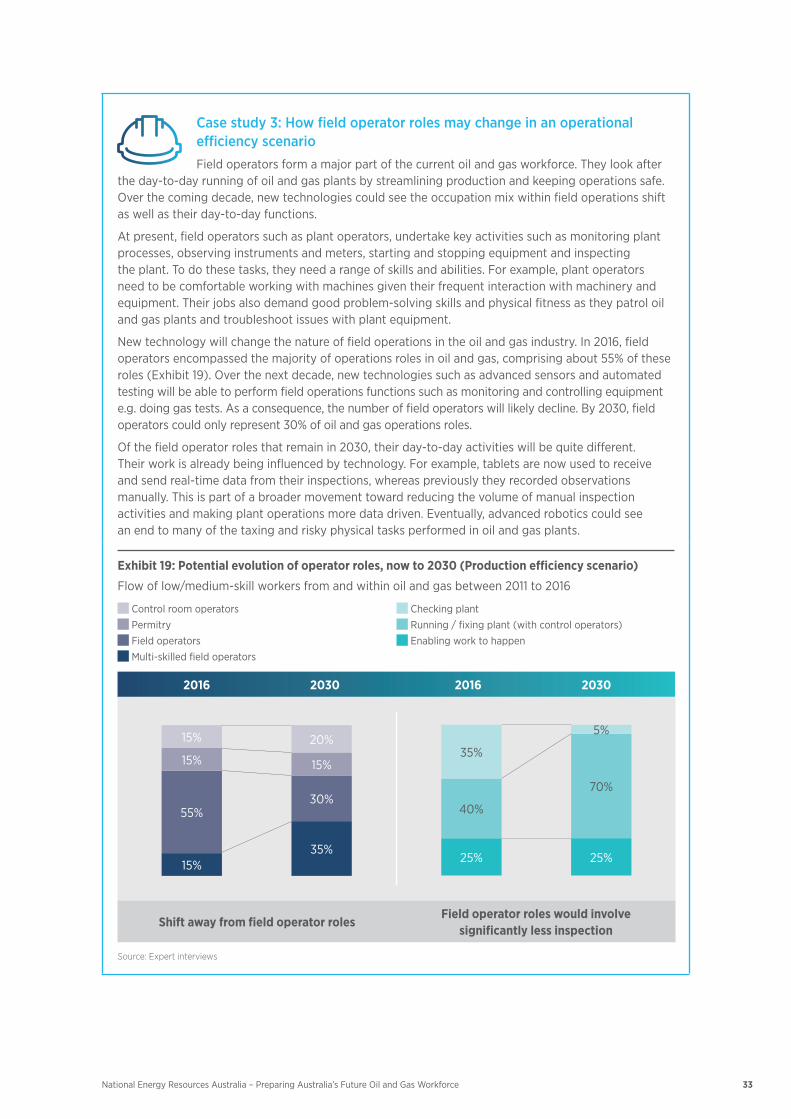
Case study 3: How field operator roles may change in an operational efficiency scenarioField operators form a major part of the current oil and gas workforce. They look after
the day-to-day running of oil and gas plants by streamlining production and keeping operations safe. Over the coming decade, new technologies could see the occupation mix within field operations shift as well as their day-to-day functions.
At present, field operators such as plant operators, undertake key activities such as monitoring plant processes, observing instruments and meters, starting and stopping equipment and inspecting the plant. To do these tasks, they need a range of skills and abilities. For example, plant operators need to be comfortable working with machines given their frequent interaction with machinery and equipment. Their jobs also demand good problem-solving skills and physical fitness as they patrol oil and gas plants and troubleshoot issues with plant equipment.
New technology will change the nature of field operations in the oil and gas industry. In 2016, field operators encompassed the majority of operations roles in oil and gas, comprising about 55% of these roles (Exhibit 19). Over the next decade, new technologies such as advanced sensors and automated testing will be able to perform field operations functions such as monitoring and controlling equipment e.g. doing gas tests. As a consequence, the number of field operators will likely decline. By 2030, field operators could only represent 30% of oil and gas operations roles.
Of the field operator roles that remain in 2030, their day-to-day activities will be quite different. Their work is already being influenced by technology. For example, tablets are now used to receive and send real-time data from their inspections, whereas previously they recorded observations manually. This is part of a broader movement toward reducing the volume of manual inspection activities and making plant operations more data driven. Eventually, advanced robotics could see an end to many of the taxing and risky physical tasks performed in oil and gas plants.
Exhibit 19: Potential evolution of operator roles, now to 2030 (Production efficiency scenario)
Flow of low/medium-skill workers from and within oil and gas between 2011 to 2016
Control room operators
Permitry
Field operators
Multi-skilled field operators
Checking plant
Running / fixing plant (with control operators)
Enabling work to happen
2016 2030 2016 2030
15%
55%
15%
15% 20%
35%
30%
15%
25%
40%
35%
70%
25%
5%
Shift away from field operator rolesField operator roles would involve
significantly less inspection
Source: Expert interviews
34 National Energy Resources Australia – Preparing Australia’s Future Oil and Gas Workforce
In the operational efficiency scenario, core production roles such as plant operator and production manager would remain vital to primary companies, albeit with a shift in skills requirements.
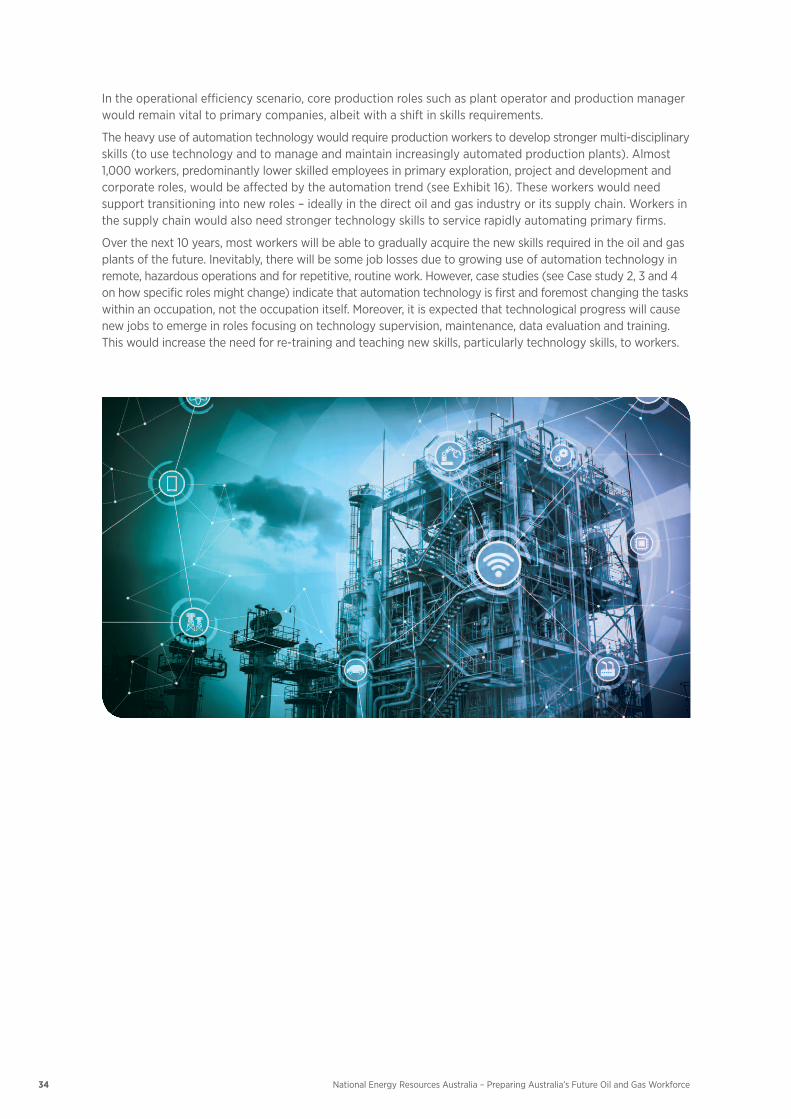
The heavy use of automation technology would require production workers to develop stronger multi-disciplinary skills (to use technology and to manage and maintain increasingly automated production plants). Almost 1,000 workers, predominantly lower skilled employees in primary exploration, project and development and corporate roles, would be affected by the automation trend (see Exhibit 16). These workers would need support transitioning into new roles – ideally in the direct oil and gas industry or its supply chain. Workers in the supply chain would also need stronger technology skills to service rapidly automating primary firms.
Over the next 10 years, most workers will be able to gradually acquire the new skills required in the oil and gas plants of the future. Inevitably, there will be some job losses due to growing use of automation technology in remote,hazardousoperationsandforrepetitive,routinework.However,casestudies(seeCasestudy2,3and4on how specific roles might change) indicate that automation technology is first and foremost changing the tasks within an occupation, not the occupation itself. Moreover, it is expected that technological progress will cause new jobs to emerge in roles focusing on technology supervision, maintenance, data evaluation and training. This would increase the need for re-training and teaching new skills, particularly technology skills, to workers.
35National Energy Resources Australia – Preparing Australia’s Future Oil and Gas Workforce
Industry growth: rapid expansion may lead to a worker shortage and the need to lift workforce skills
SUMMARY • KeyassumptionofthisscenarioisasustainedperiodofexpansionintheAustralianoilandgas
industry, sparked by a strong increase in the oil price to US$100 per barrel or higher and favourable government policies (such as lifting of moratoria).
• Oilandgascompanieswillsubstantiallyincreasetheirexplorationactivitiesandstartnewprojectsinthe North West Shelf and East Coast, lifting overall production levels.
• Thestrongindustryexpansioncouldcreatearound29,000newjobsinthecoreoilandgasworkforceas well as indirectly across the supply chain and wider economy (see Exhibit 13).
• Theexpecteddramaticworkforceincreasecouldleadtoaskillsshortage,particularlyinexplorationand production. To increase the supply in specialist workers and to keep pace with the technological change in the industry, education and training opportunities would need to improve.
DriversThe key drivers in the industry growth scenario are a rising oil price due to strong global demand for LNG, as well as changes to federal and state government policies (such as lifting of CSG moratoria and changes to depreciation rules). Together, these two drivers are expected to encourage primary oil and gas companies to increase their spending on exploration, project development and construction. As a result, Australia’s hydrocarbon production, particularly production of CSG and conventional gas, is expected to soar (see Exhibit 20). This scenario assumes companies will invest in automation technology, particularly to lower exploration and construction costs. Technological progress is expected to reduce the number of automatable tasks performed by workers by 15%.21
Workforce changesThe expected changes that underpin the industry growth scenario would have a strong and positive impact on employment, increasing the total workforce supported by oil and gas to 29,000 in 2030 (see Exhibit 21). In this scenario, the direct oil and gas workforce could grow by around 3,000 workers by 2030, with the largest growth in medium and high skill production workers such as plant operators and petroleum engineers (increase of 27%, or more than 700 workers, as seen in Exhibit 21). Demand for highly skilled exploration workers, such as geologists and geophysicists, could increase by nearly 300, or 24%, as companies invest more heavily in exploration (Exhibit 21).
A substantial expansion of primary oil and gas production would have a large economic knock-on effect. This growth scenario assumes that the indirect oil and gas workforce – people sustained by the oil and gas industry in the supply chain and wider economy – could increase by 26,000 in the years to 2030, resulting in a total 29,000 additional jobs supported by the oil and gas industry. The strong indirect employment growth would be fuelled by the primary producer’s growing demand of production inputs, which would likely cause suppliers to hire additional workers. The expected increase in household spending power would stimulate further growth and jobs in the wider economy. At the peak of construction activity, potentially around 2024, the oil and gas industry in this scenario would be expected to employ a large temporary workforce of around 10,000 construction and support workers.
21 The decrease is not as pronounced as the operational efficiency scenario. In that scenario, it is assumed that companies will be even more focused on improving production efficiencies because of the flat oil price and unchanged government policies and thus invest more heavily in automation technologies.

36 National Energy Resources Australia – Preparing Australia’s Future Oil and Gas Workforce
Exhibit 20: Drivers – Industry growth scenario
Description
1
External drivers
Oil price (incl. supply/demand)
Steady increase to 2021
Peaks at $100 per barrel, starts to decrease in 2024
Policy settingsPositive policy changes including lifting moratoria, improving accelerated depreciation rules, ringfencing etc
2
Industry drivers
Exploration spendIncreases from $350m to $1.1B in 2021 then decreases to $550m in 2030
Construction spend1
Strong forecast spend (~$15B a year) $120B ($90B conventional, $30B unconventional) spend from 2018 to 2024 (albeit a decline compared to $29B in 2016) Further $60B to 2030
Oil production 30% increase over 2016 levels by 2030
CSG production 50% increase over 2016 levels by 2030
Conventional gas production
Conventional gas production increases ~90% from 417 MMBOE in 2016 to 816 MMBOE in 2030
3
Technology drivers
Technology15% decrease in tasks that are automatable resulting in new investment in efficiency enhancing technology
Safety and environment
No change
Note: All numbers in MMBOE (for consistency)
1 Includes replacement capex (i.e. construction to backfill existing projects) and non-routine maintenance spend but excludes routine maintenance spend
Exhibit 21: Employment trends in Australia’s oil and gas workforce under the industry growth scenario (2016 vs 2030)
Projected change in the number of workers from 2016 to 2030 (absolute and %)
Decreasing in work-force composition Increasing in work-force composition
ExplorationProjects and Development Production Corporate Total
Broader Workforce1
Higher skill
294 (24%)
-196 (-19%)
721 (27%)
404 (12%)
1,223 (15%)
+29,000 (+14%)
Medium skill
16 (16%)
-28 (-16%)
1,393 (26%)
164 (15%)
1,545 (23%)
Lower skill
52 (26%)
-207 (-14%)
291 (27%)
6 (1%)
143 (4%)
Total 361 (24%)
-431 (-16%)
2,406 (26%)
574 (10%)
2,910 (15%)
Australia could require around 2,100 more medium
and high skill production workers (e.g. plant operators,
petroleum engineers) to operate newly developed
facilities
Australia could require 24% more high-skill exploration workers (e.g. geologists) to capitalise on new
exploration technologies and investment
Oil and gas industries will support around 29,000 more workers
as primary firms produce more, sourcing more inputs from supply chain and as additional workers in primary firms stimulate jobs growth in the wider economy
Source: ABS 2016; AlphaBeta analysis
1 Includes employment supported by oil and gas in the supply chain and wider economy. Supply chain consists of all industries which supply oil and gas extraction sector or supply those firms which supply oil and gas. Future supply chain and wider economy employment modelled by using historical employment relationships between oil and gas, its supply chain and the wider economy, adjusted for future OandG construction spending and production.
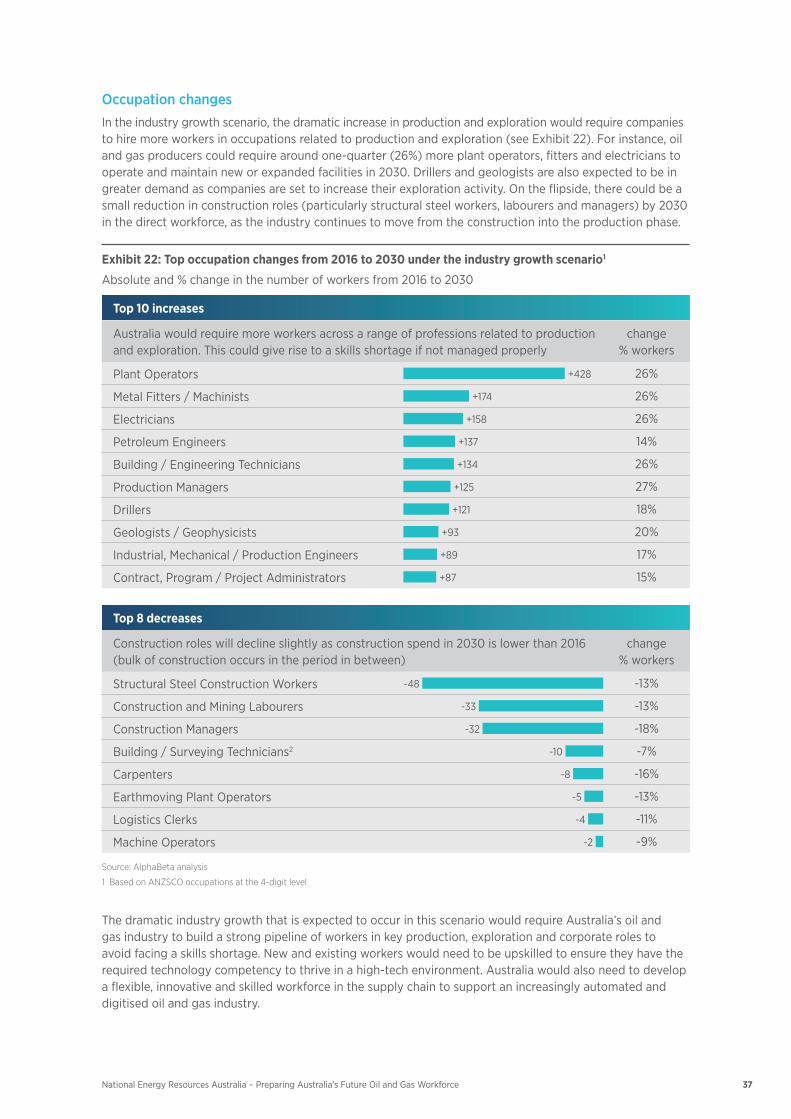
37National Energy Resources Australia – Preparing Australia’s Future Oil and Gas Workforce
Occupation changesIn the industry growth scenario, the dramatic increase in production and exploration would require companies to hire more workers in occupations related to production and exploration (see Exhibit 22). For instance, oil and gas producers could require around one-quarter (26%) more plant operators, fitters and electricians to operate and maintain new or expanded facilities in 2030. Drillers and geologists are also expected to be in greater demand as companies are set to increase their exploration activity. On the flipside, there could be a small reduction in construction roles (particularly structural steel workers, labourers and managers) by 2030 in the direct workforce, as the industry continues to move from the construction into the production phase.
Exhibit 22: Top occupation changes from 2016 to 2030 under the industry growth scenario1
Absolute and % change in the number of workers from 2016 to 2030
Top 10 increases
Australia would require more workers across a range of professions related to production and exploration. This could give rise to a skills shortage if not managed properly
change% workers
Plant Operators +428 26%
Metal Fitters / Machinists +174 26%
Electricians +158 26%
Petroleum Engineers +137 14%
Building / Engineering Technicians +134 26%
Production Managers +125 27%
Drillers +121 18%
Geologists / Geophysicists +93 20%
Industrial, Mechanical / Production Engineers +89 17%
Contract, Program / Project Administrators +87 15%
Top 8 decreases
Construction roles will decline slightly as construction spend in 2030 is lower than 2016 (bulk of construction occurs in the period in between)
change% workers
Structural Steel Construction Workers -48 -13%
Construction and Mining Labourers -33 -13%
Construction Managers -32 -18%
Building / Surveying Technicians2 -10 -7%
Carpenters -8 -16%
Earthmoving Plant Operators -5 -13%
Logistics Clerks -4 -11%
Machine Operators -2 -9%
Source: AlphaBeta analysis
1 Based on ANZSCO occupations at the 4-digit level
The dramatic industry growth that is expected to occur in this scenario would require Australia’s oil and gas industry to build a strong pipeline of workers in key production, exploration and corporate roles to avoid facing a skills shortage. New and existing workers would need to be upskilled to ensure they have the required technology competency to thrive in a high-tech environment. Australia would also need to develop a flexible, innovative and skilled workforce in the supply chain to support an increasingly automated and digitised oil and gas industry.
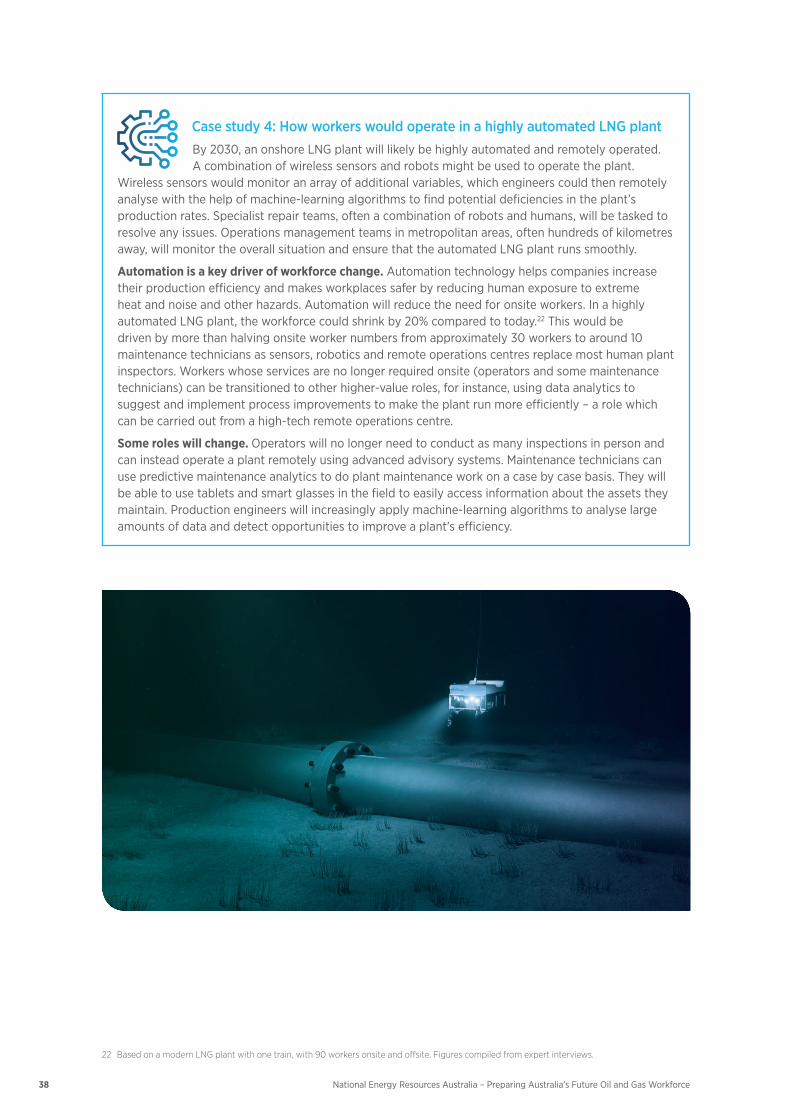
38 National Energy Resources Australia – Preparing Australia’s Future Oil and Gas Workforce
Case study 4: How workers would operate in a highly automated LNG plant By 2030, an onshore LNG plant will likely be highly automated and remotely operated. A combination of wireless sensors and robots might be used to operate the plant.
Wireless sensors would monitor an array of additional variables, which engineers could then remotely analyse with the help of machine-learning algorithms to find potential deficiencies in the plant’s production rates. Specialist repair teams, often a combination of robots and humans, will be tasked to resolve any issues. Operations management teams in metropolitan areas, often hundreds of kilometres away, will monitor the overall situation and ensure that the automated LNG plant runs smoothly.
Automation is a key driver of workforce change. Automation technology helps companies increase their production efficiency and makes workplaces safer by reducing human exposure to extreme heatandnoiseandotherhazards.Automationwillreducetheneedforonsiteworkers.Inahighlyautomated LNG plant, the workforce could shrink by 20% compared to today.22 This would be driven by more than halving onsite worker numbers from approximately 30 workers to around 10 maintenance technicians as sensors, robotics and remote operations centres replace most human plant inspectors. Workers whose services are no longer required onsite (operators and some maintenance technicians) can be transitioned to other higher-value roles, for instance, using data analytics to suggest and implement process improvements to make the plant run more efficiently – a role which can be carried out from a high-tech remote operations centre.
Some roles will change. Operators will no longer need to conduct as many inspections in person and can instead operate a plant remotely using advanced advisory systems. Maintenance technicians can use predictive maintenance analytics to do plant maintenance work on a case by case basis. They will be able to use tablets and smart glasses in the field to easily access information about the assets they maintain. Production engineers will increasingly apply machine-learning algorithms to analyse large amounts of data and detect opportunities to improve a plant’s efficiency.
22 Based on a modern LNG plant with one train, with 90 workers onsite and offsite. Figures compiled from expert interviews.
39National Energy Resources Australia – Preparing Australia’s Future Oil and Gas Workforce
Production decline: downturn could require a large number of workers to leave the industry
SUMMARY• ThisscenarioassumesachallengingfutureforAustralia’soilandgasindustry,markedbyapotentialoil
price decline to as low as US$40 to 60 per barrel and a continuation of current industry policy settings (such as exploration moratoria), which would discourage further exploration and construction spending.
• Thedirectoilandgasworkforceisassumedtodeclinebyasmuchas5,000jobs,or26%,ascompaniesshed corporate and production roles. The assumed downturn in the oil and gas industry would cause further job losses in the supply chain and wider economy.
• Theassumedproductiondeclinewouldrequireindustryandgovernmentstoincreasetheirsupportfora large number of workers who would need to find employment outside the oil and gas industry.
DriversThe key assumption and driver of change in the production decline scenario is a sustained, dramatic decline in the oil price to as low as US$40 to $60 per barrel. Such a fall could occur if major rivalling oil and gas producers Qatar, USA, and East Africa were to significantly increase their output (Exhibit 23). The scenario also assumes that federal and state governments leave their current industry policies unchanged (for example, keeping CSG moratoria, depreciation, ring-fencing and other constraints in place), which would dampen incentives for oil and gas companies to increase their exploration and construction spending. As a result, the industry may enter a period of contraction. Companies could halve their capital expenditure and decide to merely invest in maintaining existing assets (around A$3 to $5 billion per annum). Industry-wide exploration spending is estimated to steadily decline in this scenario, likely falling to A$250 million by 2030, from around A$350 million in 2016. It is assumed that companies continue to invest in efficiency-increasing automation technology, which in this scenario could take over 20% of repetitive, routine tasks from human workers by 2030 (see Exhibit 23).23
The falling oil price would hurt all hydrocarbon producers in Australia. The CSG industry could be particularly affected by the potential decline in profitability due to the high ongoing cost required to sustain falling production;CSGproductionmayhalvefrom200to100MMBOE over this period. Conventional gas producers, which typically face longer production cycles and lower ongoing production costs compared to CSG producers, would be least affected with an annual expected output decline of only 2%.
23 The decrease is not as pronounced as the operational efficiency scenario, as declining profitability in the industry decline scenario is likely to limit the ability and inclination of primary companies to invest as heavily in automation technologies.
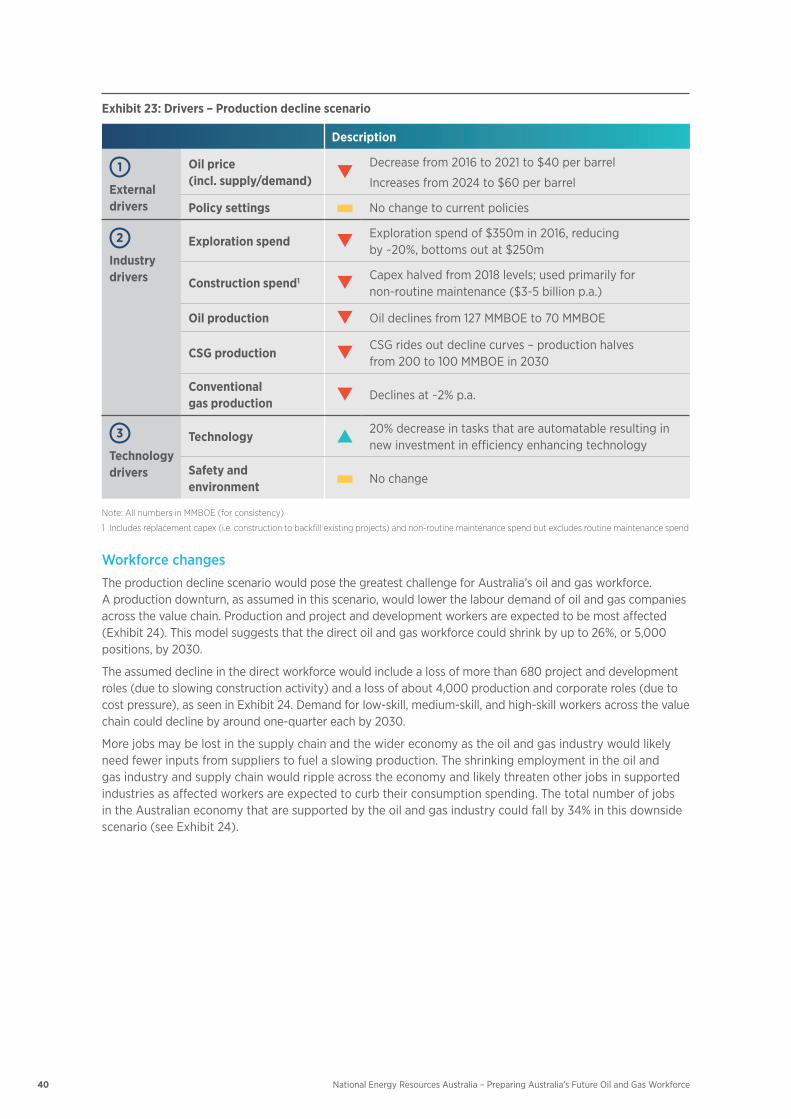
40 National Energy Resources Australia – Preparing Australia’s Future Oil and Gas Workforce
Exhibit 23: Drivers – Production decline scenario
Description
1
External drivers
Oil price (incl. supply/demand)
Decrease from 2016 to 2021 to $40 per barrel
Increases from 2024 to $60 per barrel
Policy settings No change to current policies
2
Industry drivers
Exploration spendExploration spend of $350m in 2016, reducing by ~20%, bottoms out at $250m
Construction spend1 Capexhalvedfrom2018levels;usedprimarilyfor non-routine maintenance ($3-5 billion p.a.)
Oil production Oil declines from 127 MMBOE to 70 MMBOE
CSG productionCSG rides out decline curves – production halves from 200 to 100 MMBOE in 2030
Conventional gas production
Declines at ~2% p.a.
3
Technology drivers
Technology20% decrease in tasks that are automatable resulting in new investment in efficiency enhancing technology
Safety and environment
No change
Note: All numbers in MMBOE (for consistency)
1 Includes replacement capex (i.e. construction to backfill existing projects) and non-routine maintenance spend but excludes routine maintenance spend
Workforce changesThe production decline scenario would pose the greatest challenge for Australia’s oil and gas workforce. A production downturn, as assumed in this scenario, would lower the labour demand of oil and gas companies across the value chain. Production and project and development workers are expected to be most affected (Exhibit 24). This model suggests that the direct oil and gas workforce could shrink by up to 26%, or 5,000 positions, by 2030.
The assumed decline in the direct workforce would include a loss of more than 680 project and development roles (due to slowing construction activity) and a loss of about 4,000 production and corporate roles (due to cost pressure), as seen in Exhibit 24. Demand for low-skill, medium-skill, and high-skill workers across the value chain could decline by around one-quarter each by 2030.
More jobs may be lost in the supply chain and the wider economy as the oil and gas industry would likely need fewer inputs from suppliers to fuel a slowing production. The shrinking employment in the oil and gas industry and supply chain would ripple across the economy and likely threaten other jobs in supported industries as affected workers are expected to curb their consumption spending. The total number of jobs in the Australian economy that are supported by the oil and gas industry could fall by 34% in this downside scenario (see Exhibit 24).
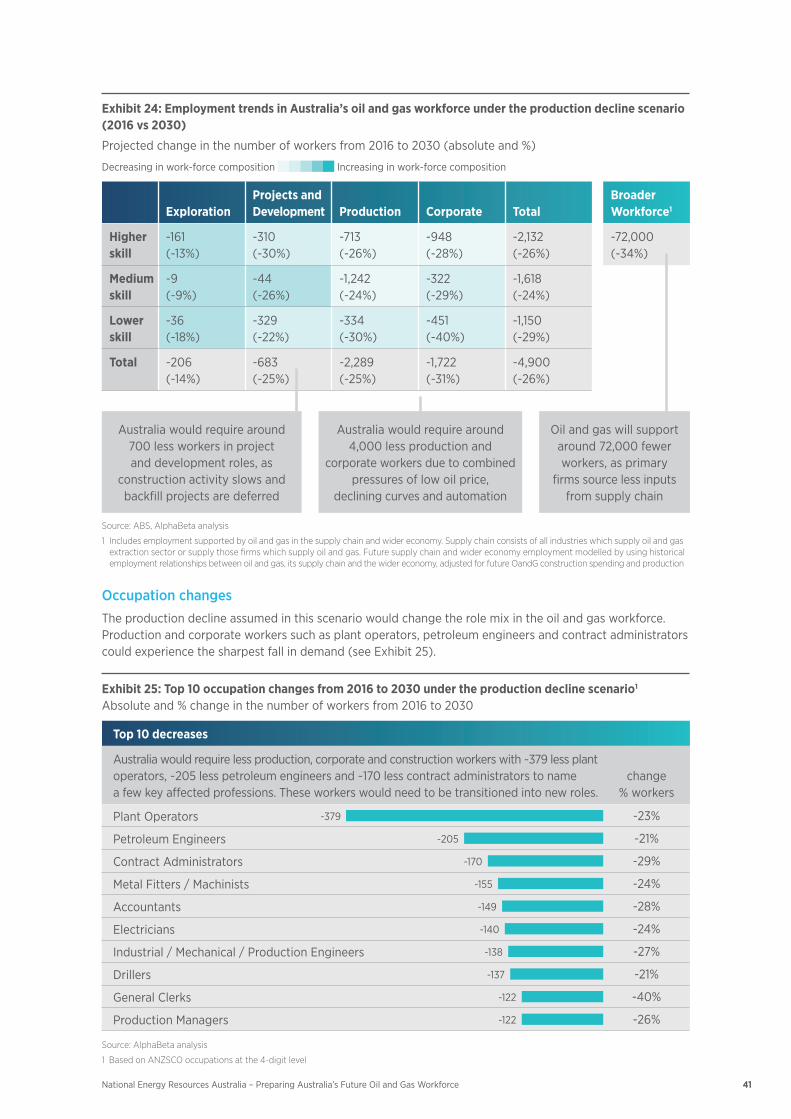
41National Energy Resources Australia – Preparing Australia’s Future Oil and Gas Workforce
Exhibit 24: Employment trends in Australia’s oil and gas workforce under the production decline scenario (2016 vs 2030)
Projected change in the number of workers from 2016 to 2030 (absolute and %)
Decreasing in work-force composition Increasing in work-force composition
ExplorationProjects and Development Production Corporate Total
Broader Workforce1
Higher skill
-161 (-13%)
-310 (-30%)
-713 (-26%)
-948 (-28%)
-2,132 (-26%)
-72,000 (-34%)
Medium skill
-9 (-9%)
-44 (-26%)
-1,242 (-24%)
-322 (-29%)
-1,618 (-24%)
Lower skill
-36 (-18%)
-329 (-22%)
-334 (-30%)
-451 (-40%)
-1,150 (-29%)
Total -206 (-14%)
-683 (-25%)
-2,289 (-25%)
-1,722 (-31%)
-4,900 (-26%)
Australia would require around 4,000 less production and
corporate workers due to combined pressures of low oil price,
declining curves and automation
Australia would require around 700 less workers in project and development roles, as
construction activity slows and backfill projects are deferred
Oil and gas will support around 72,000 fewer workers, as primary
firms source less inputs from supply chain
Source: ABS, AlphaBeta analysis
1 Includes employment supported by oil and gas in the supply chain and wider economy. Supply chain consists of all industries which supply oil and gas extraction sector or supply those firms which supply oil and gas. Future supply chain and wider economy employment modelled by using historical employment relationships between oil and gas, its supply chain and the wider economy, adjusted for future OandG construction spending and production
Occupation changesThe production decline assumed in this scenario would change the role mix in the oil and gas workforce. Production and corporate workers such as plant operators, petroleum engineers and contract administrators could experience the sharpest fall in demand (see Exhibit 25).
Exhibit 25: Top 10 occupation changes from 2016 to 2030 under the production decline scenario1
Absolute and % change in the number of workers from 2016 to 2030
Top 10 decreases
Australia would require less production, corporate and construction workers with ~379 less plant operators, ~205 less petroleum engineers and ~170 less contract administrators to name a few key affected professions. These workers would need to be transitioned into new roles.
change% workers
Plant Operators -379 -23%
Petroleum Engineers -205 -21%
Contract Administrators -170 -29%
Metal Fitters / Machinists -155 -24%
Accountants -149 -28%
Electricians -140 -24%
Industrial / Mechanical / Production Engineers -138 -27%
Drillers -137 -21%
General Clerks -122 -40%
Production Managers -122 -26%
Source: AlphaBeta analysis
1 Based on ANZSCO occupations at the 4-digit level
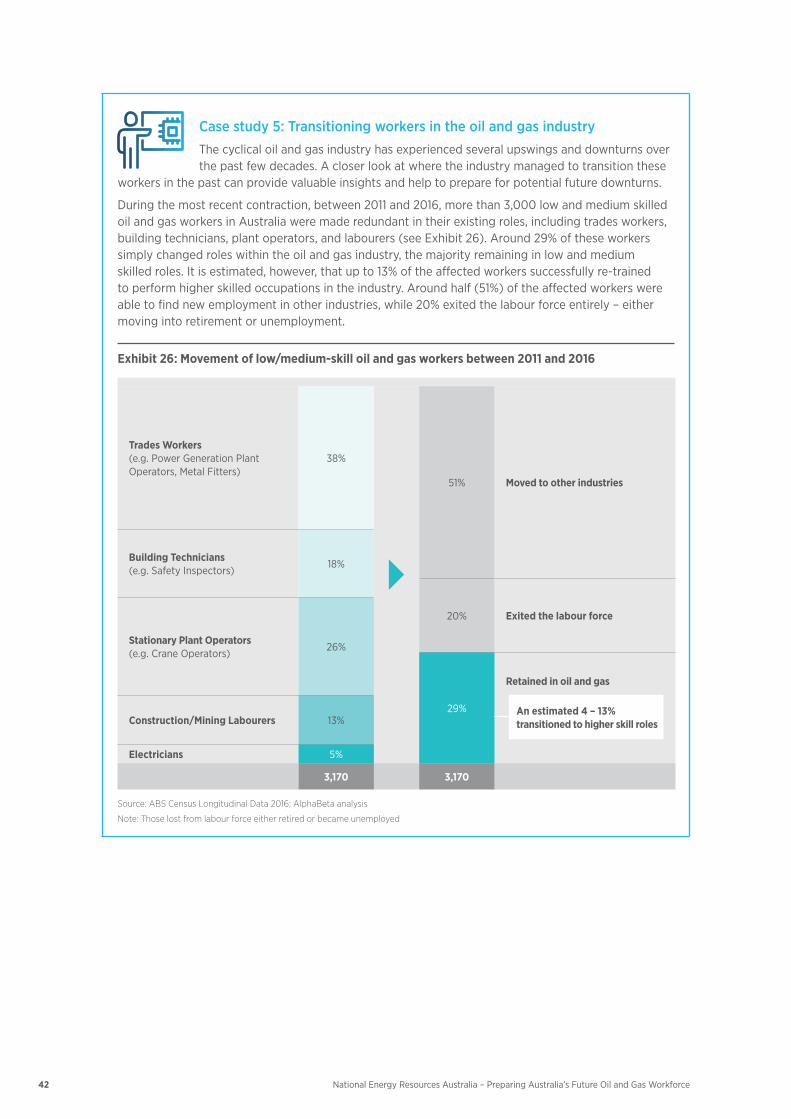
42 National Energy Resources Australia – Preparing Australia’s Future Oil and Gas Workforce
Case study 5: Transitioning workers in the oil and gas industry The cyclical oil and gas industry has experienced several upswings and downturns over the past few decades. A closer look at where the industry managed to transition these
workers in the past can provide valuable insights and help to prepare for potential future downturns.
During the most recent contraction, between 2011 and 2016, more than 3,000 low and medium skilled oil and gas workers in Australia were made redundant in their existing roles, including trades workers, building technicians, plant operators, and labourers (see Exhibit 26). Around 29% of these workers simply changed roles within the oil and gas industry, the majority remaining in low and medium skilled roles. It is estimated, however, that up to 13% of the affected workers successfully re-trained to perform higher skilled occupations in the industry. Around half (51%) of the affected workers were able to find new employment in other industries, while 20% exited the labour force entirely – either moving into retirement or unemployment.
Exhibit 26: Movement of low/medium-skill oil and gas workers between 2011 and 2016
Trades Workers (e.g. Power Generation Plant Operators, Metal Fitters)
38%
51% Moved to other industries
Building Technicians (e.g. Safety Inspectors)
18%
20% Exited the labour force
Stationary Plant Operators (e.g. Crane Operators)
26%
29%
Retained in oil and gas
An estimated 4 – 13% transitioned to higher skill rolesConstruction/Mining Labourers 13%
Electricians 5%
3,170 3,170
Source: ABS Census Longitudinal Data 2016; AlphaBeta analysis
Note: Those lost from labour force either retired or became unemployed
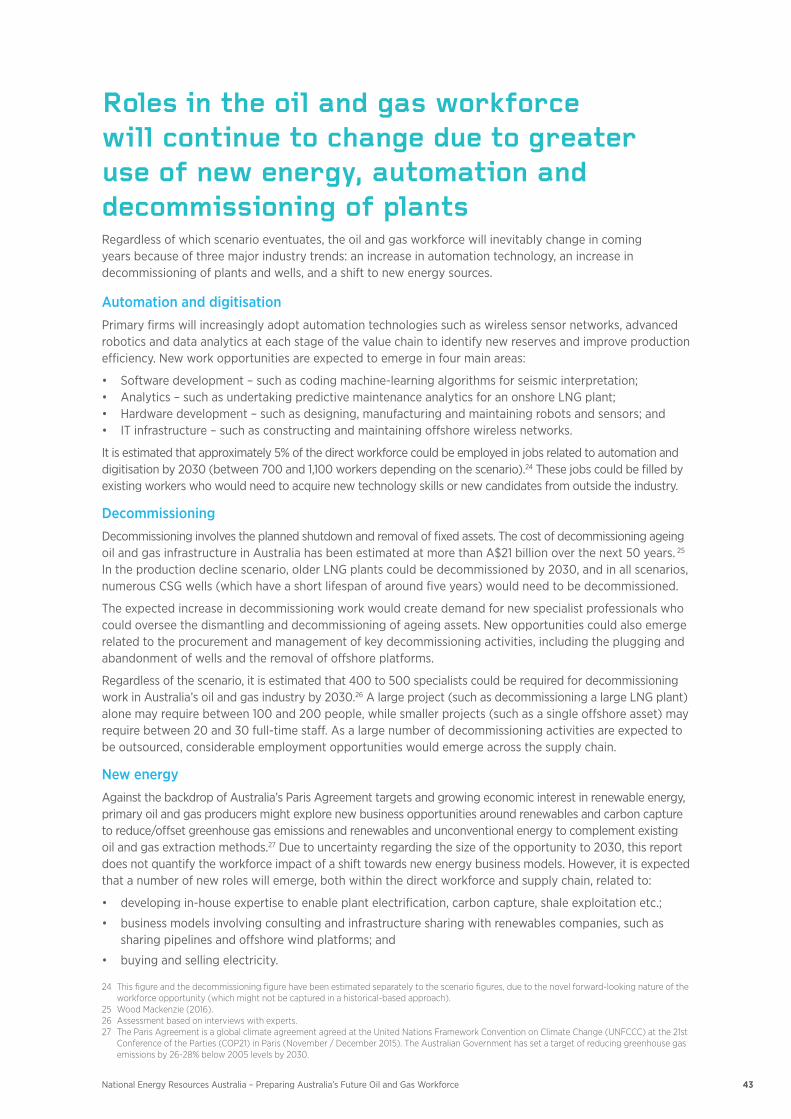
43National Energy Resources Australia – Preparing Australia’s Future Oil and Gas Workforce
Roles in the oil and gas workforce will continue to change due to greater use of new energy, automation and decommissioning of plants Regardless of which scenario eventuates, the oil and gas workforce will inevitably change in coming years because of three major industry trends: an increase in automation technology, an increase in decommissioning of plants and wells, and a shift to new energy sources.
Automation and digitisationPrimary firms will increasingly adopt automation technologies such as wireless sensor networks, advanced robotics and data analytics at each stage of the value chain to identify new reserves and improve production efficiency. New work opportunities are expected to emerge in four main areas:
• Softwaredevelopment–suchascodingmachine-learningalgorithmsforseismicinterpretation;• Analytics–suchasundertakingpredictivemaintenanceanalyticsforanonshoreLNGplant;• Hardwaredevelopment–suchasdesigning,manufacturingandmaintainingrobotsandsensors;and• ITinfrastructure–suchasconstructingandmaintainingoffshorewirelessnetworks.
It is estimated that approximately 5% of the direct workforce could be employed in jobs related to automation and digitisation by 2030 (between 700 and 1,100 workers depending on the scenario).24 These jobs could be filled by existing workers who would need to acquire new technology skills or new candidates from outside the industry.
DecommissioningDecommissioning involves the planned shutdown and removal of fixed assets. The cost of decommissioning ageing oil and gas infrastructure in Australia has been estimated at more than A$21 billion over the next 50 years. 25 In the production decline scenario, older LNG plants could be decommissioned by 2030, and in all scenarios, numerous CSG wells (which have a short lifespan of around five years) would need to be decommissioned.
The expected increase in decommissioning work would create demand for new specialist professionals who could oversee the dismantling and decommissioning of ageing assets. New opportunities could also emerge related to the procurement and management of key decommissioning activities, including the plugging and abandonment of wells and the removal of offshore platforms.
Regardless of the scenario, it is estimated that 400 to 500 specialists could be required for decommissioning work in Australia’s oil and gas industry by 2030.26 A large project (such as decommissioning a large LNG plant) alone may require between 100 and 200 people, while smaller projects (such as a single offshore asset) may require between 20 and 30 full-time staff. As a large number of decommissioning activities are expected to be outsourced, considerable employment opportunities would emerge across the supply chain.
New energy Against the backdrop of Australia’s Paris Agreement targets and growing economic interest in renewable energy, primary oil and gas producers might explore new business opportunities around renewables and carbon capture to reduce/offset greenhouse gas emissions and renewables and unconventional energy to complement existing oil and gas extraction methods.27Duetouncertaintyregardingthesizeoftheopportunityto2030,thisreportdoes not quantify the workforce impact of a shift towards new energy business models. However, it is expected that a number of new roles will emerge, both within the direct workforce and supply chain, related to:
• developingin-houseexpertisetoenableplantelectrification,carboncapture,shaleexploitationetc.;
• businessmodelsinvolvingconsultingandinfrastructuresharingwithrenewablescompanies,suchassharingpipelinesandoffshorewindplatforms;and
• buyingandsellingelectricity.
24 This figure and the decommissioning figure have been estimated separately to the scenario figures, due to the novel forward-looking nature of the workforce opportunity (which might not be captured in a historical-based approach).
25 Wood Mackenzie (2016). 26 Assessment based on interviews with experts.27 The Paris Agreement is a global climate agreement agreed at the United Nations Framework Convention on Climate Change (UNFCCC) at the 21st
Conference of the Parties (COP21) in Paris (November / December 2015). The Australian Government has set a target of reducing greenhouse gas emissions by 26-28% below 2005 levels by 2030.

How NERA will use these scenarios
44
45National Energy Resources Australia – Preparing Australia’s Future Oil and Gas Workforce
NERA, as an Industry Growth Centre, has a mandate to grow collaboration and innovation across the energy resources sector to build a strong workforce with relevant skills for changing times. As part of its role, NERA informs the sector on future workforce trends and expected skill needs. It liaises with education and training providers to support them in building relevant curricula and increasing the number of job-ready graduates. NERA also gives strategic advice and supports initiatives aimed at transitioning workers through periods of volatility and economic and technological disruption.
This report is a further step towards developing a common expectation about the potential trajectory of the workforce in the oil and gas industry. It provides a starting point for a collaborative discussion, as stakeholders prepare their business and workforce strategies for an uncertain future.
Informing the sector of potential workforce changeSince the end of the investment boom, there has been limited thinking at a sectoral level about how the oil and gas workforce could evolve over the next decade and what this might mean for future skills and transition requirements. This report aims to help bridge this gap by outlining the range of plausible workforce scenarios. It estimates, based on historical trends, how the occupational composition of the oil and gas workforce in Australia might change by 2030, and why.
An online occupation tool is available to use on the NERA website which will provide all workers in the industry with an opportunity to see how different occupations have changed over time and how they could evolve in future. This will help workers in the industry to better manage their own careers and allow industry stakeholders to manage their workforces. This free tool is available on NERA’s website www.nera.org.au.
Preparing the sector for a variety of outcomesDesigned as a scenario-planning tool, this report seeks to help the oil and gas industry in Australia prepare for the future. It offers a helpful guide, as companies assess how to recruit workers in coming years, which skills these workers should bring and where workers may need support to transition into new roles.
NERA will use the three scenarios outlined in this report to engage with industry and education providers on three skills-related questions:
• How can education and training providers ensure they are developing an appropriate pipeline of skills for the future? As this report shows, more workers may be needed with technology and decommissioning skills, and education and training providers would need to respond to these trends.
• Which key skills will the current workforce require? As this report shows, the need for technologically adept workers with operations and maintenance skills is set to grow. Companies, and education and training providers need to ensure the current workforce is acquiring these relevant skills, which would allow them to transition into new roles as the industry is changing.
• What support do current workers need to master periods of change driven by economic and technological trends? As this report shows, external factors that are beyond the control of the industry, may cause a slowdown or even decline in business. In this case, workers would need strong support to transition into new employment outside of the industry.
NERA is committed to ensure that Australia’s oil and gas workforce remains as agile and flexible as possible as potential scenarios of workforce and industry change eventuate. By working with key stakeholders in the oil and gas industry on the key issues outlined above, NERA is meeting its mandate and mission to help ensure ongoing industry growth.
Assisting firms in the industry to collaborate and plan for the futureOne of the key learnings from the previous period of oil and gas investment has been the crucial need for collaboration on workforce planning issues to increase efficiency and industry productivity. NERA will use these scenarios as a starting point to discuss potential outcomes with industry and build a consensus on a potential path forward. Issues that should be discussed include:
• Co-operationonkeyoperationalstandardstode-bottleneckindustry(e.g.shutdowns)• Arrangementwiththesupplychaintodevelopamoreflexibleandintegratedcontractingmodel• Workingwithgovernment,communityandotherstakeholderstomaintainsociallicense• Commonstandardsoftrainingandcompetenciesacrossdisciplines(e.g.newLNGframework)

Technical Appendix
46
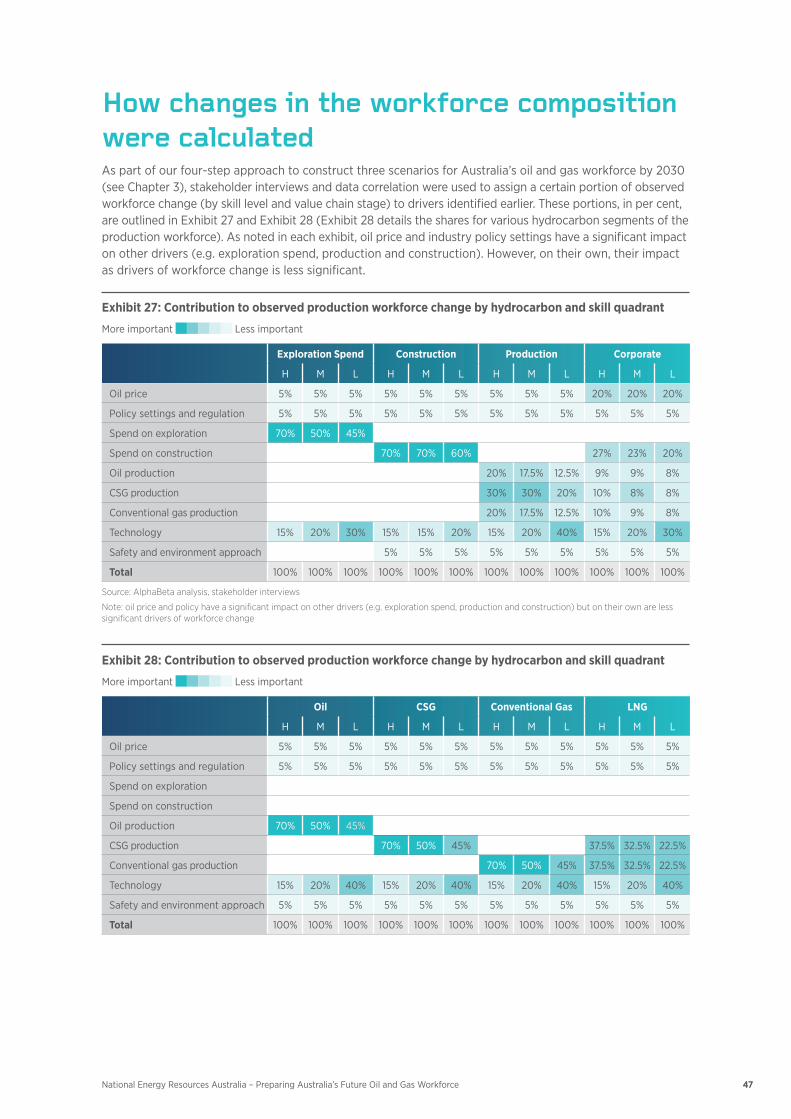
47National Energy Resources Australia – Preparing Australia’s Future Oil and Gas Workforce
How changes in the workforce composition were calculatedAs part of our four-step approach to construct three scenarios for Australia’s oil and gas workforce by 2030 (see Chapter 3), stakeholder interviews and data correlation were used to assign a certain portion of observed workforce change (by skill level and value chain stage) to drivers identified earlier. These portions, in per cent, are outlined in Exhibit 27 and Exhibit 28 (Exhibit 28 details the shares for various hydrocarbon segments of the production workforce). As noted in each exhibit, oil price and industry policy settings have a significant impact on other drivers (e.g. exploration spend, production and construction). However, on their own, their impact as drivers of workforce change is less significant.
Exhibit 27: Contribution to observed production workforce change by hydrocarbon and skill quadrant
More important Less important
Exploration Spend Construction Production Corporate
H M L H M L H M L H M L
Oil price 5% 5% 5% 5% 5% 5% 5% 5% 5% 20% 20% 20%
Policy settings and regulation 5% 5% 5% 5% 5% 5% 5% 5% 5% 5% 5% 5%
Spend on exploration 70% 50% 45%
Spend on construction 70% 70% 60% 27% 23% 20%
Oil production 20% 17.5% 12.5% 9% 9% 8%
CSG production 30% 30% 20% 10% 8% 8%
Conventional gas production 20% 17.5% 12.5% 10% 9% 8%
Technology 15% 20% 30% 15% 15% 20% 15% 20% 40% 15% 20% 30%
Safety and environment approach 5% 5% 5% 5% 5% 5% 5% 5% 5%
Total 100% 100% 100% 100% 100% 100% 100% 100% 100% 100% 100% 100%
Source: AlphaBeta analysis, stakeholder interviews
Note: oil price and policy have a significant impact on other drivers (e.g. exploration spend, production and construction) but on their own are less significant drivers of workforce change
Exhibit 28: Contribution to observed production workforce change by hydrocarbon and skill quadrant
More important Less important
Oil CSG Conventional Gas LNG
H M L H M L H M L H M L
Oil price 5% 5% 5% 5% 5% 5% 5% 5% 5% 5% 5% 5%
Policy settings and regulation 5% 5% 5% 5% 5% 5% 5% 5% 5% 5% 5% 5%
Spend on exploration
Spend on construction
Oil production 70% 50% 45%
CSG production 70% 50% 45% 37.5% 32.5% 22.5%
Conventional gas production 70% 50% 45% 37.5% 32.5% 22.5%
Technology 15% 20% 40% 15% 20% 40% 15% 20% 40% 15% 20% 40%
Safety and environment approach 5% 5% 5% 5% 5% 5% 5% 5% 5% 5% 5% 5%
Total 100% 100% 100% 100% 100% 100% 100% 100% 100% 100% 100% 100%
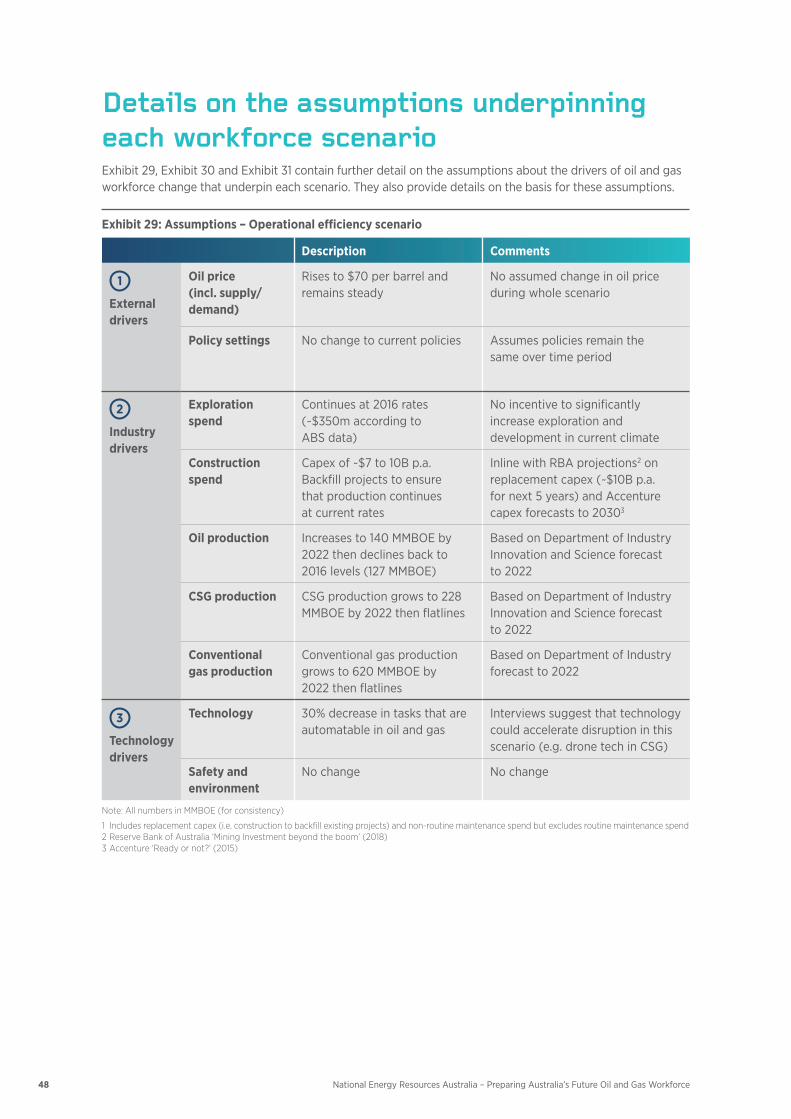
48 National Energy Resources Australia – Preparing Australia’s Future Oil and Gas Workforce
Details on the assumptions underpinning each workforce scenarioExhibit 29, Exhibit 30 and Exhibit 31 contain further detail on the assumptions about the drivers of oil and gas workforce change that underpin each scenario. They also provide details on the basis for these assumptions.
Exhibit 29: Assumptions – Operational efficiency scenario
Description Comments
1
External drivers
Oil price (incl. supply/ demand)
Rises to $70 per barrel and remains steady
No assumed change in oil price during whole scenario
Policy settings No change to current policies Assumes policies remain the same over time period
2
Industry drivers
Exploration spend
Continues at 2016 rates (~$350m according to ABS data)
No incentive to significantly increase exploration and development in current climate
Construction spend
Capex of ~$7 to 10B p.a. Backfill projects to ensure that production continues at current rates
Inline with RBA projections2 on replacement capex (~$10B p.a. for next 5 years) and Accenture capex forecasts to 20303
Oil production Increases to 140 MMBOE by 2022 then declines back to 2016 levels (127 MMBOE)
Based on Department of Industry Innovation and Science forecast to 2022
CSG production CSG production grows to 228 MMBOE by 2022 then flatlines
Based on Department of Industry Innovation and Science forecast to 2022
Conventional gas production
Conventional gas production grows to 620 MMBOE by 2022 then flatlines
Based on Department of Industry forecast to 2022
3
Technology drivers
Technology 30% decrease in tasks that are automatable in oil and gas
Interviews suggest that technology could accelerate disruption in this scenario (e.g. drone tech in CSG)
Safety and environment
No change No change
Note: All numbers in MMBOE (for consistency)
1 Includes replacement capex (i.e. construction to backfill existing projects) and non-routine maintenance spend but excludes routine maintenance spend2 Reserve Bank of Australia ‘Mining Investment beyond the boom’ (2018)3 Accenture ‘Ready or not?’ (2015)

49National Energy Resources Australia – Preparing Australia’s Future Oil and Gas Workforce
Exhibit 30: Assumptions – Growth scenario
Description Comments
1
External drivers
Oil price (incl. supply /demand)
Steady increase to 2021
Peaks at $100 per barrel starts to decrease in 2024
Change implies shortage of overall oil / gas supply
Policy settings Positive policy changes including lifting moratoria, improving accelerated depreciation rules, ringfencing etc
Large number of substantial policy changes promote exploration, construction and production
2
Industry drivers
Exploration spend
Increases from $350m to $1.1B in 2021 then decreases to $550m in 2030
Assumes exploration reaches same height as 2009 (per ABS data) then follows oil price decrease
Construction spend
Double forecast spend (~$15B a year) $120B ($90B conv., $30B unconv.) spend from 2018 to 2024. Further $60B to 2030
Equivalent to entire Major Projects production spend2 plus building half an additional Surat spend (assumes all major projects go ahead)
Oil production
30% increase on top of 2016 levels by 2030
New discoveries will be partly oil / condensate based
CSG production
50% increase on top of 2016 levels by 2030
Based on EnergySkills QLD CSG to LNG Workforce Plan (2013) projections and additional CSG production from NSW/NT/VIC
Conventional gas production
Conventional gas production increases ~90% from 417 MMBOE in 2016 to 816 MMBOE in 2030
Based on Major Products data2 (assumes that all additional capacity is additive not replacement)
3
Technology drivers
Technology 15% decrease in tasks that are automatable
Adoption of new technologies in greenfield developments
Safety and environment
No change No change
Note: All numbers in MMBOE (for consistency)
1 Includes replacement capex (i.e. construction to backfill existing projects) and non-routine maintenance spend but excludes routine maintenance spend2 Department of Industry, Innovation and Science ‘Resources and Energy Major Projects List’ December 2017
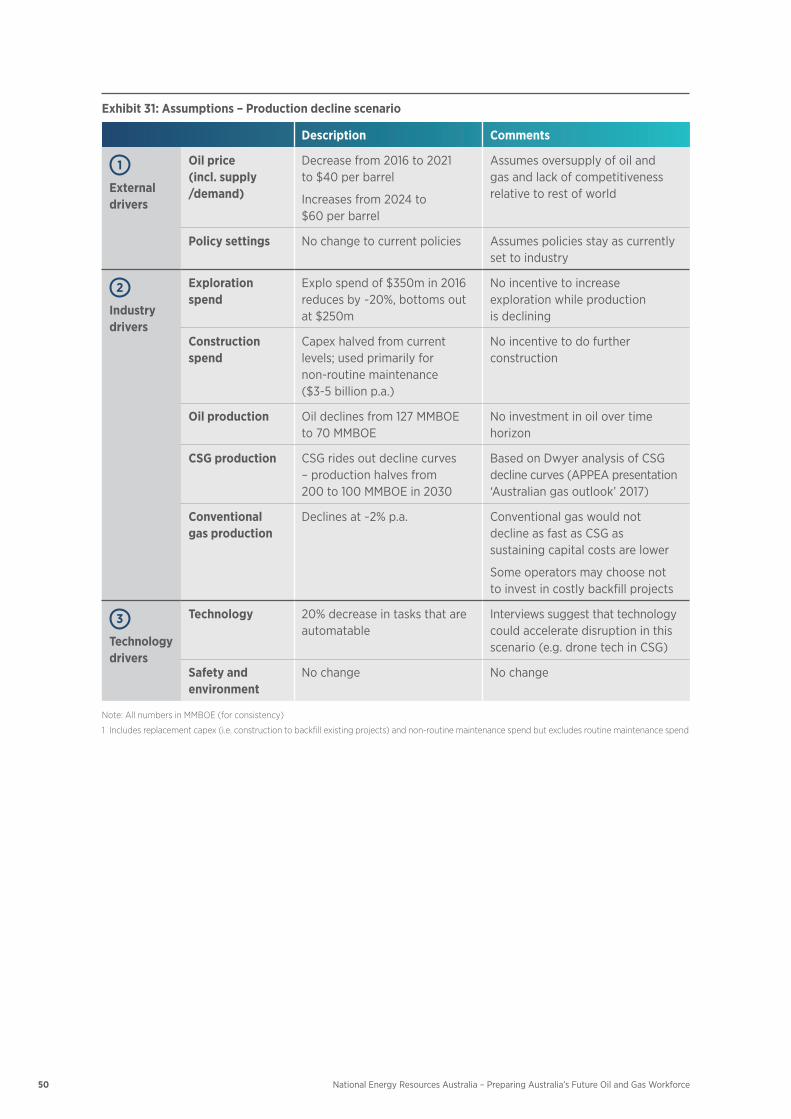
50 National Energy Resources Australia – Preparing Australia’s Future Oil and Gas Workforce
Exhibit 31: Assumptions – Production decline scenario
Description Comments
1
External drivers
Oil price (incl. supply /demand)
Decrease from 2016 to 2021 to $40 per barrel
Increases from 2024 to $60 per barrel
Assumes oversupply of oil and gas and lack of competitiveness relative to rest of world
Policy settings No change to current policies Assumes policies stay as currently set to industry
2
Industry drivers
Exploration spend
Explo spend of $350m in 2016 reduces by ~20%, bottoms out at $250m
No incentive to increase exploration while production is declining
Construction spend
Capex halved from current levels;usedprimarilyfor non-routine maintenance ($3-5 billion p.a.)
No incentive to do further construction
Oil production Oil declines from 127 MMBOE to 70 MMBOE
No investment in oil over time horizon
CSG production CSG rides out decline curves – production halves from 200 to 100 MMBOE in 2030
Based on Dwyer analysis of CSG decline curves (APPEA presentation ‘Australiangasoutlook’2017)
Conventional gas production
Declines at ~2% p.a. Conventional gas would not decline as fast as CSG as sustaining capital costs are lower
Some operators may choose not to invest in costly backfill projects
3
Technology drivers
Technology 20% decrease in tasks that are automatable
Interviews suggest that technology could accelerate disruption in this scenario (e.g. drone tech in CSG)
Safety and environment
No change No change
Note: All numbers in MMBOE (for consistency)
1 Includes replacement capex (i.e. construction to backfill existing projects) and non-routine maintenance spend but excludes routine maintenance spend
51National Energy Resources Australia – Preparing Australia’s Future Oil and Gas Workforce
Supply chain and wider economy employmentThe indirect workforce in the supply chain – people whose jobs indirectly rely on the oil and gas industry – couldbe4-6timesthesizeofthedirectoilandgasworkforceby2030,dependingonthescenario.
• Intheindustry growth scenario, jobs in the oil and gas supply chain could grow significantly, peaking at about 129,000 workers in 2026 and then declining by around 10,000 workers in the following years as temporary construction workers leave the industry.
• Intheoperational efficiency scenario, employment in the oil and gas supply chain would gradually return towards the 2013 peak of around 110,000 jobs and then flatten out in the following years.
• Intheproduction decline scenario, employment in the oil and gas supply chain could decline substantially amid an assumed downturn in oil and gas production.
Employment generated in the wider economy generally mirrors the supply chain trends between 2016 and 2030,butatlowerlevels.Thewidereconomyworkforcecouldbe3-4.5timesthesizeofthedirectoilandgas workforce by 2030, depending on the scenario.
The supply chain and wider economic employment analysis was done by:
• Examiningthehistoricalrelationshipbetweenemploymentintheoilandgasindustry,itssupplychain,and the wider economy. Using ABS Input-Output tables for the period 2006 to 2015, the GVA generated per unit of output by the oil and gas industry, its supply chain and the wider economy was calculated.
• ApplyingtheGVAmultiplierstohistoricaloilandgasoutputgavetotalGVAgeneratedintheentiresupply chain and the wider economy. Dividing supply chain and wider economy GVA by GVA per worker (A$110,000 for the supply chain, and A$145,000 for the wider economy) provided historical supply chain and wider economy employment generated by oil and gas. The employment ratios between the oil and gas industry, its supply chain and the wider economy were then calculated for each year.
For each scenario, a composite index was calculated consisting of the total output in the oil and gas industry and construction spending for each year between 2017 and 2030. The index was then applied to the historical employment ratios for each year between 2017 and 2030 to factor in the impact of these key drivers.
For the operational efficiency scenario, the index-adjusted median historical employment ratios were used to estimate the impact on employment in the supply chain and wider economy during the first part of the analysis period. This reflects the business-as-usual aspect of this scenario. However, due to eventual efficiency gains, the index-adjusted maximum historical employment ratios were then used in the latter part of the analysis period.
For the industry growth scenario, the same method was used. However, the employment ratios in the latter part of the analysis period were lowered according to the multiplier relationship found between the oil and gas industry and the construction industry. This accounts for the transient nature of many of the indirect construction roles at the 2026 employment peak. It is assumed that most of these workers would leave their roles as construction spending would dampen in this scenario through to 2030.
In the production decline scenario, the index-adjusted median historical employment ratios were used through to 2030.

Registered office:Australian Resources Research Centre Level 3, 26 Dick Perry Avenue Kensington WA 6151
ABN 24 609 540 285
T: 1300 589 310E: [email protected]: www.nera.org.au
@NERAnetwork NERA – National Energy Resources Australia
www.nera.org.au