Embed Size (px)
Citation preview

Preparing for Health Reform: Primary Care Availability and Unmet Need
A Case Study in Philadelphia
Anje Van Berckelaer, MD, MSHP Shally Iyer, MPH
David Grande, MD, MPA
Robert Wood Johnson Foundation Clinical Scholars Leonard Davis Institute of Health Economics
University of Pennsylvania School of Medicine
September 15, 2011

2
Executive Summary As a result of rising demand, wait times for new appointments at the City of Philadelphia’s ambulatory primary care centers have increased to as long as six months. In light of this evidence of impaired access and the critical need to plan for expanded coverage in 2014, we set out to: 1. Examine the characteristics and availability of primary care practices (both public and
private) in a part of Philadelphia facing exceptionally long appointment wait times 2. Test methodology to measure primary care capacity at the neighborhood level, information
that will be critical to planning for health coverage expansions in 2014. 3. Estimate local demand for primary care services to determine potential unmet need. The area we evaluated is defined by the northernmost zip codes in Philadelphia, home to approximately 350,000 people (23% of the city’s residents). We used publicly available data to identify primary care practices in the area, and surveyed the practices by phone to determine their current capacity and care for low-income patients. We also used the Community Health Database from the Public Health Management Corporation to identify populations at high risk of unmet healthcare needs by zip code.
We identified 186 practices, representing 300 nurse practitioners and physicians, or 8.6 per 10,000 population, which is close to the national average (8.9). These practices consist of 43% family medicine, 35% internal medicine, 12% pediatrics, and 9% mixed primary care groups. Solo offices accounted for 70% of the total, compared to a national primary care average of 36% in solo or two-physician practices.1 However, this percentage includes a number of small practices affiliated with larger academic centers. Although we had a relatively low response rate to our full practice survey, our results show:
All surveyed practices are accepting new patients with private insurance.
Practices are reluctant to disclose the payer mix of their patient panel and how their acceptance of new patients differs by payer.
Pediatric practices have a payer mix that is especially heavily weighted toward Medicaid, consistent with the proportion of children who are publicly insured.
The area’s physicians serve patients speaking many different languages, and themselves may speak languages besides English, but few private practices have interpreter services available.
Collecting data from private practices is challenging. First, the universe of practices at the neighborhood level is difficult to define and can only be obtained through manual searches of insurer provider directories and internet searches. Second, practice managers are reluctant to provide data about their practice and often do not have ready access to information such as their panel size, number of patient visits, or payer mix. Given the low response rate to our first survey, we made follow-up calls to all practices with two brief questions: when is the next

3
available new patient appointment, and do they accept Keystone Mercy Health Plan, the largest Medicaid managed care organizations in Philadelphia. From this survey with an 85% practice response rate we found:
Wait times for a new patient visit average 14 days, but vary widely and are considerably longer for safety net practices (39-74 days).
38% of physicians surveyed are not accepting new Medicaid patients – considerably more than the 28% seen in a nationally representative sample.2 Furthermore, physicians accepting Medicaid are concentrated in only 14% of the practices, three of which are community health centers whose mission is to care for low-income patients.
We also explored the amount of unmet health care need in the population of Northeast Philadelphia. Within the area, some 18,000 residents, or 5% of the population, are at high risk of having an unmet healthcare need, with the greatest concentration of these in the southern tier of zip codes (19120, 19124, 19111, 19149, and 19135). “High risk” is defined by the presence of multiple risk factors for impaired access and low health status. While there is no benchmark for unmet healthcare needs, this estimate shows the number of individuals likely to have foregone a medical visit in the last year. Likewise, residents with chronic disease are concentrated in this area, particularly in 19120, 19124, and 19111, accounting for an estimated 72,000 individuals in these three zip codes alone. Identifying and measuring the high risk population is difficult; however, based on their risk profile, many of them are likely to qualify for Medicaid or subsidized insurance premiums in coming years, so in the long term will be an important group to identify for insurance enrollment. In the shorter term, because many of them are currently uninsured, an additional estimated 9 to 12 full-time safety-net providers are needed based on typical primary care panel sizes. Recommendations Our core recommendations focus on health services planning for the city of Philadelphia, which will become increasingly important as health reforms increase demand for primary care services. 1) A new comprehensive primary care safety-net access point should be developed in
Northeast Philadelphia, located near the common intersection of zip codes 19111, 19120, and 19124. This new access point could take the form of a community health center (nurse- or physician- managed), or a new city health center. Given the favorable funding climate and the depth of need, we encourage current FQHC grantees and other interested groups to submit proposals for a new health center site.
2) The Health Department should collect primary care provider data routinely to facilitate
capacity estimates. The first step is to identify the universe of providers. Building on existing relationships with the Pennsylvania Department of Public Welfare and Medicaid

4
Managed Care companies, as well as private insurers, we recommend that the city maintain a database of primary care practices in the city. Second, to obtain estimated wait times and insurance acceptance rates, the department may need to perform regular mock patient calls inquiring about next available new patient appointments. The Health Department could also coordinate with federal regional extension centers for health information technology to build primary care practices’ capacity to monitor their own panel sizes, visit numbers, and availability. This analysis should be revisited in 2013 to re-evaluate the role of private providers in the health care system, city-wide. As Medicaid reimbursements in primary care will significantly increase in 2013 (i.e., to Medicare levels), acceptance of Medicaid patients in private practices is expected to change; assessing the reasons for decisions to accept certain payers should help further plan capacity. It will be important to see how practices respond to this change in payment rate in order to ensure adequate capacity. 2010 Census figures will also better inform the next evaluation once they are available.
3) Health insurance plans and area hospitals should be equal partners in making data available to measure primary care capacity. The process of building the provider database by manual collation from a range of sources could be dramatically simplified by the automated provision of a regularly updated provider list from the area’s larger insurers and hospitals to the Health Department. Data sharing at this level could be a stepping stone toward building relationships among stakeholders that will be essential to the successful implementation of health reforms, including new incentives for better coordination of patient care and meaningful use of health information technology.

5
Introduction Between 2000 and 2008, the percentage of uninsured Philadelphians nearly doubled, from 6.7% to 11.4%.3 These high rates of uninsurance generate increased demand at area safety net clinics. The 2010 health reforms and accompanying coverage expansions, which will take effect in 2014, also will likely increase demand for health services both within and outside the safety net. Looking ahead, it is vital to measure the primary care capacity and safety net capacity overall to prepare for the transforming health care system. Long wait times in the city of Philadelphia’s ambulatory primary care centers served as the impetus to determine the unmet need in this area. As safety net institutions such as Federally Qualified Health Centers (FQHCs) and FQHC look-alikes expand in response to health reforms, it will be necessary to reassess the areas of greatest need. Health Center #10, the city’s only ambulatory health care center in Northeast Philadelphia, illustrates the mismatch between primary care supply and demand. With wait times averaging 194 days, Health Center #10 is one of very few safety net organizations that serve low-income residents in Northeast Philadelphia. The number of visits at this health center remained stable from 2007 (56,444) to 2008 (55,449). This study examines two specific issues: the characteristics and availability of primary care (both private practices and health centers) within Northeast Philadelphia, and estimates of potential unmet primary care need. Northeast Philadelphia is bounded to the northwest by Montgomery County, to the north by Bucks County, and to the east by the Delaware River, which forms the border with the state of New Jersey. For the purposes of this assessment, we included the following zip codes, listed from south to north, as they form the catchment area for Health Center #10 as determined by the City of Philadelphia: 19120, 19124, 19111, 19149, 19135, 19152, 19136, 19115, 19114, 19116 (see Map 1). Because 19154 is not part of the catchment area, it was not included in the primary care capacity assessment, though it is still within Northeast Philadelphia.
Methods Primary care availability Primary care physicians with practices within the catchment area (zip codes listed above) who identified themselves as family physicians, internists, general practitioners, and/or pediatricians were included in this assessment. Based on the Health Resources and Services Administration (HRSA) guidelines for Medically Underserved Area designation, we used Medicaid and Medicare provider directories to supplement online physician search tools. These tools included WebMD-Physician Finder, Google.com, Yellowpages.com, Whitepages.com, Healthgrades.com, and Ucomparehealthcare.com. Physician names and addresses were cross-checked to identify addresses with multiple physicians and to eliminate duplicates. In contrast to HRSA Map 1

6
recommendations, we did not use state licensure records because they do not always provide practice addresses, or the county medical society, which does not release membership lists. Although other efforts to determine health care capacity have used the American Medical Association (AMA) Physician Masterfile or related databases, such as the Area Resource File, because our focus was on a relatively small geographic area, and because Masterfile addresses are not reliably identified as home versus practice addresses, we used insurance and business listings. We conducted structured interviews of practices by telephone. Responses from office staff, practice managers, and physicians themselves were accepted. The interview was based on modifications to the Community Tracking Study Physician Survey to determine the number of full-time equivalent physicians working at each practice, the patient mix, the payer mix, provider mix and health care utilization. The interviewer made three attempts, each spaced one week apart, to contact practice staff by telephone, with preference for speaking to the practice manager or physician.

7
In addition to the longer survey, a brief telephone survey was attempted with all practices, asking each of them the date of the next available new patient appointment, and if they accept new patients from Keystone Mercy Health Plan, the largest Medicaid HMO in the Philadelphia area. Three telephone attempts were made for each practice, with the exception of wrong numbers which were discontinued after one call. For wrong numbers, alternative numbers were sought using online resources including the yellow pages, Google, and health insurance websites.
Unmet need for primary care Data source: We used the Public Health Management Corporation's (PHMC) 2004, 2006 and 2008 Southeastern Pennsylvania Household Health Survey,3 a telephone survey of over 10,000 households that examines the health and social well-being of residents in Philadelphia and surrounding counties. The survey is conducted as part of PHMC's Community Health Data Base (CHDB), which contains information about local residents' health status, use of health services, and access to care. PHMC is a nonprofit, public health organization committed to improving the health of the community through outreach, education, research, planning, technical assistance, and direct services. Analyses: We used the CHDB to estimate risk categories for unmet healthcare needs based on multiple parameters. To do this, we used the methods described by Shi and colleagues to identify three broad categories of risk of missing routine preventive care for adults 18 and older.4 The following four individual risk factors contributed to an elevated risk level: uninsurance, less than a high school education, low income (less than 200% of the Federal Poverty Level), and lacking a usual source of care. The risk combinations are described in Table 1 below. Table 1: Risk of missed preventive care
High >40%
Moderate 20-40%
Low <20%
Risk factor combinations LI low income LE low education UI uninsured NU no usual source of care
3 or more factors UI/NU
LI/UI LI/NU LE/NU UI NU
no risk factors LI LE LI/LE
In order to have enough respondents to estimate risk at the zip code level, we combined adult data for the years 2004, 2006, and 2008 and adjusted survey weights accordingly. Consequently, the estimates reflect an average of rates across the three years in which surveys were conducted.
8
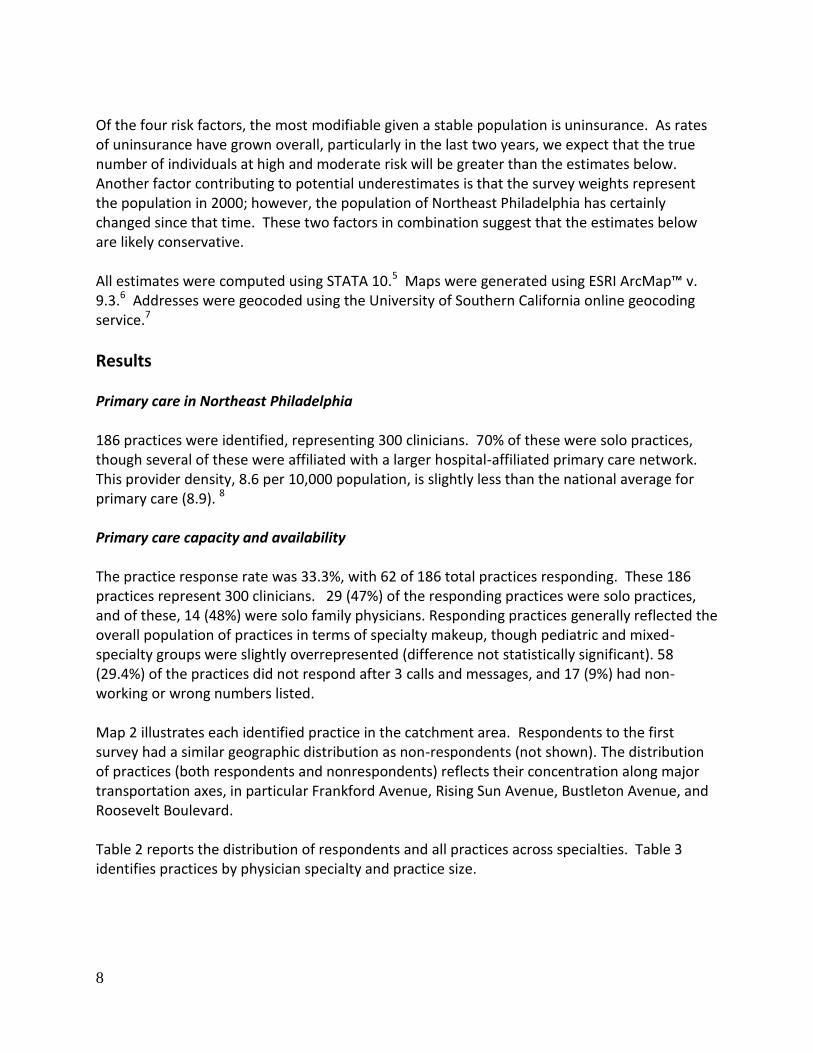
Of the four risk factors, the most modifiable given a stable population is uninsurance. As rates of uninsurance have grown overall, particularly in the last two years, we expect that the true number of individuals at high and moderate risk will be greater than the estimates below. Another factor contributing to potential underestimates is that the survey weights represent the population in 2000; however, the population of Northeast Philadelphia has certainly changed since that time. These two factors in combination suggest that the estimates below are likely conservative. All estimates were computed using STATA 10.5 Maps were generated using ESRI ArcMap™ v. 9.3.6 Addresses were geocoded using the University of Southern California online geocoding service.7
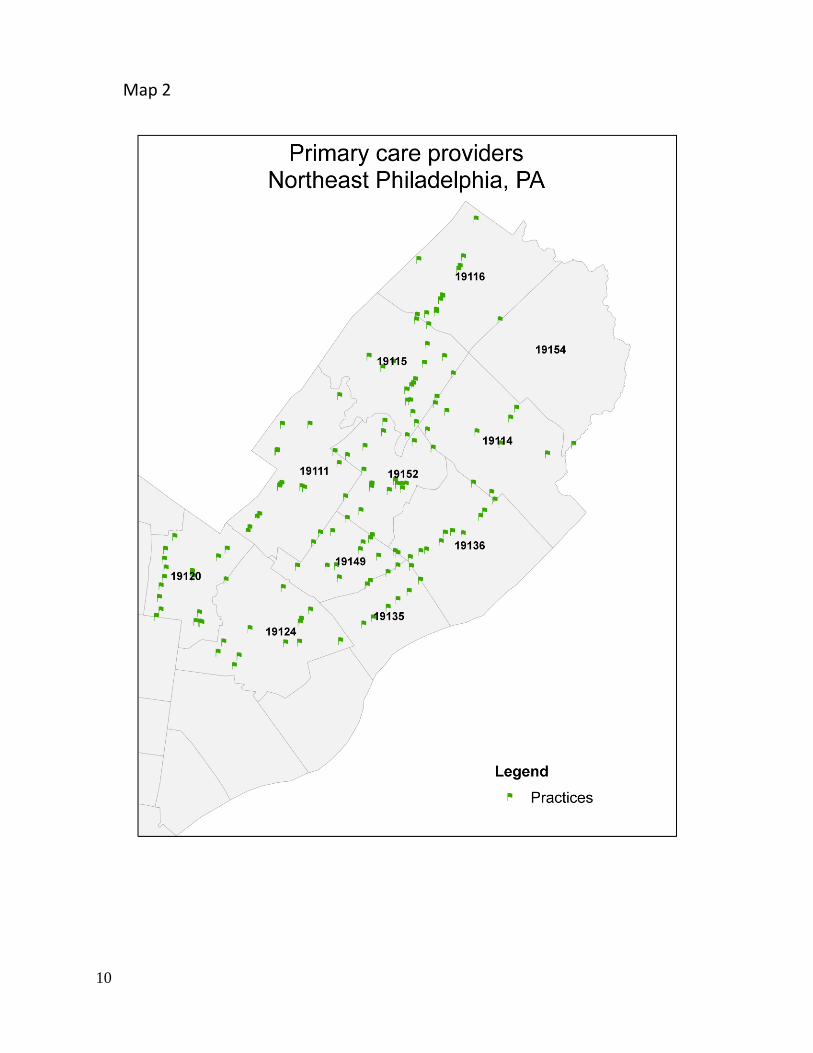
Results Primary care in Northeast Philadelphia 186 practices were identified, representing 300 clinicians. 70% of these were solo practices, though several of these were affiliated with a larger hospital-affiliated primary care network. This provider density, 8.6 per 10,000 population, is slightly less than the national average for primary care (8.9). 8 Primary care capacity and availability The practice response rate was 33.3%, with 62 of 186 total practices responding. These 186 practices represent 300 clinicians. 29 (47%) of the responding practices were solo practices, and of these, 14 (48%) were solo family physicians. Responding practices generally reflected the overall population of practices in terms of specialty makeup, though pediatric and mixed-specialty groups were slightly overrepresented (difference not statistically significant). 58 (29.4%) of the practices did not respond after 3 calls and messages, and 17 (9%) had non-working or wrong numbers listed. Map 2 illustrates each identified practice in the catchment area. Respondents to the first survey had a similar geographic distribution as non-respondents (not shown). The distribution of practices (both respondents and nonrespondents) reflects their concentration along major transportation axes, in particular Frankford Avenue, Rising Sun Avenue, Bustleton Avenue, and Roosevelt Boulevard. Table 2 reports the distribution of respondents and all practices across specialties. Table 3 identifies practices by physician specialty and practice size.

9
Table 2: Practices by specialty
Physican specialty Respondent practices All practices
Family medicine 26 80
Pediatrics 7 22
Internal medicine 20 66
General practice 0 1
Mix 9 17
Total 62 186
Table 3: Practice size by specialty of responding practices
Physican specialty Solo practice Two or more physicians
Family medicine 22 4
Pediatrics 5 2
Internal medicine 19 1
Mix 0 9
Total 46 16
10
Map 2
11
14 of the 62 respondents (23%) reached the end of the survey. Respondents in private practices often had difficulty answering practice-related questions such as panel size and number of patient visits per year. Responses among those who were able to provide visit numbers were highly variable, ranging from 2,500 visits per practice in a solo private practice, to 55,055 visits in a large group practice. In contrast to private practices, FQHCs and FQHC look-alikes often had this information available, as it is a routinely reported measure. Among all respondents, there were 64.55 full-time equivalents (FTEs) of family physicians, 13.28 pediatricians, 32.80 internists, and 5 general practitioners, or a total of 115.6 FTEs. The mean wait time for a new patient appointment among responding practices (n=14 for this question) was 10.0 days (0-31 days), with the longest waits at community health centers (17 and 31 days). Of the 12 private practices that answered questions about insurance accepted at their practices, 6 were accepting all, 3 most, 1 some, and 2 no new patients insured through Medicaid, including Medicaid managed care patients. Of note, a significantly greater proportion of pediatric practices (4 of 7) answered these questions, compared to 8 of 46 non-pediatric practices (p=0.03). Across all respondents, the average percentage of Medicare patients was 24% (range 0-55%), while Medicaid patients accounted for 35%, (range 0-68%). Pediatric practices are more heavily weighted toward Medicaid, with no pediatric respondent indicating fewer than 40% of patients on Medicaid. All practices accepted some form of private insurance. Among all responding practices, the average proportion of self-paying patients is 7%, ranging between 1 and 12 %. Providers’ arrangements for self-pay patients were also diverse and ranged from a fixed fee to income-based sliding scales to physician’s discretion. Only 3 respondents used interpreter services in their practices, and many relied on the language proficiency of clinicians and staff. The percentage of non-English speaking patients varied from 10% to 90% with an average of 28% non-English speakers. According to respondents, the most common languages spoken by patients in this area include Spanish, Arabic, Russian, Chinese, Gujarati, Albanian, and Ukrainian. The most common languages spoken by physicians or staff members are Spanish, Russian, Gujarati and Mandarin Chinese. Figure 1 represents the overlap between patient and provider language.

12
Figure 1: Patient/provider language overlap (2009 telephone survey)
Area social service providers indicate that more recent immigrant groups represented in Northeast Philadelphia include Brazilians, citizens of Baltic states, Central Asians (Kazakhs and Tajiks), Poles, Albanians, and some North Africans (principally from Algeria and Morocco), as well as Haitians immigrating after the January 2010 earthquake and a small number of Iraqi refugees. These groups add to longer-established populations of Russians, Ukrainians, and Poles, many of whom are now naturalized citizens.9 New appointment availability for patients covered by Medicaid In the brief follow-up call to all providers, we reached 158 (85%) practices, accounting for 262 (87%) of the clinicians. Of the physicians reached, 62% were accepting new Keystone Mercy Health Plan patients – but they were concentrated in only 14% of the practices. 115 of the 158 respondents to this call were able to give a next available appointment (the remainder required information such as social security numbers, insurance plan, or vaccine records). Among those answering, the mean wait was 14.5 days, ranging from same-day availability to 74 days, with 54% of practices having new-patient availability within one week. The two responding community health centers had waits of 39 and 74 days.
Spanish Gujurati Arabic
Mandarin Russian
13
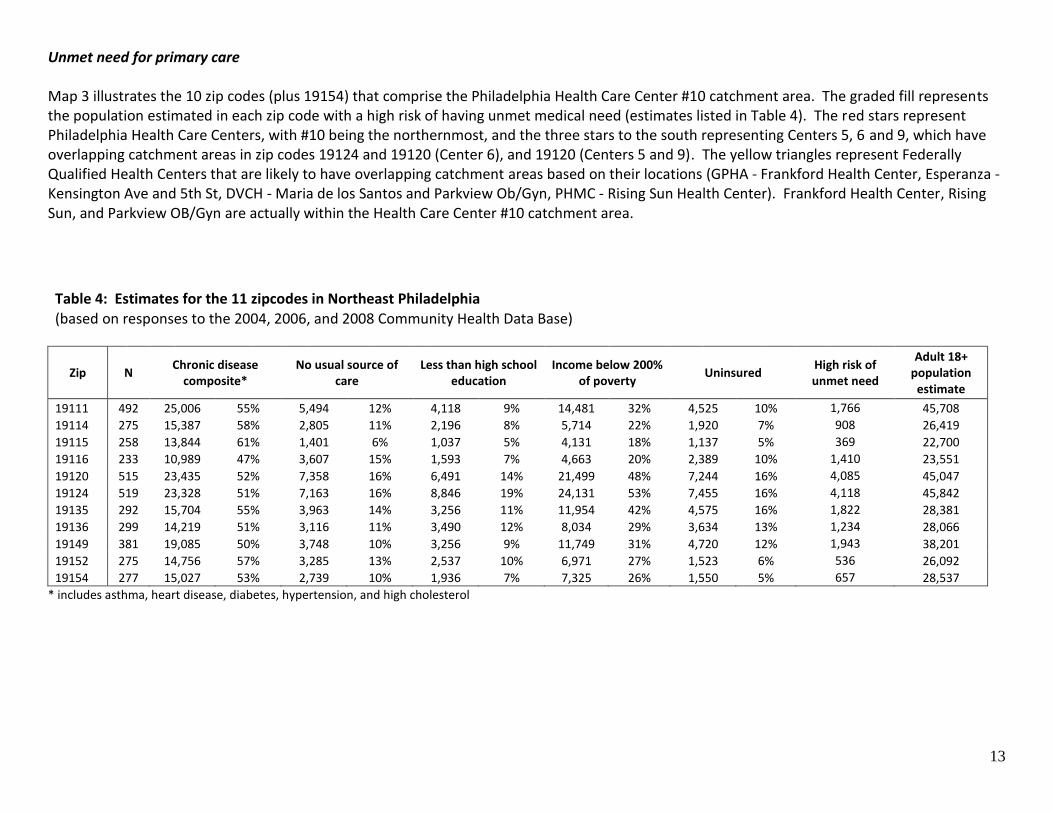
Unmet need for primary care Map 3 illustrates the 10 zip codes (plus 19154) that comprise the Philadelphia Health Care Center #10 catchment area. The graded fill represents the population estimated in each zip code with a high risk of having unmet medical need (estimates listed in Table 4). The red stars represent Philadelphia Health Care Centers, with #10 being the northernmost, and the three stars to the south representing Centers 5, 6 and 9, which have overlapping catchment areas in zip codes 19124 and 19120 (Center 6), and 19120 (Centers 5 and 9). The yellow triangles represent Federally Qualified Health Centers that are likely to have overlapping catchment areas based on their locations (GPHA - Frankford Health Center, Esperanza - Kensington Ave and 5th St, DVCH - Maria de los Santos and Parkview Ob/Gyn, PHMC - Rising Sun Health Center). Frankford Health Center, Rising Sun, and Parkview OB/Gyn are actually within the Health Care Center #10 catchment area.
Table 4: Estimates for the 11 zipcodes in Northeast Philadelphia
(based on responses to the 2004, 2006, and 2008 Community Health Data Base)
Zip N Chronic disease
composite* No usual source of
care Less than high school
education Income below 200%
of poverty Uninsured
High risk of unmet need
Adult 18+ population
estimate
19111 492 25,006 55% 5,494 12% 4,118 9% 14,481 32% 4,525 10% 1,766 45,708
19114 275 15,387 58% 2,805 11% 2,196 8% 5,714 22% 1,920 7% 908 26,419
19115 258 13,844 61% 1,401 6% 1,037 5% 4,131 18% 1,137 5% 369 22,700
19116 233 10,989 47% 3,607 15% 1,593 7% 4,663 20% 2,389 10% 1,410 23,551
19120 515 23,435 52% 7,358 16% 6,491 14% 21,499 48% 7,244 16% 4,085 45,047
19124 519 23,328 51% 7,163 16% 8,846 19% 24,131 53% 7,455 16% 4,118 45,842
19135 292 15,704 55% 3,963 14% 3,256 11% 11,954 42% 4,575 16% 1,822 28,381
19136 299 14,219 51% 3,116 11% 3,490 12% 8,034 29% 3,634 13% 1,234 28,066
19149 381 19,085 50% 3,748 10% 3,256 9% 11,749 31% 4,720 12% 1,943 38,201
19152 275 14,756 57% 3,285 13% 2,537 10% 6,971 27% 1,523 6% 536 26,092
19154 277 15,027 53% 2,739 10% 1,936 7% 7,325 26% 1,550 5% 657 28,537
* includes asthma, heart disease, diabetes, hypertension, and high cholesterol

14
Map 3

15
Map 4
16
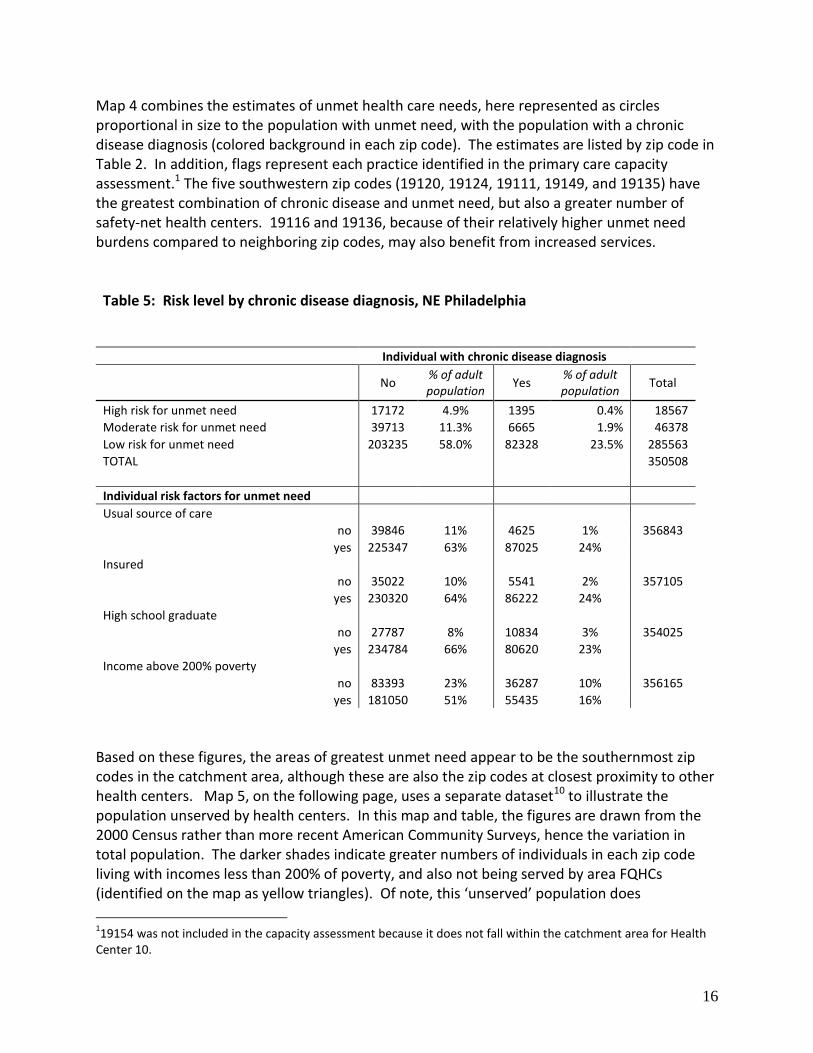
Map 4 combines the estimates of unmet health care needs, here represented as circles proportional in size to the population with unmet need, with the population with a chronic disease diagnosis (colored background in each zip code). The estimates are listed by zip code in Table 2. In addition, flags represent each practice identified in the primary care capacity assessment.1 The five southwestern zip codes (19120, 19124, 19111, 19149, and 19135) have the greatest combination of chronic disease and unmet need, but also a greater number of safety-net health centers. 19116 and 19136, because of their relatively higher unmet need burdens compared to neighboring zip codes, may also benefit from increased services. Table 5: Risk level by chronic disease diagnosis, NE Philadelphia
Individual with chronic disease diagnosis
No
% of adult population
Yes % of adult population
Total
High risk for unmet need 17172 4.9% 1395 0.4% 18567
Moderate risk for unmet need 39713 11.3% 6665 1.9% 46378
Low risk for unmet need 203235 58.0% 82328 23.5% 285563
TOTAL 350508
Individual risk factors for unmet need
Usual source of care
no 39846 11% 4625 1% 356843
yes 225347 63% 87025 24%
Insured
no 35022 10% 5541 2% 357105
yes 230320 64% 86222 24%
High school graduate
no 27787 8% 10834 3% 354025
yes 234784 66% 80620 23%
Income above 200% poverty
no 83393 23% 36287 10% 356165
yes 181050 51% 55435 16%
Based on these figures, the areas of greatest unmet need appear to be the southernmost zip codes in the catchment area, although these are also the zip codes at closest proximity to other health centers. Map 5, on the following page, uses a separate dataset10 to illustrate the population unserved by health centers. In this map and table, the figures are drawn from the 2000 Census rather than more recent American Community Surveys, hence the variation in total population. The darker shades indicate greater numbers of individuals in each zip code living with incomes less than 200% of poverty, and also not being served by area FQHCs (identified on the map as yellow triangles). Of note, this ‘unserved’ population does
119154 was not included in the capacity assessment because it does not fall within the catchment area for Health
Center 10.

17
Table 6: Low-income population not served by FQHCs10
Zip Code Low Income Population
Total # FQHC
Patients
Unserved Low
Income2
% Penetration
Low Income3
19111 16084 2411 13673 15
19114 6530 419 6111 6
19115 8134 287 7847 4
19116 7646 216 7430 3
19120 32017 8197 23820 26
19124 29209 15112 14097 52
19135 10186 702 9484 7
19136 10217 1065 9152 10
19149 14498 4338 10160 30
19152 7336 801 6535 11
19154 5483 308 5175 6
TOTAL 147340 33856 113484
include patients who are seen in the city’s health centers, which do not submit their data through the same mechanism. The total number of unserved patients in the three highest-need zip codes is 51,590. An estimated 47,000 patients are seen in total at the four city health centers closest to the Northeast (10, 5, 6 and 9). Even if half of the low-income patients have Medicaid and receive care in other primary care settings, the remaining patients in these three zip codes alone would overwhelm the remaining catchment areas for which
2 Number of low-income patients not served by FQHCs (but may be served
by other providers). 3 Percentage of the low-income population of the zip code served by
FQHCs
Map 5

18
those health centers are responsible. In combination, maps 4 and 5 offer confirmation that the areas of greatest unmet need are clustered in zip codes 19111, 19120, and 19124. Limitations: Maps: Because this evaluation took place at the end of a census decade, the data used are limited in their accuracy, particularly with respect to populations moving to the area since 2000, as they likely differ in important respects from the established population. This is because the CHDB survey is weighted to correspond to the 2000 census. We collapsed data across years in order to be able to discern differences across small areal units (zip codes) with some precision, however this has the tendency to decrease the effect of trends over time. Future evaluations will benefit from using the 2010 census data, as well as future versions of the CHDB, when they become available. Interviews A number of challenges arose in the course of data collection. First, a complete list of physicians was difficult to obtain. After determining that the AMA Masterfile was both costly and incomplete with respect to practice location, it was necessary to manually create a database of physicians based on specialty and geographical location. To minimize manual error, online physician directories and local business directories were used to compile and cross-check physicians’ names and contact information. This compiled directory may not include all of the practitioners in the catchment area, particularly if they were not listed in a directory. This is especially important in the assessment of the available primary care resources within the catchment area. Second, clinicians’ specialties were identified based on internet listings; a cross-check of a handful of clinicians using online American Board of Internal Medicine and American Board of Family Medicine certification verification tools revealed that many clinicians listed in a given specialty are not board-certified. The attribution of specialty was not further investigated; it is possible that some of the physicians listed as family physicians, internists, or pediatricians, are in fact general practitioners without further residency training, or that they are board-eligible. Third, responses varied based on the employment position of the interviewee. Receptionists were often unacquainted with the questionnaire topics due to their role. Many of these respondents were reluctant to share information about the practice without talking to the physician or the practice manager, for fear of divulging sensitive information about payer acceptance and sliding scale fees. Receptionists were often uncertain about what this sliding scale was and often referred questions to a billing clerk or managerial personnel. Finally, item response rates were low and inconsistent across respondents, creating substantial gaps in the data. Some informants were under time constraints and could only answer one or two questions, while others were limited not by time but by lack of information about the practice. This was evident in the responses given about panel size and number of visits; some respondents only knew the panel size while others could only identify the number of patient visits, which are not comparable to one another. These inconsistencies may have affected the results of this research, and in turn the interpretations made from these data. In order to obtain a more comprehensive view of practices accepting new Medicaid patients and wait times, to mitigate the low response rate in the full survey, we called all practices for the follow-up brief survey and were able to obtain a higher response rate on these less sensitive and less time-consuming questions. Conclusions

19
We identified 186 practices accounting for 300 clinicians in the catchment zip codes in Northeast Philadelphia; 62 of these practices (115 FTEs) responded in some measure to our survey. Respondents, on average, cared for more Medicaid than Medicare patients, however this was likely skewed by the greater proportion of pediatricians replying to payer mix questions. Self-paying patients were less common, ranging from 1-12% of patients. Among those who answered, reduced fees for self-pay patients were handled on a case-by-case basis. Respondents in private practices struggled to answer practice-wide questions; in contrast, federally funded health centers had this information readily available because it was a standard reporting measure. The low response rate, lack of detailed knowledge by interviewees, and sensitive nature of some of the questions precluded drawing any conclusions on how many more patients, particularly underserved patients, practices might be able to accommodate. The brief follow-up survey reveals some concerning limitations on access to care for Medicaid-insured patients: although 38% of physicians reached are accepting new Keystone Mercy Health Plan patients, Philadelphia’s largest Medicaid plan, they are concentrated in only 22 practices, including three FQHCs. In addition, while the mean wait for new patient appointments is only 14 days, it is considerably longer in health centers that accept all patients regardless of ability to pay. In addition to financial barriers, language also presents a potential barrier to care. The cultural and linguistic diversity of the Northeast’s population is only partly reflected in the physicians serving the area. Survey respondents rely on both staff and patients’ family members to communicate in a different language; few providers have interpreters available. Estimates of unmet need in this area reveal greater concentrations of need in the southern zip codes in the catchment area, as well as higher rates of chronic disease. While we do not have the data to compare this to other parts of the city, the presence of over 18,000 residents in the region at high risk of unmet need, with 50% of the adult population having a chronic disease, clearly demands action. Recommendations
1. A new comprehensive primary care safety-net access point should be developed in Northeast Philadelphia, located near the common intersection of zip codes 19111, 19120, and 19124. This new access point could take the form of a community health center (nurse- or physician- managed), or a new city health center. Given the favorable funding climate and the depth of need, we encourage current FQHC grantees and other interested groups to submit proposals for a new health center site.
2. The Health Department should collect primary care provider data routinely to facilitate capacity
estimates. The first step is to identify the universe of providers. Building on existing relationships with the Pennsylvania Department of Public Welfare and Medicaid Managed Care companies, as well as private insurers, we recommend that the city maintain a database of primary care practices in the city. Second, to obtain estimated wait times and insurance acceptance rates, given the difficulty in obtaining candid answers from practices, the department may need to perform regular mock patient calls inquiring about next available new patient appointments.
The Health Department could also coordinate with regional extension centers for health information technology to build primary care practices’ capacity to monitor their own panel sizes and visit numbers.

20
The Health Department should revisit this analysis in 2013 to re-evaluate the role of private providers in the health care system, city-wide. As Medicaid reimbursements in primary care will significantly increase in 2013 (i.e., to Medicare levels), acceptance of Medicaid patients in private practices is expected to change; assessing the reasons for decisions to accept certain payers should help further plan capacity. It will be important to see how practices respond to this change in payment rate in order to ensure adequate capacity. 2010 Census figures will also better inform the next evaluation once they are available.
3. Health insurance plans and area hospitals should be equal partners in making data available to
measure primary care capacity. The process of building the provider database by manual collation from a range of sources could be dramatically simplified by the automated provision of a regularly updated provider list from the area’s larger insurers and hospitals to the Health Department. Data sharing at this level could be a stepping stone toward building relationships among stakeholders that will be essential to the successful implementation of health reforms, including new incentives for better coordination of patient care and meaningful use of health information technology.
Our core recommendations focus on health services planning for the city of Philadelphia. Our first is to establish a new primary care site serving low-income residents of Northeast Philadelphia. Given the low acceptance of Medicaid patients in private practices, additional safety-net health services are needed to serve this region’s unmet needs – both for Medicaid and uninsured patients. One possibility is the expansion of Health Center 10 or the creation of a new city-operated health center. Given the limitations on FQHC look-alike funding and limited city funding, however, a full FQHC, with the current federal funding of new access points for community health centers, seems a more viable option. As a membership organization of community health centers, the Health Federation of Philadelphia is uniquely positioned to coordinate and convene efforts to expand safety net services to this high-need part of the city. The Health Department could also play an important role in this domain. Efforts will also need to include the local community and should take advantage of existing organizing activity in the area. Appropriate locations to site additional health services for low-income patients might include Frankford Ave, Bustleton Ave, Rising Sun Ave, or Roosevelt Blvd, all of which cross through the highest-need zip codes and are on public bus lines (see Map 6). With an estimated 71,769 individuals with chronic disease and nearly 10,000 residents at high risk of unmet need in 19111, 19120, and 19124, an additional health center on Rising Sun Avenue near the intersection of the three zip codes would provide improved access in the area of highest apparent need. Although this location does contain a number of small practices, their ability to absorb more low-income patients is likely limited based on our survey results. Our second recommendation focuses on the need to continue monitoring primary care capacity in this area and throughout the city in order to address access gaps as they develop. Future efforts to characterize the supply of primary care and the unmet needs of the city may require alternative strategies to data collection. As a growing number of Philadelphians qualify for health care coverage through Medicaid expansions and health insurance exchanges, the need to assess primary care capacity will assume greater importance – both to address workforce and infrastructure needs. We recommend that the Health Department work with regional Medicaid managed care companies and private insurers to develop a comprehensive and up-to-date primary care provider database. A regular telephone request for next available new patient visit to randomly selected practices in the city using this database would also facilitate a better understanding of primary care capacity on a city-wide scale. Based on our experience with provider reluctance to share payer-mix information, a mock call system is more likely to provide valid and useful information.

21
In addition, as health information technology begins to play a greater role in the primary care system, practices should more easily be able to measure their panel sizes and visit numbers. Taking advantage of the federal support for regional extension centers for health IT, we recommend that the technical support agencies providing extension services work with Philadelphia practices to assess panel size. The Health Department should also revisit the question of primary care capacity in 2013 – not only to measure the effect of any interventions made in the interim, but also to plan for the changes in the health system that will be happening then. As Medicaid reimbursement rises for primary care to Medicare rates in 2013, the role of the private sector can be expected to expand. However, reimbursement rates alone may not be the only factor affecting acceptance of Medicaid plans; an assessment of the factors in the decision to accept different payers will be necessary to estimate how much need will remain for publicly supported health centers. In addition, the need estimates in this report use data adjusted from the 2000 census, which necessarily limits the accuracy of our population estimates. In order to plan primary care services over time, the city of Philadelphia should revise these estimates at a city-wide level with each biennial round of the Community Health Database, using the most recent available population figures from the full census or American Community Survey. Our final recommendation is that health insurers and area hospitals be equal partners in electronically sharing comprehensive primary care provider lists, including practice address and contact information, with the Health Department. This process would obviate a large portion of the manual collation of lists that makes the updating of the database burdensome and resource-intensive. In addition, insurers typically have information on provider languages, specialty and certification, and in some cases hours of operation, which would add significant richness to the ability to measure capacity that meets diverse community needs. Data sharing at this level could help build relationships among stakeholders that will be essential to meeting incentives for care coordination and meaningful use of health information technology that are part of health reforms.

22
Map 6

23
Acknowledgements The authors gratefully acknowledge Dr. Cheryl Bettigole, Clinical Director of Philadelphia Health Care Center #10, whose experiences and ideas are reflected in this report, and Dr. Giridhar Mallya, Director of Policy and Planning, Philadelphia Department of Public Health, for his guidance in developing this assessment. This research was supported by the National Nursing Centers Consortium with support from the Philadelphia Health Care Trust. References 1. Center for Studying Health System Change. Community Tracking Study Physician Survey,
2004-2005. Washington, DC 2006. 2. Boukus E, Cassil A, O'Malley AS. A Snapshot of U.S. Physicians: Key Findings From the
2008 Health Tracking Household Survey. Washington, DC: Center for Studying Health System Change;2009.
3. Southeastern Pennsylvania Household Health Survey. Public Health Management Corporation Community Health Database; 2008. www.phmc.org. Accessed 12/6/2008.
4. Shi L, Stevens GD, Lebrun LA, Faed P, Tsai J. Enhancing the measurement of health disparities for vulnerable populations. J Public Health Manag Pract. Nov 2008;14 Suppl:S45-52.
5. StataCorp. Stata Statistical Software: Release 10College Station, TX: StataCorp LP; 2007. 6. ESRI. ARCMap 9.3Redlands, CA2008. 7. Goldberg D, Wilson J. USC WebGIS Services. 2010; https://webgis.usc.edu. Accessed
August 27, 2010. 8. Quality Resource Systems I. Area Resource FileFairfax, VA: Health Resources and
Services Administration, U. S. Department of Health and Human Services; 2004. 9. Welcoming Center for New Pennsylvanians. Personal communicationPhiladelphia2010. 10. Robert Graham Center. UDSMapper. 2010; www.udsmapper.org. Accessed October 13,
2010.