Embed Size (px)
Citation preview
Full Terms & Conditions of access and use can be found athttp://www.tandfonline.com/action/journalInformation?journalCode=utas20
Download by: [Purdue University Libraries] Date: 31 January 2016, At: 13:54
The American Statistician
ISSN: 0003-1305 (Print) 1537-2731 (Online) Journal homepage: http://www.tandfonline.com/loi/utas20
Data Science in Statistics Curricula: PreparingStudents to “Think with Data”
J. Hardin, R. Hoerl, Nicholas J. Horton, D. Nolan, B. Baumer, O. Hall-Holt, P.Murrell, R. Peng, P. Roback, D. Temple Lang & M. D. Ward
To cite this article: J. Hardin, R. Hoerl, Nicholas J. Horton, D. Nolan, B. Baumer, O. Hall-Holt,P. Murrell, R. Peng, P. Roback, D. Temple Lang & M. D. Ward (2015) Data Science in StatisticsCurricula: Preparing Students to “Think with Data”, The American Statistician, 69:4, 343-353,DOI: 10.1080/00031305.2015.1077729
To link to this article: http://dx.doi.org/10.1080/00031305.2015.1077729
Accepted author version posted online: 12Aug 2015.Published online: 29 Dec 2015.
Submit your article to this journal
Article views: 383
View related articles
View Crossmark data
Data Science in Statistics Curricula:Preparing Students to “Think with Data”
J. HARDIN, R. HOERL, Nicholas J. HORTON, D. NOLAN, B. BAUMER, O. HALL-HOLT,P. MURRELL, R. PENG, P. ROBACK, D. TEMPLE LANG, and M. D. WARD
A growing number of students are completing undergraduatedegrees in statistics and entering the workforce as data analysts.In these positions, they are expected to understand how to usedatabases and other data warehouses, scrape data from Internetsources, program solutions to complex problems in multiple lan-guages, and think algorithmically as well as statistically. Thesedata science topics have not traditionally been a major com-ponent of undergraduate programs in statistics. Consequently,a curricular shift is needed to address additional learning out-comes. The goal of this article is to motivate the importance ofdata science proficiency and to provide examples and resourcesfor instructors to implement data science in their own statis-tics curricula. We provide case studies from seven institutions.These varied approaches to teaching data science demonstratecurricular innovations to address new needs. Also included hereare examples of assignments designed for courses that fosterengagement of undergraduates with data and data science.
KEY WORDS: Big data; Computational statistics; Statisticalpractice; Statistics education
Johanna Hardin is Professor, Department of Mathematics, Pomona Col-lege, Millikan 2351, 610 N. College Ave., Claremont, CA 91711 (E-mail:[email protected]). Roger Hoerl is Assistant Professor of Statistics, Math-ematics Department, Union College, 807 Union Street, Schenectady, NY 12308(E-mail: [email protected]). Nicholas J. Horton is Professor of Statistics, De-partment of Mathematics and Statistics, Amherst College, 303 Seeley MuddBuilding, Amherst, MA 01002-5000 (E-mail: [email protected]). DeborahNolan is Professor, Department of Statistics, University of California, Berkley,367 Evans Hall, Berkley, CA 94720-3860 (E-mail: [email protected]).Ben Baumer is Assistant Professor, Statistical and Data Sciences, Smith Col-lege, Clark Science Center, 44 College Lane, Northampton, MA 01063 (E-mail: [email protected]). Olaf Hall-Holt (E-mail: [email protected]) and PaulRoback, Professor of Statistics and Director of Statistics Program (E-mail:[email protected]), Department of Mathematics, Statistics, and Computer Sci-ence, St. Olaf College, 1520 St. Olaf Ave., Northfield, MA 55057. Paul Mur-rell, Department of Statistics, The University of Auckland, Private Bag 92019,Auckland, New Zealand (E-mail: [email protected]). Roger D. Pengis Associate Professor, Department of Biostatistics, Johns Hopkins BloombergSchool of Public Health, 615 N Wolfe Street, Baltimore, MD 21205 (E-mail:[email protected]). Duncan Temple Lang is Professor, Department of Statistics,University of California, Davis, 4210 Math Sciences Building, One Shields Av-enue, Davis, CA 95616 (E-mail: [email protected]). Mark D. Ward isAssociate Professor and Undergraduate Chair, Department of Statistics, PurdueUniversity, 150 North University Street, West Lafayette, IN 47907-2067 (E-mail: [email protected]). Partial support for this work was made available byNSF grant 0920350 (Project MOSAIC, http://www.mosaic-web.org). We wouldalso like to acknowledge and thank the referees who provided valuable feedbackand suggestions for improvement on the article.
1. INTRODUCTION
The number of bachelor’s degrees awarded in statistics hasmore than doubled in the five-year period 2008–2013 (Pier-son 2014) and continues to experience growth. This increase inthe number of undergraduates may help address the impendingshortage of quantitatively trained workers (National Academy ofSciences 2010; Manyika et al. 2011; Zorn et al. 2014). Statisticsgraduates at the bachelor’s level often work as analysts, and asa result need training in statistical methods, statistical thinking,and statistical practice; a foundation in theoretical statistics; in-creased skills in computing and data-related technologies; andthe ability to communicate (ASA 2014). Computing skills toenable processing of large datasets are particularly relevant, asnoted in the recent London Report on the Future of Statistics:“Undoubtedly the greatest challenge and opportunity that con-fronts today’s statisticians is the rise of Big Data” (Madigan2014).
To help illustrate possible paths forward, we detail severalexisting approaches (many of which have been recently devel-oped) to prepare students to work in industry as a statisticianor an analyst, to continue their training in statistics graduateprograms, or to become a scientist in a field allied to statis-tics. Our goal is to provide resources and concrete ideas tothe statistics community for how to incorporate computationaland authentic data experiences into the undergraduate coursework. To this end, we invited faculty from seven institutions(Johns Hopkins University, Purdue University, St. Olaf College,Smith College, University of Auckland, and the Universities ofCalifornia, Berkeley and Davis) to describe their efforts in in-corporating data science into the undergraduate curriculum ininnovative ways.
2. WHAT IS DATA SCIENCE?
The term data science was suggested as a discipline by Cleve-land (2001), who argued that the statistics profession shouldchange its name to “data science,” as that was, in fact, whatstatisticians did. Since then, the term data science has become aphrase describing a discipline typically involving some mixtureof statistics and large-scale computing (Greenhouse 2013). Mul-tiple definitions of a data scientist exist, including an inquisitivedata explorer who communicates informed conclusions; some-one who can use data from multiple sources to spot trends; or
© 2015 American Statistical Association DOI: 10.1080/00031305.2015.1077729 The American Statistician, November 2015, Vol. 69, No. 4 343
Dow
nloa
ded
by [
Purd
ue U
nive
rsity
Lib
rari
es]
at 1
3:54
31
Janu
ary
2016
a “peculiar blend of developer and statistician that is capable ofturning data into awesome” (Wills 2015). We find particularlyrelevant the definition proposed by the NSF’s advisory commit-tee, StatSNSF, that data science is the computational aspectsof carrying out a complete data analysis, including acquisi-tion, management, and analysis of data (Johnstone and Roberts2014).
Given the vast increase in the volume and complexity of dataand the new technologies that have been developed to processand analyze this information, we argue there is an increasedneed for statistical thinking in the context of working with data.Indeed, the ASA has just released a data science statement (vanDyk et al. 2015) describing the indispensable role of statistics indata science and the crucial need for the field of statistics to moveforward in embracing data science. Key statistical reasoningtopics that are critical for data scientists to know at a deep levelinclude:
• Understanding the randomness, variability, and uncertaintyinherent in the problem.
• Developing clear statements of the problem/scientific re-search question; understanding the purpose of the answer.
• Ensuring acquisition of high-quality data and not just a lot ofnumbers.
• Understanding the process that produced the data, to provideproper context for analysis.
• Allowing domain (subject-matter) knowledge of the problemto guide both data collection and analysis.
• Approaching modeling as a process that requires an over-all strategy, not simply a collection of special techniques ormethods.
2.1 Why Does Data Science Belong in the UndergraduateCurriculum?
We recognize many strengths of the current undergraduatecurriculum in statistics. It has at its core an understanding ofvariability. Our students also learn that sampling biases can de-stroy the quality of inferential conclusions, and attendant issuesof causation. Issues regarding the responsible use of statisticsand the proper conduct of science (e.g., issues of multiple com-parisons and possible error rates) are imbued in many of ourcourses and programs. In addition, simple statistical solutionsto real problems are typically not complete without domain un-derstanding and contextual knowledge.
Many statistical experimental designs, models, and analy-ses presented in a typical undergraduate statistics curriculumare necessary, but they are not sufficient for today’s data prob-lems. To be relevant and able to tackle new data-rich prob-lems, as well as the ever-increasing data challenges for the fu-ture, our students’ statistical problem solving skills must beenhanced to incorporate practical computational skills. Thestrong connections between statistical concepts and the sci-entific method provide our students with the ability to con-tribute in helping to frame and answer questions involv-ing data. What is not clear is whether they have equivalentability to “think with data” (as enunciated by Diane Lam-bert of Google when a panelist on a Project INGenIOuStechnology panel, http://www.maa.org/programs/faculty-and-
departments/ingenious, D. Lambert, personal communication).There is still a long way to go to ensure that they cantackle—both statistically and computationally—issues withnonstandard and nontextbook data.
According to Cuny et al. (2010), computational thinking in-volves “the thought processes involved in formulating problemsand their solutions so that the solutions are represented in a formthat can effectively be carried out by an information-processingagent.” As statisticians, our first inclination is to focus on theinferential questions instead of the computational aspects. How-ever, as we encounter more and more complicated questions,data structures, and algorithms, the computational and algorith-mic aspects become an integral part of arriving at a principledand statistically sound solution. For example, the data problemcould involve analysis of news media headlines via unstruc-tured text scraped from the Web, microarray data extractionsspecified through HTML forms, or air traffic delays accessiblefrom a RESTful Web service. The current statistical curricu-lum does not help address many of the obstacles we encounterin approaching these problems. A number of questions mightarise: How do we find the data? How do we retrieve the data?How can we assess the quality of the data? What variables dowe need to derive from the raw data? How can the data be or-ganized into a structure for analysis? Will the approach remaincomputationally feasible as the number of documents increases?
Nolan and Temple Lang’s article on “Computing in the Statis-tics Curricula” (2010) described new computational topics andskills that need to be incorporated within the statistics curricu-lum (at both the graduate and undergraduate levels). They assertthat computing skills are essential for scientific research, espe-cially for scientific research containing statistical analyses, andthat this will be increasingly true in the future. While there hasbeen some movement in this realm since the publication of theirarticle (see, e.g., the American Statistical Association’s guide-lines for master’s programs in statistics (Bailer et al. 2012)),more work is needed. To help encourage additional curricu-lar ferment, we next provide several illustrations as to how therecommendations of Nolan and Temple Lang could be imple-mented at the undergraduate level.
2.2 Integrating Data Science into the Curriculum: SevenPrototypes
To illustrate how to develop novel data science curricula, wesurveyed a number of faculty about their approaches to integrat-ing data science into the statistics curricula. The descriptionspresented here represent a number of innovative approaches.They are similar in that they all share a goal of having studentsbecome proficient in data technologies and programming toolsfor problem solving with data. However, their approaches varyin terms of mode of delivery, topics, and learning outcomes.Our goal in providing these examples is that these “existenceproofs” can be useful to those who are working to integrate datascience approaches into their own statistics curriculum.
The instructors have also shared their syllabi and some coursematerials to provide more concrete guidance about the types ofmodules, units, and assignments for others to adapt and adopt.The materials include lecture notes, class projects, homework
344 Statistics and the Undergraduate Curriculum
Dow
nloa
ded
by [
Purd
ue U
nive
rsity
Lib
rari
es]
at 1
3:54
31
Janu
ary
2016
assignments, etc. These resources are noted at the end of eachprototype description. The syllabi have all been collected on thewebsite, http://hardin47.github.io/DataSciStatsMaterials/ . Thedata science exemplars are presented alphabetically by author.
2.2.1 Data Science, Ben Baumer, Smith College
The Data Science course at Smith College—first offered in2013—is an elective in the new program in Statistical & DataSciences and in the Applied Statistics minor. The course pro-vides a practical foundation for students to compute with data,by participating in the entire data analysis cycle (from forminga statistical question, data acquisition, cleaning, transforming,modeling and interpretation). The course introduces studentsto tools for data management, storage, and manipulation thatare common in data science, and students apply those toolsto real scenarios. Students undertake practical analyses usingreal, large, messy datasets using modern computing tools (e.g.,R, SQL) and learn to think statistically in approaching all ofthe aspects of data analysis (see Baumer 2015 for a completediscussion of the course).
While some of the topics covered in the course come fromexisting offerings in applied statistics and computer science,effort is made in Data Science to present a unified blend ofthis material, such that students recognize that both fields con-tribute to answering questions from data. The course itself canbe thought of as having five components: data visualization (e.g.,data graphics, elements of visual perception), data manipulation(e.g., SQL, merging, aggregating and iterating), computationalstatistics (e.g., confidence intervals via the bootstrap, simula-tion, regression, variable selection), data mining/machine learn-ing (e.g., classification, cross-validation), and additional topics(e.g., text mining, mapping, regular expressions, network sci-ence, MapReduce).
In its first offering, the staff of Smith’s GIS (geographical in-formation systems) laboratory regularly attended the class. Thisfacilitated incorporation of lessons on spatial data and mappingtechniques into the curriculum. This topic was popular with thestudents, since the ability to generate data maps was perceivedto be useful in terms of visualization and communication.
A key learning outcome stressed in the course was the abilityto think structurally about data and how to manipulate it. Wick-ham’s “key idioms” (2014) were used to illustrate for studentsthe similarities and differences between merging and aggregat-ing operations in R and SQL. For example, what is the R equiv-alent of the GROUP BY operation in SQL? The SQL syntaxis similar to the English language and so can help to demystifythe R code. One key aspect of the course is helping studentsrecognize that while each language may have its own syntax,the underlying operation that is being performed on the data isthe same.
Among the biggest challenges is keeping students with variedcomputational abilities and backgrounds on the same page. Forexample, some students come in with extensive knowledge andpractice with R, while others are seeing it for the first time. Itis difficult to find assignments that keep both types of studentsmotivated. Another challenge is maintaining a consistent levelof difficulty and workload when cobbling together material froma variety of sources.
The end of course evaluations indicated that students felt asthough they were learning things that are useful. In turn, theyhave generated more interest among younger students in takingthe course. Finally, several students have indicated that skillsthey learned in the course corresponded directly to questionsthat they were asked by employers during job interviews.
2.2.2 Data Technologies, Paul Murrell, University of Auckland
The Data Technologies course—first taught in 2002—introduces a variety of computer technologies relevant tostoring, managing, and processing data (other courses in theStatistics Department at the University of Auckland teach moreadvanced programming and computational tools). Students withinterests in applying statistics in business or research environ-ments have found the course very useful, and enrollments havebeen steady at around 80 students for several years.
The course has two aims: to teach programming tools spe-cific to the handling of data and to teach and build confidencewith general concepts of computer languages. Data Technolo-gies also aims to build students’ awareness of the range oftasks that a computer is capable of performing (in addition toproviding concrete tools for performing specific tasks). Spe-cific topics include: How to write computer code; publishingdata on the World Wide Web (HTML); data description and se-mantic markup (XML); data storage (file formats, spreadsheets,databases); data management and summary (database queries,SQL); data processing (R).
The topics that are covered in this course are quite diverse, andthere is very little overlap with other courses in the department.This reflects the fact that everything leading up to the analysisof the data (data access, data cleaning) was not included in thecurriculum of other courses in the department. The focus onR as a programming language also distinguishes this coursefrom other courses that use R as a data analysis tool. This isa positive aspect to the course, because it reflects the fact thatData Technologies provides the students with a firmer basis ofunderstanding and mastering of the language and computationalapproaches compared to those other courses.
Data Technologies has been perceived as being very reward-ing for the students because they generally recognize how use-ful the course content is for their future, both inside and out-side the university. In other words, they know it is good forthem, which has not necessarily been the case in other under-graduate courses in statistics. Additionally, this course has leadto numerous students—who have continued on to do graduatework—seeking out the instructor for supervision of graduateprojects.
The course has also been quite innovative in terms of deliv-ery of course content on the Web and student submissions viathe Web, although other courses have generally shifted in thatdirection in recent years. However, the course remains quite in-novative in its use of automated marking procedures to assist inassessment (taking advantage of the fact that student submis-sions are electronic and largely consist of computer code thatcan be evaluated).
One challenge the instructors of the course continue to facerelates to formal assessment. The tests and the exams are paper-based, which is highly artificial, but very necessary to offset
The American Statistician, November 2015, Vol. 69, No. 4 345
Dow
nloa
ded
by [
Purd
ue U
nive
rsity
Lib
rari
es]
at 1
3:54
31
Janu
ary
2016
the ease with which electronic submission of computer-basedcoursework can be copied and shared between students. Thearrangement is awkward for both the students and the evaluators.For the students, it is awkward because they are used to workingon a computer, and for the instructor because, for example,code submissions cannot be run easily. Having a computer-based examination environment would help, but would probablyintroduce headaches of its own.
Another challenge is that many students have only ever useda GUI interface like Microsoft Windows so there are some verystrong mental models that have to be broken down and re-placed. For example, the notion that data files are distinct fromexecutable files; that a file can be opened by applications otherthan the one that automatically opens when you double-click afile icon; that you are not limited by the menu options presentedto you by a GUI interface, etc. This situation continues to be achallenge with the growing prevalence of mobile devices wherethe code which runs the software is hidden behind barriers putup by the operating system.
All lecture, lab, and assignment material are avail-able online (including lecture recordings). The coursetext is a CC-NC-SA licensed work, and is available athttps://www.stat.auckland.ac.nz/∼paul/ItDT/ (Murrell 2009).
2.2.3 Concepts in Computing with Data, Deborah Nolan,University of California, Berkeley and Duncan TempleLang, University of California, Davis
These courses were co-developed at UC Berkeley and Davisin 2004. They are required upper division courses for the statis-tics major in both departments and typically taken by sopho-mores and juniors. However, the majority of students enrolledin the course are not statistics majors. In 2014–2015, over 600students enrolled in four offerings of the course at Berkeley andover 200 students enrolled in one offering at Davis.
Both courses focus on the computational aspects of the dataanalysis cycle, from data acquisition and cleaning to data or-ganization and analysis, and reporting. Students are exposed tomany different forms of data including structured data such asXML and JSON, free formatted text data, and dates, times, andgeo-locations. To handle the data, students learn various toolsand technologies including shell commands, regular expres-sions, structured query language (SQL) for relational databases,JavaScript for developing interactive Web pages, and R. Pro-gramming concepts are taught with R, including control flow, re-cursion, data structures, and trees. Although the main focus is onthe computational aspects of working with data, the course alsocovers many statistical topics, including concepts of variability,patterns, comparisons; exploratory and presentation graphics;statistical methods that are often not covered until late in themajor program, such as classification trees, multi-dimensionalscaling, and nearest neighbor methods; model selection and val-idation; and simulation tools, for example, Monte Carlo, boot-strap, cross-validation.
One of the biggest challenges has been in developing the re-sources for projects and assignments. This is more difficult thanfinding good datasets for teaching statistical methods becausethe data published for a statistical analysis often come already
processed and cleaned, but these courses call for sources thatare at least one step earlier in the analysis process.
Another common difficulty results from heterogeneity in stu-dent background. Many of the students are new to programming,but a substantial fraction of them have taken one or more CScourses. The first group is sometimes intimidated by the course.For this reason, at Berkeley, graphics is taught first since stu-dents get very excited about the sophisticated plots that theycan make with R. At this point, they are more open to learningprogramming concepts and handling more complex data (e.g.,other than CSV formatted). On the other hand, the more com-putationally advanced students often write code that works butignores the paradigm of the language (e.g., loops instead of vec-torized computations). For these students, their programs arefrustratingly slow. The challenge is to have them re-learn howto program using a different computational model.
Despite the challenges, Concepts in Computing with Datahas been very rewarding to teach. Several faculty have taughtthe course at Berkeley, and they all report how much they en-joy teaching it. One of the rewards is seeing the enthusiasmthat the students have for the material. The confidence the stu-dents gain is noticeable as they tackle increasingly challengingcomputational problems. They report how their project helpedthem get a job, gave them the confidence to learn new tech-nologies in their new careers, and enabled them to participate inresearch projects in their major. Many faculty routinely requirethis course for undergraduate students who wish to join theirresearch teams.
Additionally, Computing With Data enables teaching tradi-tional statistical topics from a different approach. For example,generating random numbers and carrying out simulation stud-ies help students understand the concept of a random variableand its properties. Also, students use exploratory data analy-sis (EDA) to debug code; cross-validation and bootstrappingto assess models and variability; and presentation graphics tosummarize findings from advanced statistical analyses.
A dozen case studies from these and similar courses are nowavailable (Nolan and Temple Lang 2015a).
2.2.4 Data Science Specialization, Roger Peng, Johns HopkinsBloomberg School of Public Health/Coursera
Roger Peng, along with his colleagues Jeff Leek and BrianCaffo, taught data science courses at Johns Hopkins in the MSBiostatistics program for many years. After realizing both theneed for expanded access and the ease in which they couldpromote their courses, they took their data science courses toCoursera, a massive online open course (MOOC) platform. Thismaterial is now taught in nine modules as part of the Data Sci-ence Specialization. These modules are accessible and engagingto students with a large range of backgrounds (from those withvery little background in statistics or computer science to thosewith PhDs in statistics or computer science who have not kept upwith the data science movement). Each module runs for about4 weeks so the entire program is 36 weeks long. Students canjoin the course at any of a variety of entry points depending ontheir background or desired educational goals.
The specialization provides instruction in the following ar-eas: (1) The Data Scientist’s Toolbox; (2) R Programming;
346 Statistics and the Undergraduate Curriculum
Dow
nloa
ded
by [
Purd
ue U
nive
rsity
Lib
rari
es]
at 1
3:54
31
Janu
ary
2016
(3) Getting and Cleaning Data; (4) Exploratory Data Analy-sis; (5) Reproducible Research; (6) Statistical Inference; (7)Regression Models; (8) Practical Machine Learning; and (9)Developing Data Products. The curricula of the modules coverthe entire data science pipeline: formulating a context-relevantquestion or hypothesis, identifying sources of data and obtaininga dataset, processing and transforming data so that it is suitablefor analysis, summarizing and analyzing data to create statisti-cal evidence, and finally creating and communicating statisticalresults in written format. Content covers the basics of buildingmodels based on new data types, experimental design, and statis-tical inference. Additional topics include statistical computing,reproducible research, data visualization, and machine learning.
The Data Science Specialization primarily uses the R pro-gramming language and focuses on its application in a varietyof data analysis and statistical problems. Shell scripting and us-ing various application programming interfaces (APIs) to accessdifferent kinds of data are also introduced (the use of APIs isdiscussed primarily in the context of accessing them from R viavarious packages). The expectations for students going into thecourse series are that they have some programming experiencein another language.
The Data Science Specialization is taught entirely online;all assignments are graded by peers or machines. There arethree types of assignments: programming assignments; quizzes(multiple choice, short answer), and peer assessments, whichmay include a variety of types of problems. Because the firsttwo types of assignments are graded automatically, studentsreceive instant feedback. Programming assignments are gradedvia unit tests so that R code is given specific inputs, and outputsare compared against correct output stored on the server. Forpeer assessments a minimum of four students must gradean individual’s assignment in order for it to receive a grade.Conversely, students cannot view their own grades until theyhave graded a minimum of four assignments. Peer assessmentshave a grading rubric designed by the course instructors thatdetails how points should be allocated to different aspects of theassignment. The benefits of peer assessment are that the coursecan scale up to large numbers of students and that students canlearn from seeing other approaches to a problem.
One of the great benefits of the course series is the enormousreach via the MOOC format. Through various MOOCs to date,Jeff Leek, Brian Caffo, and Roger Peng have taught nearly 1 mil-lion students. Being able to expose so many students at such alow cost is deeply rewarding. Teaching individual courses tosuch a large group of students (20 k–30 k per class) presentsquite a few challenges. Primarily, the heterogeneity in the stu-dents’ backgrounds is very high and the course material mustbe designed so that students with less background can “catchup” while students with more background are not bored. De-signing a course in this manner is quite different from teachingthe usual in-person class, even for large introductory lectures.Another key challenge is the inability to personally monitor theprogress of each student and to assist them when needed.
Leek, Caffo, and Peng have developed software tools (seeswirl, http://swirlstats.com) to address the pacing challenge byallowing students to learn certain technical material at their ownspeed. The R package—swirl—aims to teach users statistics
and R simultaneously and interactively. It attempts to createan authentic learning environment by guiding users throughinteractive lessons directly within the R console. The softwarepresents a choice of course lessons and interactively tutors a userthrough them. A user may be asked to watch a video, to answera multiple-choice or fill-in-the-blanks question, or to enter acommand in the R console precisely as if he or she were usingR in practice. Emphasis is on the last aspect, interacting with theR console. User responses are tested for correctness and hintsare given if appropriate. Progress is automatically saved so that auser may quit at any time and later resume without losing work.Once a lesson is completed, the Coursera Web site is notified sothat the student can receive credit for completing the lesson.
The entire course series is presented online through theCoursera platform (https://www.coursera.org/specialization/jhudatascience/1). Lectures are presented in video format withembedded video quizzes.
2.2.5 A Statistics-infused Introduction to Computer Science,Paul Roback and Olaf Hall-Holt, St. Olaf College
At St. Olaf College, a data-driven (or statistics-infused) intro-duction to computer science for budding statisticians and otherswho need to understand and use computational tools in han-dling data was developed as part of a collaboration between theStatistics and Computer Science Programs. The course, calledCS125 Computer Science for Scientists and Mathematicians,was first offered in Spring 2013. It is a recommended electivefor the statistics concentration at St. Olaf, while also servingas a prerequisite for courses in the computer science major aswell as a way for students to satisfy their general educationrequirement in abstract and quantitative reasoning. In its threeinitial offerings, CS125 has been bursting at the seams, draw-ing from diverse audiences that span second-semester seniorsseeking a deeper understanding of R after seeing it in severalprevious statistics courses, to students attracted to future statis-tics courses after their exposure to data-centric projects, andstudents recognizing the course as potentially useful for futurescientific research. The course description appears below:
CS125 introduces popular tools for handling data, includ-ing (1) obtaining data from Web sources, (2) visualizingthe data, (3) searching for important patterns in multidimen-sional data, and (4) sharing results on the Web. The emphasisin this course is not just a particular set of tools, but also abroad perspective on computing that applies to many differ-ent application areas over time. The approach is hands-on,working with real world datasets. Students in biology, chem-istry, mathematics, psychology and statistics are especiallyencouraged to consider this course. The only prerequisite isCalculus I; no prior experience with statistics or program-ming is required.
Students completing CS125 should understand fundamentalprogramming principles—computational and algorithmic think-ing as a problem solving strategy—and have established a baseof knowledge from which they can easily pick up new tools inthe future. With this in mind, the development team decided tointroduce two languages: R and Python. Python and R are bothwidely used by data scientists, often in tandem, since they have
The American Statistician, November 2015, Vol. 69, No. 4 347
Dow
nloa
ded
by [
Purd
ue U
nive
rsity
Lib
rari
es]
at 1
3:54
31
Janu
ary
2016
different strengths and weaknesses. Python is a great beginninglanguage with a rich ecosystem of pedagogical materials and isoften convenient for data collection and formatting. R is used inall courses in the statistics concentration at St. Olaf for data anal-ysis and visualization. Students can also benefit from a languagecomparison, whereby they can glimpse the difference betweena foundational computational structure and a choice that is spe-cific to a single programming language. The statistics facultywas highly supportive of the decision to provide the studentswith the tools to use both Python and R. Generally, the fac-ulty hope to enable statistics students to be more self-sufficientin collecting and preparing data, especially data that does notimmediately follow traditional rows-as-observational units andcolumns-as-variables formatting (e.g., unstructured text).
The course is taught in an environment conducive to inter-active learning. The classroom is equipped with 16 Linux ma-chines and 9 projectors connected to these machines. Beforeeach class, students are expected to read selections from as-signed texts (and sometimes search the Web for certain answersand approaches) and apply the ideas they have read about toseveral exercises. The first part of each class is devoted to a dis-cussion of questions that students submitted before class, whilethe second half of class often features small groups of studentsat the boards working on in-class problems designed to illustratecoding logic.
In some ways, CS125 at St. Olaf is a work in progress, but inother ways it has already successfully filled a strong need. Thebiggest challenges are the heavy workload for an introductorycourse and the diversity of students attracted to the course. Stu-dents willing to invest the necessary time report high satisfactionwith the knowledge they accumulate; however, the current set oftopics and assignments will probably have to be pared down toavoid turning off students who are newer to computing or whoare balancing heavy course loads, since some students bridleat the “teach yourself” ethos that is sometimes seen in manycomputer science courses.
For the statistics curriculum, this course has quickly becomeindispensable. By far the most common suggestion statisticsconcentrators make during exit surveys and interviews is to re-quire CS125 early in the concentration, or at least to advisestudents to take it at some point. Since the courses in statisticalmodeling and theory are methods-focused, they can only devoteso much time to the finer points of R programming and trou-bleshooting. Junior and senior concentrators who have takenCS125 have universally praised the insights gained into R (andcomputing in general).
For faculty in statistics and computer science at St. Olaf, thedevelopment and implementation of CS125 has provided re-wards that have grown from their collaborative approach. Thestatistics faculty saw how computer scientists develop and con-nect ideas in programming, what tools are effective for dataorganization and Web scraping, and how to present these ideasthrough out-of-class and in-class work. The computer sciencefaculty learned R, which is used less often in their community,and saw how statisticians think about data and then use softwareto gain insights into their data. By jointly offering the course,both the statistics and CS faculty are better able to stay abreastof the changes that the data science movement is making to both
disciplines. More immediately, the computer scientists have anew course which supports a growing body of data-centric non-majors while providing potential majors a valuable start, and thestatisticians have a popular elective course in beginning data sci-ence for their concentrators without reducing course offeringselsewhere. As they speak with colleagues at other institutions,the St. Olaf faculty are struck by the perceived barriers to collab-oration between many statisticians and their computer sciencecolleagues. This model demonstrates the value of engaging eachother in conversations and initiatives that can be enriching forboth faculty members and students.
All daily assignments and larger projects can be found on theclass wiki at http://www.cs.stolaf.edu/wiki/index.php/CS125.
2.2.6 An Introduction to Big Data Analysis, Mark DanielWard, Purdue University
Purdue University is one of the largest producers of under-graduate statistics majors. The Introduction to Big Data Analysiscourse is part of a new initiative in Purdue’s NSF-funded Statis-tics Living-Learning Community (STAT-LLC), which began infall 2014. The STAT-LLC is a unique, immersive experience forapproximately 20 students per year. It unites many of the ele-ments of the undergraduate experience. The program is aimed atsophomores, with the goal of creating a bridge from the first-yeargeneral curriculum into sophomore year statistics major coursesand into a student’s first research experience in data analysis,especially with big data. Through this unique experience, theexpectation is for students to be:
• more likely to stay in their chosen major program (improvedretention rates),
• more confident in their coursework and their research,• more successful in their sophomore-year academic courses,
and• well-positioned for graduate school and post-graduate expe-
riences and careers.
The program includes academic courses, residential life, pro-fessional development, and mentored research projects that lasta full calendar year (as opposed to a summer research experi-ence). The students take three core courses as a cohort: proba-bility theory, statistical theory, and this new course in big dataanalysis. They live together in a common residence hall with adining court. They also enroll in a year-long professional devel-opment seminar that touches on all aspects of university life, andon their future careers and training. Their research experiencesare supported by faculty mentors from statistics and applieddisciplines.
The Introduction to Big Data Analysis course focuses oncomputational tools for representing, extracting, manipulating,interpreting, transforming, and visualizing data. It is a statisticselective and has no prerequisites. The first half of the course in-troduces students to the R platform, and to basic data structures,exploratory data analysis, data visualization, random numbergeneration and simulation, and an introduction to linear mod-els. The second half of the course includes topics such as bashshell and shell scripting; awk, regular expressions, and patternmatching; relational databases using SQL; and XML parsingand Web scraping. In the future, it is likely that the course will
348 Statistics and the Undergraduate Curriculum
Dow
nloa
ded
by [
Purd
ue U
nive
rsity
Lib
rari
es]
at 1
3:54
31
Janu
ary
2016
be expanded to include parallelism and distributed data withHadoop and MapReduce.
The course is taught in a flipped environment. The courseWeb page contains videos, computer code, and notes about thetopics. The entire course is project-based, using datasets chosenfrom various areas of application. Students work in teams ina computer laboratory and perform all of their computationsremotely, on a server. Through the projects and assignments, thestudents gain practical experience in effectively communicatinginsights about data.
All course materials are available at http://llc.stat.purdue.edu/2014/29000/index.html.
3. CURRICULAR TOPICS
The prototypes described in the previous section differ inlevel and audience. They range from introductory courses indata technologies, to a core course for the undergraduate ma-jor, to a 36-week data science specialization. Yet, many topicsarose repeatedly, and for faculty who have just started to con-sider how to introduce data science in their curricula, Table 1may provide ideas for key topics. Decisions about what topicsto include, how much time to dedicate to them, and in what se-quence they should be covered will in part depend on curricularconstraints and decisions of the local institution. Despite this,we provide here some ideas to consider when developing andupdating curriculum to include data science topics.
Programming. Programming is an essential skill for data sci-ence. As seen in Table 1, we consider programming to includeconcepts of structured programming and higher order notionsof efficiency, and in some cases, high performance computing.It is no longer adequate training for statistics students to beable to analyze data using graphical user interfaces or to writesimple scripts that do not use modular approaches (includingwriting functions and code using control flow) to process data.At some institutions, it may be possible to have programmingexperience as a prerequisite for a data science course. However,most of the example courses here do not have such a prereq-uisite. This is predominately due to three constraints: the extraprerequisite limits enrollment because students in some fields,for example, the social sciences, might not have taken the pre-requisite course; requiring such a course may be perceived bythese same students as a barrier to enrollment; and the datascience course offers an important and unique integration ofprogramming concepts with data handling and analysis. Thisintegration yields a course that has a very different focus fromtypical introductory programming courses and that can amelio-rate the difficulties with learning programming concepts becausethey are couched in a framework that emphasizes learning fromdata.
Data Technologies and Formats. These two areas are essentialto any data science course. The division of these topics intothe two areas of data technologies and formats in Table 1 issomewhat arbitrary. For example, a relational database has aspecific data format but it is included under technologies becauseSQL is a language for accessing data in a database. Similarly,text data appears under the data formats heading, but it typicallyrequires some level of familiarity with regular expressions to
extract information for analysis. The University of Aucklandis the exception in the courses presented in not addressing textand regular expressions. This is due to the focus of that courseon Web technologies and because the material is covered inone of the other two computing electives in their program. Thetopics of XML and shell commands are not universally includedin these courses. There are many arguments for including andexcluding these topics in the course. For example, knowledgeof the shell is very useful for programmatic handling of files,such as thousands of twitter messages. It also has the advantageof offering an example of trees and hierarchical data structures,an important CS concept that can help students understand howinformation is organized.
Statistical Topics. We believe it is crucial to include statisticaltopics in the course and not simply limit topics to those of datawrangling because an understanding of how we might analyzethe data impacts how we process the data. Additionally, as manyof the course creators have indicated, they see data science asoffering an opportunity to expose students to the entire dataanalysis process and to teach statistical thinking in alternative,more realistic contexts. Some of the prototypes introduce visu-alization early in the course. Two reasons are given for this: itprovides a platform for introducing computational notions thatlead to rewarding outcomes, for example, a beautiful plot, andbecause visualization can be reinforced throughout the rest of thecourse. Including modern methods in the curriculum providesfun ways to apply more complex and advanced methods. In sucha course, the focus tends to be more on the statistical ideas andless on formal properties of the methods. Many advanced meth-ods would be appropriate to include, with the selection focusingon those that are computationally intensive and intuitive. Ex-amples include recursive partitioning, support vector machines,nearest-neighbor methods, little bag of bootstraps, and LASSO.The topic of simulation can be approached from a resamplingperspective and/or a simulation study/experiment. The collec-tion of these topics seems more an artifact of the presence or theabsence of other computational courses in the curriculum. Forexample, at Auckland there are three computing courses andso less pressure to include “everything.” Additionally, since thewriting of this article, UC Davis has converted their one-quartercomputing course into three quarter courses. The first focuseson programming and includes workflow and simulation topics.The second has a focus on data technologies, and the last coversnew topics on advanced computing methods, for example, highperformance computing.
It is difficult to quantify the time spent in a course on thetopics found in Table 1 because topics are often taught simul-taneously and early topics are reinforced when covering latertopics. Also, we did not include the basics of learning a com-puter language, for example, expressions and data types, underthe programming topic in Table 1. However, we attempt to givethe reader a better sense of the balance of topics for two courses(St. Olaf and Berkeley) by examining the assignments for thecourses. At St. Olaf, the student work consists of 29 homeworkassignments due at each class meeting and 5 larger projects.At Berkeley, the student work consists of 11 weekly lab assign-ments, 8 homework assignments, and 2 projects (plus a midtermand final). For each course, we reviewed the various assignments
The American Statistician, November 2015, Vol. 69, No. 4 349
Dow
nloa
ded
by [
Purd
ue U
nive
rsity
Lib
rari
es]
at 1
3:54
31
Janu
ary
2016
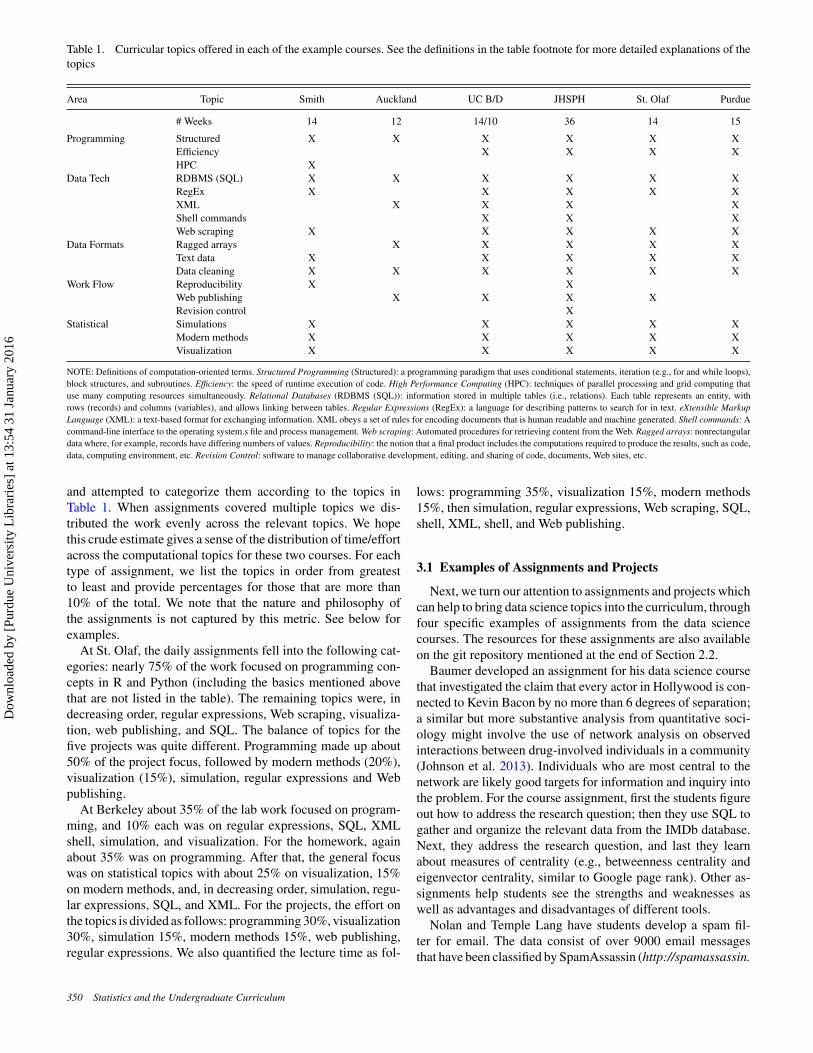
Table 1. Curricular topics offered in each of the example courses. See the definitions in the table footnote for more detailed explanations of thetopics
Area Topic Smith Auckland UC B/D JHSPH St. Olaf Purdue
# Weeks 14 12 14/10 36 14 15
Programming Structured X X X X X XEfficiency X X X XHPC X
Data Tech RDBMS (SQL) X X X X X XRegEx X X X X XXML X X X XShell commands X X XWeb scraping X X X X X
Data Formats Ragged arrays X X X X XText data X X X X XData cleaning X X X X X X
Work Flow Reproducibility X XWeb publishing X X X XRevision control X
Statistical Simulations X X X X XModern methods X X X X XVisualization X X X X X
NOTE: Definitions of computation-oriented terms. Structured Programming (Structured): a programming paradigm that uses conditional statements, iteration (e.g., for and while loops),block structures, and subroutines. Efficiency: the speed of runtime execution of code. High Performance Computing (HPC): techniques of parallel processing and grid computing thatuse many computing resources simultaneously. Relational Databases (RDBMS (SQL)): information stored in multiple tables (i.e., relations). Each table represents an entity, withrows (records) and columns (variables), and allows linking between tables. Regular Expressions (RegEx): a language for describing patterns to search for in text. eXtensible MarkupLanguage (XML): a text-based format for exchanging information. XML obeys a set of rules for encoding documents that is human readable and machine generated. Shell commands: Acommand-line interface to the operating system.s file and process management. Web scraping: Automated procedures for retrieving content from the Web. Ragged arrays: nonrectangulardata where, for example, records have differing numbers of values. Reproducibility: the notion that a final product includes the computations required to produce the results, such as code,data, computing environment, etc. Revision Control: software to manage collaborative development, editing, and sharing of code, documents, Web sites, etc.
and attempted to categorize them according to the topics inTable 1. When assignments covered multiple topics we dis-tributed the work evenly across the relevant topics. We hopethis crude estimate gives a sense of the distribution of time/effortacross the computational topics for these two courses. For eachtype of assignment, we list the topics in order from greatestto least and provide percentages for those that are more than10% of the total. We note that the nature and philosophy ofthe assignments is not captured by this metric. See below forexamples.
At St. Olaf, the daily assignments fell into the following cat-egories: nearly 75% of the work focused on programming con-cepts in R and Python (including the basics mentioned abovethat are not listed in the table). The remaining topics were, indecreasing order, regular expressions, Web scraping, visualiza-tion, web publishing, and SQL. The balance of topics for thefive projects was quite different. Programming made up about50% of the project focus, followed by modern methods (20%),visualization (15%), simulation, regular expressions and Webpublishing.
At Berkeley about 35% of the lab work focused on program-ming, and 10% each was on regular expressions, SQL, XMLshell, simulation, and visualization. For the homework, againabout 35% was on programming. After that, the general focuswas on statistical topics with about 25% on visualization, 15%on modern methods, and, in decreasing order, simulation, regu-lar expressions, SQL, and XML. For the projects, the effort onthe topics is divided as follows: programming 30%, visualization30%, simulation 15%, modern methods 15%, web publishing,regular expressions. We also quantified the lecture time as fol-
lows: programming 35%, visualization 15%, modern methods15%, then simulation, regular expressions, Web scraping, SQL,shell, XML, shell, and Web publishing.
3.1 Examples of Assignments and Projects
Next, we turn our attention to assignments and projects whichcan help to bring data science topics into the curriculum, throughfour specific examples of assignments from the data sciencecourses. The resources for these assignments are also availableon the git repository mentioned at the end of Section 2.2.
Baumer developed an assignment for his data science coursethat investigated the claim that every actor in Hollywood is con-nected to Kevin Bacon by no more than 6 degrees of separation;a similar but more substantive analysis from quantitative soci-ology might involve the use of network analysis on observedinteractions between drug-involved individuals in a community(Johnson et al. 2013). Individuals who are most central to thenetwork are likely good targets for information and inquiry intothe problem. For the course assignment, first the students figureout how to address the research question; then they use SQL togather and organize the relevant data from the IMDb database.Next, they address the research question, and last they learnabout measures of centrality (e.g., betweenness centrality andeigenvector centrality, similar to Google page rank). Other as-signments help students see the strengths and weaknesses aswell as advantages and disadvantages of different tools.
Nolan and Temple Lang have students develop a spam fil-ter for email. The data consist of over 9000 email messagesthat have been classified by SpamAssassin (http://spamassassin.
350 Statistics and the Undergraduate Curriculum
Dow
nloa
ded
by [
Purd
ue U
nive
rsity
Lib
rari
es]
at 1
3:54
31
Janu
ary
2016
apache.org). The first step is to process the raw text messages,which appear in individual files, into a form conducive to sta-tistical analysis. For example, students use regular expressionsto separate the header from the body and attachments to ex-tract from the header the key-value pairs, such as, the sender,time it was sent, subject line, etc., and create variables andvalues containing this information. The students also use regu-lar expressions to locate the words in the email body and con-vert them into a word vector, that is, counts of occurrences ofall words in the corpus. After converting the email into infor-mation that can be used for analysis, the students use naı̈veBayes to calculate the likelihood a message is spam given itsword vector. Alternatively, students write functions to derivevariables from characteristics of a message and use these vari-ables to classify email with a decision tree. In both approaches,the assignment continues with the students choosing a thresh-old/model via cross-validation, assessing the fitted model withtest data that they have set aside in advance, and considering theconfusion matrix of false positives and negatives.
One team assignment from the St. Olaf course is called The“Residence Hall Energy Use” project. This project asks stu-dents to visualize on-campus energy-use data and then applythose techniques to energy usage on a global scale. This assign-ment, however, differs from a typical statistics course projectby emphasizing the entire process of data analysis and the com-putational aspects of each step. Initially, students clean the databy writing functions to manage categorical variables, calculatecontinuous summaries, and split strings. Students additionallyuse random forests to impute missing data, and ggplot2 (Wick-ham 2009) to visualize the data. Finally, students must interprettheir plots at both the campus and the global levels.
Peng and collaborators have coincidentally embraced thecommunication aspects related to statistics and data sciencethat the ASA’s new undergraduate curriculum guidelines(http://www.amstat.org/education/curriculumguidelines.cfm)emphasize. In particular, one of the courses within the special-ization is on Developing Data Products, which encompasses theformal presentation of a statistical analysis via an interactiveWeb interface. The students learn to use the Shiny applicationin R (http://shiny.rstudio.com) to create interactive graphicsand communicate uncertainty in statistical results. The finalproject for this module in the Data Science Specializationhas students create a Shiny Web application (see examples,http://shiny.rstudio.com/gallery/ ) with associated documen-tation. Additionally, each student pitches their product usingreproducible R computations which is both embedded in theShiny application, presented using Slidify, and pushed togithub.
4. SUMMARY DISCUSSION
As faculty who have worked to integrate aspects of data sci-ence into our own curricula, we have a number of reflections onthe various implementations presented here. The most strikinghighlight is that all faculty report how popular their courses areand how rewarding they are to teach. Not surprisingly, a coursethat incorporates data science can be a way to excite studentsabout further study in statistics. We conjecture that one reason
for high enrollments in the data science classes at these institu-tions is that the students perceive these courses as relevant andexciting.
We also contend that incorporating data science into the statis-tics curricula gives us an opportunity to teach statistical methods,thinking, practice, and computation in a modern venue that ismeaningful to students and aligned with the goals of a statisticseducation. We assert that to analyze the data of today and thefuture, these techniques need to include more data related skills.
In the data science courses described above, students havethe opportunity to repeatedly participate in the entire data anal-ysis cycle: forming a research question, obtaining data, format-ting and cleaning data, analyzing, and communicating results.Whereas the first few aspects of carrying out an analysis havetypically been skipped in too many traditional courses and cur-ricula (Zhu et al. 2013), using a data centric approach requiresstudents to follow the entire trajectory to understand the sourceand inherent variability of the data. Moreover, with a data sci-ence course it is possible to integrate statistical thinking withcomputing with experience with data—the goal is to focus onthe computational problem solving aspects of carrying out adata analysis. The recommendation for repeated exposure tothis cycle flows directly from guidance on the structure of thestatistics curriculum (ASA 2014).
Class projects and assignments in data science courses differfrom traditional computer science assignments and from tradi-tional data analysis assignments because they typically requireboth a demonstration of computing aptitude and insight into thedata analysis. Grading of the assignments can be cumbersome.Systems such as Murrell’s relieve the burden of grading code.Assignments such as these often require the students to write uptheir analysis and findings, and Peng’s peer grading system triesto address this aspect of the grading. Both of these grading sys-tems are useful in reducing the burden of grading when there area large number of students in the course. However, there are addi-tional considerations that need to be addressed. Statistics facultyhave typically not been trained to evaluate technical writing orcoding of their students, which in turn means the students (i.e.,peer graders) do not receive adequate training either. Moreover,assignments that require data analysis are often very open-endedand developing tests for code can be difficult without makingthe assignment overly prescriptive. For faculty who are inter-ested in developing their pedagogical abilities in data science,we recommend participation in relevant workshops and semi-nars that focus on such topics. Recent workshops include the 3rd
Computation and Visualization Consortium Workshop (http://www.macalester.edu/hhmi/curricularinnovation/cvc/ ) and NSFWorkshops through the UC Davis Data Sciences Initiatives(http://datascience.ucdavis.edu/NSFWorkshops/ ).
It is worth noting that the courses described here have veryfew, if any, prerequisites. Some require introductory statistics,and one has a computer science requirement. The lack of re-quirements may be one reason for the heterogeneity in studentbackground, which all of the faculty we surveyed noted as achallenge. We also think that it is due to limited exposure tocomputing concepts in K-12 education. Despite this dispar-ity, the faculty have devised a variety of approaches to keepthe students engaged and challenged but not overwhelmed. For
The American Statistician, November 2015, Vol. 69, No. 4 351
Dow
nloa
ded
by [
Purd
ue U
nive
rsity
Lib
rari
es]
at 1
3:54
31
Janu
ary
2016
example, they have developed assignments that can be adaptedor extended to meet the disparate background levels of the stu-dents. Other strategies employed include the careful sequencingof material, creating learning communities through peer learn-ing cohorts or peer grading, and modular assignments.
The course implementations also provide examples of howdata science can be successfully integrated into the statistics cur-ricula. Faculty considering implementing a data science coursemust face the question of how the new course fits into theircurriculum. Berkeley and Davis require the data science coursefor the major, but Auckland, Smith, and St. Olaf offer it as anelective. We note that Berkeley reduced the number of mathe-matics requirements from 5 to 4 to add this new requirement.Davis initially offered the course as an elective, and soon after-ward, the value of this training for advanced courses in statisticalmethods was recognized among the faculty and it became a re-quired course. Alternatively, St. Olaf has successfully developeda mutually beneficial partnership between the Statistics and CSprograms, which enables them to offer this course through CSand not Statistics. Collaborations, in general, may offer a modelfor other schools where faculty workload is a constraint or whereonly a limited number of statistics courses are offered. Althoughthe course in data technologies is not required at Auckland, thedepartment offers several popular electives in computing.
We further claim that the topics covered in data sciencecourses can and should be brought into a variety of statisticscourses. That is, although we have presented full classes ondata science, our hope is that many of the examples, assign-ments, and topics presented in Table 1 make their way into otherstatistics courses. Key data science skills need to be introduced,reiterated, and reinforced throughout the statistics curriculum.For example, it is possible to bring small examples of SQLqueries into introductory statistics (Horton et al. 2015). Earlyintroduction of data science ideas and methods will not onlymake the tasks in the later data science course easier, but itmay excite students about the wealth of exciting topics withinstatistics—encouraging them to go on to take a data sciencecourse (Gould 2010). After having taken a data science elec-tive, capstones, summer experiences ( e.g., Summer Institute forTraining in Biostatistics, Explorations in Statistical Research;Nolan and Temple Lang 2015b) and competitions can solidifyskills garnered in a data science course. For example, a seniorthesis or capstone project that incorporates data managementand manipulation, scraping data from the Web, and interactivedata visualizations, allows students to solidify their data skillsin a way that a typical course cannot.
Competitions allow for students to put their abilities to use.Recent contests have played a central role in getting stu-dents excited about statistics and exposing them to authenticdata analysis problems. For example, see the DataFest (Gouldet al. 2014), Kaggle predictive modeling competitions (https://www.kaggle.com/competitions), ASA’s Data Expo (http://stat-computing.org/dataexpo/ ), Undergraduate Statistics ProjectCompetition (USPROC, https://www.causeweb.org/usproc/ ),and Midwest Undergraduate Data Analytics Competition (MU-DAC, http://www.mudac.org/ ). It is important to note that thesecompetitions take the onus off the faculty member teachingan entire course and changes it into a student run/lead investi-
gation solving a real data problem. Additionally, students areable to display their data science skills publicly. Indeed, atthe 2014 and 2015 Five College DataFest competition, a teamof students from Baumer’s class won Best in Show for theiranalyses.
In summary, the main objective of this article is in makingconcrete recommendations about ways that new capacities indata science can be implemented in the undergraduate curricu-lum. Nolan and Temple Lang (2010), Brown and Kass (2009),ASA (2014), Cobb (2015) and others have called for a compre-hensive restructuring of how students are prepared to deal withthe myriad of data they will see in their careers. This articletakes these recommendations a step further by offering a vari-ety of example implementations, along with syllabi and coursematerials to compare and contrast, to adopt and adapt, and toassist faculty who want to modernize their statistics programs.
[Received November 2014. Revised July 2015.]
REFERENCES
American Statistical Association Undergraduate Guidelines Workgroup (ASA)(2014), 2014 Curriculum Guidelines for Undergraduate Programs in Statis-tical Science, Alexandria, VA: American Statistical Association. Available athttp://www.amstat.org/education/curriculumguidelines.cfm. [343,351,352]
Bailer, J., Hoerl, R., Madigan, D., Montaquila, J., and Wright, T. (2012), Re-port of the ASA Workgroup on Master’s Degrees, Alexandria, VA: Amer-ican Statistical Association. Available at http://magazine.amstat.org/wp-content/uploads/2013an/masterworkgroup.pdf . [344]
Baumer, B. (2015), “A Data Science Course for Undergraduates: Thinking WithData,” The American Statistician, this issue. [345]
Brown, E., and Kass, R. (2009), “What is Statistics?" The American Statistician,63, 105–110. [352]
Cleveland, W. (2001), “Data Science: An Action Plan for Expanding the Tech-nical Areas of the Field of Statistics,” International Statistics Review, 69,21–26. [343]
Cobb, G. (2015), “Mere Renovation is Too Little Too Late: We Need to Re-think the Undergraduate Curriculum from the Ground Up,” The AmericanStatistician, this issue. [352]
Cuny, J., Snyder, L., and Wing, J. M. (2010), Demystifying Com-putational Thinking for Non-Computer Scientists. Available athttp://www.cs.cmu.edu/˜CompThink/resources/TheLinkWing.pdf [344]
Gould, R. (2010), “Statistics and the Modern Student,” International StatisticalReview, 78, 297–315. [352]
Gould, R., Baumer, B., Mine, C.-R., and Bray, A. (2014), “Big DataGoes to College,” AMSTAT News, available at http://magazine.amstat.org/blog/2014/06/01/datafest/ . [352]
Greenhouse, J. B. (2013), “Statistical Thinking: the Bedrock of Data Science,”The Huffington Post. Available at http://www.huffingtonpost.com/american-statistical-association/statistical-thinking-the-bedrock-of-data-science b3651121.html. [343]
Horton, N. J., Baumer, B. S., and Wickham, H. (2015), “Setting the Stage forData Science: Integration of Data Management Skills in Introductory andSecond Courses in Statistics,” CHANCE, 28, 40–50. [352]
Johnson, J., Reitzel, J. D., Norwood, B., McCoy, D., Cumming, B., and Tate,R. (2013), Social Network Analysis: A Systematic Approach for Investigat-ing, FBI Law Enforcement Bulletin. Available at https://leb.fbi.gov/2013/march/social-network-analysis-a-systematic-approach-for-investigating.[350]
352 Statistics and the Undergraduate Curriculum
Dow
nloa
ded
by [
Purd
ue U
nive
rsity
Lib
rari
es]
at 1
3:54
31
Janu
ary
2016
Johnstone, I., and Roberts, F. (2014), Data Science at NSF, NSF. Availableat http://www.nsf.gov/attachments/130849/public/Stodden-StatsNSF.pdf .[344]
Madigan, D. (2014), Statistics and Science: A Report of the London Work-shop on the Future of the Statistical Sciences, available at http://www.worldofstatistics.org/wos/pdfs/Statistics&Science-TheLondonWorkshopReport.pdf . [343]
Manyika, J., Chui, M., Brown, B., Bughin, J., Dobbs, R., Roxburgh, C., and HungByers, A. (2011), Big Data: The Next Frontier for Innovation, Competition,and Productivity, Philadelphia, PA: McKinsey & Company. Available athttp://www.mckinsey.com/insights/business technology/big data the nextfrontier for innovation. [343]
Murrell, P. (2009), Introduction to Data Technologies, New York: ChapmanHall/CRC Press. Available at https://www.stat.auckland.ac.nz/∼paul/ItDT/ .[346]
National Academy of Sciences (2010), Rising Above the Gathering Storm,Revisited: Rapidly Approaching Category 5, Washington, DC: The NationalAcademies Press. [343]
Nolan, D., and Temple Lang, D. (2010), “Computing in the Statistics Curricula,”The American Statistician, 64, 97–107. [352]
——— (2015a), Data Science in R: A Case Studies Approach to ComputationalReasoning and Problem Solving. Boca Raton, FL: CRC Press. [346]
——— (2015b), “Explorations in Statistics Research: A Model for Undergrad-uate Co-Curricular Exposure to Modern Research Problems,” The AmericanStatistician, this issue. [352]
Pierson, S. (2014), Bachelor’s Degrees in Statistics Surge Another20%,” AMSTAT News, available at http://magazine.amstat.org/blog/2014/09/01/degrees/ . [343]
van Dyk, D., Fuentes, M., Jordan, M. I., Newton, M., Ray, B. K., Temple Lang,D., and Wickham, H. (2015), “ASA Statement on the Role of Statistics inData Science,” Amstat News, available at http://magazine.amstat.org/blog/p2015/10/01/asa-statement-on-the-role-of-statistics-in-data-science/. [344]
Wickham, H. (2009), ggplot2: Elegant Graphics for Data Analy-sis, New York: Springer. Available at http://had.co.nz/ggplot2/book.[351]
——— (2014), “Tidy Data,” Journal of Statistical Software, 59, available athttp://www.jstatsoft.org/article/view/v059i10. [345]
Wills, J. (2015), New to Data Science. Available at http://www.cloudera.com/content/cloudera/en/developers/home/developer-admin-resources/new-to-data-science.html. [344]
Zhu, Y., Hernandez, L., Mueller, P., Dong, Y., and Forman, M. (2013),“Data Acquisition and Preprocessing in Studies on Humans: What is NotTaught in Statistics Classes?" The American Statistician, 67, 235–241.[351]
Zorn, P., Bailer, J., Braddy, L., Carpenter, J., Jaco, W., and Turner, P. (2014), TheINGenIOuS Project: Mathematics, Statistics, and Preparing the 21st Cen-tury Workforce, Washington, DC: The Mathematical Association of Amer-ica. Available at http://www.maa.org/programs/faculty-and-departments/ingenious. [343]
The American Statistician, November 2015, Vol. 69, No. 4 353
Dow
nloa
ded
by [
Purd
ue U
nive
rsity
Lib
rari
es]
at 1
3:54
31
Janu
ary
2016