Embed Size (px)
Citation preview
Page Footer
PREPAYMENT MONITORING REPORT First Quarter 2018
Prepayment Mon i tor ing Repor t F i r s t Quar ter 2018
i
Table of Contents
Introduction ............................................................................................................ 1
Alignment Activity ................................................................................................... 2
Prepayment Performance Charts and Tables ............................................................... 4
Charts ..................................................................................................................... 5
Data Tables ............................................................................................................ 13
Glossary ................................................................................................................. 21
Prepayment Mon i tor ing Repor t F i r s t Quar ter 2018
1
Introduction
FHFA’s 2014 Strategic Plan for the Conservatorships of Fannie Mae and Freddie Mac includes the goal of improving the overall liquidity of Fannie Mae’s and Freddie Mac’s (the Enterprises) securities through the development of a single, common mortgage-backed security. The new security will be called the Uniform Mortgage-Backed Security or UMBS and is designed to trade in the “To-Be-Announced” (TBA) market1 without regard to which Enterprise is the issuer. UMBS issued by Fannie Mae and Freddie Mac are designed to be fungible – that is, mutually interchangeable – in the TBA market. This fungibility is central to broadening and enhancing the liquidity of the secondary mortgage market on an ongoing basis.
This report provides insight into how FHFA monitors the consistency of prepayment rates across cohorts of the Enterprises’ TBA-eligible MBS. A prepayment on a mortgage loan is the amount of principal paid in advance of the loan’s scheduled payments. Full prepayment occurs when a borrower pays off the loan ahead of the scheduled
1 The TBA market is a forward market for certain mortgage-backed securities, including those issued by Fannie Mae and Freddie Mac.
maturity, refinances the mortgage, or sells the home. If a borrower defaults on the mortgage loan, the Enterprise will pay investors the remaining principal balance and remove the loan from the MBS. That action has the same effect on investors as a full prepayment. Partial prepayment occurs when a borrower pays principal in addition to the regularly scheduled payment of principal and interest.
Consistency of prepayment rates is important to the success of UMBS and to the efficiency and liquidity of the secondary mortgage market. Some industry stakeholders have expressed concern that the rates of prepayment of the Enterprises’ securities might materially diverge and undermine their fungibility. FHFA has taken a number of steps to promote the continued consistency of prepayment rates of Fannie Mae- and Freddie Mac-issued mortgage-backed securities (MBS). This quarterly report is part of that commitment and provides market participants additional transparency into the data FHFA receives and reviews on a monthly basis and into FHFA’s uses of that data.
Prepayment Mon i tor ing Repor t F i r s t Quar ter 2018
2
Alignment Activity
FHFA has established Enterprise guidelines for alignment on prepayment rates – also referred to as prepayment speeds – that require the Enterprises to identify and align those Enterprise programs, policies, and practices that could materially affect prepayments, and to develop strategies to address any actual or anticipated divergences in prepayment rates.
FHFA guidelines call for general alignment on the observed prepayments associated with Enterprise MBS at the cohort level but not complete alignment of the Enterprises’ programs, policies, and practices. Alignment efforts are required only on those innovations or other changes that are likely to cause a divergence of prepayment rates for two reasons: because the Enterprises remain separate entities and competitors and because complete alignment could hamper innovation by the Enterprises. Past innovations have delivered significant benefits to the secondary mortgage market and to mortgage borrowers.
To comply with FHFA guidelines, each Enterprise has a formal internal Enterprise-wide governance process to ensure that any significant changes proposed to its programs, policies, and practices are identified, reviewed, escalated, and submitted to FHFA for review in a timely manner. Such reviews have helped align Enterprise
prepayment rates in recent years and continue to help ensure that Enterprise business decisions consider investor interests.
For example, in 2017, the Enterprises and FHFA announced new streamlined refinance programs to replace the crisis-era Home Affordable Refinance Program (HARP). The new programs aim to assist borrowers who are current on their payments and who cannot refinance because their loan-to-value (LTV) ratios exceed the maximum otherwise allowed. Because these programs could significantly affect prepayment rates on TBA-eligible securities, FHFA required the Enterprises to align on all major program aspects prior to implementation.
The Enterprises are also required to monitor ex post all programs, policies, and practices for unanticipated effects on prepayment rates and security performance, and are required to report to FHFA any unexpected effects.
When circumstances arise that cause divergences in prepayment rates for some cohorts, notwithstanding these efforts, each Enterprise has strategies it can employ, with FHFA oversight, to address misalignment of prepayment rates.
FHFA will continue to require the Enterprises to submit non-public reports to FHFA with all proposed or pending
Prepayment Mon i tor ing Repor t F i r s t Quar ter 2018
3
changes as described in the Update on the Single Security Initiative and Common Securitization Platform, December 2017.
Ex post monitoring of the actual prepayment rates is part of a broader effort to assure investors that cash flows from UMBS will be similar regardless of which Enterprise is the issuer. FHFA monitors and evaluates prepayment rates of the TBA-eligible securities issued by the Enterprises. As noted above, FHFA is seeking general alignment on the observed prepayment rates associated with Enterprise MBS at the cohort level. By “general alignment,” FHFA means that those cash flows should be similar rather than identical. For this purpose, FHFA defines a cohort as those Enterprise TBA-eligible securities with the same coupon, maturity, and issuance year.
FHFA has set a minimum standard to trigger a review of the differences in prepayment rates of any given cohort. In general, FHFA investigates differences between actual Fannie Mae and Freddie Mac prepayment rates when the divergence for a cohort exceeds a conditional prepayment rate (CPR) of two percentage points. For a divergence in
2 The percentage triggers are based on the current interest rate environment and are subject to change over time.
CPR in excess of three percentage points, FHFA will require that the cause of the divergence be reported to FHFA’s internal Single Security Governance Committee.2 This committee monitors issuance and prepayment performance of Fannie Mae’s and Freddie Mac’s mortgage-backed securities and takes remedial actions to address prepayment differences between the two Enterprises’ mortgage-backed securities when they arise.
Prepayment Mon i tor ing Repor t F i r s t Quar ter 2018
4
Prepayment Performance Charts and Tables
FHFA uses the charts and data tables in this report to evaluate the alignment of loan attributes for newly issued Enterprise MBS and the prepayment performance of outstanding Enterprise MBS. These charts have been abridged to improve readability by omitting coupons and years with lower volumes of outstanding securities. FHFA monitors similar information for both Enterprises and for all coupons, maturities, and issuance years that account for outstanding volumes of more than $500 million.
A prepayment on a mortgage loan is the amount of principal paid in advance of the loan’s payment schedule. Full prepayment occurs when a borrower pays off the loan ahead of the scheduled maturity, refinances the mortgage, sells the home, or defaults on the mortgage loan. Partial prepayment occurs when a borrower pays principal in addition to the regularly scheduled payment of principal and interest.
When a loan is prepaid, an MBS investor receives the payment as principal. If the investor paid a premium for the security, the prepayment reduces the investor’s yield. Therefore, investors in premium securities look for MBS that are likely to prepay slower than other MBS. Similarly, investors in discounted securities prefer MBS with faster prepayment rates.
Market participants measure prepayments using the CPR, which is the percentage of the existing mortgage pool principal that is prepaid in a given period.
For further descriptions of how FHFA uses this information, see Update on the Single Security Initiative and Common Securitization Platform, December 2017.
Prepayment Mon i tor ing Repor t F i r s t Quar ter 2018
5
Charts
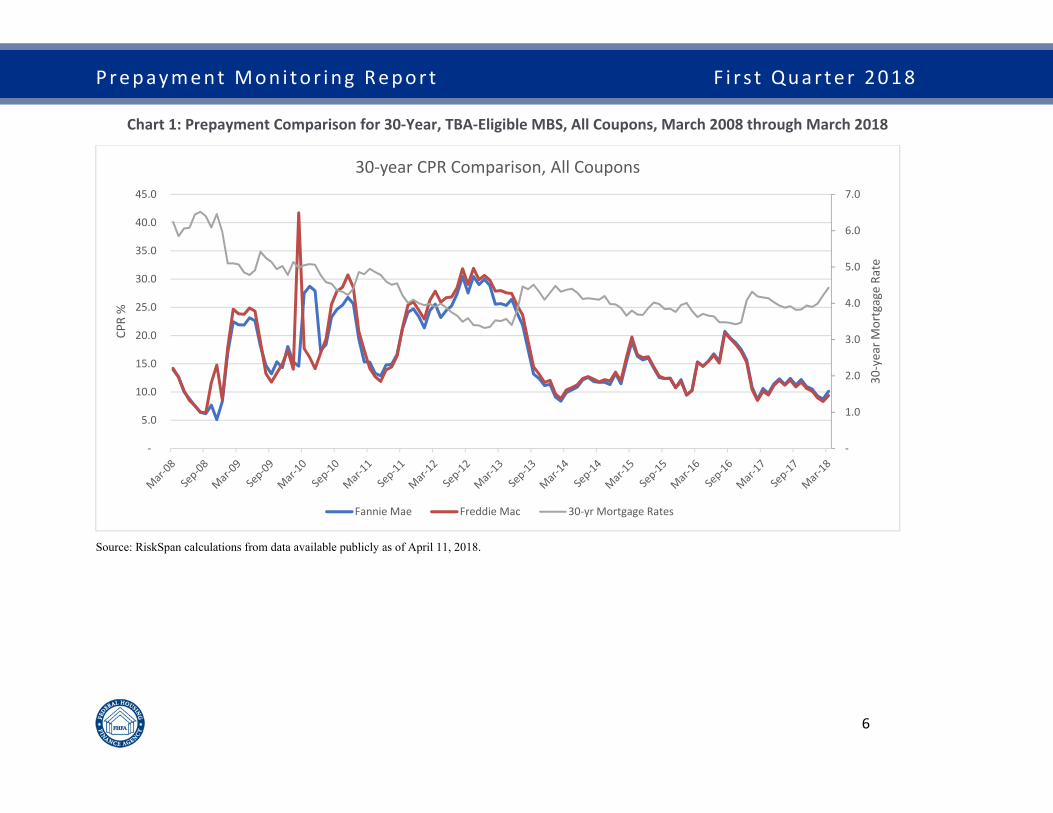
Chart 1 compares prepayment rates for all Fannie Mae and Freddie Mac TBA-eligible 30-year securities for the past ten years. Chart 1 also illustrates how prepayment rates (left axis) generally move in the opposite direction of the 30-year mortgage rate (right axis), illustrating how declines in mortgage rates generally lead to faster prepayment rates and vice versa.
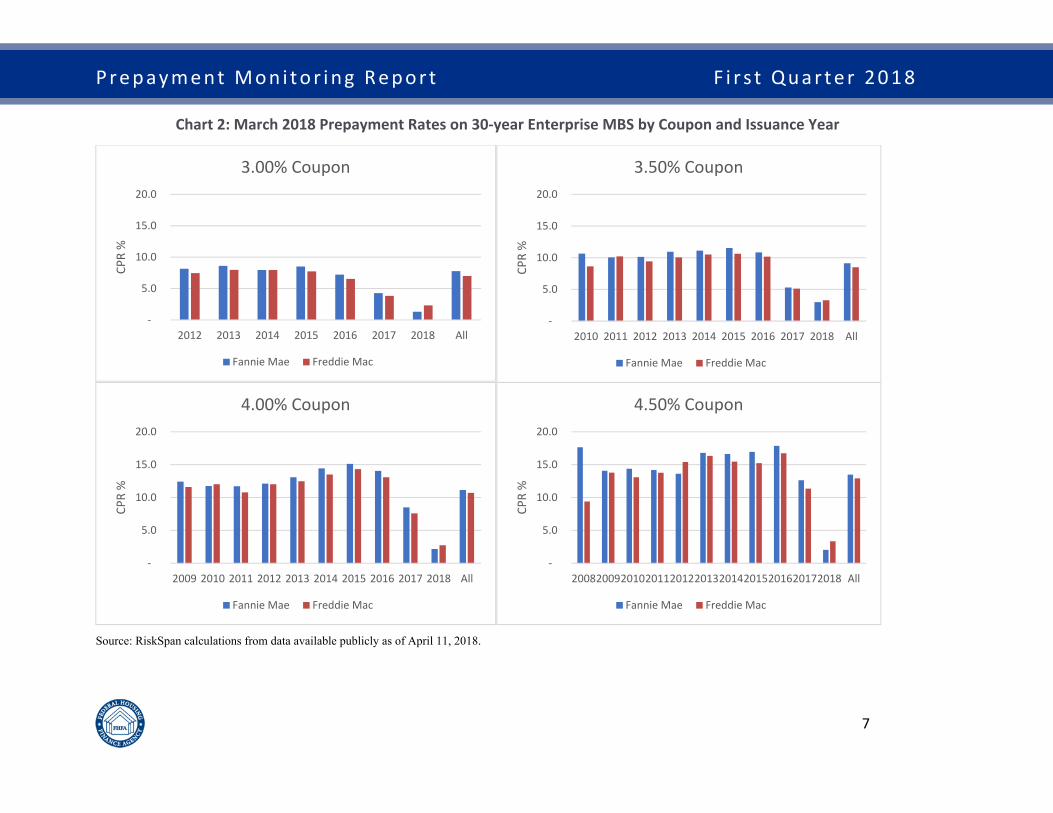
Chart 2 illustrates the comparison of pool issuance years for a given MBS coupon. Chart 2 shows March 2018 prepayment rates for each Enterprise’s 30-year MBS for the coupons with the greatest volume outstanding (3%, 3.5%, 4%, and 4.5%) and issuance years since 2011. FHFA uses these charts to assess the current alignment of CPRs for past origination cycles and the general trend of alignment across issuance years.
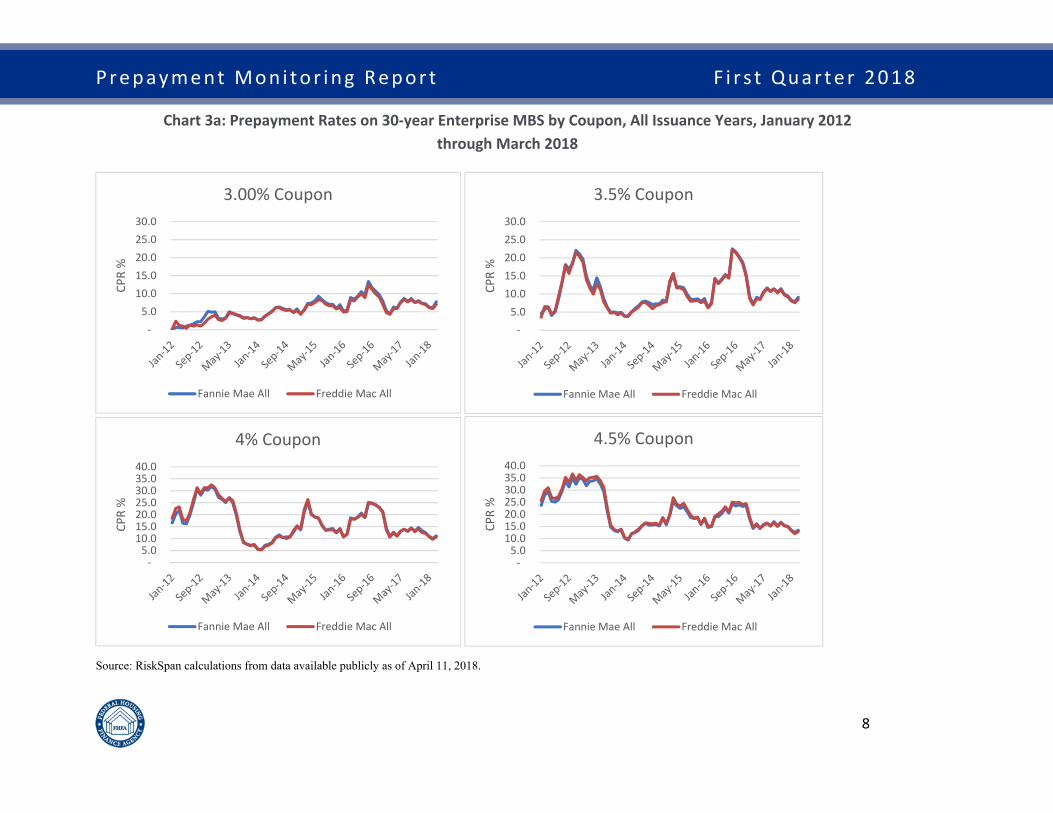
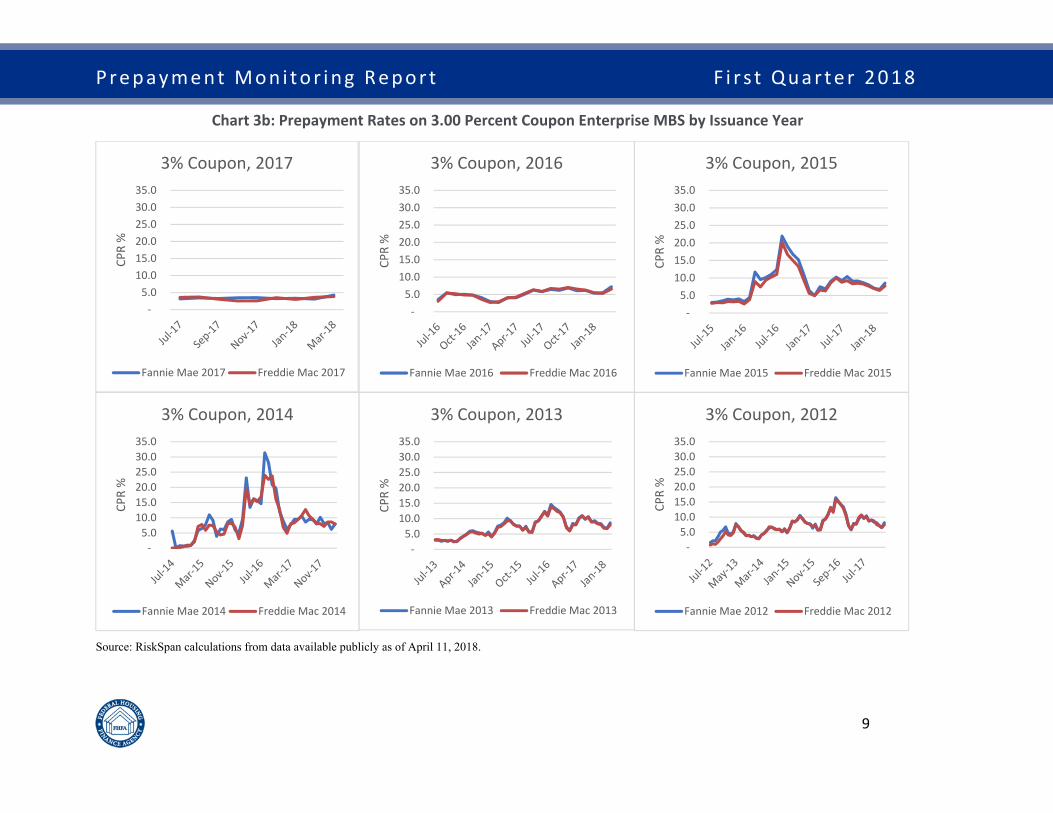
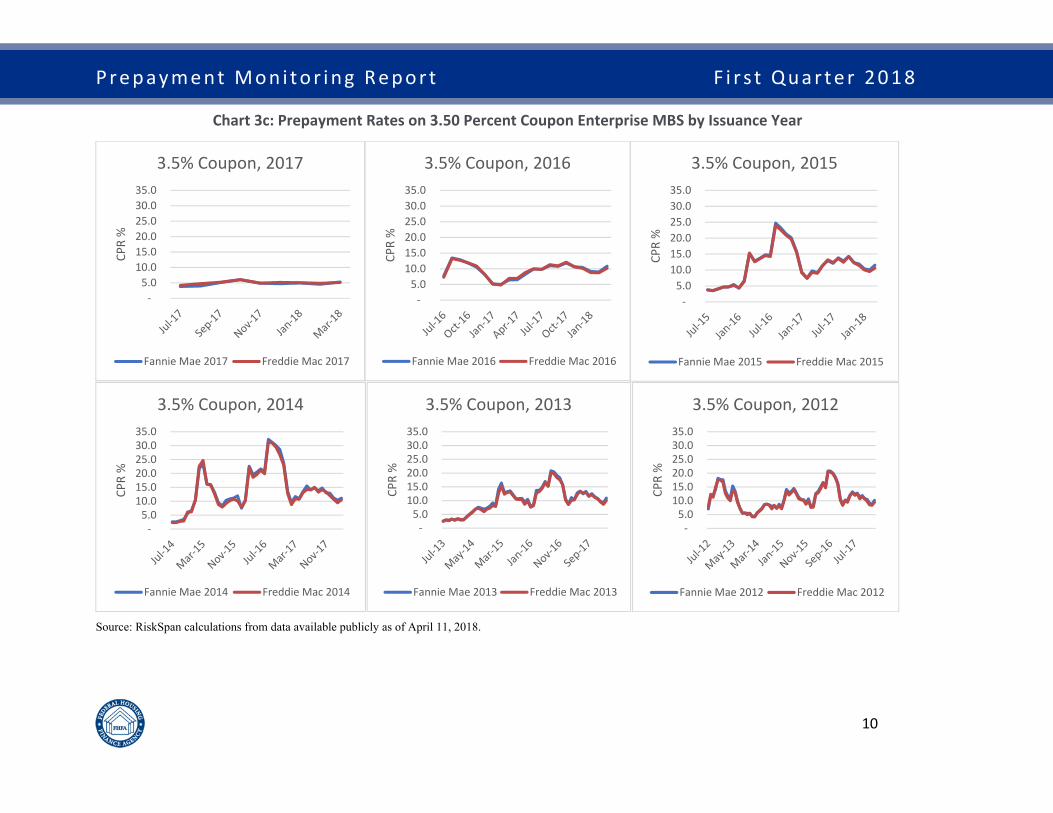
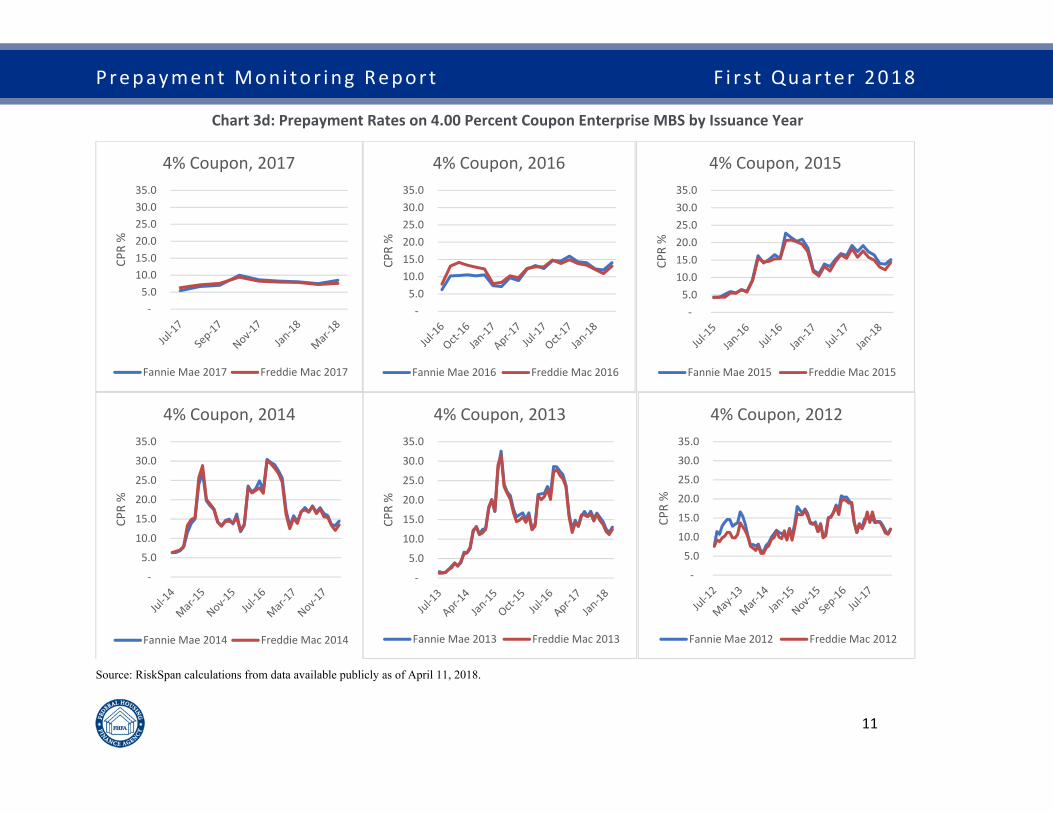
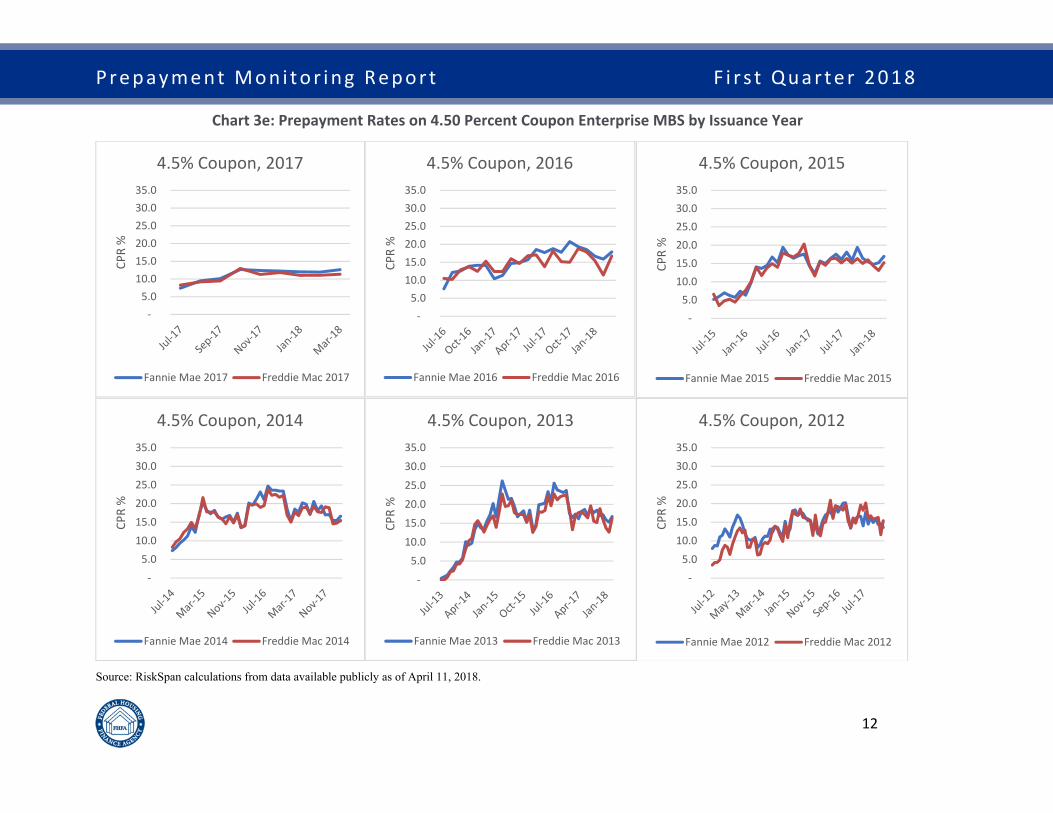
FHFA also uses Charts 3a through 3e to compare Fannie Mae’s MBS and Freddie Mac’s MBS prepayment rates and to evaluate the degree of alignment on an historical basis. Chart 3a illustrates alignment in prepayment rates across the Enterprises for each of the coupons that have had high volumes in recent years. The data in Chart 3a are aggregated across all issuance years. Charts 3b through 3e illustrate the degree of prepayment alignment for each coupon-issuance year cohort.
Prepayment Mon i tor ing Repor t F i r s t Quar ter 2018
6
Chart 1: Prepayment Comparison for 30‐Year, TBA‐Eligible MBS, All Coupons, March 2008 through March 2018
Source: RiskSpan calculations from data available publicly as of April 11, 2018.
‐
1.0
2.0
3.0
4.0
5.0
6.0
7.0
‐
5.0
10.0
15.0
20.0
25.0
30.0
35.0
40.0
45.0
30‐yea
r Mortgage Ra
te
CPR %
30‐year CPR Comparison, All Coupons
Fannie Mae Freddie Mac 30‐yr Mortgage Rates
Prepayment Mon i tor ing Repor t F i r s t Quar ter 2018
7
Chart 2: March 2018 Prepayment Rates on 30‐year Enterprise MBS by Coupon and Issuance Year
Source: RiskSpan calculations from data available publicly as of April 11, 2018.
‐
5.0
10.0
15.0
20.0
2012 2013 2014 2015 2016 2017 2018 All
CPR %
3.00% Coupon
Fannie Mae Freddie Mac
‐
5.0
10.0
15.0
20.0
2010 2011 2012 2013 2014 2015 2016 2017 2018 All
CPR %
3.50% Coupon
Fannie Mae Freddie Mac
‐
5.0
10.0
15.0
20.0
2009 2010 2011 2012 2013 2014 2015 2016 2017 2018 All
CPR %
4.00% Coupon
Fannie Mae Freddie Mac
‐
5.0
10.0
15.0
20.0
20082009201020112012201320142015201620172018 All
CPR %
4.50% Coupon
Fannie Mae Freddie Mac
Prepayment Mon i tor ing Repor t F i r s t Quar ter 2018
8
Chart 3a: Prepayment Rates on 30‐year Enterprise MBS by Coupon, All Issuance Years, January 2012 through March 2018
Source: RiskSpan calculations from data available publicly as of April 11, 2018.
‐ 5.0
10.0 15.0 20.0 25.0 30.0
CPR %
3.00% Coupon
Fannie Mae All Freddie Mac All
‐ 5.0
10.0 15.0 20.0 25.0 30.0
CPR %
3.5% Coupon
Fannie Mae All Freddie Mac All
‐ 5.0
10.0 15.0 20.0 25.0 30.0 35.0 40.0
CPR %
4% Coupon
Fannie Mae All Freddie Mac All
‐ 5.0
10.0 15.0 20.0 25.0 30.0 35.0 40.0
CPR %
4.5% Coupon
Fannie Mae All Freddie Mac All
Prepayment Mon i tor ing Repor t F i r s t Quar ter 2018
9
Chart 3b: Prepayment Rates on 3.00 Percent Coupon Enterprise MBS by Issuance Year
Source: RiskSpan calculations from data available publicly as of April 11, 2018.
‐ 5.0
10.0 15.0 20.0 25.0 30.0 35.0
CPR %
3% Coupon, 2017
Fannie Mae 2017 Freddie Mac 2017
‐ 5.0
10.0 15.0 20.0 25.0 30.0 35.0
CPR %
3% Coupon, 2016
Fannie Mae 2016 Freddie Mac 2016
‐ 5.0
10.0 15.0 20.0 25.0 30.0 35.0
CPR %
3% Coupon, 2015
Fannie Mae 2015 Freddie Mac 2015
‐ 5.0
10.0 15.0 20.0 25.0 30.0 35.0
CPR %
3% Coupon, 2014
Fannie Mae 2014 Freddie Mac 2014
‐ 5.0
10.0 15.0 20.0 25.0 30.0 35.0
CPR %
3% Coupon, 2013
Fannie Mae 2013 Freddie Mac 2013
‐ 5.0
10.0 15.0 20.0 25.0 30.0 35.0
CPR %
3% Coupon, 2012
Fannie Mae 2012 Freddie Mac 2012
Prepayment Mon i tor ing Repor t F i r s t Quar ter 2018
10
Chart 3c: Prepayment Rates on 3.50 Percent Coupon Enterprise MBS by Issuance Year
Source: RiskSpan calculations from data available publicly as of April 11, 2018.
‐ 5.0
10.0 15.0 20.0 25.0 30.0 35.0
CPR %
3.5% Coupon, 2017
Fannie Mae 2017 Freddie Mac 2017
‐ 5.0
10.0 15.0 20.0 25.0 30.0 35.0
CPR %
3.5% Coupon, 2016
Fannie Mae 2016 Freddie Mac 2016
‐ 5.0
10.0 15.0 20.0 25.0 30.0 35.0
CPR %
3.5% Coupon, 2015
Fannie Mae 2015 Freddie Mac 2015
‐ 5.0
10.0 15.0 20.0 25.0 30.0 35.0
CPR %
3.5% Coupon, 2014
Fannie Mae 2014 Freddie Mac 2014
‐ 5.0
10.0 15.0 20.0 25.0 30.0 35.0
CPR %
3.5% Coupon, 2013
Fannie Mae 2013 Freddie Mac 2013
‐ 5.0
10.0 15.0 20.0 25.0 30.0 35.0
CPR %
3.5% Coupon, 2012
Fannie Mae 2012 Freddie Mac 2012
Prepayment Mon i tor ing Repor t F i r s t Quar ter 2018
11
Chart 3d: Prepayment Rates on 4.00 Percent Coupon Enterprise MBS by Issuance Year
Source: RiskSpan calculations from data available publicly as of April 11, 2018.
‐ 5.0
10.0 15.0 20.0 25.0 30.0 35.0
CPR %
4% Coupon, 2017
Fannie Mae 2017 Freddie Mac 2017
‐ 5.0
10.0 15.0 20.0 25.0 30.0 35.0
CPR %
4% Coupon, 2016
Fannie Mae 2016 Freddie Mac 2016
‐ 5.0
10.0 15.0 20.0 25.0 30.0 35.0
CPR %
4% Coupon, 2015
Fannie Mae 2015 Freddie Mac 2015
‐
5.0
10.0
15.0
20.0
25.0
30.0
35.0
CPR %
4% Coupon, 2014
Fannie Mae 2014 Freddie Mac 2014
‐
5.0
10.0
15.0
20.0
25.0
30.0
35.0
CPR %
4% Coupon, 2013
Fannie Mae 2013 Freddie Mac 2013
‐
5.0
10.0
15.0
20.0
25.0
30.0
35.0
CPR %
4% Coupon, 2012
Fannie Mae 2012 Freddie Mac 2012
Prepayment Mon i tor ing Repor t F i r s t Quar ter 2018
12
Chart 3e: Prepayment Rates on 4.50 Percent Coupon Enterprise MBS by Issuance Year
Source: RiskSpan calculations from data available publicly as of April 11, 2018.
‐ 5.0
10.0 15.0 20.0 25.0 30.0 35.0
CPR %
4.5% Coupon, 2017
Fannie Mae 2017 Freddie Mac 2017
‐ 5.0
10.0 15.0 20.0 25.0 30.0 35.0
CPR %
4.5% Coupon, 2016
Fannie Mae 2016 Freddie Mac 2016
‐ 5.0
10.0 15.0 20.0 25.0 30.0 35.0
CPR %
4.5% Coupon, 2015
Fannie Mae 2015 Freddie Mac 2015
‐ 5.0
10.0 15.0 20.0 25.0 30.0 35.0
CPR %
4.5% Coupon, 2014
Fannie Mae 2014 Freddie Mac 2014
‐
5.0
10.0
15.0
20.0
25.0
30.0
35.0
CPR %
4.5% Coupon, 2013
Fannie Mae 2013 Freddie Mac 2013
‐ 5.0
10.0 15.0 20.0 25.0 30.0 35.0
CPR %
4.5% Coupon, 2012
Fannie Mae 2012 Freddie Mac 2012
Prepayment Mon i tor ing Repor t F i r s t Quar ter 2018
13
Data Tables
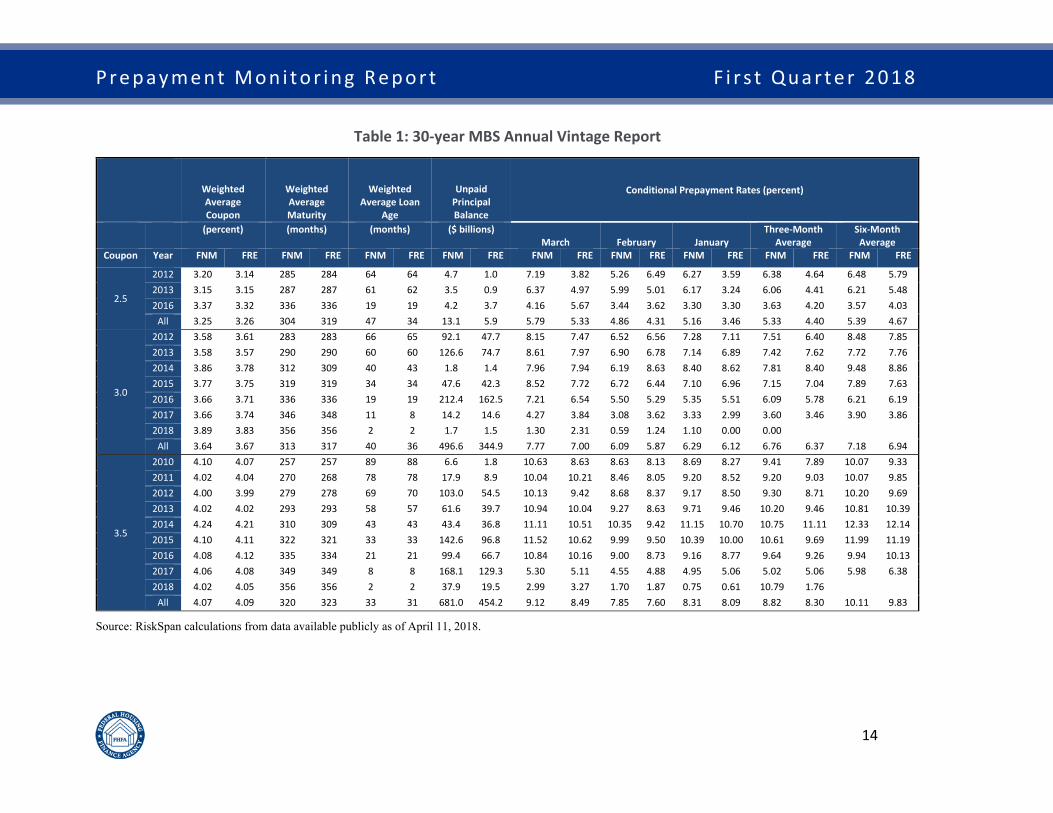
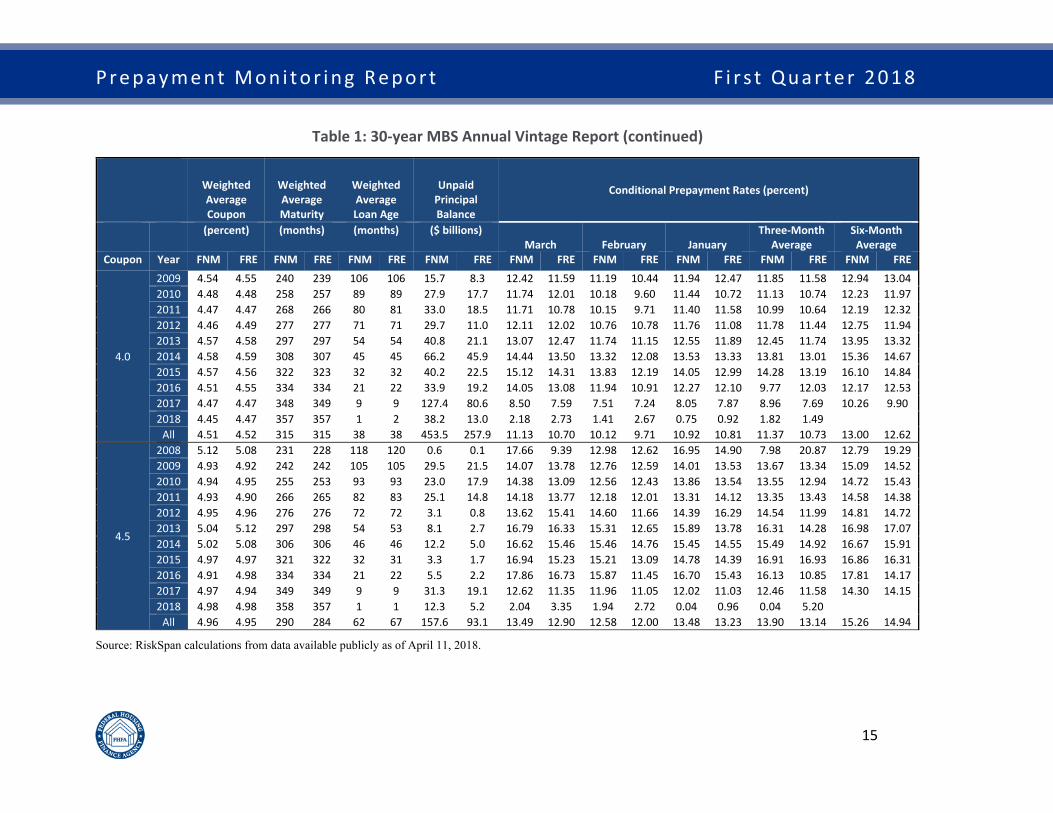
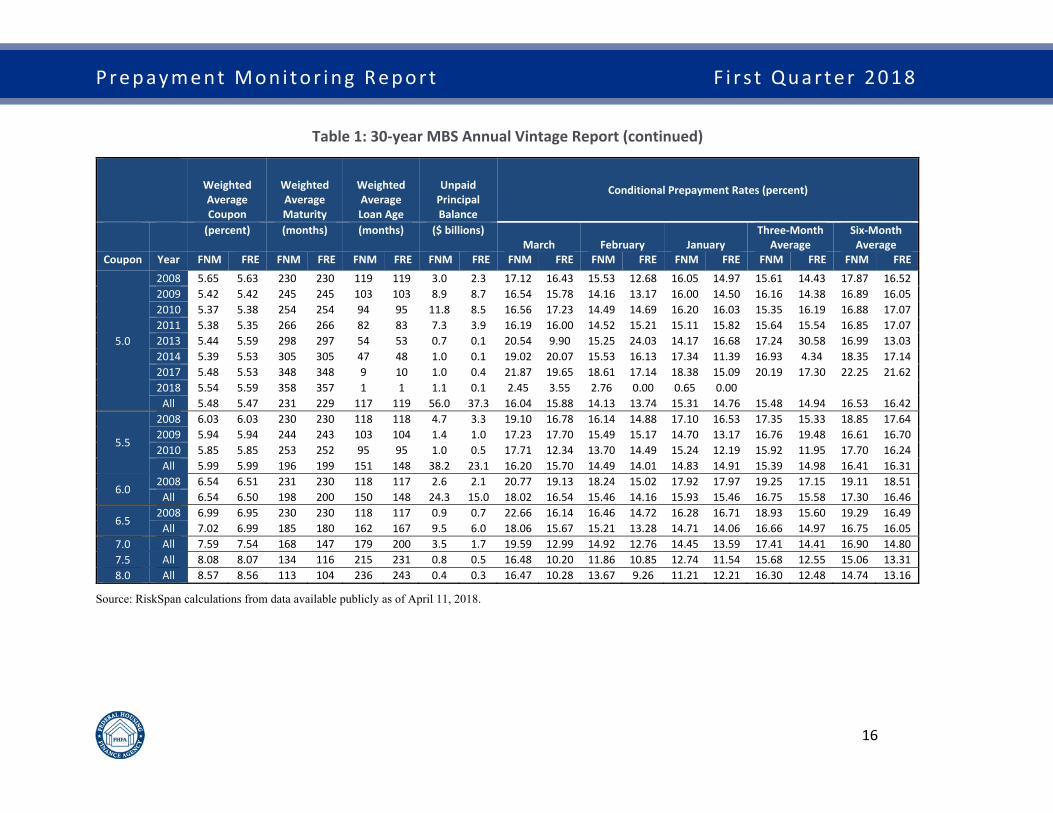
FHFA uses Table 1, the Annual Vintage Report, to compare Fannie Mae’s and Freddie Mac’s prepayment rates with cohort attributes, such as the weighted-average coupon (WAC), the weighted-average maturity (WAM), the weighted-average loan age (WALA), and the unpaid principal balance (UPB). These comparisons provide context to understand better any significant differences in CPRs across the Enterprises.
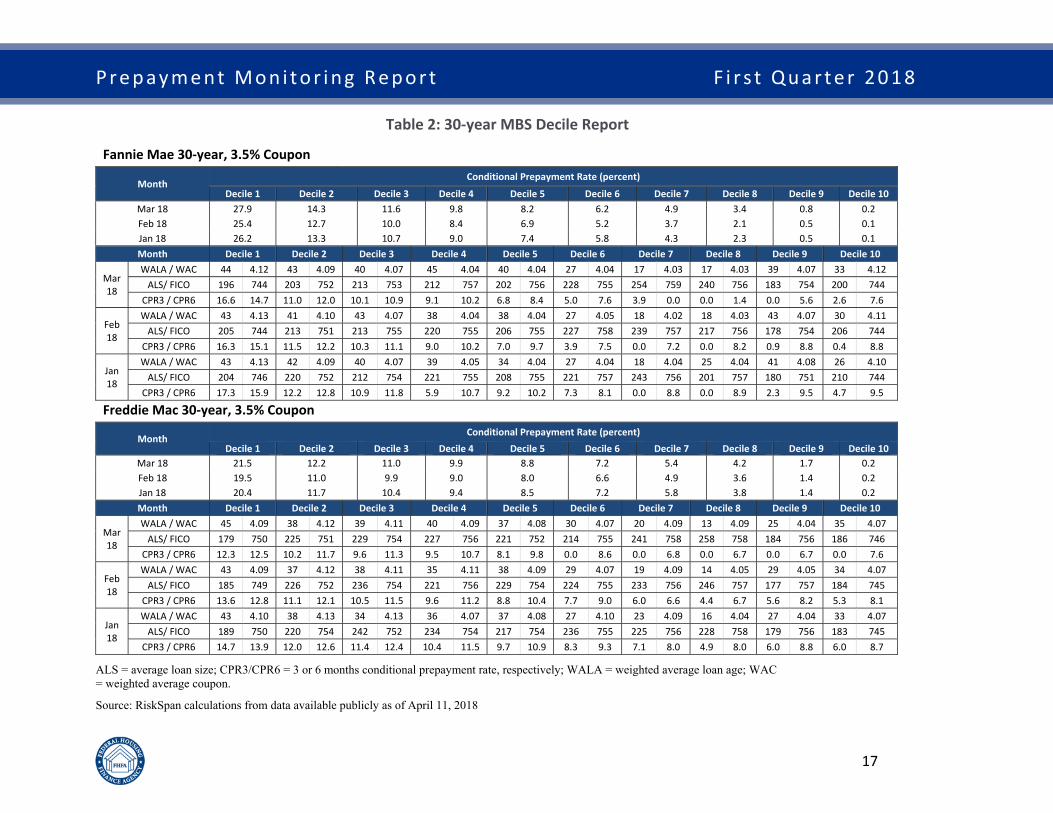
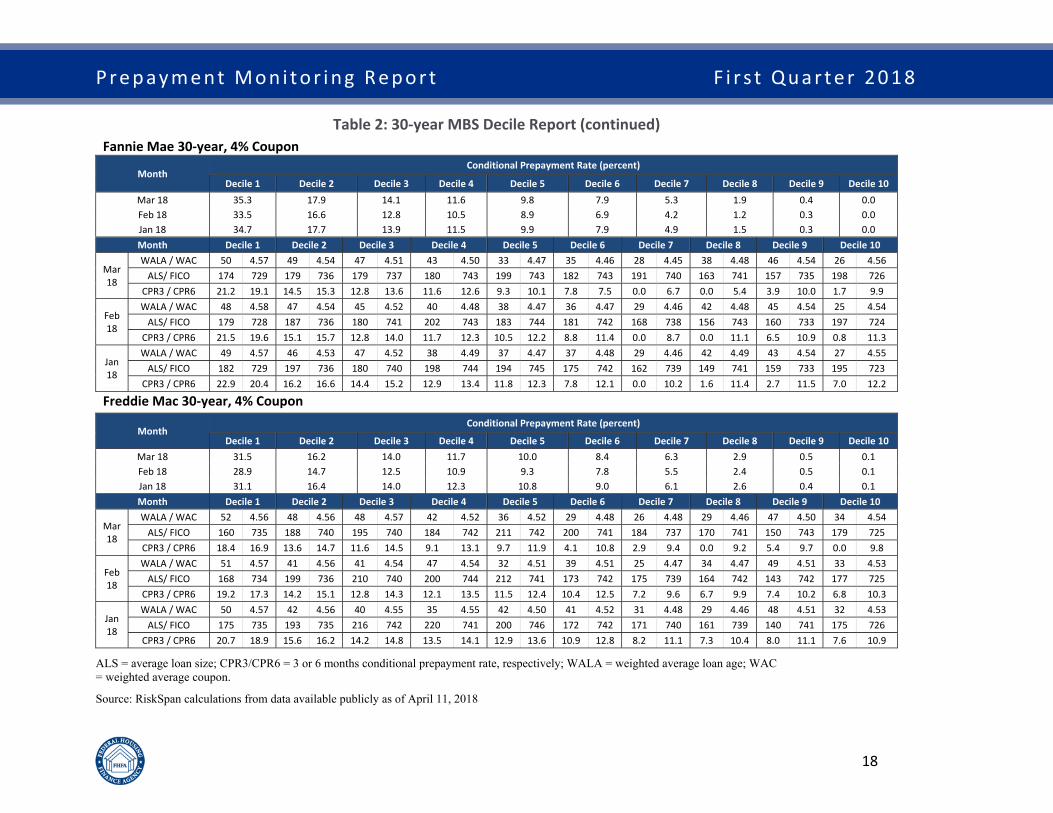
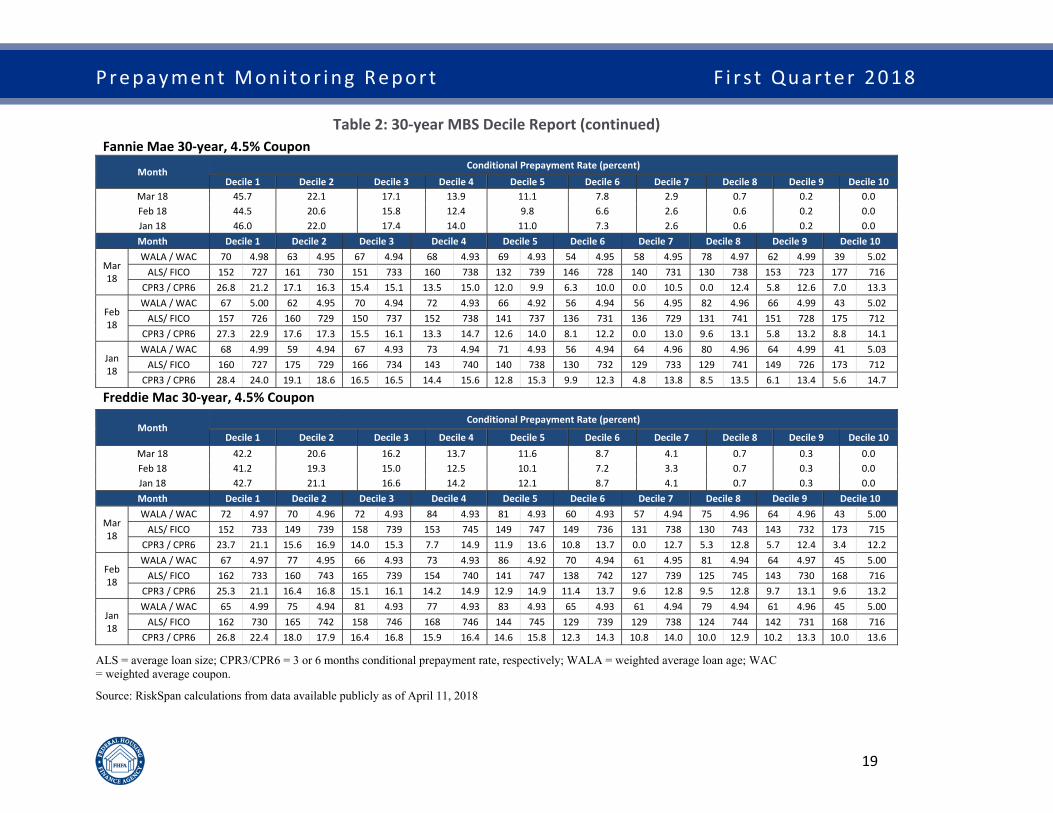
Table 2, the Decile Report, is used to compare the range of prepayment rates across all of the MBS that have the same coupon issued by a given Enterprise. To do so, an Enterprise’s TBA-eligible MBS pools of a given coupon are ranked by prepayment rate from fastest to slowest over the past twelve months. The pools are then grouped into deciles based on UPB. In addition to the current month’s prepayment rates, the Report presents the 3-month and 6-month CPR as well as the WALA, WAC, average loan size (ALS), and credit score (FICO) for each decile.
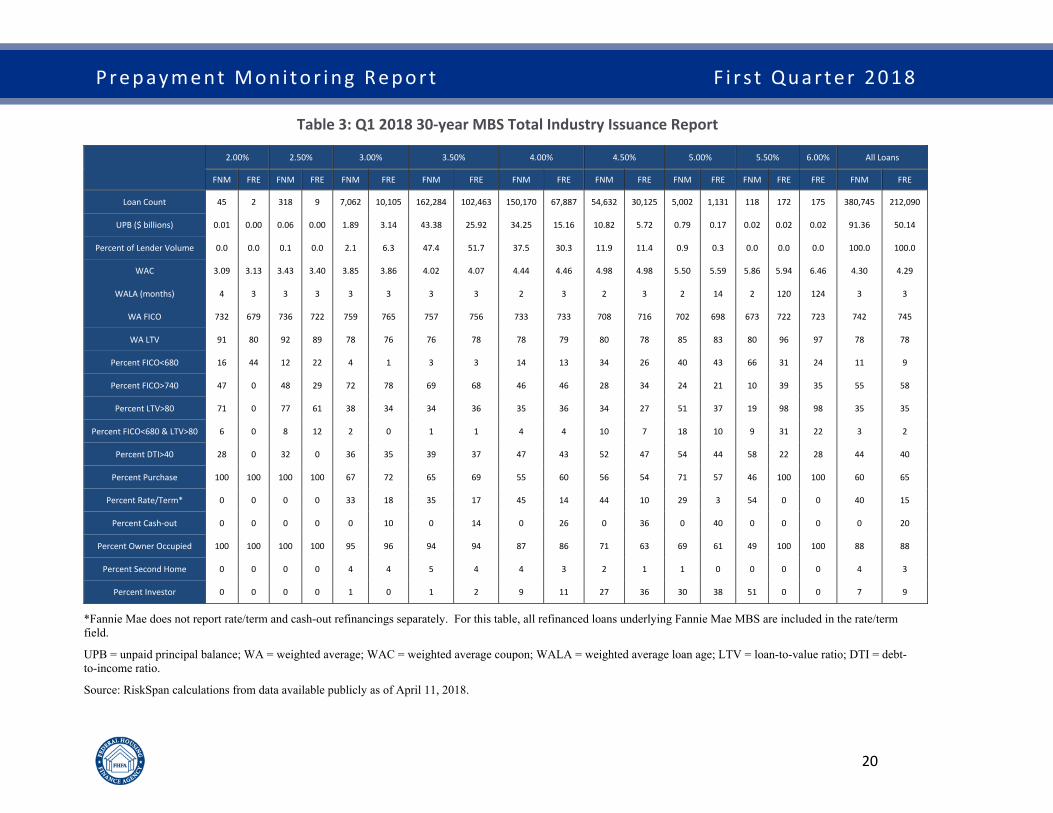
Table 3, the Total Industry Issuance Report, provides a comparison of Fannie Mae’s and Freddie Mac’s previous three months of issuance, with various key loan attributes that would affect the expectations of prepayments and delinquencies. The attributes that generally create faster prepayments, such as high credit score and low loan-to-value (LTV) ratio, also generally lower defaults. FHFA uses this report to identify any differences in loan attributes that may cause a divergence in prepayment rates. Analyzing new issuance data allows FHFA and the Enterprises to make timely adjustments to business practices to reduce potential misalignments in future prepayment rates.
Prepayment Mon i tor ing Repor t F i r s t Quar ter 2018
14
Table 1: 30‐year MBS Annual Vintage Report
Weighted Average Coupon
Weighted Average Maturity
Weighted Average Loan
Age
Unpaid Principal Balance
Conditional Prepayment Rates (percent)
(percent) (months) (months) ($ billions) March February January
Three‐Month Average
Six‐Month Average
Coupon Year FNM FRE FNM FRE FNM FRE FNM FRE FNM FRE FNM FRE FNM FRE FNM FRE FNM FRE
2.5
2012 3.20 3.14 285 284 64 64 4.7 1.0 7.19 3.82 5.26 6.49 6.27 3.59 6.38 4.64 6.48 5.79 2013 3.15 3.15 287 287 61 62 3.5 0.9 6.37 4.97 5.99 5.01 6.17 3.24 6.06 4.41 6.21 5.48 2016 3.37 3.32 336 336 19 19 4.2 3.7 4.16 5.67 3.44 3.62 3.30 3.30 3.63 4.20 3.57 4.03 All 3.25 3.26 304 319 47 34 13.1 5.9 5.79 5.33 4.86 4.31 5.16 3.46 5.33 4.40 5.39 4.67
3.0
2012 3.58 3.61 283 283 66 65 92.1 47.7 8.15 7.47 6.52 6.56 7.28 7.11 7.51 6.40 8.48 7.85 2013 3.58 3.57 290 290 60 60 126.6 74.7 8.61 7.97 6.90 6.78 7.14 6.89 7.42 7.62 7.72 7.76 2014 3.86 3.78 312 309 40 43 1.8 1.4 7.96 7.94 6.19 8.63 8.40 8.62 7.81 8.40 9.48 8.86 2015 3.77 3.75 319 319 34 34 47.6 42.3 8.52 7.72 6.72 6.44 7.10 6.96 7.15 7.04 7.89 7.63 2016 3.66 3.71 336 336 19 19 212.4 162.5 7.21 6.54 5.50 5.29 5.35 5.51 6.09 5.78 6.21 6.19 2017 3.66 3.74 346 348 11 8 14.2 14.6 4.27 3.84 3.08 3.62 3.33 2.99 3.60 3.46 3.90 3.86 2018 3.89 3.83 356 356 2 2 1.7 1.5 1.30 2.31 0.59 1.24 1.10 0.00 0.00
All 3.64 3.67 313 317 40 36 496.6 344.9 7.77 7.00 6.09 5.87 6.29 6.12 6.76 6.37 7.18 6.94
3.5
2010 4.10 4.07 257 257 89 88 6.6 1.8 10.63 8.63 8.63 8.13 8.69 8.27 9.41 7.89 10.07 9.33 2011 4.02 4.04 270 268 78 78 17.9 8.9 10.04 10.21 8.46 8.05 9.20 8.52 9.20 9.03 10.07 9.85 2012 4.00 3.99 279 278 69 70 103.0 54.5 10.13 9.42 8.68 8.37 9.17 8.50 9.30 8.71 10.20 9.69 2013 4.02 4.02 293 293 58 57 61.6 39.7 10.94 10.04 9.27 8.63 9.71 9.46 10.20 9.46 10.81 10.39 2014 4.24 4.21 310 309 43 43 43.4 36.8 11.11 10.51 10.35 9.42 11.15 10.70 10.75 11.11 12.33 12.14 2015 4.10 4.11 322 321 33 33 142.6 96.8 11.52 10.62 9.99 9.50 10.39 10.00 10.61 9.69 11.99 11.19 2016 4.08 4.12 335 334 21 21 99.4 66.7 10.84 10.16 9.00 8.73 9.16 8.77 9.64 9.26 9.94 10.13 2017 4.06 4.08 349 349 8 8 168.1 129.3 5.30 5.11 4.55 4.88 4.95 5.06 5.02 5.06 5.98 6.38 2018 4.02 4.05 356 356 2 2 37.9 19.5 2.99 3.27 1.70 1.87 0.75 0.61 10.79 1.76
All 4.07 4.09 320 323 33 31 681.0 454.2 9.12 8.49 7.85 7.60 8.31 8.09 8.82 8.30 10.11 9.83
Source: RiskSpan calculations from data available publicly as of April 11, 2018.
Prepayment Mon i tor ing Repor t F i r s t Quar ter 2018
15
Table 1: 30‐year MBS Annual Vintage Report (continued)
Weighted
Average Coupon
Weighted Average Maturity
Weighted Average Loan Age
Unpaid Principal Balance
Conditional Prepayment Rates (percent)
(percent) (months) (months) ($ billions) March February January
Three‐Month Average
Six‐Month Average
Coupon Year FNM FRE FNM FRE FNM FRE FNM FRE FNM FRE FNM FRE FNM FRE FNM FRE FNM FRE
4.0
2009 4.54 4.55 240 239 106 106 15.7 8.3 12.42 11.59 11.19 10.44 11.94 12.47 11.85 11.58 12.94 13.04 2010 4.48 4.48 258 257 89 89 27.9 17.7 11.74 12.01 10.18 9.60 11.44 10.72 11.13 10.74 12.23 11.97 2011 4.47 4.47 268 266 80 81 33.0 18.5 11.71 10.78 10.15 9.71 11.40 11.58 10.99 10.64 12.19 12.32 2012 4.46 4.49 277 277 71 71 29.7 11.0 12.11 12.02 10.76 10.78 11.76 11.08 11.78 11.44 12.75 11.94 2013 4.57 4.58 297 297 54 54 40.8 21.1 13.07 12.47 11.74 11.15 12.55 11.89 12.45 11.74 13.95 13.32 2014 4.58 4.59 308 307 45 45 66.2 45.9 14.44 13.50 13.32 12.08 13.53 13.33 13.81 13.01 15.36 14.67 2015 4.57 4.56 322 323 32 32 40.2 22.5 15.12 14.31 13.83 12.19 14.05 12.99 14.28 13.19 16.10 14.84 2016 4.51 4.55 334 334 21 22 33.9 19.2 14.05 13.08 11.94 10.91 12.27 12.10 9.77 12.03 12.17 12.53 2017 4.47 4.47 348 349 9 9 127.4 80.6 8.50 7.59 7.51 7.24 8.05 7.87 8.96 7.69 10.26 9.90 2018 4.45 4.47 357 357 1 2 38.2 13.0 2.18 2.73 1.41 2.67 0.75 0.92 1.82 1.49
All 4.51 4.52 315 315 38 38 453.5 257.9 11.13 10.70 10.12 9.71 10.92 10.81 11.37 10.73 13.00 12.62
4.5
2008 5.12 5.08 231 228 118 120 0.6 0.1 17.66 9.39 12.98 12.62 16.95 14.90 7.98 20.87 12.79 19.29 2009 4.93 4.92 242 242 105 105 29.5 21.5 14.07 13.78 12.76 12.59 14.01 13.53 13.67 13.34 15.09 14.52 2010 4.94 4.95 255 253 93 93 23.0 17.9 14.38 13.09 12.56 12.43 13.86 13.54 13.55 12.94 14.72 15.43 2011 4.93 4.90 266 265 82 83 25.1 14.8 14.18 13.77 12.18 12.01 13.31 14.12 13.35 13.43 14.58 14.38 2012 4.95 4.96 276 276 72 72 3.1 0.8 13.62 15.41 14.60 11.66 14.39 16.29 14.54 11.99 14.81 14.72 2013 5.04 5.12 297 298 54 53 8.1 2.7 16.79 16.33 15.31 12.65 15.89 13.78 16.31 14.28 16.98 17.07 2014 5.02 5.08 306 306 46 46 12.2 5.0 16.62 15.46 15.46 14.76 15.45 14.55 15.49 14.92 16.67 15.91 2015 4.97 4.97 321 322 32 31 3.3 1.7 16.94 15.23 15.21 13.09 14.78 14.39 16.91 16.93 16.86 16.31 2016 4.91 4.98 334 334 21 22 5.5 2.2 17.86 16.73 15.87 11.45 16.70 15.43 16.13 10.85 17.81 14.17 2017 4.97 4.94 349 349 9 9 31.3 19.1 12.62 11.35 11.96 11.05 12.02 11.03 12.46 11.58 14.30 14.15 2018 4.98 4.98 358 357 1 1 12.3 5.2 2.04 3.35 1.94 2.72 0.04 0.96 0.04 5.20
All 4.96 4.95 290 284 62 67 157.6 93.1 13.49 12.90 12.58 12.00 13.48 13.23 13.90 13.14 15.26 14.94
Source: RiskSpan calculations from data available publicly as of April 11, 2018.
Prepayment Mon i tor ing Repor t F i r s t Quar ter 2018
16
Table 1: 30‐year MBS Annual Vintage Report (continued)
Weighted Average Coupon
Weighted Average Maturity
Weighted Average Loan Age
Unpaid Principal Balance
Conditional Prepayment Rates (percent)
(percent) (months) (months) ($ billions) March February January
Three‐Month Average
Six‐Month Average
Coupon Year FNM FRE FNM FRE FNM FRE FNM FRE FNM FRE FNM FRE FNM FRE FNM FRE FNM FRE
5.0
2008 5.65 5.63 230 230 119 119 3.0 2.3 17.12 16.43 15.53 12.68 16.05 14.97 15.61 14.43 17.87 16.52 2009 5.42 5.42 245 245 103 103 8.9 8.7 16.54 15.78 14.16 13.17 16.00 14.50 16.16 14.38 16.89 16.05 2010 5.37 5.38 254 254 94 95 11.8 8.5 16.56 17.23 14.49 14.69 16.20 16.03 15.35 16.19 16.88 17.07 2011 5.38 5.35 266 266 82 83 7.3 3.9 16.19 16.00 14.52 15.21 15.11 15.82 15.64 15.54 16.85 17.07 2013 5.44 5.59 298 297 54 53 0.7 0.1 20.54 9.90 15.25 24.03 14.17 16.68 17.24 30.58 16.99 13.03 2014 5.39 5.53 305 305 47 48 1.0 0.1 19.02 20.07 15.53 16.13 17.34 11.39 16.93 4.34 18.35 17.14 2017 5.48 5.53 348 348 9 10 1.0 0.4 21.87 19.65 18.61 17.14 18.38 15.09 20.19 17.30 22.25 21.62 2018 5.54 5.59 358 357 1 1 1.1 0.1 2.45 3.55 2.76 0.00 0.65 0.00
All 5.48 5.47 231 229 117 119 56.0 37.3 16.04 15.88 14.13 13.74 15.31 14.76 15.48 14.94 16.53 16.42
5.5
2008 6.03 6.03 230 230 118 118 4.7 3.3 19.10 16.78 16.14 14.88 17.10 16.53 17.35 15.33 18.85 17.64 2009 5.94 5.94 244 243 103 104 1.4 1.0 17.23 17.70 15.49 15.17 14.70 13.17 16.76 19.48 16.61 16.70 2010 5.85 5.85 253 252 95 95 1.0 0.5 17.71 12.34 13.70 14.49 15.24 12.19 15.92 11.95 17.70 16.24 All 5.99 5.99 196 199 151 148 38.2 23.1 16.20 15.70 14.49 14.01 14.83 14.91 15.39 14.98 16.41 16.31
6.0 2008 6.54 6.51 231 230 118 117 2.6 2.1 20.77 19.13 18.24 15.02 17.92 17.97 19.25 17.15 19.11 18.51 All 6.54 6.50 198 200 150 148 24.3 15.0 18.02 16.54 15.46 14.16 15.93 15.46 16.75 15.58 17.30 16.46
6.5 2008 6.99 6.95 230 230 118 117 0.9 0.7 22.66 16.14 16.46 14.72 16.28 16.71 18.93 15.60 19.29 16.49 All 7.02 6.99 185 180 162 167 9.5 6.0 18.06 15.67 15.21 13.28 14.71 14.06 16.66 14.97 16.75 16.05
7.0 All 7.59 7.54 168 147 179 200 3.5 1.7 19.59 12.99 14.92 12.76 14.45 13.59 17.41 14.41 16.90 14.80 7.5 All 8.08 8.07 134 116 215 231 0.8 0.5 16.48 10.20 11.86 10.85 12.74 11.54 15.68 12.55 15.06 13.31 8.0 All 8.57 8.56 113 104 236 243 0.4 0.3 16.47 10.28 13.67 9.26 11.21 12.21 16.30 12.48 14.74 13.16
Source: RiskSpan calculations from data available publicly as of April 11, 2018.
Prepayment Mon i tor ing Repor t F i r s t Quar ter 2018
17
Table 2: 30‐year MBS Decile Report
Fannie Mae 30‐year, 3.5% Coupon
Month Conditional Prepayment Rate (percent)
Decile 1 Decile 2 Decile 3 Decile 4 Decile 5 Decile 6 Decile 7 Decile 8 Decile 9 Decile 10 Mar 18 27.9 14.3 11.6 9.8 8.2 6.2 4.9 3.4 0.8 0.2 Feb 18 25.4 12.7 10.0 8.4 6.9 5.2 3.7 2.1 0.5 0.1 Jan 18 26.2 13.3 10.7 9.0 7.4 5.8 4.3 2.3 0.5 0.1 Month Decile 1 Decile 2 Decile 3 Decile 4 Decile 5 Decile 6 Decile 7 Decile 8 Decile 9 Decile 10
Mar 18
WALA / WAC 44 4.12 43 4.09 40 4.07 45 4.04 40 4.04 27 4.04 17 4.03 17 4.03 39 4.07 33 4.12 ALS/ FICO 196 744 203 752 213 753 212 757 202 756 228 755 254 759 240 756 183 754 200 744
CPR3 / CPR6 16.6 14.7 11.0 12.0 10.1 10.9 9.1 10.2 6.8 8.4 5.0 7.6 3.9 0.0 0.0 1.4 0.0 5.6 2.6 7.6
Feb 18
WALA / WAC 43 4.13 41 4.10 43 4.07 38 4.04 38 4.04 27 4.05 18 4.02 18 4.03 43 4.07 30 4.11 ALS/ FICO 205 744 213 751 213 755 220 755 206 755 227 758 239 757 217 756 178 754 206 744
CPR3 / CPR6 16.3 15.1 11.5 12.2 10.3 11.1 9.0 10.2 7.0 9.7 3.9 7.5 0.0 7.2 0.0 8.2 0.9 8.8 0.4 8.8
Jan 18
WALA / WAC 43 4.13 42 4.09 40 4.07 39 4.05 34 4.04 27 4.04 18 4.04 25 4.04 41 4.08 26 4.10 ALS/ FICO 204 746 220 752 212 754 221 755 208 755 221 757 243 756 201 757 180 751 210 744
CPR3 / CPR6 17.3 15.9 12.2 12.8 10.9 11.8 5.9 10.7 9.2 10.2 7.3 8.1 0.0 8.8 0.0 8.9 2.3 9.5 4.7 9.5
Freddie Mac 30‐year, 3.5% Coupon
Month Conditional Prepayment Rate (percent)
Decile 1 Decile 2 Decile 3 Decile 4 Decile 5 Decile 6 Decile 7 Decile 8 Decile 9 Decile 10 Mar 18 21.5 12.2 11.0 9.9 8.8 7.2 5.4 4.2 1.7 0.2 Feb 18 19.5 11.0 9.9 9.0 8.0 6.6 4.9 3.6 1.4 0.2 Jan 18 20.4 11.7 10.4 9.4 8.5 7.2 5.8 3.8 1.4 0.2 Month Decile 1 Decile 2 Decile 3 Decile 4 Decile 5 Decile 6 Decile 7 Decile 8 Decile 9 Decile 10
Mar 18
WALA / WAC 45 4.09 38 4.12 39 4.11 40 4.09 37 4.08 30 4.07 20 4.09 13 4.09 25 4.04 35 4.07 ALS/ FICO 179 750 225 751 229 754 227 756 221 752 214 755 241 758 258 758 184 756 186 746
CPR3 / CPR6 12.3 12.5 10.2 11.7 9.6 11.3 9.5 10.7 8.1 9.8 0.0 8.6 0.0 6.8 0.0 6.7 0.0 6.7 0.0 7.6
Feb 18
WALA / WAC 43 4.09 37 4.12 38 4.11 35 4.11 38 4.09 29 4.07 19 4.09 14 4.05 29 4.05 34 4.07 ALS/ FICO 185 749 226 752 236 754 221 756 229 754 224 755 233 756 246 757 177 757 184 745
CPR3 / CPR6 13.6 12.8 11.1 12.1 10.5 11.5 9.6 11.2 8.8 10.4 7.7 9.0 6.0 6.6 4.4 6.7 5.6 8.2 5.3 8.1
Jan 18
WALA / WAC 43 4.10 38 4.13 34 4.13 36 4.07 37 4.08 27 4.10 23 4.09 16 4.04 27 4.04 33 4.07 ALS/ FICO 189 750 220 754 242 752 234 754 217 754 236 755 225 756 228 758 179 756 183 745
CPR3 / CPR6 14.7 13.9 12.0 12.6 11.4 12.4 10.4 11.5 9.7 10.9 8.3 9.3 7.1 8.0 4.9 8.0 6.0 8.8 6.0 8.7
ALS = average loan size; CPR3/CPR6 = 3 or 6 months conditional prepayment rate, respectively; WALA = weighted average loan age; WAC = weighted average coupon.
Source: RiskSpan calculations from data available publicly as of April 11, 2018
Prepayment Mon i tor ing Repor t F i r s t Quar ter 2018
18
Table 2: 30‐year MBS Decile Report (continued) Fannie Mae 30‐year, 4% Coupon
Month Conditional Prepayment Rate (percent)
Decile 1 Decile 2 Decile 3 Decile 4 Decile 5 Decile 6 Decile 7 Decile 8 Decile 9 Decile 10 Mar 18 35.3 17.9 14.1 11.6 9.8 7.9 5.3 1.9 0.4 0.0 Feb 18 33.5 16.6 12.8 10.5 8.9 6.9 4.2 1.2 0.3 0.0 Jan 18 34.7 17.7 13.9 11.5 9.9 7.9 4.9 1.5 0.3 0.0 Month Decile 1 Decile 2 Decile 3 Decile 4 Decile 5 Decile 6 Decile 7 Decile 8 Decile 9 Decile 10
Mar 18
WALA / WAC 50 4.57 49 4.54 47 4.51 43 4.50 33 4.47 35 4.46 28 4.45 38 4.48 46 4.54 26 4.56 ALS/ FICO 174 729 179 736 179 737 180 743 199 743 182 743 191 740 163 741 157 735 198 726
CPR3 / CPR6 21.2 19.1 14.5 15.3 12.8 13.6 11.6 12.6 9.3 10.1 7.8 7.5 0.0 6.7 0.0 5.4 3.9 10.0 1.7 9.9
Feb 18
WALA / WAC 48 4.58 47 4.54 45 4.52 40 4.48 38 4.47 36 4.47 29 4.46 42 4.48 45 4.54 25 4.54 ALS/ FICO 179 728 187 736 180 741 202 743 183 744 181 742 168 738 156 743 160 733 197 724
CPR3 / CPR6 21.5 19.6 15.1 15.7 12.8 14.0 11.7 12.3 10.5 12.2 8.8 11.4 0.0 8.7 0.0 11.1 6.5 10.9 0.8 11.3
Jan 18
WALA / WAC 49 4.57 46 4.53 47 4.52 38 4.49 37 4.47 37 4.48 29 4.46 42 4.49 43 4.54 27 4.55 ALS/ FICO 182 729 197 736 180 740 198 744 194 745 175 742 162 739 149 741 159 733 195 723
CPR3 / CPR6 22.9 20.4 16.2 16.6 14.4 15.2 12.9 13.4 11.8 12.3 7.8 12.1 0.0 10.2 1.6 11.4 2.7 11.5 7.0 12.2
Freddie Mac 30‐year, 4% Coupon
Month Conditional Prepayment Rate (percent)
Decile 1 Decile 2 Decile 3 Decile 4 Decile 5 Decile 6 Decile 7 Decile 8 Decile 9 Decile 10 Mar 18 31.5 16.2 14.0 11.7 10.0 8.4 6.3 2.9 0.5 0.1 Feb 18 28.9 14.7 12.5 10.9 9.3 7.8 5.5 2.4 0.5 0.1 Jan 18 31.1 16.4 14.0 12.3 10.8 9.0 6.1 2.6 0.4 0.1 Month Decile 1 Decile 2 Decile 3 Decile 4 Decile 5 Decile 6 Decile 7 Decile 8 Decile 9 Decile 10
Mar 18
WALA / WAC 52 4.56 48 4.56 48 4.57 42 4.52 36 4.52 29 4.48 26 4.48 29 4.46 47 4.50 34 4.54 ALS/ FICO 160 735 188 740 195 740 184 742 211 742 200 741 184 737 170 741 150 743 179 725
CPR3 / CPR6 18.4 16.9 13.6 14.7 11.6 14.5 9.1 13.1 9.7 11.9 4.1 10.8 2.9 9.4 0.0 9.2 5.4 9.7 0.0 9.8
Feb 18
WALA / WAC 51 4.57 41 4.56 41 4.54 47 4.54 32 4.51 39 4.51 25 4.47 34 4.47 49 4.51 33 4.53 ALS/ FICO 168 734 199 736 210 740 200 744 212 741 173 742 175 739 164 742 143 742 177 725
CPR3 / CPR6 19.2 17.3 14.2 15.1 12.8 14.3 12.1 13.5 11.5 12.4 10.4 12.5 7.2 9.6 6.7 9.9 7.4 10.2 6.8 10.3
Jan 18
WALA / WAC 50 4.57 42 4.56 40 4.55 35 4.55 42 4.50 41 4.52 31 4.48 29 4.46 48 4.51 32 4.53 ALS/ FICO 175 735 193 735 216 742 220 741 200 746 172 742 171 740 161 739 140 741 175 726
CPR3 / CPR6 20.7 18.9 15.6 16.2 14.2 14.8 13.5 14.1 12.9 13.6 10.9 12.8 8.2 11.1 7.3 10.4 8.0 11.1 7.6 10.9
ALS = average loan size; CPR3/CPR6 = 3 or 6 months conditional prepayment rate, respectively; WALA = weighted average loan age; WAC = weighted average coupon.
Source: RiskSpan calculations from data available publicly as of April 11, 2018
Prepayment Mon i tor ing Repor t F i r s t Quar ter 2018
19
Table 2: 30‐year MBS Decile Report (continued) Fannie Mae 30‐year, 4.5% Coupon
Month Conditional Prepayment Rate (percent)
Decile 1 Decile 2 Decile 3 Decile 4 Decile 5 Decile 6 Decile 7 Decile 8 Decile 9 Decile 10 Mar 18 45.7 22.1 17.1 13.9 11.1 7.8 2.9 0.7 0.2 0.0 Feb 18 44.5 20.6 15.8 12.4 9.8 6.6 2.6 0.6 0.2 0.0 Jan 18 46.0 22.0 17.4 14.0 11.0 7.3 2.6 0.6 0.2 0.0 Month Decile 1 Decile 2 Decile 3 Decile 4 Decile 5 Decile 6 Decile 7 Decile 8 Decile 9 Decile 10
Mar 18
WALA / WAC 70 4.98 63 4.95 67 4.94 68 4.93 69 4.93 54 4.95 58 4.95 78 4.97 62 4.99 39 5.02 ALS/ FICO 152 727 161 730 151 733 160 738 132 739 146 728 140 731 130 738 153 723 177 716
CPR3 / CPR6 26.8 21.2 17.1 16.3 15.4 15.1 13.5 15.0 12.0 9.9 6.3 10.0 0.0 10.5 0.0 12.4 5.8 12.6 7.0 13.3
Feb 18
WALA / WAC 67 5.00 62 4.95 70 4.94 72 4.93 66 4.92 56 4.94 56 4.95 82 4.96 66 4.99 43 5.02 ALS/ FICO 157 726 160 729 150 737 152 738 141 737 136 731 136 729 131 741 151 728 175 712
CPR3 / CPR6 27.3 22.9 17.6 17.3 15.5 16.1 13.3 14.7 12.6 14.0 8.1 12.2 0.0 13.0 9.6 13.1 5.8 13.2 8.8 14.1
Jan 18
WALA / WAC 68 4.99 59 4.94 67 4.93 73 4.94 71 4.93 56 4.94 64 4.96 80 4.96 64 4.99 41 5.03 ALS/ FICO 160 727 175 729 166 734 143 740 140 738 130 732 129 733 129 741 149 726 173 712
CPR3 / CPR6 28.4 24.0 19.1 18.6 16.5 16.5 14.4 15.6 12.8 15.3 9.9 12.3 4.8 13.8 8.5 13.5 6.1 13.4 5.6 14.7
Freddie Mac 30‐year, 4.5% Coupon
Month Conditional Prepayment Rate (percent)
Decile 1 Decile 2 Decile 3 Decile 4 Decile 5 Decile 6 Decile 7 Decile 8 Decile 9 Decile 10 Mar 18 42.2 20.6 16.2 13.7 11.6 8.7 4.1 0.7 0.3 0.0 Feb 18 41.2 19.3 15.0 12.5 10.1 7.2 3.3 0.7 0.3 0.0 Jan 18 42.7 21.1 16.6 14.2 12.1 8.7 4.1 0.7 0.3 0.0 Month Decile 1 Decile 2 Decile 3 Decile 4 Decile 5 Decile 6 Decile 7 Decile 8 Decile 9 Decile 10
Mar 18
WALA / WAC 72 4.97 70 4.96 72 4.93 84 4.93 81 4.93 60 4.93 57 4.94 75 4.96 64 4.96 43 5.00 ALS/ FICO 152 733 149 739 158 739 153 745 149 747 149 736 131 738 130 743 143 732 173 715
CPR3 / CPR6 23.7 21.1 15.6 16.9 14.0 15.3 7.7 14.9 11.9 13.6 10.8 13.7 0.0 12.7 5.3 12.8 5.7 12.4 3.4 12.2
Feb 18
WALA / WAC 67 4.97 77 4.95 66 4.93 73 4.93 86 4.92 70 4.94 61 4.95 81 4.94 64 4.97 45 5.00 ALS/ FICO 162 733 160 743 165 739 154 740 141 747 138 742 127 739 125 745 143 730 168 716
CPR3 / CPR6 25.3 21.1 16.4 16.8 15.1 16.1 14.2 14.9 12.9 14.9 11.4 13.7 9.6 12.8 9.5 12.8 9.7 13.1 9.6 13.2
Jan 18
WALA / WAC 65 4.99 75 4.94 81 4.93 77 4.93 83 4.93 65 4.93 61 4.94 79 4.94 61 4.96 45 5.00 ALS/ FICO 162 730 165 742 158 746 168 746 144 745 129 739 129 738 124 744 142 731 168 716
CPR3 / CPR6 26.8 22.4 18.0 17.9 16.4 16.8 15.9 16.4 14.6 15.8 12.3 14.3 10.8 14.0 10.0 12.9 10.2 13.3 10.0 13.6
ALS = average loan size; CPR3/CPR6 = 3 or 6 months conditional prepayment rate, respectively; WALA = weighted average loan age; WAC = weighted average coupon.
Source: RiskSpan calculations from data available publicly as of April 11, 2018
Prepayment Mon i tor ing Repor t F i r s t Quar ter 2018
20
Table 3: Q1 2018 30‐year MBS Total Industry Issuance Report
2.00% 2.50% 3.00% 3.50% 4.00% 4.50% 5.00% 5.50% 6.00% All Loans
FNM FRE FNM FRE FNM FRE FNM FRE FNM FRE FNM FRE FNM FRE FNM FRE FRE FNM FRE
Loan Count 45 2 318 9 7,062 10,105 162,284 102,463 150,170 67,887 54,632 30,125 5,002 1,131 118 172 175 380,745 212,090
UPB ($ billions) 0.01 0.00 0.06 0.00 1.89 3.14 43.38 25.92 34.25 15.16 10.82 5.72 0.79 0.17 0.02 0.02 0.02 91.36 50.14
Percent of Lender Volume 0.0 0.0 0.1 0.0 2.1 6.3 47.4 51.7 37.5 30.3 11.9 11.4 0.9 0.3 0.0 0.0 0.0 100.0 100.0
WAC 3.09 3.13 3.43 3.40 3.85 3.86 4.02 4.07 4.44 4.46 4.98 4.98 5.50 5.59 5.86 5.94 6.46 4.30 4.29
WALA (months) 4 3 3 3 3 3 3 3 2 3 2 3 2 14 2 120 124 3 3
WA FICO 732 679 736 722 759 765 757 756 733 733 708 716 702 698 673 722 723 742 745
WA LTV 91 80 92 89 78 76 76 78 78 79 80 78 85 83 80 96 97 78 78
Percent FICO<680 16 44 12 22 4 1 3 3 14 13 34 26 40 43 66 31 24 11 9
Percent FICO>740 47 0 48 29 72 78 69 68 46 46 28 34 24 21 10 39 35 55 58
Percent LTV>80 71 0 77 61 38 34 34 36 35 36 34 27 51 37 19 98 98 35 35
Percent FICO<680 & LTV>80 6 0 8 12 2 0 1 1 4 4 10 7 18 10 9 31 22 3 2
Percent DTI>40 28 0 32 0 36 35 39 37 47 43 52 47 54 44 58 22 28 44 40
Percent Purchase 100 100 100 100 67 72 65 69 55 60 56 54 71 57 46 100 100 60 65
Percent Rate/Term* 0 0 0 0 33 18 35 17 45 14 44 10 29 3 54 0 0 40 15
Percent Cash‐out 0 0 0 0 0 10 0 14 0 26 0 36 0 40 0 0 0 0 20
Percent Owner Occupied 100 100 100 100 95 96 94 94 87 86 71 63 69 61 49 100 100 88 88
Percent Second Home 0 0 0 0 4 4 5 4 4 3 2 1 1 0 0 0 0 4 3
Percent Investor 0 0 0 0 1 0 1 2 9 11 27 36 30 38 51 0 0 7 9
*Fannie Mae does not report rate/term and cash-out refinancings separately. For this table, all refinanced loans underlying Fannie Mae MBS are included in the rate/term field.
UPB = unpaid principal balance; WA = weighted average; WAC = weighted average coupon; WALA = weighted average loan age; LTV = loan-to-value ratio; DTI = debt-to-income ratio.
Source: RiskSpan calculations from data available publicly as of April 11, 2018.
Prepayment Mon i tor ing Repor t F i r s t Quar ter 2018
21
Glossary
Average loan size (ALS) refers to the average dollar amount of the loans as stated on the notes at the time the loans were originated or modified.
Cohort refers to those Enterprise TBA-eligible securities with the same coupon, maturity, and issuance year.
Conditional prepayment rate (CPR), also known as the constant prepayment rate, measures prepayments as a percentage of the current outstanding principal balance of the pool of loans backing a mortgage-backed security or cohort of those securities. The CPR is expressed as a compound annual rate.
Debt-to-income (DTI) ratio is the ratio obtained by dividing the total monthly debt expense by the total monthly income of the borrower at the time the loan was originated or modified.
FICO refers to a credit score produced by FICO and used in the mortgage underwriting process.
Loan-to-value (LTV) ratio is the ratio, expressed as a percentage, obtained by dividing the amount of the loan at origination by the value of the property.
To-be-announced (TBA) market is a forward market for certain mortgage-backed securities, including those issued by Fannie Mae and Freddie Mac.
Uniform Mortgage-Backed Security (UMBS) is the new single, common mortgage-backed security that Fannie Mae and Freddie Mac will be issuing to replace their current offerings of TBA-eligible single class, fixed-rate mortgage backed securities.
Unpaid principal balance (UPB) is the portion of a loan that the borrower has not yet paid back to the lender.
Prepayment Mon i tor ing Repor t F i r s t Quar ter 2018
22
Weighted average coupon (WAC) refers to the average gross interest rates owed on the mortgages underlying the security weighted by the percentage of the security’s unpaid principal balance that each mortgage represents.
Weighted average loan age (WALA) refers to the average number of months since the date of origination of mortgages underlying the security weighted by the percentage of the security’s unpaid principal balance that each mortgage represents.
Weighted average maturity (WAM) refers to the average number of months remaining until the final payment is due on mortgages underlying the security weighted by the percentage of the security’s unpaid principal balance that each mortgage represents.