Embed Size (px)
Citation preview
PREQIN QUARTERLY UPDATE:PRIVATE DEBTQ2 2017Insight on the quarter from the leading provider of alternative assets data
alternative assets. intelligent data.
Content includes:FundraisingFunds in MarketInstitutional InvestorsDry PowderDealsFund Performance
© Preqin Ltd. 2017 / www.preqin.com2
PREQIN QUARTERLY UPDATE: PRIVATE DEBT, Q2 2017
FOREWORD - Ryan Flanders, Preqin
Momentum from record private debt fundraising at the end of 2016 has slowed slightly throughout the first half of 2017, which has been headlined by three fund closures north of $3bn, including Cerberus’ $4bn distressed debt fund closed in Q2. Twenty-eight
private debt funds closed in the second quarter of 2017, securing an aggregate total of $16bn in capital commitments globally – down from $26bn in Q1 2017. This is the first time since Q2 2014 ($19bn) in which Q2 private debt fundraising has not surpassed $20bn.
Distressed debt funds, while representing only two of the 28 private debt funds closed in Q2, accounted for 34% ($5.5bn) of total capital raised. Direct lenders enjoyed continued fundraising success, raising a combined $6.4bn, with strong investor interest prevailing in the US and Europe. Since the beginning of 2016, direct lending funds have secured $46bn raised across 82 funds, a substantial figure which has put the strategy squarely in sight for institutional investors looking to generate returns in a low interest rate environment.
With the addition of private debt deals to Preqin’s platform, this Quarterly Update now includes sample deals from the first half of 2017, as well as industry and geographic breakdowns for private lending transactions. In H1 2017, 68% of private debt deals took place in North America, as the home of the most fundraisers, investors and borrowers in a single region globally continues to push forward.
Near-record levels of dry powder in the industry could be putting pressure on the fundraising market, as managers are currently saddled with $205bn in available private debt capital. With dry powder at such high levels, managers may be cautious with fund sizes moving forward, hoping to temper investor expectations with deal flow and interest rate projections in the future.
We hope that you find this report useful and welcome any feedback you have. For more information, please visit wwww.preqin.com or contact [email protected].
All rights reserved. The entire contents of Preqin Quarterly Update: Private Debt, Q2 2017 are the Copyright of Preqin Ltd. No part of this publication or any information contained in it may be copied, transmitted by any electronic means, or stored in any electronic or other data storage medium, or printed or published in any document, report or publication, without the express prior written approval of Preqin Ltd. The information presented in Preqin Quarterly Update: Private Debt, Q2 2017 is for information purposes only and does not constitute and should not be construed as a solicitation or other offer, or recommendation to acquire or dispose of any investment or to engage in any other transaction, or as advice of any nature whatsoever. If the reader seeks advice rather than information then he should seek an independent financial advisor and hereby agrees that he will not hold Preqin Ltd. responsible in law or equity for any decisions of whatever nature the reader makes or refrains from making following its use of Preqin Quarterly Update: Private Debt, Q2 2017. While reasonable efforts have been made to obtain information from sources that are believed to be accurate, and to confirm the accuracy of such information wherever possible, Preqin Ltd. does not make any representation or warranty that the information or opinions contained in Preqin Quarterly Update: Private Debt, Q2 2017 are accurate, reliable, up-to-date or complete. Although every reasonable effort has been made to ensure the accuracy of this publication Preqin Ltd. does not accept any responsibility for any errors or omissions within Preqin Quarterly Update: Private Debt, Q2 2017 or for any expense or other loss alleged to have arisen in any way with a reader’s use of this publication.
p3 Private Debt Opportunity in India, Edelweiss
p5 Fundraising
p6 Funds in Market
p7 Deals
p9 Institutional Investors
p10 Dry Powder
p11 Fund Performance
p12 Conferences
PRIVATE DEBT ONLINE
Private Debt Online is the leading source of data and intelligence on the growing private debt industry and tracks all aspects of the asset class, including fund managers, fund performance, fundraising, institutional investors and more.
Constantly updated by our team of dedicated researchers, Private Debt Online represents the most complete source of industry intelligence available today, with global coverage and all fund managers and investors profiled.
Get in touch today to arrange a demo of Private Debt Online: : [email protected] | : www.preqin.com/privatedebt

alternative assets. intelligent data.
3
DOWNLOAD DATA PACK: www.preqin.com/quarterlyupdate
There has been significant interest in and conversation on private credit in the US and Europe over the last few years; however, Edelweiss has been focused on India. Can you explain the dynamic there, as opposed to the more often discussed US and European markets? Edelweiss’ focus on private debt has been driven by the structural growth story in India, which is reinforced by a stable and development-oriented government. Bank credit growth has tapered while the corporate bond market is only just starting to develop.
With India transitioning from a $2tn to a $5tn economy over the next decade, it creates a huge opportunity for capital solution providers. This has led to an increased requirement for capital from corporate sponsors/entrepreneurs and real estate developers for growth/acquisitions. Additionally, there is a huge potential opportunity, which started over the last three years, to invest in special situations in stressed operating companies.
Private debt in India today is considered as a real alternative to private equity by entrepreneurs in corporate India, as well as by RE developers. The implementation of the Insolvency and Bankruptcy Code (IBC) has further made the private debt opportunity more attractive for foreign investors.
What are the risks of investing in India as opposed to the more developed US and European markets? Investing in India requires a thorough understanding of the borrower and their situation. It requires an institutional framework for practical and effective risk
management, along with significant local knowledge and presence.
India has an effective but slow legal system. In 2002, the SARFAESI Act (Securitization and Reconstruction of Financial Assets and Enforcement of Security Interest) was enacted to protect the rights of secured lenders and licences were awarded to Asset Reconstruction Companies (ARC). Edelweiss is the largest ARC in India with AUM of ~$6bn.
Subsequently, to address the needs of all creditors (secured, unsecured, operational and financial), the government earlier this year enacted the IBC, which forces the lenders to come together and decide on a resolution strategy within a defined timeframe. Failing which, there is a threat to liquidation.
Another risk is the absence of India-based operational turnaround teams.
Also, investors are exposed to currency risk. However, India’s macroeconomic strength, as well as the global commodity slowdown, supports the probability of a stable Indian rupee.
What sort of deals are you looking at in India? Primarily growth/rebuilding-focused situations, including:
■ Financing for investing in operating companies, financing for equity buyout from PE investors, asset acquisition, etc.
■ Providing structured credit solutions to residential RE developers – primarily for project construction post all significant zoning/government
approvals. ■ Credit solutions to stress/distress
companies – buyout of bank loans to restructure for value creation/ priority debt for working capital requirements/primary capital for last-mile financing.
What do you see as the opportunity in credit in the shorter and longer terms in India? We look at private debt as a structural opportunity in India, driven by the Indian growth story and the inability of traditional sources of funding, especially government-owned banks, to meet the requirements due to their internal constraints.
Sponsors of Indian companies will have increased funding requirement for their expansion/acquisitions as the current environment is seen as the beginning of an investment cycle.
The residential RE sector in India is $120bn and is growing at 5-8% per annum. The adoption of Real Estate Regulation Act (RERA) is expected to further encourage the RE demand. Increasing urbanization, a growing middle class, the rise of the services sector and the housing shortage will create significant opportunity to provide funding to developers to bridge this demand.
Industrial stressed asset loans are concentrated in specific sectors with infrastructure, metal & mining, engineering & construction contributing more than 70% of the total $104bn of industrial stress. These sectors are primarily cyclical in nature and are now at the cusp of the beginning of the growth cycle.
PRIVATE DEBT OPPORTUNITY IN INDIA- Venkat Ramaswamy, Edelweiss
VENKAT RAMASWAMYVenkat Ramaswamy is Executive Director of Edelweiss Financial Services Limited, one of India’s leading financial services companies. He co-founded Edelweiss in 1996, which over the last two decades has become a diversified financial services company with various Credit & Non Credit businesses and a young Life Insurance business. Venkat has been one of the driving forces in transforming what was once India’s first new age boutique investment bank to a leading diversified financial conglomerate. Amongst his responsibilities, he also Co-Heads two of Edelweiss’ most strategic businesses – Distress Assets & Resolution business and Global Asset Management business, while continuing to play a mentorship role with the Edelweiss Investment Banking business.
www.edelweissfin.com

Register for demo access to fi nd out how Preqin’s Private Debt Online can help your business:
www.preqin.com/privatedebt
Source new investors for funds
Identify new investment opportunities
Conduct competitor and market analysis
Track fi rms with capital available to invest
Develop new business
alternative assets. intelligent data.
alternative assets. intelligent data.
5
DOWNLOAD DATA PACK: www.preqin.com/quarterlyupdate
FUNDRAISING
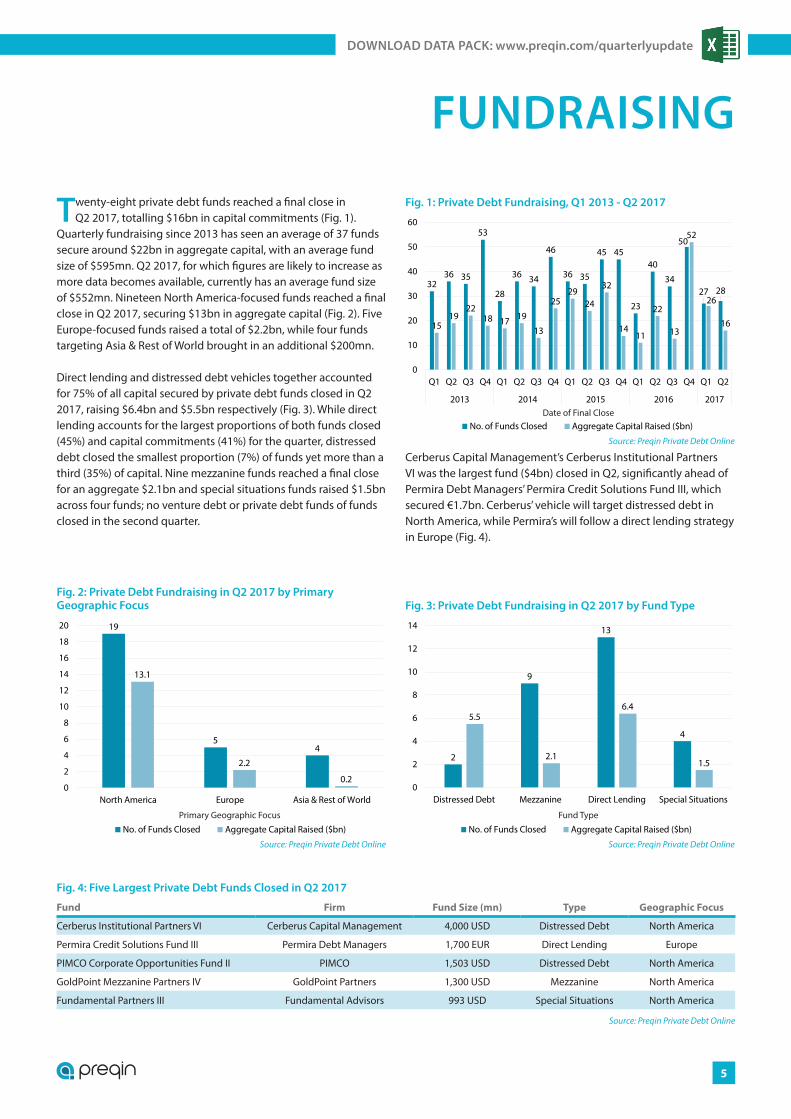
Twenty-eight private debt funds reached a final close in Q2 2017, totalling $16bn in capital commitments (Fig. 1).
Quarterly fundraising since 2013 has seen an average of 37 funds secure around $22bn in aggregate capital, with an average fund size of $595mn. Q2 2017, for which figures are likely to increase as more data becomes available, currently has an average fund size of $552mn. Nineteen North America-focused funds reached a final close in Q2 2017, securing $13bn in aggregate capital (Fig. 2). Five Europe-focused funds raised a total of $2.2bn, while four funds targeting Asia & Rest of World brought in an additional $200mn.
Direct lending and distressed debt vehicles together accounted for 75% of all capital secured by private debt funds closed in Q2 2017, raising $6.4bn and $5.5bn respectively (Fig. 3). While direct lending accounts for the largest proportions of both funds closed (45%) and capital commitments (41%) for the quarter, distressed debt closed the smallest proportion (7%) of funds yet more than a third (35%) of capital. Nine mezzanine funds reached a final close for an aggregate $2.1bn and special situations funds raised $1.5bn across four funds; no venture debt or private debt funds of funds closed in the second quarter.
Cerberus Capital Management’s Cerberus Institutional Partners VI was the largest fund ($4bn) closed in Q2, significantly ahead of Permira Debt Managers’ Permira Credit Solutions Fund III, which secured €1.7bn. Cerberus’ vehicle will target distressed debt in North America, while Permira’s will follow a direct lending strategy in Europe (Fig. 4).
3236 35
53
28
36 34
46
36 35
45 45
23
40
34
50
27 28
1519
2218 17 19
13
2529
24
32
1411
22
13
52
26
16
0
10
20
30
40
50
60
Q1 Q2 Q3 Q4 Q1 Q2 Q3 Q4 Q1 Q2 Q3 Q4 Q1 Q2 Q3 Q4 Q1 Q2
2013 2014 2015 2016 2017
No. of Funds Closed Aggregate Capital Raised ($bn)
Source: Preqin Private Debt Online
Date of Final Close
Fig. 1: Private Debt Fundraising, Q1 2013 - Q2 2017
Fig. 4: Five Largest Private Debt Funds Closed in Q2 2017
Fund Firm Fund Size (mn) Type Geographic Focus
Cerberus Institutional Partners VI Cerberus Capital Management 4,000 USD Distressed Debt North America
Permira Credit Solutions Fund III Permira Debt Managers 1,700 EUR Direct Lending Europe
PIMCO Corporate Opportunities Fund II PIMCO 1,503 USD Distressed Debt North America
GoldPoint Mezzanine Partners IV GoldPoint Partners 1,300 USD Mezzanine North America
Fundamental Partners III Fundamental Advisors 993 USD Special Situations North America
Source: Preqin Private Debt Online
19
54
13.1
2.2
0.20
2
4
6
8
10
12
14
16
18
20
North America Europe Asia & Rest of World
No. of Funds Closed Aggregate Capital Raised ($bn)
Source: Preqin Private Debt Online
Primary Geographic Focus
Fig. 2: Private Debt Fundraising in Q2 2017 by Primary Geographic Focus
2
9
13
4
5.5
2.1
6.4
1.5
0
2
4
6
8
10
12
14
Distressed Debt Mezzanine Direct Lending Special Situations
No. of Funds Closed Aggregate Capital Raised ($bn)
Source: Preqin Private Debt Online
Fund Type
Fig. 3: Private Debt Fundraising in Q2 2017 by Fund Type
© Preqin Ltd. 2017 / www.preqin.com6
PREQIN QUARTERLY UPDATE: PRIVATE DEBT, Q2 2017
FUNDS IN MARKET
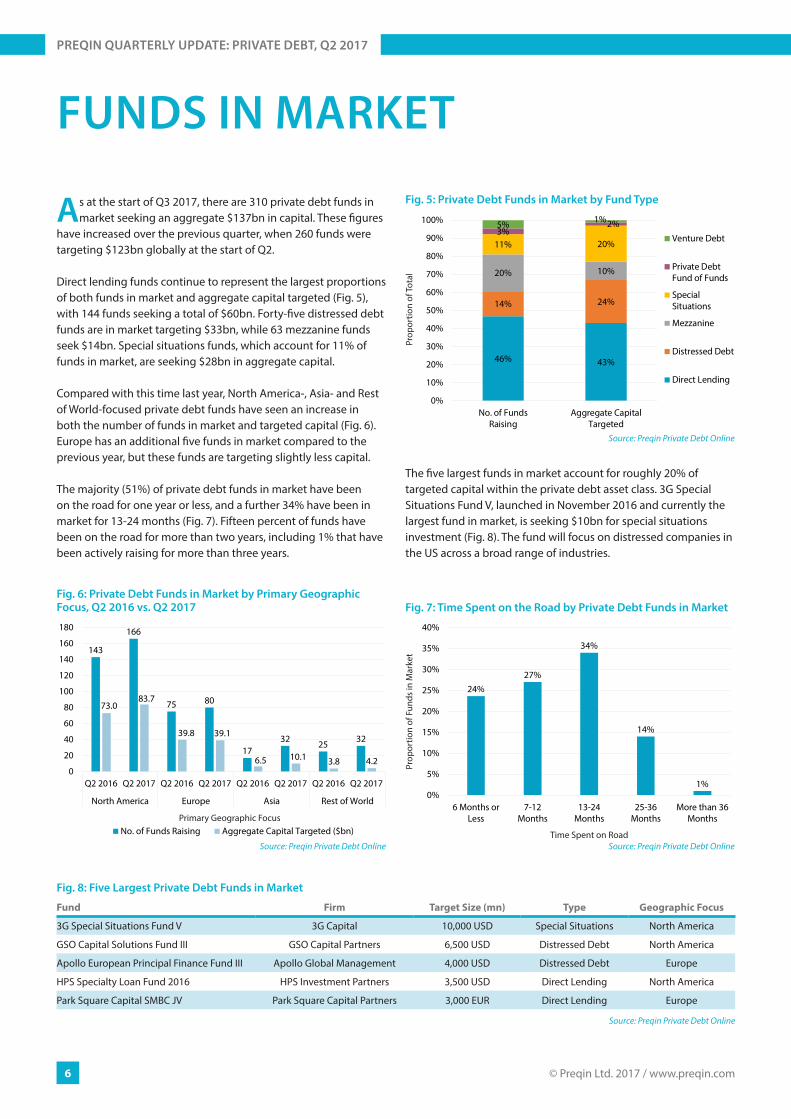
As at the start of Q3 2017, there are 310 private debt funds in market seeking an aggregate $137bn in capital. These figures
have increased over the previous quarter, when 260 funds were targeting $123bn globally at the start of Q2.
Direct lending funds continue to represent the largest proportions of both funds in market and aggregate capital targeted (Fig. 5), with 144 funds seeking a total of $60bn. Forty-five distressed debt funds are in market targeting $33bn, while 63 mezzanine funds seek $14bn. Special situations funds, which account for 11% of funds in market, are seeking $28bn in aggregate capital.
Compared with this time last year, North America-, Asia- and Rest of World-focused private debt funds have seen an increase in both the number of funds in market and targeted capital (Fig. 6). Europe has an additional five funds in market compared to the previous year, but these funds are targeting slightly less capital.
The majority (51%) of private debt funds in market have been on the road for one year or less, and a further 34% have been in market for 13-24 months (Fig. 7). Fifteen percent of funds have been on the road for more than two years, including 1% that have been actively raising for more than three years.
The five largest funds in market account for roughly 20% of targeted capital within the private debt asset class. 3G Special Situations Fund V, launched in November 2016 and currently the largest fund in market, is seeking $10bn for special situations investment (Fig. 8). The fund will focus on distressed companies in the US across a broad range of industries.
Fig. 8: Five Largest Private Debt Funds in Market
Fund Firm Target Size (mn) Type Geographic Focus
3G Special Situations Fund V 3G Capital 10,000 USD Special Situations North America
GSO Capital Solutions Fund III GSO Capital Partners 6,500 USD Distressed Debt North America
Apollo European Principal Finance Fund III Apollo Global Management 4,000 USD Distressed Debt Europe
HPS Specialty Loan Fund 2016 HPS Investment Partners 3,500 USD Direct Lending North America
Park Square Capital SMBC JV Park Square Capital Partners 3,000 EUR Direct Lending Europe
Source: Preqin Private Debt Online
46% 43%
14% 24%
20% 10%
11% 20%3%
2%5% 1%
0%
10%
20%
30%
40%
50%
60%
70%
80%
90%
100%
No. of FundsRaising
Aggregate CapitalTargeted
Venture Debt
Private DebtFund of Funds
SpecialSituations
Mezzanine
Distressed Debt
Direct Lending
Source: Preqin Private Debt Online
Prop
ortio
n of
Tota
l
Fig. 5: Private Debt Funds in Market by Fund Type
143
166
75 80
1732 25 32
73.083.7
39.8 39.1
6.5 10.1 3.8 4.20
20
40
60
80
100
120
140
160
180
Q2 2016 Q2 2017 Q2 2016 Q2 2017 Q2 2016 Q2 2017 Q2 2016 Q2 2017
North America Europe Asia Rest of World
No. of Funds Raising Aggregate Capital Targeted ($bn)
Source: Preqin Private Debt Online
Primary Geographic Focus
Fig. 6: Private Debt Funds in Market by Primary Geographic Focus, Q2 2016 vs. Q2 2017
24%27%
34%
14%
1%0%
5%
10%
15%
20%
25%
30%
35%
40%
6 Months orLess
7-12Months
13-24Months
25-36Months
More than 36Months
Source: Preqin Private Debt Online
Prop
ortio
n of
Fun
ds in
Mar
ket
Time Spent on Road
Fig. 7: Time Spent on the Road by Private Debt Funds in Market
alternative assets. intelligent data.
7
DOWNLOAD DATA PACK: www.preqin.com/quarterlyupdate
DEALS
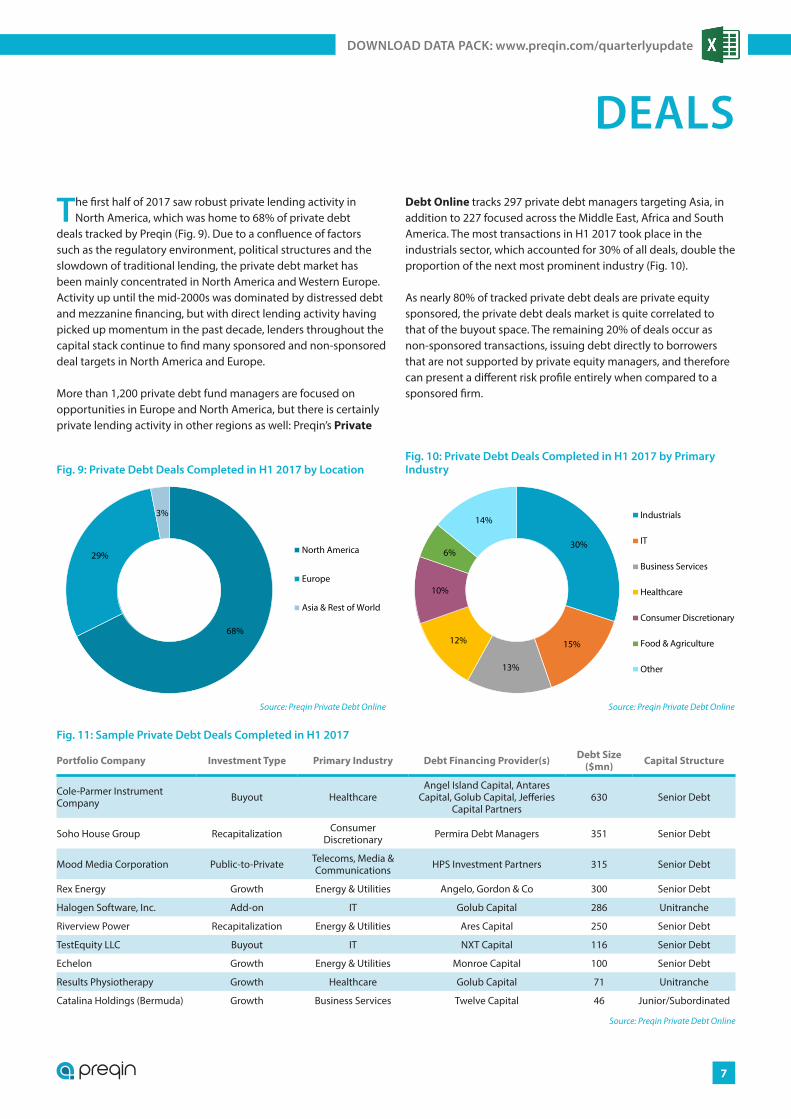
The first half of 2017 saw robust private lending activity in North America, which was home to 68% of private debt
deals tracked by Preqin (Fig. 9). Due to a confluence of factors such as the regulatory environment, political structures and the slowdown of traditional lending, the private debt market has been mainly concentrated in North America and Western Europe. Activity up until the mid-2000s was dominated by distressed debt and mezzanine financing, but with direct lending activity having picked up momentum in the past decade, lenders throughout the capital stack continue to find many sponsored and non-sponsored deal targets in North America and Europe.
More than 1,200 private debt fund managers are focused on opportunities in Europe and North America, but there is certainly private lending activity in other regions as well: Preqin’s Private
Debt Online tracks 297 private debt managers targeting Asia, in addition to 227 focused across the Middle East, Africa and South America. The most transactions in H1 2017 took place in the industrials sector, which accounted for 30% of all deals, double the proportion of the next most prominent industry (Fig. 10).
As nearly 80% of tracked private debt deals are private equity sponsored, the private debt deals market is quite correlated to that of the buyout space. The remaining 20% of deals occur as non-sponsored transactions, issuing debt directly to borrowers that are not supported by private equity managers, and therefore can present a different risk profile entirely when compared to a sponsored firm.
68%
29%
3%
North America
Europe
Asia & Rest of World
Source: Preqin Private Debt Online
Fig. 9: Private Debt Deals Completed in H1 2017 by Location
30%
15%
13%
12%
10%
6%
14% Industrials
IT
Business Services
Healthcare
Consumer Discretionary
Food & Agriculture
Other
Source: Preqin Private Debt Online
Fig. 10: Private Debt Deals Completed in H1 2017 by Primary Industry
Fig. 11: Sample Private Debt Deals Completed in H1 2017
Portfolio Company Investment Type Primary Industry Debt Financing Provider(s) Debt Size ($mn) Capital Structure
Cole-Parmer Instrument Company Buyout Healthcare
Angel Island Capital, Antares Capital, Golub Capital, Jefferies
Capital Partners630 Senior Debt
Soho House Group Recapitalization Consumer Discretionary Permira Debt Managers 351 Senior Debt
Mood Media Corporation Public-to-Private Telecoms, Media & Communications HPS Investment Partners 315 Senior Debt
Rex Energy Growth Energy & Utilities Angelo, Gordon & Co 300 Senior Debt
Halogen Software, Inc. Add-on IT Golub Capital 286 Unitranche
Riverview Power Recapitalization Energy & Utilities Ares Capital 250 Senior Debt
TestEquity LLC Buyout IT NXT Capital 116 Senior Debt
Echelon Growth Energy & Utilities Monroe Capital 100 Senior Debt
Results Physiotherapy Growth Healthcare Golub Capital 71 Unitranche
Catalina Holdings (Bermuda) Growth Business Services Twelve Capital 46 Junior/Subordinated
Source: Preqin Private Debt Online

© Preqin Ltd. 2017 / www.preqin.com8
PREQIN QUARTERLY UPDATE: PRIVATE DEBT, Q2 2017
SEPTEMBER 13 & 14, 2017 | NEW YORK
F I N A N C E S U M M I T 8TH SPECIALTY
REGISTER TODAY AT www.iglobalforum.com/spfinance8
KEY TOPICS TO BE COVERED INCLUDE:• Latest macroeconomic trends and geopolitical events impacting the specialty fi nance industry• Regulatory developments shaping the specialty fi nance landscape and new players and partnerships emerging in
the marketplace• Get up-to-date information on new asset classes, sectors and geographies for continued returns in a risky market• Update on traditional middle market lending, online marketplace lending, and new fi ntech developments
affecting your investments• The future of securitization with new compliance requirements impacting investment opportunities and the ability to lend• Strategies from top lenders and originators in raising capital and reaching borrowers and investor appetite across
specialty fi nance sub-classes and expected risk tolerance for the coming year
S U M M I T
impacting the specialty fi nance industry
Usediscount code
PREQIN for
10% off
Contact: [email protected] ph. +420 222 947 912
September 26th, 2017
Global Distressed Investments Forum
London, Marriott Grosvenor Square
alternative assets. intelligent data.

alternative assets. intelligent data.
9
DOWNLOAD DATA PACK: www.preqin.com/quarterlyupdate
INSTITUTIONAL INVESTORS
Tracking more than 2,800 active investors in private debt globally, Preqin’s Private Debt Online collects detailed
allocation plans from the widest range of investors in the alternatives industry. As at the end of Q2 2017, the 10 largest investors in private debt currently allocate a combined $75bn to the asset class.
Since Q2 2016, mezzanine has seen the largest change in investor appetite among private debt strategies, with the proportion of investors actively seeking mezzanine opportunities in the year ahead growing from 39% to 51% (Fig. 12). At present, direct lending and distressed debt are each targeted by 45% of active investors, followed by special situations at 27%.
In terms of geography, the largest proportion (45%) of investor fund searches for the next 12 months are targeting Europe-focused funds, followed closely by funds focused on North America (41%, Fig. 13). The proportion of investors searching for opportunities in emerging markets has increased from 9% in Q2 2016 to 13%. Asia-focused vehicles have also seen a slight uptick in appetite.
Investors’ plans for their private debt portfolios remain diverse: more than half (54%) of investors plan to commit less than $50mn to private debt over the next 12 months, while 34% will allocate between $50mn and $499mn (Fig. 14). The majority (77%) of investors plan to make these capital commitments via five or fewer private debt funds over the next year (Fig. 15).
39%35%
43%
19%
5% 5%
51%
45% 45%
27%
4% 4%
0%
10%
20%
30%
40%
50%
60%
Mez
zani
ne
Dis
tres
sed
Deb
t
Dire
ctLe
ndin
g
Spec
ial
Situ
atio
ns
Vent
ure
Deb
t
Fund
of
Fund
s
Q2 2016
Q2 2017
Source: Preqin Private Debt Online
Prop
ortio
n of
Fun
d Se
arch
es
Strategy Targeted
Fig. 12: Strategies Targeted by Private Debt Investors in the Next 12 Months, Q2 2016 vs. Q2 2017
43%46%
16%
9% 9%
41%45%
19%
8%
13%
0%
5%
10%
15%
20%
25%
30%
35%
40%
45%
50%
NorthAmerica
Europe Asia Rest ofWorld
EmergingMarkets
Q2 2016
Q2 2017
Source: Preqin Private Debt Online
Prop
ortio
n of
Fun
d Se
arch
es
Region Targeted
Fig. 13: Regions Targeted by Private Debt Investors in the Next 12 Months, Q2 2016 vs. Q2 2017
54%
18%
16%
12%
Less than $50mn
$50-99mn
$100-499mn
$500mn or More
Source: Preqin Private Debt Online
Fig. 14: Amount of Capital Investors Plan to Commit to Private Debt Funds in the Next 12 Months
77%
16%
7%
1-5 Funds
6-10 Funds
10 Funds or More
Source: Preqin Private Debt Online
Fig. 15: Number of Private Debt Funds Investors Plan to Commit to in the Next 12 Months
© Preqin Ltd. 2017 / www.preqin.com10
PREQIN QUARTERLY UPDATE: PRIVATE DEBT, Q2 2017
DRY POWDER
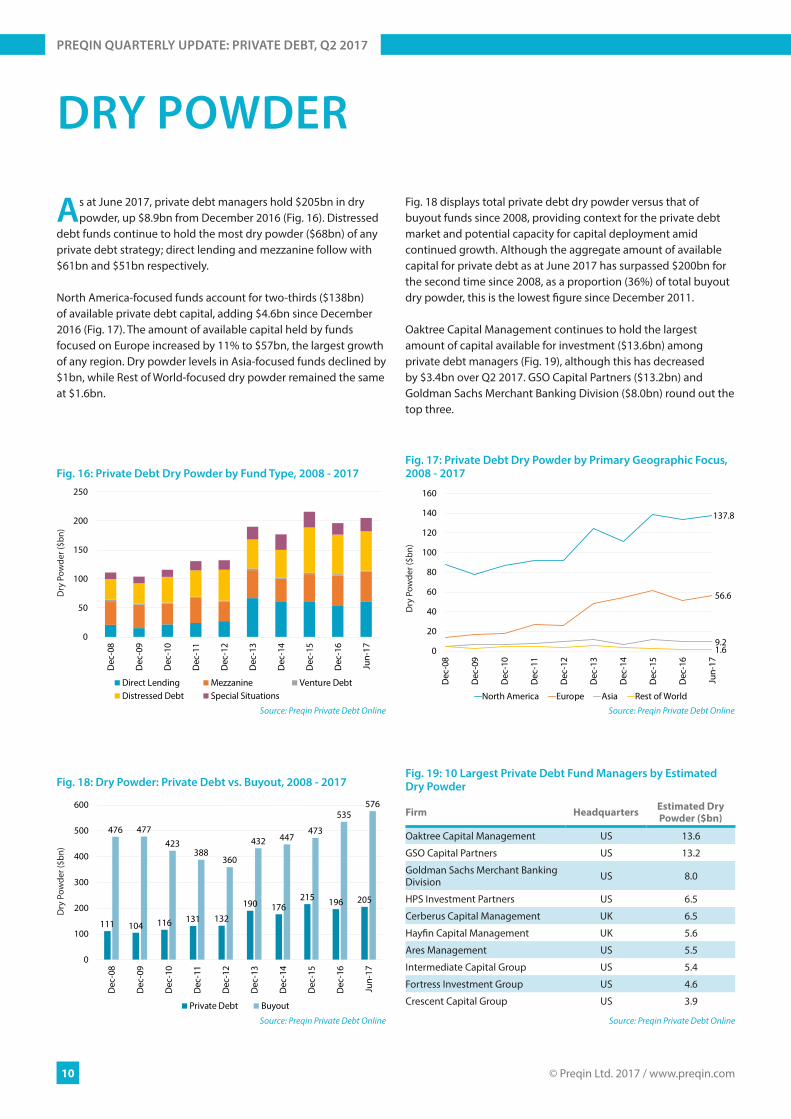
As at June 2017, private debt managers hold $205bn in dry powder, up $8.9bn from December 2016 (Fig. 16). Distressed
debt funds continue to hold the most dry powder ($68bn) of any private debt strategy; direct lending and mezzanine follow with $61bn and $51bn respectively.
North America-focused funds account for two-thirds ($138bn) of available private debt capital, adding $4.6bn since December 2016 (Fig. 17). The amount of available capital held by funds focused on Europe increased by 11% to $57bn, the largest growth of any region. Dry powder levels in Asia-focused funds declined by $1bn, while Rest of World-focused dry powder remained the same at $1.6bn.
Fig. 18 displays total private debt dry powder versus that of buyout funds since 2008, providing context for the private debt market and potential capacity for capital deployment amid continued growth. Although the aggregate amount of available capital for private debt as at June 2017 has surpassed $200bn for the second time since 2008, as a proportion (36%) of total buyout dry powder, this is the lowest figure since December 2011.
Oaktree Capital Management continues to hold the largest amount of capital available for investment ($13.6bn) among private debt managers (Fig. 19), although this has decreased by $3.4bn over Q2 2017. GSO Capital Partners ($13.2bn) and Goldman Sachs Merchant Banking Division ($8.0bn) round out the top three.
0
50
100
150
200
250
Dec
-08
Dec
-09
Dec
-10
Dec
-11
Dec
-12
Dec
-13
Dec
-14
Dec
-15
Dec
-16
Jun-
17
Direct Lending Mezzanine Venture DebtDistressed Debt Special Situations
Source: Preqin Private Debt Online
Dry
Pow
der (
$bn)
Fig. 16: Private Debt Dry Powder by Fund Type, 2008 - 2017
137.8
56.6
9.21.60
20
40
60
80
100
120
140
160
Dec
-08
Dec
-09
Dec
-10
Dec
-11
Dec
-12
Dec
-13
Dec
-14
Dec
-15
Dec
-16
Jun-
17
North America Europe Asia Rest of World
Source: Preqin Private Debt Online
Dry
Pow
der (
$bn)
Fig. 17: Private Debt Dry Powder by Primary Geographic Focus, 2008 - 2017
111 104 116 131 132
190 176215 196 205
476 477423
388360
432 447473
535576
0
100
200
300
400
500
600
Dec
-08
Dec
-09
Dec
-10
Dec
-11
Dec
-12
Dec
-13
Dec
-14
Dec
-15
Dec
-16
Jun-
17
Private Debt Buyout
Source: Preqin Private Debt Online
Dry
Pow
der (
$bn)
Fig. 18: Dry Powder: Private Debt vs. Buyout, 2008 - 2017Fig. 19: 10 Largest Private Debt Fund Managers by Estimated Dry Powder
Firm Headquarters Estimated Dry Powder ($bn)
Oaktree Capital Management US 13.6
GSO Capital Partners US 13.2
Goldman Sachs Merchant Banking Division US 8.0
HPS Investment Partners US 6.5
Cerberus Capital Management UK 6.5
Hayfin Capital Management UK 5.6
Ares Management US 5.5
Intermediate Capital Group US 5.4
Fortress Investment Group US 4.6
Crescent Capital Group US 3.9
Source: Preqin Private Debt Online
alternative assets. intelligent data.
11
DOWNLOAD DATA PACK: www.preqin.com/quarterlyupdate
FUND PERFORMANCE
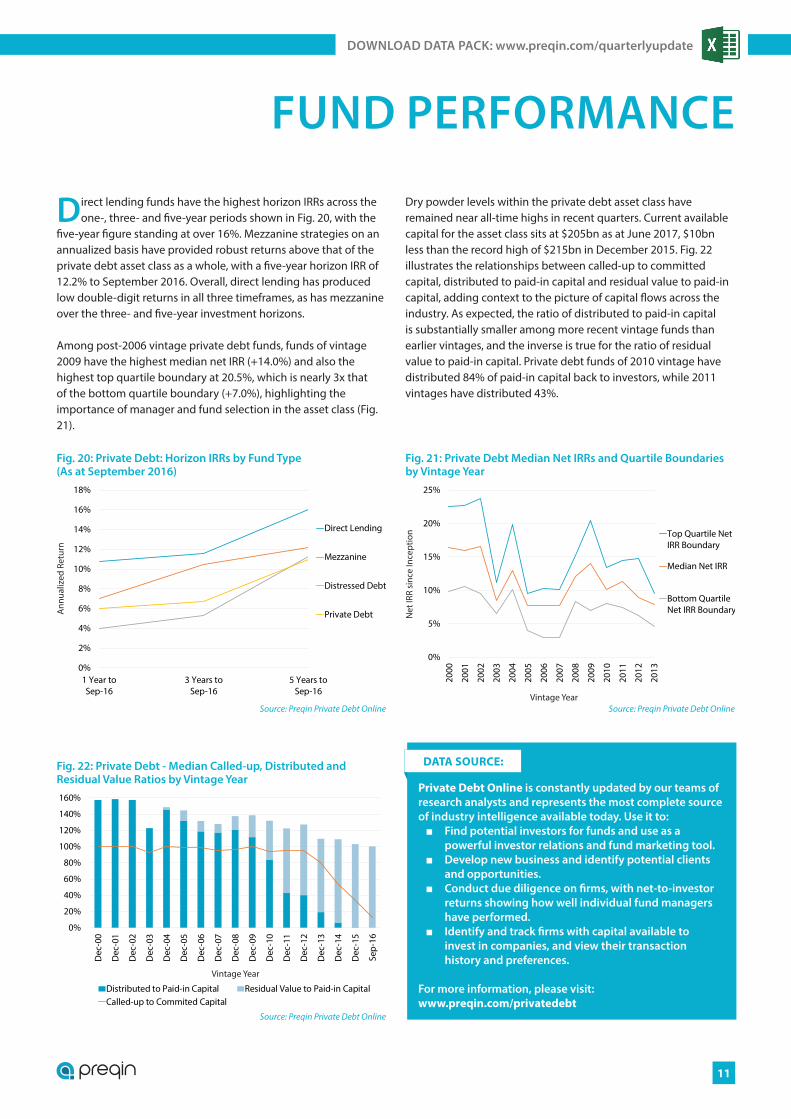
Direct lending funds have the highest horizon IRRs across the one-, three- and five-year periods shown in Fig. 20, with the
five-year figure standing at over 16%. Mezzanine strategies on an annualized basis have provided robust returns above that of the private debt asset class as a whole, with a five-year horizon IRR of 12.2% to September 2016. Overall, direct lending has produced low double-digit returns in all three timeframes, as has mezzanine over the three- and five-year investment horizons.
Among post-2006 vintage private debt funds, funds of vintage 2009 have the highest median net IRR (+14.0%) and also the highest top quartile boundary at 20.5%, which is nearly 3x that of the bottom quartile boundary (+7.0%), highlighting the importance of manager and fund selection in the asset class (Fig. 21).
Dry powder levels within the private debt asset class have remained near all-time highs in recent quarters. Current available capital for the asset class sits at $205bn as at June 2017, $10bn less than the record high of $215bn in December 2015. Fig. 22 illustrates the relationships between called-up to committed capital, distributed to paid-in capital and residual value to paid-in capital, adding context to the picture of capital flows across the industry. As expected, the ratio of distributed to paid-in capital is substantially smaller among more recent vintage funds than earlier vintages, and the inverse is true for the ratio of residual value to paid-in capital. Private debt funds of 2010 vintage have distributed 84% of paid-in capital back to investors, while 2011 vintages have distributed 43%.
0%
2%
4%
6%
8%
10%
12%
14%
16%
18%
1 Year toSep-16
3 Years toSep-16
5 Years toSep-16
Direct Lending
Mezzanine
Distressed Debt
Private Debt
Source: Preqin Private Debt Online
Ann
ualiz
ed R
etur
n
Fig. 20: Private Debt: Horizon IRRs by Fund Type(As at September 2016)
0%
5%
10%
15%
20%
25%
2000
2001
2002
2003
2004
2005
2006
2007
2008
2009
2010
2011
2012
2013
Top Quartile NetIRR Boundary
Median Net IRR
Bottom QuartileNet IRR Boundary
Source: Preqin Private Debt Online
Net
IRR
sinc
e In
cept
ion
Vintage Year
Fig. 21: Private Debt Median Net IRRs and Quartile Boundaries by Vintage Year
0%
20%
40%
60%
80%
100%
120%
140%
160%
Dec
-00
Dec
-01
Dec
-02
Dec
-03
Dec
-04
Dec
-05
Dec
-06
Dec
-07
Dec
-08
Dec
-09
Dec
-10
Dec
-11
Dec
-12
Dec
-13
Dec
-14
Dec
-15
Sep-
16
Distributed to Paid-in Capital Residual Value to Paid-in CapitalCalled-up to Commited Capital
Source: Preqin Private Debt Online
Vintage Year
Fig. 22: Private Debt - Median Called-up, Distributed and Residual Value Ratios by Vintage Year
DATA SOURCE:
Private Debt Online is constantly updated by our teams of research analysts and represents the most complete source of industry intelligence available today. Use it to:
■ Find potential investors for funds and use as a powerful investor relations and fund marketing tool.
■ Develop new business and identify potential clients and opportunities.
■ Conduct due diligence on firms, with net-to-investor returns showing how well individual fund managers have performed.
■ Identify and track firms with capital available to invest in companies, and view their transaction history and preferences.
For more information, please visit: www.preqin.com/privatedebt
© Preqin Ltd. 2017 / www.preqin.com12
PREQIN QUARTERLY UPDATE: PRIVATE DEBT, Q2 2017
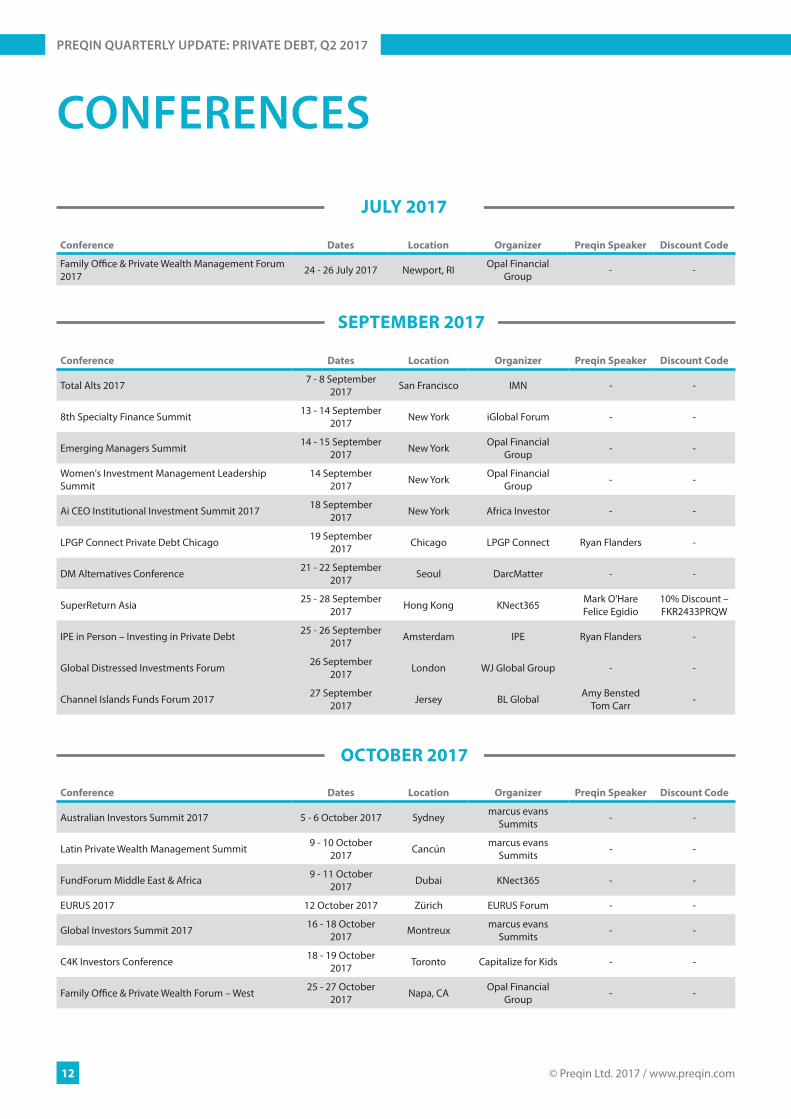
CONFERENCES
JULY 2017
Conference Dates Location Organizer Preqin Speaker Discount Code
Family Office & Private Wealth Management Forum 2017 24 - 26 July 2017 Newport, RI Opal Financial
Group - -
SEPTEMBER 2017
Conference Dates Location Organizer Preqin Speaker Discount Code
Total Alts 2017 7 - 8 September 2017 San Francisco IMN - -
8th Specialty Finance Summit 13 - 14 September 2017 New York iGlobal Forum - -
Emerging Managers Summit 14 - 15 September 2017 New York Opal Financial
Group - -
Women's Investment Management Leadership Summit
14 September 2017 New York Opal Financial
Group - -
Ai CEO Institutional Investment Summit 2017 18 September 2017 New York Africa Investor - -
LPGP Connect Private Debt Chicago 19 September 2017 Chicago LPGP Connect Ryan Flanders -
DM Alternatives Conference 21 - 22 September 2017 Seoul DarcMatter - -
SuperReturn Asia 25 - 28 September 2017 Hong Kong KNect365 Mark O'Hare
Felice Egidio10% Discount – FKR2433PRQW
IPE in Person – Investing in Private Debt 25 - 26 September 2017 Amsterdam IPE Ryan Flanders -
Global Distressed Investments Forum 26 September 2017 London WJ Global Group - -
Channel Islands Funds Forum 2017 27 September 2017 Jersey BL Global Amy Bensted
Tom Carr -
OCTOBER 2017
Conference Dates Location Organizer Preqin Speaker Discount Code
Australian Investors Summit 2017 5 - 6 October 2017 Sydney marcus evans Summits - -
Latin Private Wealth Management Summit 9 - 10 October 2017 Cancún marcus evans
Summits - -
FundForum Middle East & Africa 9 - 11 October 2017 Dubai KNect365 - -
EURUS 2017 12 October 2017 Zürich EURUS Forum - -
Global Investors Summit 2017 16 - 18 October 2017 Montreux marcus evans
Summits - -
C4K Investors Conference 18 - 19 October 2017 Toronto Capitalize for Kids - -
Family Office & Private Wealth Forum – West 25 - 27 October 2017 Napa, CA Opal Financial
Group - -

alternative assets. intelligent data.
13
DOWNLOAD DATA PACK: www.preqin.com/quarterlyupdate
DATE: 13 - 14 September 2017
INFORMATION: http://goo.gl/4rp75y
LOCATION: New York
ORGANIZER: iGlobal Forum
iGlobal Forum is pleased to present the upcoming 8th Specialty Finance Summit taking place in New York on September 13th & 14th, 2017! 8th Specialty Finance Summit will bring together thought leaders from all sides of the specialty finance industry.
8TH SPECIALTY FINANCE SUMMIT
© Preqin Ltd. 2017 / www.preqin.com14
PREQIN QUARTERLY UPDATE: PRIVATE DEBT, Q2 2017
DATE: 26 September 2017
INFORMATION: http://www.wjglobalgroup.com/
LOCATION: London Marriott Hotel Grosvenor Square
ORGANIZER: WJ Global Group
Changing perspectives and igniting discussions, the GDI Forum brings together senior executives from investment firms, funds, banks, AMCs and more to discuss current market trends and developments within the fields of distressed investing. Join us alongside leaders at the forefront of the industry and take part in the international conversation about NPLs, CRE, private equity, debt purchasing and much more.
GLOBAL DISTRESSED INVESTMENTS FORUM
DATE: 19 September 2017
INFORMATION: http://www.lpgpconnect.com
LOCATION: Hyatt Regency McCormick Place, 2233 S Martin Luther King Dr, Chicago, IL 60616, USA
ORGANIZER: LPGP Connect
The LPGP Connect 2nd Annual Private Debt Chicago conference brings together over 190 LPs and GPs from the global private debt community to analyse the latest trends in the market, discover new investment opportunities and build meaningful business relationships for long term growth. • 60+ active institutional investors • 30+ fund of funds• LP-GP dinner• Unparalleled networking opportunities • Held strictly under Chatham House Rules
LPGP CONNECT 2ND ANNUAL PRIVATE DEBT CHICAGO

alternative assets. intelligent data.
With global coverage and detailed information on all aspects of the private debt asset class, Preqin’s industry-leading Private Debt Online service keeps you up-to-date on all the latest developments in the
private debt universe.
Find out how Preqin’s range of private debt products and services can help you:
www.preqin.com/privatedebt
PRIVATE DEBT ONLINE
New York ■ London ■ Singapore ■ San Francisco ■ Hong Kong ■ Manila