Embed Size (px)
Citation preview

Preschool Attendance, Schooling, andCognitive Skills in East Africa?
Jan Bietenbeck1, Sanna Ericsson2, Fredrick M. Wamalwa3
July 1, 2019
Abstract
We study the effects of preschool attendance on children’s schooling andcognitive skills in Kenya and Tanzania. We use a within-household estima-tor and data from nationally representative surveys of school-age children’sliteracy and numeracy skills, which include retrospective information onpreschool attendance. In both countries, school entry rules are not strictlyenforced, and children who attend preschool often start primary schoollate. At ages 7-9, these children have thus attended fewer school gradesthan their same-aged peers without pre-primary education. However, theycatch up over time: at ages 13-16, children who went to preschool haveattended about the same number of school grades and score about 0.10standard deviations higher on standardized tests in both countries. Theyare also 3 (5) percentage points more likely to achieve basic literacy andnumeracy in Kenya (Tanzania).
Keywords : preschool, education, cognitive skills, Sub-Saharan AfricaJEL codes : I21, J24
?We thank Kaveh Majlesi, Alessandro Martinello, Emily Oster, Jorge Perez Perez,Andreas Stegmann, Alessandro Tarozzi, Petra Thiemann, two anonymous referees, andaudiences at the University of Groningen, the 2017 Lund-SFI Workshop in AppliedMicroeconomics, the 2017 Nordic Conference in Development Economics, the autumn2017 Copenhagen Education Network Workshop, the 2018 CSAE conference, the 2018GlaD conference, and the 2018 ESPE conference for helpful comments. Declarations ofinterest: none.
1Lund University Department of Economics and IZA. Corresponding author. Emailaddress: [email protected]
2Lund University Department of Economics.3School of Economics, Faculty of Commerce, University of Cape Town.

1. Introduction
School enrollment in Sub-Saharan Africa has increased substantially
over the past two decades. However, many students fall behind the cur-
riculum early on, and grade repetition and early dropout are widespread
(UNESCO, 2012). Students also learn remarkably little in school: for ex-
ample, only one in five third-grade students in East Africa has second-
grade literacy and numeracy skills, and less than one third of sixth-grade
students in Southern and Eastern Africa can solve a simple subtraction
problem (Uwezo, 2015; Bietenbeck, Piopiunik, and Wiederhold, 2018).
One possible reason why students in these countries perform so poorly is
that they enter school unprepared. Specifically, to the extent that early and
later learning are complementary, a lack of education before starting school
reduces children’s efficiency in learning once they arrive there (Cunha and
Heckman, 2007). High-quality preschool programs which prepare children
for school are therefore often seen as a promising way to enhance learning
outcomes (e.g. World Bank, 2018). In Sub-Saharan Africa, pre-primary
education has been expanding rapidly, with the gross enrollment ratio dou-
bling from 15% to 32% between 2000 and 2017.1 Whether preschools are
actually effective at boosting student outcomes in this region is unclear,
however, because rigorous empirical evidence is still scarce.
In this paper, we study the effects of preschool attendance on chil-
dren’s schooling and cognitive skills in Kenya and Tanzania. Our empirical
analysis draws on data from Uwezo, which conducts nationally representa-
tive household surveys of school-age children’s education and their literacy
and numeracy skills. The surveys also collect retrospective information on
preschool attendance, which we can relate to current outcomes of respon-
dents up to 16 years of age. The main part of our investigation focuses
on impacts on the highest grade of school attended and a composite test
score, which summarizes a child’s performance on the standardized liter-
acy and numeracy assessments. The data contain information on these
outcomes for more than half a million children across the two countries,
independently of whether they are currently enrolled in school or not.
1These figures were retrieved from the World Development Indicators(https://data.worldbank.org/indicator/SE.PRE.ENRR) on June 19, 2019.
1

Our regression framework compares the outcomes of children who did
and did not attend preschool. For identification, we rely on within-
household differences, thereby controlling for all determinants of outcomes
and attendance that vary across families.2 We argue that the leftover vari-
ation between siblings is likely due to changes in the local availability of
preschools, which came about because of an expansion of the pre-primary
sector during our study period. In support of this claim, we show that
even within households, children in later cohorts are much more likely to
have attended preschool. To mitigate concerns about endogenous selection
from the start, the regressions also control for a variety of predetermined
characteristics that still vary between siblings.
The impact of preschool attendance on schooling follows an interesting
dynamic pattern. In both Kenya and Tanzania, school entry rules are
not strictly enforced, and for reasons discussed below, children who attend
preschool often start primary school late. At ages 7-9, these children thus
have attended fewer school grades than their same-aged peers without pre-
primary education. However, once enrolled in primary school, children who
attended preschool progress through grades faster and are less likely to drop
out. Eventually, in both countries, they thus catch up and at ages 13-16
have attended about the same number of school grades as their peers.
In terms of cognitive skills, the estimates for the composite test score
show that children who went to preschool outperform their peers in the
long run. In Kenya, this effect fades in at early ages and soon stabilizes
at a gain of about 0.10 standard deviations (SD). In Tanzania, in contrast,
children who attended preschool outperform their peers from the age of
school start, with long-term gains of the same order of magnitude as in
Kenya. Separate regressions moreover reveal that among 13- to 16-year-
olds, preschool attendance raises the likelihood of mastering basic, second-
grade literacy and numeracy by 3 percentage points in Kenya and by 5
percentage points in Tanzania. Taken together, these findings show that
2Similar strategies have been used by Currie and Thomas (1995), Garces, Thomas,and Currie (2002), and Deming (2009) to estimate the impacts of the Head Start programin the United States, and by Berlinski, Galiani, and Manacorda (2008) to estimate theeffects of preschool in Uruguay. Throughout the paper, we use the terms “within-household differences” and “between-sibling differences” interchangeably.
2
there are important benefits from preschool attendance in both countries.
To ensure that these results are not driven by selection, we perform
a variety of falsification tests and robustness checks. For example, we
show that children who attended preschool do not differentially benefit
from other educational inputs such as private tutoring, suggesting that
our findings are not due to child-specific investments related to unobserved
characteristics. Applying the method developed by Oster (2017), we also
judge the importance of omitted variable bias more generally by observing
the sensitivity of our regression results to the addition of controls. From
this approach, selection on unobserved factors would need to be at least
four times as large as selection on observed factors to explain away the
long-term impacts on the composite test score.
Our paper contributes to a growing literature on the impacts of
preschool education on children’s outcomes in developing countries, which
has focused mostly on Asia and Latin America and which is reviewed in de-
tail in Nores and Barnett (2010) and in Rao et al. (2014). Using retrospec-
tive data on preschool enrollment and the same within-household estimator
as we do, Berlinski, Galiani, and Manacorda (2008) find that Uruguayan
children who attended preschool accumulate 0.8 more years of education
by age 15. Applying the same strategy to Egyptian data, Krafft (2015)
finds that preschool attendance leads to an additional 0.4 years of school-
ing among 18-29 year-olds. Behrman, Cheng, and Todd (2004), Berlinski,
Galiani, and Gertler (2009), and Brinkman et al. (2017) similarly document
positive short-term effects of preschool attendance on children’s cognitive
skills in Bolivia, Argentina, and Indonesia, respectively. In contrast, a
randomized evaluation of a preschool construction program in Cambodia
found negative short-term impacts on test scores of targeted children, a re-
sult that is partly explained by a shift from underage enrollment in primary
school to enrollment in preschool (Bouguen et al., 2018).3
To the best of our knowledge, the only other rigorous study of preschool
effects in Sub-Saharan Africa is the paper by Martinez, Naudeau, and
3Zuilkowski et al. (2012), Hazarika and Viren (2013), Cortazar (2015), and Aboud,Proulx, and Asrilla (2016) also evaluate the impacts of preschool education on children’slearning outcomes in developing countries. Unlike our analysis, these studies do notcontrol for selection into preschool based on unobserved factors.
3

Pereira (2013), who report on an experimental evaluation of a model
preschool program in the Gaza province of Mozambique. The authors find
that two years after the start of the program, children were more likely to
be enrolled in primary school and had higher cognitive and socio-emotional
skills. In contrast to this small-scale evaluation, our study uses nationally
representative data on preschool attendance and learning outcomes from
two countries. Moreover, unlike most of the previous literature, we are able
to examine the longer-term effects of preschool attendance.
2. Institutional background
2.1. Education and preschools in Kenya
Basic education in Kenya consists of three years of preschool, eight
years of primary school, and four years of secondary school.4 Preschool
comprises three distinct grades – baby class (ages 3-4), nursery (ages 4-
5), and pre-unit (ages 5-6) –, even though in practice children of different
ages are often taught together in the same classroom. Attendance is not
compulsory, and children who do not go to preschool typically stay home
to help with household chores instead (Daniel, 2012). In the year after they
turn six, all children are supposed to enter primary school, although this
rule is not strictly enforced and in practice many children enter primary
school late. Primary school has been free of charge since fees were abolished
in 2003. At the end of primary school, students take a national leaving
exam, which largely determines which secondary schools they can enter.
There are two broad types of preschools in Kenya. First, public
preschools are run by the government and are usually attached to a primary
school. In rural areas, these preschools are often the only available option.
Second, private preschools are owned and run by a variety of providers, in-
cluding non-governmental and faith-based organizations, community-based
associations, and private-for-profit agents. They comprise a diverse range
of institutions, including: highly unregulated and unregistered non-formal
preschools, which are mainly located in informal urban settlements; formal
4The following description of the preschool and school systems in Kenya draws onTooley, Dixon, and Stanfield (2008), Bidwell, Parry, and Watine (2013), Heyneman andStern (2014), Edwards Jr., Klees, and Wildish (2015), and Ngware et al. (2016).
4

private preschool academies in middle and high-income areas; and a small
number of exclusive private preschools catering to very high-income house-
holds. All preschools (both public and private) charge tuition fees, which
vary widely depending on the type of institution attended, with non-formal
private preschools charging the lowest fees.
Unlike in many European countries and the United States, where pre-
primary education for younger children typically focuses on play, preschool
studies in Kenya are highly academic: students sit at desks and listen to the
teacher teach in a classroom-like setting. Curricula, while not standardized,
tend to emphasize the learning of basic numeracy and literacy skills via
memorization and recitation. In contrast, only little attention is paid to
the development of socio-emotional skills (Ngware et al., 2016). As children
often spend more than 35 hours per week in preschool, most institutions
offer a feeding program, which is financed via the tuition fees or via special
meal fees (Bidwell, Parry, and Watine, 2013).
Mirroring the diversity in institutional arrangements, the quality of
preschools as perceived by parents varies widely (Bidwell, Parry, and Wa-
tine, 2013), and is considered low on average by international standards
(Ngware et al., 2016). Available metrics of preschool quality show no
consistent trends during our study period: on the one hand, the aver-
age student-teacher ratio in Kenya rose from 23 to 26 between 2004 and
2014 (in comparison, the ratio in OECD countries stood at 15 in 2014).
On the other hand, the share of pre-primary teachers with at least some
formal training rose from 70% to 82% during those years. Moreover, the
2000s were characterized by a decline in the quality of primary education,
as indicated by an increasing student-teacher ratio, a decreasing share of
trained teachers, and decreased government spending per student.5
5These figures were retrieved from the World Development Indicators(https://data.worldbank.org) on June 27, 2019. No data on the share of pre-primary teachers with formal training are available for OECD countries. No separatedata on spending on pre-primary education are available. In primary school, thestudent-teacher ratio increased from 40 in 2004 to 57 in 2012, the share of trainedteachers decreased from 99% in 2003 to 97% in 2009, and government expenditure perprimary student decreased from 21% in 2001 to 10% in 2012 (years chosen for dataavailability). In the 2010s, the student-teacher ratio started decreasing and spendingstarted increasing again, but as will become clear below, the children in our samplewere in primary school mostly during the 2000s.
5

We end our discussion of the institutional context in Kenya by present-
ing some stylized facts on enrollment.6 First, pre-primary education has
expanded substantially over the last few decades, with 83% of the 2004 co-
hort attending preschool. Observers ascribe this increased enrollment both
to a series of government efforts to increase preschool availability and qual-
ity (e.g. by training preschool teachers), and to increased demand due to
more mothers entering the workforce (Nganga, 2009; Ngware et al., 2016).
Second, late enrollment in primary school is common: for example, in 2013,
14% of 7-year-olds were not yet enrolled in primary school, with the vast
majority still attending preschool. A key reason for this is that enrollment
in pre-primary education is often late itself, and parents prefer their chil-
dren to complete preschool before proceeding to primary school (Bidwell,
Parry, and Watine, 2013). Third, while school enrollment is high compared
to other countries in Sub-Saharan Africa, some dropout occurs, with 5% of
13-year-olds reporting not to be enrolled in school in 2013.
2.2. Education and preschools in Tanzania
Basic education in Tanzania consists of two years of preschool, seven
years of primary school, four years of lower (‘ordinary’) secondary school,
and two years of upper (‘advanced’) secondary school.7 Children can enter
non-compulsory pre-primary education at age 5 and are supposed to start
primary school in the year after they turn 7, but this rule is not strictly
enforced in practice. At the end of grade 7, they take a school leaving
exam which regulates access to public secondary schools. Tuition fees for
primary education were abolished in 2002, but secondary schools still levied
fees during our study period.
Preschools in Tanzania are predominantly public: in 2016, 95% of
preschool students were enrolled in a government-run institution (Presi-
6All enrollment statistics in this section are based on data from the nationally rep-resentative Uwezo surveys, which we describe in detail in the next section. For thepreschool figures, we focus on cohorts who were at least 10 years old in our data in orderto account for the frequent late enrollment. For dropout rates, we focus on 13-year-olds,who have typically not completed primary school yet in either country. When report-ing statistics for individual years, we choose 2013 as this is the latest year in whichnation-wide Uwezo surveys were conducted in both Kenya and Tanzania.
7The following description of the preschool and school systems in Tanzania drawson Kweka, Binagi, and Kainamula (1997) and Mtahabwa and Rao (2010).
6
dent’s Office of the United Republic of Tanzania, 2016). These are often
attached to a primary school and charge varying tuition fees. Unlike in
Kenya, the Tanzanian government has adopted an official preschool cur-
riculum, which emphasizes the development of both cognitive and socio-
emotional skills. In practice, however, preschool teachers often have little
or no knowledge of the official curriculum and tend to focus on formal
instruction in basic literacy and numeracy (Mligo, 2016).
The quality of education in Tanzanian preschools is usually described
as being low (e.g. Kweka, Binagi, and Kainamula, 1997; Mtahabwa and
Rao, 2010). Student-teacher ratios are high and have increased from 54
to 77 between 2004 and 2014. This reflects a shortage of teachers, due
to which pre-primary students are sometimes taught together with older,
primary school students in multi-grade classrooms (Mghasse and William,
2016). Countering this trend, the share of preschool teachers with formal
training increased from 18% to 36% during the same period. Finally, unlike
in Kenya, primary school quality as measured by the student-teacher ratio,
the share of trained teachers, and government spending per student appears
to have stayed roughly constant during the 2000s and early 2010s.8
Like for Kenya, we now present some stylized facts on enrollment. First,
there has been an expansion of pre-primary education in Tanzania, with
the attendance rate rising from 61% for the 1995 cohort to 69% for the
2004 cohort. This rise is spurred by the Tanzanian government, whose
expansion strategy has been to attach pre-primary classrooms to existing
primary schools (Kweka, Binagi, and Kainamula, 1997; Mtahabwa and Rao,
2010).9 Second, children frequently enroll in primary school late, and some
never enroll at all: in 2013, for example, 9% of 8-year-olds reported to be
enrolled neither in school nor in preschool. Third, dropout during primary
school is common, with 12% of 13-year-olds not enrolled in school in 2013.
8See footnote 5 for details on the sources of these figures.9In particular, the Tanzanian government’s 1995 Education and Training Policy
mandated primary schools to establish pre-primary classes in partnership with localcommunities, with the Ministry of Education and Culture developing the pre-primarycurriculum and facilitating teacher training (Mtahabwa and Rao, 2010). While localobservers seem to agree that this policy has boosted the expansion of the pre-primarysector, to our knowledge no data exist on the actual number of classrooms formed orteachers trained.
7

3. Data
3.1. The Uwezo surveys
The Uwezo initiative has been conducting large-scale assessments of
school-age children’s literacy and numeracy skills in Kenya, Tanzania, and
Uganda since 2009, with more than 1.3 million children tested until 2014.
The assessments are administered as part of repeated cross-sectional house-
hold surveys, which are representative at the district level. An important
advantage of this design is that skills are measured also for children who are
currently not enrolled in school. The surveys collect information from chil-
dren aged 6-16 (7-16 in Tanzania) on their current enrollment and highest
grade attended as well as on a variety of child and household character-
istics. Crucially for our purposes, in recent waves respondents were also
asked whether they ever attended preschool.
The literacy and numeracy assessments measure core competencies that
children should have learned after two years of schooling according to the
national curriculum. Literacy tests given in both English and Swahili assess
the following four competencies in order of rising difficulty: (1) recognition
of letters, (2) recognition of words, (3) reading a paragraph, and (4) read-
ing a short story. Numeracy tests measure the following six competencies
in order of rising difficulty: (1) counting (the number of objects on a show
card), (2) recognition of numbers, (3) rank ordering of numbers, (4) ad-
dition, (5) subtraction, and (6) multiplication. A student’s score on each
test equals the highest competency level achieved, with a zero indicating
that she did not even master the simplest skill assessed. Previous analyses
of Uwezo data have shown that even many higher-grade students do not
master these second-grade competencies (Jones et al., 2014; Uwezo, 2015).
3.2. Variable definitions
The key explanatory variable in our regressions is an indicator for
whether or not a child has attended preschool.10 In the 2013 and 2014
waves of the Uwezo surveys, we additionally observe for how many years
10In the 2011 and 2012 waves, the indicator measures attendance of preschool ornursery, which includes less education-focused child care institutions. Our results arerobust to excluding these waves from the sample. See Online Appendix A for an overviewof the exact questions on preschool attendance asked in each country and wave.
8

each child attended preschool, and we use this information below to esti-
mate effects at the intensive margin. Note that the data on preschool at-
tendance are based on retrospectively reported information. This has the
major advantage that we can estimate longer-term impacts by relating past
enrollment to current outcomes. However, it comes with the drawback that
we do not observe any information on the nature or quality of the preschool
attended, which limits the analysis of potential mechanisms underlying our
findings. Another concern with retrospectively recorded information is the
possibility of recall error; specifically, if such recall error systematically
depends on preschool attendance, this could bias our estimates (Garces,
Thomas, and Currie, 2002). We therefore show in a robustness check that
systematic recall error is unlikely to drive our results.
Our main analysis focuses on two outcomes. First, we study the highest
school grade attended. We observe this variable both for children who are
currently enrolled in school and for those who dropped out, with children
who are still in preschool coded as having zero grades attended.11 Because
all our regressions include age dummies, this outcome is best interpreted
as a measure of school progression. Second, we construct a composite test
score as follows: we first standardize the English, Swahili, and numeracy
scores by country, Uwezo survey wave, and age to have mean zero and
standard deviation one; we then average these scores for each student and
standardize the resulting composite test score again. Finally, in auxiliary
analysis, we examine the effects of preschool attendance on indicators for
current school enrollment and the possession of second-grade skills, as de-
fined by achieving the highest competency level in the numeracy test and
at least one of the two literacy tests.
The control variables include a variety of socio-demographic character-
istics, such as age and gender, mother’s education, and an index of current
household wealth. Moreover, we construct two measures of early-life eco-
nomic conditions at the district level from external data sources. The
11A previous version of this paper (Bietenbeck, Ericsson, and Wamalwa, 2017) re-ported results for the highest grade completed rather than the highest grade attended.The main advantage of focusing on the highest grade attended is that it allows us todistinguish between first graders and children who are still in preschool, both of whichhave zero grades completed. Results for both outcomes are qualitatively similar.
9

first measure is the log of average night light density, which is a proxy for
economic activity (Henderson, Storeygard, and Weil, 2012). The second
measure consists of two separate dummies for positive and negative rain-
fall shocks, defined as rainfall above the 80th percentile and below the 20th
percentile of the long-term district mean. Rainfall shocks have been used
widely as a measure of income shocks in rural economies; see Shah and
Steinberg (2017) for a recent example. We allow for differential impacts
of economic conditions at different ages by computing our two measures
separately at each age between zero and the official school entry age for
each child. We provide many more details on the construction of these and
all other variables used in the empirical analysis in Online Appendix A.
3.3. Sample selection and descriptive statistics
We use data from all available waves of the Uwezo surveys with infor-
mation on preschool attendance. These are the 2013 and 2014 waves in
Kenya and the four waves conducted between 2011 and 2014 in Tanzania.
In Uganda, the only nationally representative Uwezo survey which asked
about preschool attendance was conducted in 2013. Unfortunately, this
key information is missing for 49% of children in the data for this wave,
which led us to exclude Uganda from the analysis (preschool attendance is
observed for all children in Kenya and Tanzania). We restrict our atten-
tion to children aged 7 and above in Kenya and 8 and above in Tanzania
because some younger children were still of preschool age at the time of
the survey. In order to ensure that we focus on comparable siblings in our
within-household analysis, we also drop any children who report never to
have enrolled in preschool or school. After these restrictions, our final sam-
ple includes 517,096 children across both countries, of whom 38,685 have a
sibling with different preschool status.
Table 1 reports summary statistics for key variables separately for each
country. Almost a fifth of children have mothers without any formal ed-
ucation, and more than two thirds live in rural areas. In Kenya, 85% of
children attended preschool for an average length of 2.1 years, with the
corresponding figures for Tanzania being 62% and 1.3 years. The vast ma-
jority are currently enrolled in education, a statistic that is partly due to
our focus on children who ever enrolled in preschool or school. On av-
10

erage, they have attended about four and half grades, but only 58% in
Kenya and 43% in Tanzania possess second-grade skills. Finally, Appendix
Table 1 presents enrollment statistics and outcome means separately by
age. As shown there, children tend to be behind grade for age, with a non-
negligible share of the younger school-age children still attending preschool.
This finding will be important for the interpretation of our results below.
4. Empirical strategy
The main challenge in identifying the causal effects of preschool at-
tendance on later outcomes is that selection into pre-primary education
is likely non-random. For example, more educated parents may have a
stronger preference for preschool education while also fostering their chil-
dren’s learning in other ways. In this case, any regression that does not
control for this selection would yield estimates that are biased upward. To
address this challenge, we follow a strand of previous literature (Currie and
Thomas, 1995; Garces, Thomas, and Currie, 2002; Berlinski, Galiani, and
Manacorda, 2008; Deming, 2009) and estimate models with household fixed
effects, thus holding constant all determinants of preschool attendance and
outcomes that do not vary between siblings. Our main OLS specification
reads:
Yij =α + β1PREij × Age Group7−9ij + β2PREij × Age Group10−12ij
+ β3PREij × Age Group13−16ij + AGE′ijγ + X′ijθ + ηj + εij.(1)
Here, i denotes individuals and j denotes households, Yij is the highest
grade attended or the composite test score, PREij is the indicator for
preschool attendance, and AGEij is a vector of individual age dummies.
Xij is a vector of controls that includes dummies for birth order and gender
and their interactions, dummies for cohort and their interactions with the
individual age dummies, and the proxies for early-life economic conditions
described above.12 We allow for dynamic impacts of preschool attendance
12In alternative specifications which do not include household fixed effects, we alsocontrol for the other socio-demographic characteristics shown in Table 1.
11

by interacting PREij with three age group indicators: Age Group7−9ij for
ages 7-9, Age Group10−12ij for ages 10-12, andAge Group13−16ij for ages 13-16.
Because these age groups encompass all individuals in our sample, β1, β2,
and β3 identify the main effect of preschool attendance for each age group
(further below, we also report results from specifications in which PREij
is interacted with the ten individual age dummies in AGEij instead). We
weight all of our regressions using the sampling weights provided with the
Uwezo data, and cluster standard errors at the district level.
The main parameters of interest in equation 1 are β1, β2, and β3. They
identify the age-group specific causal effect of preschool attendance under
the assumption that among siblings, selection into preschool is uncorre-
lated with any other determinants of the outcome.13 While comparatively
weak, this assumption might be violated for several reasons, two of which
are particularly salient. First, given that pre-primary education is costly,
household income shocks around preschool age may be driving siblings’ dif-
ferential enrollment. Because such income shocks can influence children’s
educational success also in other ways (e.g. Shah and Steinberg, 2017),
this could introduce bias into our estimates. We address this concern by
including detailed district-level controls for early-life economic conditions
in our regressions. Second, households with limited resources may choose
to invest only in children with the “highest potential.”14 In this case, we
would expect children who attended preschool to differentially benefit also
from other investments such as private tutoring. However, in a robustness
check below, we find no evidence of such behavior.
Which factors drive the between-sibling variation in preschool atten-
dance in our data if not income shocks and differential investments based
on relative “potential?” We investigate this question in Table 2, which
reports results of regressions of the indicator for preschool attendance on
13Note that in equation 1, children without siblings with different preschool status donot contribute to the identification of β1, β2, and β3. We nevertheless keep these childrenin our sample as this increases the precision of our estimates. In a robustness checkbelow, we show that results are qualitatively and quantitatively similar when focusingon the restricted sample of households with within variation in preschool attendance.
14Such reinforcing behavior has been found in several previous studies on developingcountries, see Almond and Mazumder (2013). Alternatively, compensatory behaviormight lead to negative selection into preschool, biasing our estimates downward.
12

the control variables. Columns 1 and 3 show estimates from a specification
without household fixed effects for Kenya and Tanzania, respectively. In
both countries, children of educated mothers and from wealthier households
are more likely to have attended preschool, underlining the importance of
controlling for between-family differences. Columns 2 and 4 show that
once household fixed effects are included in the regressions, most of the
factors that still vary between siblings are no longer predictive of preschool
attendance, including the proxies for early-life economic conditions.15
The lower part of Table 2 reports the coefficients on the cohort dummies.
There is a marked and nearly monotonic trend in both countries, with
later cohorts being significantly more likely to have attended preschool.
This trend is especially pronounced in Tanzania, where the attendance
rate was much lower than in Kenya at baseline (see Section 2) and where
it increased by 15 percentage points over the twelve cohorts in our sample.
Our interpretation of these estimates is that the expansion of pre-primary
education during our study period led to differences in preschool availability
between siblings, which in turn are driving the differences in attendance.
As long as these changes in availability are unrelated to changes in other
determinants of educational outcomes, this implies that we identify the
true causal effects of preschool attendance in the analysis below.16
5. Results
We now present our main results. The following subsection reports
estimates of the effect of preschool attendance on school progression, and
the second subsection reports the corresponding impacts on literacy and
numeracy skills. We then present results from regressions that probe for
heterogeneity of these effects by children and household characteristics.
15To avoid cluttering, rather than separate dummies for early-life economic condi-tions at each age, specifications in Table 2 simply include the number of positive andnegative rainfall shocks and the average log night lights before school entry. Results arequalitatively similar if we include the full set of controls instead; in particular, early-lifeeconomic conditions appear to be largely orthogonal to preschool attendance. Notably,this is not due to poor measurement, as these variables are highly predictive of children’sliteracy and numeracy skills (results available upon request).
16Ideally, we would like to further investigate this hypothesis using data on preschoolopenings by district and year. Unfortunately, however, such data do not appear to exist.
13

After that, we present evidence on a potential mechanism and compare
our findings to the results from the previous literature.
5.1. Effects of preschool attendance on school progression
Table 3 shows estimates of the effect of preschool attendance on the
highest grade of school attended. Column 1 reports results from parsimo-
nious specifications which only control for age dummies, their interaction
with cohort dummies, and district fixed effects. Due to the frequent late
enrollment in pre-primary and subsequently primary education, children
who went to preschool initially have attended fewer grades than their peers
who directly entered primary school. However, these children also progress
through grades at a faster pace and eventually overtake their peers: at ages
13-16, they have attended 0.18 more grades in Kenya and 0.31 more grades
in Tanzania. Columns 2-4 successively add controls for socio-demographic
characteristics, early-life economic conditions, and household fixed effects
to the regressions. Consistent with the idea of positive selection into pre-
primary education, this tends to reduce the coefficients: from our preferred
specification in column 4, children who went to preschool are now estimated
to accumulate the same number of grades in Kenya and about 0.1 more
grades in Tanzania by ages 13-16.17
An interesting question is whether children who went to preschool catch
up with their peers in terms of grades completed because they skip more
or repeat fewer grades while in school, or because they are less likely to
drop out of school. To investigate this issue, column 5 of Table 3 presents
estimates of the effect of preschool attendance on current enrollment based
17Besides household fixed effects accounting for selection on unobserved factors, thereare at least three further potential explanations for the reduction of coefficients betweencolumns 3 and 4. First, attenuation bias due to measurement error in attendance isaggravated in the between-sibling specification, an issue that we discuss in detail below.Second, the inclusion of household fixed effects nets out any positive sibling spillovers.Third, the effects in column 4 are identified only from households with within variation,which might differ from those in the full sample. Investigating this last possibility,we found that households with both attending and non-attending children were larger,poorer, and more likely to be located in a rural area. However, when we restricted thesample to these households only, the inclusion of household fixed effects similarly led to adecline in the estimated long-term benefits of preschool. This suggests that identificationbased on a different sample is not driving the change in coefficients between columns 3and 4 of Table 3.
14

on our preferred specification with household fixed effects. The results
indicate that children who went to preschool are indeed more likely to be
enrolled, especially at higher ages and in Tanzania. Thus, lower dropout
is at least partly underlying the catch-up observed in column 4.18 Finally,
Figure 1 plots estimates from regressions of the highest grade completed
and enrollment status in which the effect of preschool attendance is allowed
to differ at each age, rather than across age groups. The plots show that
the impacts of attendance on these outcomes rise almost monotonically
with age, confirming the results from Table 3.
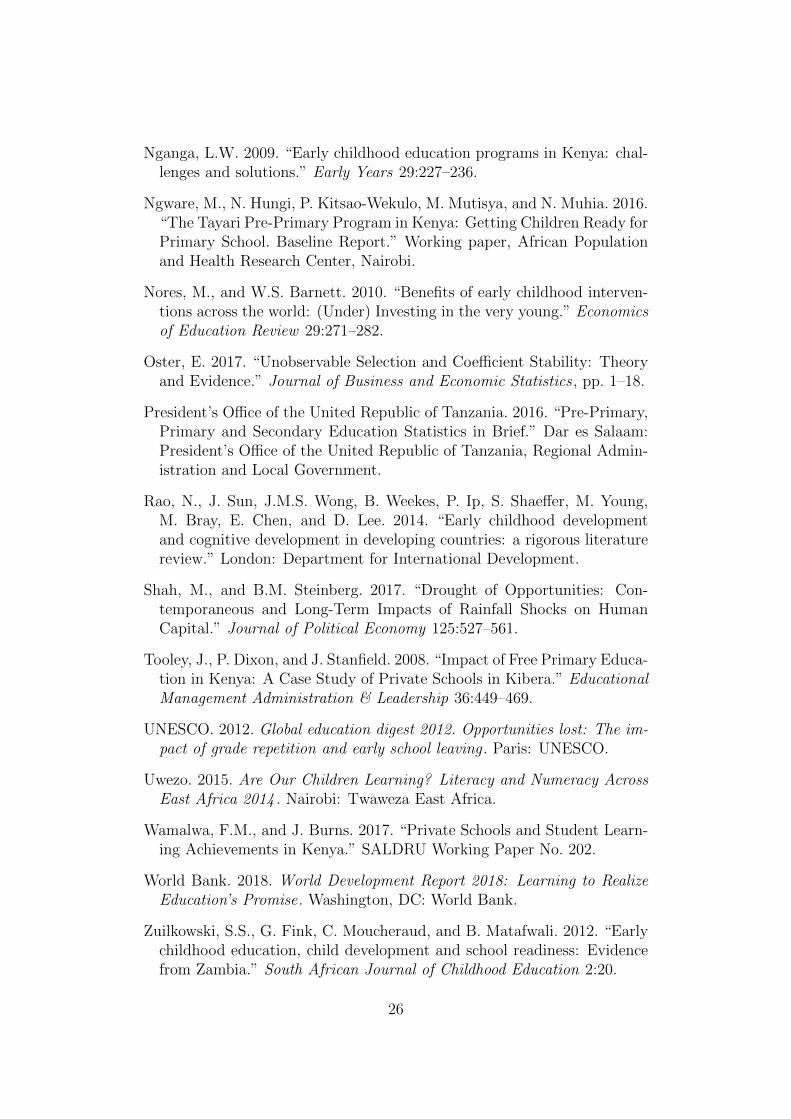
5.2. Effects of preschool attendance on literacy and numeracy skills
Table 4 reports estimates of the effect of preschool attendance on chil-
dren’s literacy and numeracy skills. Column 1 shows results from a specifi-
cation with only basic controls and the composite test score as outcome. In
Kenya, children who went to preschool have slightly higher scores than their
peers at early ages, and this advantage grows to 0.1 SD for the two older
age groups. In contrast, in Tanzania, children with pre-primary education
outperform their peers by 0.26 SD already early on, but this difference
decreases to 0.22 SD for the group of 13-16-year-olds. Columns 2-4 succes-
sively add control variables and household fixed effects to these regressions.
Similar to the pattern found for the highest grade attended, this substan-
tially reduces the size of the estimates for Tanzania, where the impact for
the oldest age group is now estimated at 0.08 SD. In contrast, the coeffi-
cients for Kenya are relatively stable across specifications, suggesting that
there is little selection into preschool based on academic ability.
Column 5 presents results for a specification with the dummy for pos-
sessing second-grade literacy and numeracy skills as dependent variable.
In both countries, the effect for the youngest age group is close to zero.
This should come as no surprise because preschools are unlikely to teach
18Unfortunately, the Uwezo data do not contain information on school starting ageand grade repetition, which prevents us from fully disentangling the mechanisms behindthis catch-up. In column 5 of Table 3, note that for the younger two age groups,enrollment rates are very high and the predicted probabilities from the linear probabilitymodel sometimes exceed 100 percent. Addressing this issue, we confirmed that probitmodels and a simple comparison of means also suggest that children who attendedpreschool are more likely to be currently enrolled in school.
15
children such advanced skills, and because attendance actually leads to a
reduction in grades completed at these ages (see Table 3). Note that this
finding implies that the positive impact on test scores for young children in
Tanzania in column 4 must be due to pre-primary education boosting their
very basic literacy and numeracy skills. Mirroring the long-term gains on
the composite test score, the estimates for 13-16-year-olds show a 3.2 (4.7)
percentage point increase in the likelihood to achieve second-grade skills in
Kenya (Tanzania), which corresponds to a sizable 4 (7) percent over the
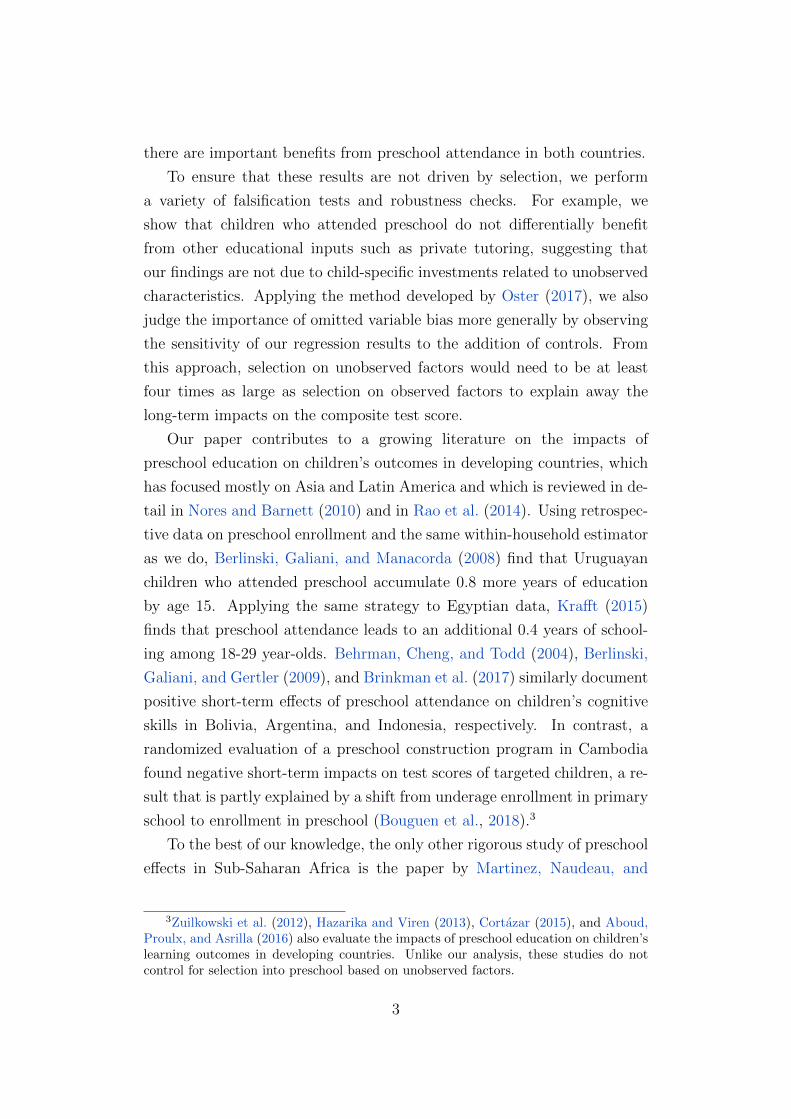
mean. Finally, Figure 2 shows age-by-age impacts on test scores and the
dummy for basic skills which confirm the patterns observed in Table 4.
5.3. Heterogeneity
In Table 5, we explore the heterogeneity of the preschool impacts along
several dimensions. Columns 1-3 report estimates from specifications that
allow the effects to differ by length of attendance. The results reveal that
children who went to preschool for two or three years tend to have attended
fewer school grades than those who went for only one year, likely because
they entered primary school later. This difference shrinks over time, how-
ever, suggesting that children with more years of preschool progress through
grades at a faster pace. The impacts on the composite test score similarly
tend to be less positive for children with several years of pre-primary ed-
ucation, at least in Kenya. This could be due to the fact that they are
further behind in school, or due to negative selection at the intensive mar-
gin, with parents keeping children with lower academic ability in preschool
for longer. Moreover, the fact that children of different ages are often
taught together in preschool implies that attending for more years does
not necessarily mean learning higher-level skills, a reality that might also
contribute to the lack of a positive effect at the intensive margin.
Columns 4-5 show that in both countries, the effects of preschool atten-
dance are consistently more positive for girls, even though the differences
are not always statistically significant at conventional levels. Furthermore,
columns 6-7 reveal that the improvements in literacy and numeracy skills
among 13- to 16-year-olds tend to be larger for those with uneducated
mothers: in Tanzania, for example, preschool attendance raises the com-
posite test score for these children by 0.14 SD, compared to 0.06 SD for
16

children with mothers who have at least some formal education. Finally,
columns 8-9 show that in Tanzania only, longer-term gains in the number
of grades attended and test scores are substantially larger in more urban,
high-economic-activity areas, as proxied by living in a district with night
light density above the 85th percentile of the national distribution.
5.4. “Head start” as a potential mechanism
An interesting open question is how exactly preschools improve learning
outcomes for attending children. One obvious explanation is that with their
focus on teaching basic literacy and numeracy, preschools give children
a head start that makes it easier for them to follow the primary school
curriculum. An implication of this explanation is that these students should
have higher skills already at school start. To what extent this is indeed
the case is not immediately obvious from our results above, which are
based on same-age comparisons that blend the potential effect of a skill
boost from preschool attendance with any effect on learning due to later
school entry and lower grade attainment. In order to disentangle these
two channels, one would ideally want to compare children who differ in
terms of their preschool attendance but who started school at the same
time. Unfortunately, such a comparison is not feasible here because school
starting age is not observed in the Uwezo data.
As an alternative way to separate the test score impacts due to learning
in preschool from the impacts due to later school entry, Table 6 reports
results from specifications that control for the highest grade attended. If
children do indeed get a head start from attending preschool, we would
expect the coefficients in these regressions to increase compared to our
main results, especially for the youngest children who are furthest behind
in school. This turns out to be the case: for example, the effect for 7- to 9-
year-olds in Kenya is now estimated to be 0.16 SD, compared to only 0.04
SD when their lower grade attainment is not taken into account. Thus,
these results suggest that preschools do in fact give children a head start
in the learning of literacy and numeracy skills, and that this might drive
the long-term improvements in learning outcomes.
17

5.5. Comparison with results from previous studies
We now compare our results to the previous literature on preschool
effectiveness in developing countries. Focusing first on schooling, our esti-
mates are qualitatively similar to those by Berlinski, Galiani, and Mana-
corda (2008) for Uruguay. Like us, the authors find that children who go
to preschool initially fall behind in terms of grades attended but that they
progress through school faster later on, leading to an increase in educational
attainment by 0.8 years of schooling at age 15. For Egypt, Krafft (2015)
similarly shows that children with pre-primary education accumulate 0.4
more years of schooling by ages 18-29. Unlike her, we do not observe final
educational attainment, which may explain our smaller estimates at ages
13-16. However, the monotonic positive trend in the impact on grades at-
tended in Figure 2 suggests that children who attended preschool might
eventually acquire more years of schooling also in Kenya and Tanzania.
Turning to cognitive skills, Berlinski, Galiani, and Gertler (2009) find
that in Argentina, preschool attendance increases third-grade students’
math and language test scores by 0.23 SD. For Indonesia, Brinkman et al.
(2017) similarly show that three years after the establishment of early child-
hood services, children from poor households improved by 0.20 SD on an
index of language and cognitive development.19 One potential reason why
our estimates are smaller is the presence of ceiling effects: as discussed
in Section 3, the Uwezo assessments measure second-grade skills, and al-
though most children in our sample do not reach the highest competency
levels on the tests, a non-negligible fraction of the older children in partic-
ular does (see Appendix Table 1). As ceiling effects lead to an attenuation
of regression estimates, this could explain our lower point estimates com-
pared to the previous literature, as well as the slight fade-out of the effects
on cognitive skills visible for the older age groups in Figure 2.
Finally, a recent study by Bouguen et al. (2018) shows that in Cam-
bodia, 6-year-old children scored 0.19 SD lower on an index of cognitive
development one year after preschools were constructed in their villages.
19Behrman, Cheng, and Todd (2004) and Martinez, Naudeau, and Pereira (2013)also document positive effects on measures of child development that include cognitiveskills, but these are difficult to compare directly to our outcomes.
18

Investigating potential channels, the authors find that preschool construc-
tion led to a shift from early enrollment in primary school to enrollment
in preschool, suggesting that the decrease in cognitive skills was partly
due to the lower emphasis on literacy and numeracy skills in the preschool
curriculum.20 Interpreted in the light of our results, this shift in enroll-
ment led to a decrease in grades attended early on. While Bouguen et al.
(2018) cannot investigate the longer term consequences of this change, our
estimates reveal that despite low or negative initial returns, children who
attend preschool can catch up in terms of grades attended and strongly
benefit in terms of learning later on. These longer-run estimates on cogni-
tive skills in particular are a key contribution of our paper over the previous
literature, which has only been able to study short-run effects.
6. Robustness
6.1. Addressing selection concerns
In Section 3 above, we argue that the between-sibling variation in
preschool attendance is likely due to changes in availability, which came
about because of the expansion of the pre-primary sector during our study
period. One might worry, however, that this variation instead reflects child-
specific investments that are correlated with unobservables. As an example,
households with limited resources may choose to invest only in children with
the “highest potential.” If this is indeed the case, one would expect that
families differentially spend on children who are sent to preschool also in
other ways. We test this hypothesis in a falsification exercise by examining
whether children who attended preschool are more likely to benefit from
two other costly educational inputs observed in our data: private after-
school tutoring and enrollment in private school.21 Table 7 shows that
20Also in our setting, early enrollment in primary school might be part of the coun-terfactual. However, whereas Bouguen et al. (2018) report that 60 percent of childrenin control villages attended primary school in the year before they reached the officialschool starting age, only 26 percent of 5-year-olds in the 1999 Kenyan census and 8percent of 6-year-olds in the 2002 Tanzanian census did so. Note also that respondentsin the Uwezo surveys answer separate questions about current and past preschool at-tendance and current and past school attendance, allowing us to separate the impactsof preschool attendance from those of early enrollment in primary school.
21See Wamalwa and Burns (2017) for an analysis of private school effectiveness inKenya using the Uwezo survey data.
19

in regressions of indicators for receiving these inputs, the coefficients on
preschool attendance are close to zero and precisely estimated. Although
these are just two out of many ways in which parents invest in their chil-
dren, these estimates thus suggest that differential investments based on
child unobservables are not driving our main results.
To judge the importance of selection bias more generally, we next ask
how large such bias would need to be in order to explain away our main ef-
fects. Our analysis builds on the approach presented in Oster (2017), which
relies on comparing the coefficients of interest and the R-squared between
regressions with and without control variables to gain insights into the in-
fluence of omitted variables. Here, we focus on the calculation of δ, which
is the ratio of the impact of unobservables to the impact of observable
controls that would drive the coefficient on the treatment variable to zero.
As a point of reference, Oster (2017) suggests that effects for which δ > 1
can be considered robust. Applying this method to our case, we contrast
estimates of the impact of preschool attendance from a specification with
only basic controls (as in column 1 of Tables 3 and 4) with those from our
preferred specification with household fixed effects. We restrict our sam-
ple to households with variation in preschool attendance for this analysis
because for all other households, the fixed effects fully explain preschool
attendance, leaving no role for selection on unobservables.22
Table 8 reports the results from this exercise. Columns 1 and 3 show
estimates from specifications with only basic controls, with regressions un-
derlying columns 2 and 4 adding further controls and household fixed ef-
fects. As would be expected, the estimates from our preferred specification
are generally very similar in the restricted sample compared to the full
sample used in the main analysis (we test the equality of these coefficients
more formally below). Moving from the basic specification to our preferred
specification substantially increases the R-squared and tends to decrease
the coefficient estimates, in line with what is observed in Tables 3 and 4.
Based on these differences, we report the implied δ for preschool impacts
for 13- to 16-year-olds, for whom we find the most positive impacts and
where selection on unobservables is thus the most relevant concern. In three
22We thank Emily Oster for this suggestion.
20

out of four specifications, δ is greater than one, implying that selection on
unobservables would have to be greater than selection on the observed con-
trol variables to drive the preschool impacts to zero. For the case of the
composite test score, this value is even above four for both countries, which
strongly suggests that omitted variable bias is not driving these results.23
6.2. Further robustness checks
We now address a number of further potential concerns regarding our
empirical analysis. First, as discussed in Section 3, our results may be
affected by recall error in the retrospectively reported preschool variable.
Note that such recall error can lead to upward bias only if it systematically
varies between siblings who did and did not attend preschool; any general,
idiosyncratic recall error will simply drive our estimates towards zero. We
investigate this issue by taking advantage of the repeated cross-sectional
nature of our data, which lets us follow cohorts over time. Appendix Table
2 shows the fraction of children in each cohort reporting to have attended
preschool separately for each Uwezo survey wave.24 If our data were con-
taminated by recall error, we would expect these fractions to change over
time. This is not the case for the majority of cohorts, though, which sug-
gests that recall error does not bias our results.
Second, our estimates might be attenuated by measurement error in
the preschool attendance variable. Such downward bias is particularly rel-
evant in the context of sibling fixed effects models, in which the signal to
noise ratio of the measurement may be greatly reduced (Ashenfelter and
Krueger, 1994). Because of the absence of repeated individual-level infor-
mation on preschool attendance in our data, we are unable to establish the
23There is a strong mechanical relationship between highest grade attended and age,as reflected by the high values of R-squared in column 1 of Table 8. This limits theadditional explanatory power any observed controls can have in these regressions, whichpartly explains the lower values for δ in column 2 compared to column 4 of Table 8.
24For this exercise, we focus on a comparable sample of districts that were visitedin all waves of the Uwezo surveys. We disregard the 2014 wave in Tanzania becauseonly a small subsample of districts were included in that year’s survey. In the raw data,we observe level shifts in preschool attendance rates for all cohorts between some ofthe waves, likely because the question asking about preschool attendance changed. InAppendix Table 2, we therefore report regression-adjusted attendance rates after takingout wave fixed effects. Note that level shifts in preschool attendance do not influenceour within-household results, which use variation within survey waves.
21

extent of this problem conclusively. However, the strong similarity of the
aggregate, cohort-level measure over time in Appendix Table 2 suggests
that measurement error is not a major issue in our context.
Third, one might worry that our results are driven by siblings who are
very different in age, and who thus grew up under very distinct circum-
stances. For example, the impacts on cognitive skills might vary between
age groups only because different cohorts attended preschools of very dif-
ferent quality (although as discussed in Section 2, the available metrics do
not show clear trends in preschool quality over time). To address this issue,
Online Appendix Table B.1 presents estimates from regressions in which
the sample is restricted to siblings who are born at most five years apart.
As can be seen there, the results are qualitatively and quantitatively similar
to our main findings.
Finally, we conduct additional analyses that address a range of further
potential concerns. Thus, in Appendix Table 3, we compare our main
results with those obtained from a sample which is restricted to households
with within variation in preschool attendance. The sub-sample results are
qualitatively and, for the most part, quantitatively similar to the main
results, but, as expected, less precisely estimated. In Online Appendix
Figure B.1, we further document that preschool impacts on the individual
English, Swahili, and numeracy scores are very similar to the ones on the
composite test scores used in the main analysis. Our main results are also
robust to not using sampling weights, as indicated in Online Appendix
Table B.1. Lastly, Online Appendix Figure B.2 presents Kaplan-Meier
estimates as an alternative way to investigate the impacts of preschool
attendance on grade progression. These estimates are in line with our
main findings in Section 5.
7. Conclusion
Most children in Sub-Saharan Africa enroll in school nowadays, but
they learn remarkably little there. One possible reason is that they en-
ter school unprepared, which makes preschool programs that aim to get
children ready for school a promising way to improve learning outcomes.
While pre-primary education is becoming increasingly common within the
region, to date very little is known about its effectiveness.
22

In this paper, we provide some of the very first evidence of preschool
impacts on learning outcomes in Sub-Saharan African. We use data from
large-scale surveys of children’s educational attainment and cognitive skills
from Kenya and Tanzania, which also collect retrospective information on
preschool attendance. Our analysis compares the highest school grade at-
tended as well as achievement on standardized literacy and numeracy tests
of siblings who did and did not attend preschool. This strategy allows us
to control for any determinants of pre-primary enrollment and outcomes
that do not vary within households. We provide evidence that the leftover
between-sibling variation in attendance is due to changes in availability,
which came about because of a large expansion of preschool education dur-
ing our study period.
Our results show that preschool education leads to important long-
term learning benefits: at ages 13-16, children who went to preschool are
three and five percentage points more likely to achieve basic, second-grade
literacy and numeracy in Kenya and Tanzania, respectively. These gains
materialize relatively late because children who attend preschool tend to
enter primary school late and thus fall behind early on. However, the skills
learned in preschool give them a head start in school, meaning that they can
progress through grades faster and eventually catch up with their peers who
did not attend preschool in terms of grades attended. Overall, our analysis
shows that increasing access to pre-primary education can be an effective
instrument to improve learning outcomes in Sub-Saharan Africa.
References
Aboud, F.E., K. Proulx, and Z. Asrilla. 2016. “An impact evaluation ofPlan Indonesia’s early childhood program.” Canadian Journal of PublicHealth 107:e366–e372.
Almond, D., and B. Mazumder. 2013. “Fetal Origins and Parental Re-sponses.” Annual Review of Economics 5:37–56.
Ashenfelter, O., and A. Krueger. 1994. “Estimates of the economic returnto schooling from a new sample of twins.” American Economic Review84:1157–1173.
Behrman, J.R., Y. Cheng, and P.E. Todd. 2004. “Evaluating PreschoolPrograms When Length of Exposure to the Program Varies: A Non-parametric Approach.” Review of Economics and Statistics 86:108–132.
23

Berlinski, S., S. Galiani, and P. Gertler. 2009. “The effect of pre-primaryeducation on primary school performance.” Journal of Public Economics93:219–234.
Berlinski, S., S. Galiani, and M. Manacorda. 2008. “Giving children a betterstart: Preschool attendance and school-age profiles.” Journal of PublicEconomics 92:1416–1440.
Bidwell, K., K. Parry, and L. Watine. 2013. Exploring Early EducationPrograms in Peri-urban Settings in Africa: Nairobi Report . Report, In-novations for Poverty Action.
Bietenbeck, J., S. Ericsson, and F.M. Wamalwa. 2017. “Preschool Atten-dance, School Progression, and Cognitive Skills in East Africa.” IZADiscussion Paper No. 11212.
Bietenbeck, J., M. Piopiunik, and S. Wiederhold. 2018. “Africa’s SkillTragedy: Does Teachers’ Lack of Knowledge Lead to Low Student Per-formance?” Journal of Human Resources 53:553–578.
Bouguen, A., D. Filmer, K. Macours, and S. Naudeau. 2018. “Preschooland Parental Response in a Second Best World: Evidence from a SchoolConstruction Experiment.” Journal of Human Resources 53:474–512.
Brinkman, S.A., A. Hasan, H. Jung, A. Kinnell, and M. Pradhan. 2017.“The Impact of Expanding Access to Early Childhood Education Ser-vices in Rural Indonesia.” Journal of Labor Economics 35:S305–S335.
Cortazar, A. 2015. “Long-term effects of public early childhood educationon academic achievement in Chile.” Early Childhood Research Quarterly32:13–22.
Cunha, F., and J. Heckman. 2007. “The Technology of Skill Formation.”American Economic Review 97:31–47.
Currie, J., and D. Thomas. 1995. “Does Head Start Make a Difference?”American Economic Review 85:341–64.
Daniel, K. 2012. “Educational Behavior of Children not in Preschool. TheCase study of Machakos District, Kenya.” International Journal of Ap-plied Psychology 2:1–5.
Deming, D. 2009. “Early childhood intervention and life-cycle skill develop-ment: Evidence from Head Start.” American Economic Journal: AppliedEconomics 1:111–134.
24

Edwards Jr., D.B., S.J. Klees, and J. Wildish. 2015. “Dynamics of Low-Fee Private Schools in Kenya: Governmental Legitimation, School-Community Dependence, and Resource Uncertainty.” Teachers CollegeRecord forthcoming.
Garces, E., D. Thomas, and J. Currie. 2002. “Longer-Term Effects of HeadStart.” American Economic Review 92:999–1012.
Hazarika, G., and V. Viren. 2013. “The effect of early childhood develop-mental program attendance on future school enrollment in rural NorthIndia.” Economics of Education Review 34:146–161.
Henderson, J.V., A. Storeygard, and D. Weil. 2012. “Measuring EconomicGrowth from Outer Space.” American Economic Review 102:944–1028.
Heyneman, S.P., and J.M. Stern. 2014. “Low cost private schools for thepoor: What public policy is appropriate?” International Journal of Ed-ucational Development 35:3 – 15.
Jones, S., Y. Schipper, S. Ruto, and R. Rajani. 2014. “Can your child readand count? Measuring learning outcomes in East Africa.” Journal ofAfrican Economies 23:643–672.
Krafft, C. 2015. “Increasing educational attainment in Egypt: The impactof early childhood care and education.” Economics of Education Review46:127–143.
Kweka, A., E. Binagi, and V. Kainamula. 1997. “The situation of earlychildhood education in Tanzania: the case of Temeke District. A draftreport prepared for UNESCO Dar es Salaam.” Working paper, UNESCOOffice Dar es Salaam.
Martinez, S., S. Naudeau, and V. Pereira. 2013. “The Promise of Preschoolin Africa: A Randomized Impact Evaluation of Early Childhood Devel-opment in Rural Mozambique.” Working paper.
Mghasse, N.E., and F. William. 2016. “Practices and Challenges in the Pro-vision of Pre-Primary Education in Tanzania.” African Research Review10:1–16.
Mligo, I.R. 2016. “Teachers’ perceptions and concerns about the imple-mentation of the 2005 preschool curriculum in Tanzania.” Early Years36:353–367.
Mtahabwa, L., and N. Rao. 2010. “Pre-primary education in Tanzania:Observations from urban and rural classrooms.” International Journalof Educational Development 30:227–235.
25
Nganga, L.W. 2009. “Early childhood education programs in Kenya: chal-lenges and solutions.” Early Years 29:227–236.
Ngware, M., N. Hungi, P. Kitsao-Wekulo, M. Mutisya, and N. Muhia. 2016.“The Tayari Pre-Primary Program in Kenya: Getting Children Ready forPrimary School. Baseline Report.” Working paper, African Populationand Health Research Center, Nairobi.
Nores, M., and W.S. Barnett. 2010. “Benefits of early childhood interven-tions across the world: (Under) Investing in the very young.” Economicsof Education Review 29:271–282.
Oster, E. 2017. “Unobservable Selection and Coefficient Stability: Theoryand Evidence.” Journal of Business and Economic Statistics , pp. 1–18.
President’s Office of the United Republic of Tanzania. 2016. “Pre-Primary,Primary and Secondary Education Statistics in Brief.” Dar es Salaam:President’s Office of the United Republic of Tanzania, Regional Admin-istration and Local Government.
Rao, N., J. Sun, J.M.S. Wong, B. Weekes, P. Ip, S. Shaeffer, M. Young,M. Bray, E. Chen, and D. Lee. 2014. “Early childhood developmentand cognitive development in developing countries: a rigorous literaturereview.” London: Department for International Development.
Shah, M., and B.M. Steinberg. 2017. “Drought of Opportunities: Con-temporaneous and Long-Term Impacts of Rainfall Shocks on HumanCapital.” Journal of Political Economy 125:527–561.
Tooley, J., P. Dixon, and J. Stanfield. 2008. “Impact of Free Primary Educa-tion in Kenya: A Case Study of Private Schools in Kibera.” EducationalManagement Administration & Leadership 36:449–469.
UNESCO. 2012. Global education digest 2012. Opportunities lost: The im-pact of grade repetition and early school leaving . Paris: UNESCO.
Uwezo. 2015. Are Our Children Learning? Literacy and Numeracy AcrossEast Africa 2014 . Nairobi: Twaweza East Africa.
Wamalwa, F.M., and J. Burns. 2017. “Private Schools and Student Learn-ing Achievements in Kenya.” SALDRU Working Paper No. 202.
World Bank. 2018. World Development Report 2018: Learning to RealizeEducation’s Promise. Washington, DC: World Bank.
Zuilkowski, S.S., G. Fink, C. Moucheraud, and B. Matafwali. 2012. “Earlychildhood education, child development and school readiness: Evidencefrom Zambia.” South African Journal of Childhood Education 2:20.
26

Figure 1
E�ects of preschool attendance on highest grade attended and school enrollment, by age
-.4-.2
0.2
Coe
ffic
ient
(95%
CI)
7 8 9 10 11 12 13 14 15 16
Age
Highest grade attended
0.0
2.0
4
Coe
ffic
ient
(95%
CI)
7 8 9 10 11 12 13 14 15 16
Age
Currently enrolled
Panel A: Kenya
-.20
.2.4
Coe
ffic
ient
(95%
CI)
7 8 9 10 11 12 13 14 15 16
Age
Highest grade attended
0.0
3.0
6.0
9.1
2
Coe
ffic
ient
(95%
CI)
7 8 9 10 11 12 13 14 15 16
Age
Currently enrolled
Panel B: Tanzania
Notes: The �gure plots coe�cient estimates and 95% con�dence intervals from regressions of highest grade attended andan indicator for current enrollment on preschool attendance. The indicator for preschool attendance is interacted witha full set of age dummies, and the �gure shows the main e�ect of preschool attendance at each age. Speci�cations areotherwise equal to the household �xed e�ects regressions reported in columns 4 and 5 of Table 3.

Figure 2
E�ects of preschool attendance on literacy and numeracy skills, by age
-.10
.1.2
Coe
ffic
ient
(95%
CI)
7 8 9 10 11 12 13 14 15 16
Age
Composite test score
-.05
0.0
5.1
Coe
ffic
ient
(95%
CI)
7 8 9 10 11 12 13 14 15 16
Age
Has 2nd-grade literacy and numeracy skills
Panel A: Kenya
-.10
.1.2
Coe
ffic
ient
(95%
CI)
7 8 9 10 11 12 13 14 15 16
Age
Composite test score
-.05
0.0
5.1
Coe
ffic
ient
(95%
CI)
7 8 9 10 11 12 13 14 15 16
Age
Has 2nd-grade literacy and numeracy skills
Panel B: Tanzania
Notes: The �gure plots coe�cient estimates and 95% con�dence intervals from regressions of the composite test score andan indicator for having second-grade literacy and numeracy skills on preschool attendance. The indicator for preschoolattendance is interacted with a full set of age dummies, and the �gure shows the main e�ect of preschool attendance ateach age. Speci�cations are otherwise equal to the household �xed e�ects regressions reported in columns 4 and 5 of Table4.

Table 1
Summary statistics
Kenya Tanzania
Socio-demographic characteristics
Age 11.08 11.72(2.77) (2.46)
Female 0.49 0.50(0.50) (0.50)
Mother's education:None 0.17 0.19
(0.37) (0.39)Some primary or more 0.83 0.81
(0.37) (0.39)No. of children in household 3.09 2.47
(1.55) (1.26)Current household wealth (index) 0.00 0.00
(1.00) (1.00)Rural location 0.67 0.78
(0.47) (0.41)
Early-life economic conditions
No. of negative rainfall shocks 1.44 1.87(0.85) (0.87)
No. of positive rainfall shocks 1.10 1.27(0.79) (0.72)
Log night light density -1.44 -2.39(2.32) (2.29)
Preschool attendance
Attended preschool 0.85 0.62(0.36) (0.48)
Years of preschool |attended 2.11 1.32(1.08) (0.75)
Outcomes
Highest grade attended 4.62 4.42(2.53) (2.28)
Currently enrolled 0.99 0.94(0.10) (0.24)
Composite test score 0.00 0.00(1.00) (1.00)
Has 2nd-grade lit./num. skills 0.58 0.43(0.49) (0.49)
Observations (children):Total 223,339 293,757With within-household variation 7,532 31,153
Notes: The table reports means and standard deviations (in parentheses) of key variables separately for childrenin Kenya and Tanzania. In regressions, early-life economic conditions are proxied by district-level indicators fornegative and positive rainfall shocks and district-level log night lights at each age between 0 and 5 in Kenya (0 and6 in Tanzania); for conciseness, this table shows totals across all of these ages. Years of preschool are observed onlyin the 2013 and 2014 waves of the Uwezo survey (N=223,339 in Kenya and N=111,043 in Tanzania). Currentlyenrolled is an indicator for being currently enrolled in either preschool or school. Has 2nd-grad lit./num. skills isan indicator for achieving the highest competency level in the numeracy test and at least one of the two literacytests. The �nal row reports the number of children living in households with within variation, that is, householdsin which at least one child went to preschool and at least one child did not. Further details on the constructionof all variables are provided in Online Appendix A.

Table 2
Predicting preschool attendance
Kenya Tanzania
(1) (2) (3) (4)
Female 0.003 -0.001 0.008∗∗ 0.003(0.003) (0.002) (0.003) (0.003)
Firstborn 0.005 0.000 -0.002 0.002(0.004) (0.003) (0.005) (0.004)
Female × �rstborn -0.001 0.001 -0.004 0.000(0.004) (0.003) (0.005) (0.005)
Mother ≥ some primary edu. 0.016∗∗ 0.097∗∗∗
(0.007) (0.006)No. of children in household -0.002 -0.012∗∗∗
(0.002) (0.002)Household wealth index 0.006∗∗ 0.052∗∗∗
(0.003) (0.004)Rural location -0.000∗ -0.016
(0.000) (0.022)No. of negative rainfall shocks -0.003∗∗ -0.001 -0.007∗ -0.000
(0.001) (0.001) (0.004) (0.004)No. of positive rainfall shocks -0.004 -0.000 0.006 0.007∗
(0.002) (0.001) (0.004) (0.004)Log night light density 0.009 0.002 0.016 0.011
(0.006) (0.005) (0.016) (0.012)Cohort
1996 0.023∗∗∗ 0.021(0.008) (0.014)
1997 0.030∗∗∗ 0.035∗∗∗
(0.009) (0.011)1998 0.005 0.002 0.047∗∗∗ 0.050∗∗∗
(0.008) (0.004) (0.009) (0.013)1999 0.012∗ 0.003 0.062∗∗∗ 0.069∗∗∗
(0.007) (0.004) (0.010) (0.014)2000 0.011 0.006 0.088∗∗∗ 0.084∗∗∗
(0.007) (0.004) (0.011) (0.015)2001 0.019∗∗∗ 0.006 0.090∗∗∗ 0.086∗∗∗
(0.007) (0.005) (0.011) (0.016)2002 0.022∗∗∗ 0.008 0.098∗∗∗ 0.101∗∗∗
(0.007) (0.005) (0.011) (0.015)2003 0.026∗∗∗ 0.004 0.110∗∗∗ 0.106∗∗∗
(0.007) (0.005) (0.011) (0.016)2004 0.023∗∗ 0.007 0.113∗∗∗ 0.109∗∗∗
(0.009) (0.005) (0.012) (0.017)2005 0.033∗∗∗ 0.007 0.099∗∗∗ 0.099∗∗∗
(0.009) (0.006) (0.012) (0.017)2006 0.040∗∗∗ 0.014∗∗ 0.147∗∗∗ 0.149∗∗∗
(0.007) (0.006) (0.016) (0.023)2007 0.032∗∗∗ 0.013
(0.009) (0.009)
Household �xed e�ects No Yes No YesObservations 223,339 223,339 293,757 293,757
Notes: The table reports estimates from regressions of an indicator for preschool attendance on the variableslisted in rows and Uwezo wave dummies. Standard errors in parentheses are clustered at the district level. ∗
p<0.10, ∗∗ p<0.05, ∗∗∗ p<0.01.

Table 3
E�ects of preschool attendance on highest grade attended and school enrollment
Highest grade attended Currentlyenrolled
(1) (2) (3) (4) (5)
Panel A: Kenya
E�ect of preschoolat ages 7-9 -0.234∗∗∗ -0.252∗∗∗ -0.242∗∗∗ -0.336∗∗∗ 0.011∗
(0.040) (0.042) (0.042) (0.045) (0.005)at ages 10-12 0.017 -0.006 -0.006 -0.123∗∗∗ 0.013∗∗
(0.024) (0.023) (0.023) (0.044) (0.006)at ages 13-16 0.178∗∗∗ 0.161∗∗∗ 0.153∗∗∗ -0.023 0.018∗∗∗
(0.034) (0.034) (0.033) (0.055) (0.006)
p (equal e�ects) 0.000 0.000 0.000 0.000 0.032Observations 218,728 218,728 218,728 218,728 218,728
Panel B: Tanzania
E�ect of preschoolat ages 8-9 -0.071∗∗∗ -0.127∗∗∗ -0.115∗∗∗ -0.212∗∗∗ 0.036∗∗∗
(0.018) (0.018) (0.018) (0.025) (0.005)at ages 10-12 0.081∗∗∗ 0.028 0.031∗ -0.074∗∗∗ 0.044∗∗∗
(0.020) (0.018) (0.019) (0.025) (0.004)at ages 13-16 0.313∗∗∗ 0.258∗∗∗ 0.243∗∗∗ 0.096∗∗∗ 0.076∗∗∗
(0.026) (0.026) (0.024) (0.031) (0.006)
p (equal e�ects) 0.000 0.000 0.000 0.000 0.000Observations 284,396 284,396 284,396 284,396 284,396
Controls included in panels A and B
Age × cohort e�ects Yes Yes Yes Yes YesDistrict �xed e�ects Yes Yes Yes No NoSocio-demographics No Yes Yes Yes YesEarly-life conditions No No Yes Yes YesHousehold �xed e�ects No No No Yes Yes
Notes: The table reports estimates from regressions of highest grade attended and enrollment status on anindicator for preschool attendance and control variables as indicated in the lower panel. The indicator forpreschool attendance is interacted with an exhaustive set of three age-group dummies, such that the coe�cientsshown here re�ect the main e�ects for each age group. Socio-demographic controls include the variables shownin Table 1, dummies for birth order and gender and their interactions, dummies for cohort and their interactionswith individual age dummies, and sibling age span. Controls for early-life economic conditions include district-level indicators for negative and positive rainfall shocks and district-level log night lights at each age between0 and 5 (0 and 6 in Tanzania), all of which are interacted with a dummy for rural location. Speci�cations incolumns 1-3 additionally control for Uwezo wave dummies. The p-value reported below each set of coe�cientsis from an F -test of equal e�ects across age groups. See Appendix Table 1 for outcome means by age. Standarderrors in parentheses are clustered at the district level. ∗ p<0.10, ∗∗ p<0.05, ∗∗∗ p<0.01.
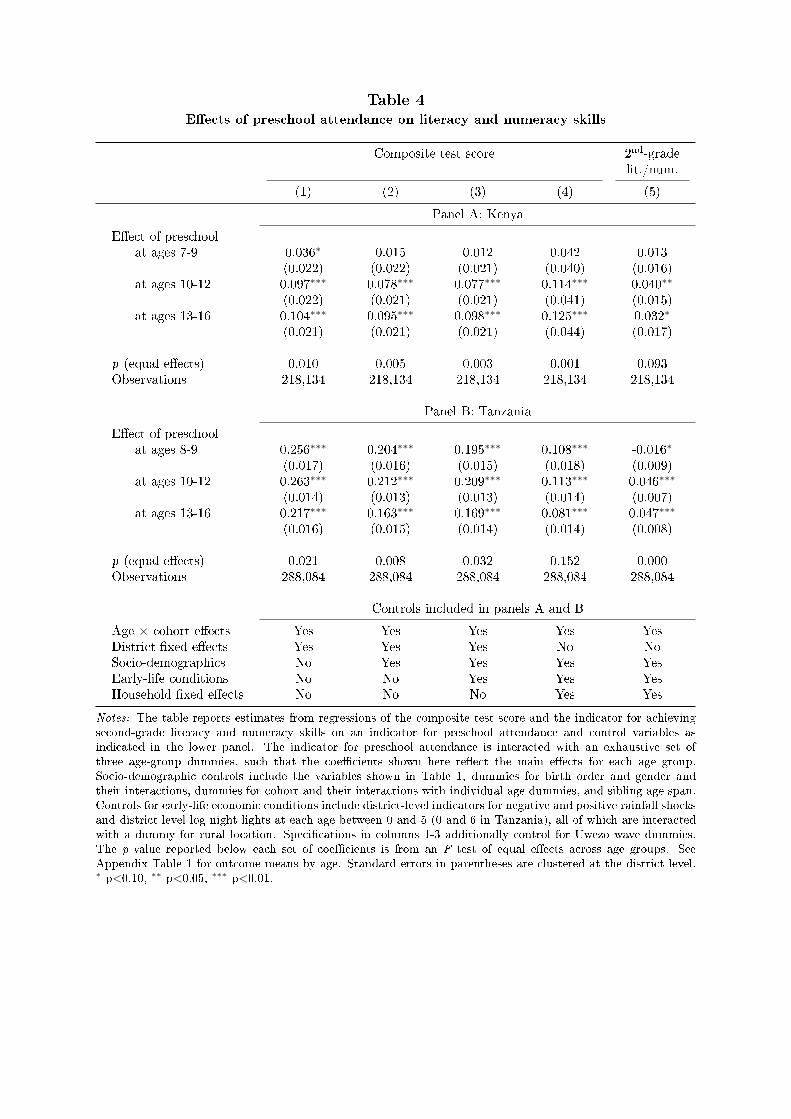
Table 4
E�ects of preschool attendance on literacy and numeracy skills
Composite test score 2nd-gradelit./num.
(1) (2) (3) (4) (5)
Panel A: Kenya
E�ect of preschoolat ages 7-9 0.036∗ 0.015 0.012 0.042 0.013
(0.022) (0.022) (0.021) (0.040) (0.016)at ages 10-12 0.097∗∗∗ 0.078∗∗∗ 0.077∗∗∗ 0.114∗∗∗ 0.040∗∗
(0.022) (0.021) (0.021) (0.041) (0.015)at ages 13-16 0.104∗∗∗ 0.095∗∗∗ 0.098∗∗∗ 0.125∗∗∗ 0.032∗
(0.021) (0.021) (0.021) (0.044) (0.017)
p (equal e�ects) 0.010 0.005 0.003 0.001 0.093Observations 218,134 218,134 218,134 218,134 218,134
Panel B: Tanzania
E�ect of preschoolat ages 8-9 0.256∗∗∗ 0.204∗∗∗ 0.195∗∗∗ 0.108∗∗∗ -0.016∗
(0.017) (0.016) (0.015) (0.018) (0.009)at ages 10-12 0.263∗∗∗ 0.212∗∗∗ 0.209∗∗∗ 0.113∗∗∗ 0.046∗∗∗
(0.014) (0.013) (0.013) (0.014) (0.007)at ages 13-16 0.217∗∗∗ 0.163∗∗∗ 0.169∗∗∗ 0.081∗∗∗ 0.047∗∗∗
(0.016) (0.015) (0.014) (0.014) (0.008)
p (equal e�ects) 0.021 0.008 0.032 0.152 0.000Observations 288,084 288,084 288,084 288,084 288,084
Controls included in panels A and B
Age × cohort e�ects Yes Yes Yes Yes YesDistrict �xed e�ects Yes Yes Yes No NoSocio-demographics No Yes Yes Yes YesEarly-life conditions No No Yes Yes YesHousehold �xed e�ects No No No Yes Yes
Notes: The table reports estimates from regressions of the composite test score and the indicator for achievingsecond-grade literacy and numeracy skills on an indicator for preschool attendance and control variables asindicated in the lower panel. The indicator for preschool attendance is interacted with an exhaustive set ofthree age-group dummies, such that the coe�cients shown here re�ect the main e�ects for each age group.Socio-demographic controls include the variables shown in Table 1, dummies for birth order and gender andtheir interactions, dummies for cohort and their interactions with individual age dummies, and sibling age span.Controls for early-life economic conditions include district-level indicators for negative and positive rainfall shocksand district-level log night lights at each age between 0 and 5 (0 and 6 in Tanzania), all of which are interactedwith a dummy for rural location. Speci�cations in columns 1-3 additionally control for Uwezo wave dummies.The p-value reported below each set of coe�cients is from an F -test of equal e�ects across age groups. SeeAppendix Table 1 for outcome means by age. Standard errors in parentheses are clustered at the district level.∗ p<0.10, ∗∗ p<0.05, ∗∗∗ p<0.01.

Table
5
Heterogeneity
bynumber
ofyears
attended
bygender
bymother'seducation
bynightlights
main
e�ect
×2years
×3years
main
e�ect
×female
main
e�ect
×someedu.
main
e�ect
×>
85%
(1)
(2)
(3)
(4)
(5)
(6)
(7)
(8)
(9)
Panel
A:Kenya
1.Highest
gradeattended
E�ectofpreschool
atages
7-9
-0.211∗∗
∗-0.374∗∗
∗-0.503∗∗
∗-0.341∗∗
∗0.013
-0.270∗∗
∗-0.024
-0.336∗∗
∗0.053
(0.050)
(0.045)
(0.055)
(0.049)
(0.046)
(0.073)
(0.096)
(0.044)
(0.184)
atages
10-12
0.168∗∗
∗0.190∗∗
∗0.268∗∗
∗-0.164∗∗
∗0.083∗∗
-0.094
-0.033
-0.127∗∗
∗0.009
(0.035)
(0.035)
(0.033)
(0.047)
(0.036)
(0.070)
(0.086)
(0.037)
(0.211)
atages
13-16
0.181∗∗
∗0.293∗∗
∗0.441∗∗
∗-0.071
0.100∗∗
-0.024
-0.046
-0.054
0.093
(0.053)
(0.054)
(0.056)
(0.066)
(0.049)
(0.073)
(0.092)
(0.047)
(0.225)
Observations
218,728
218,728
218,728
218,728
2.Composite
test
score
E�ectofpreschool
atages
7-9
0.045
-0.006
0.074
0.034
0.019
0.076
-0.041
0.022
0.104
(0.041)
(0.043)
(0.047)
(0.046)
(0.032)
(0.072)
(0.091)
(0.043)
(0.098)
atages
10-12
0.089∗∗
∗0.091∗∗
∗0.043∗
0.086∗∗
0.055∗∗
0.143∗
-0.069
0.116∗∗
-0.013
(0.024)
(0.024)
(0.023)
(0.041)
(0.024)
(0.079)
(0.094)
(0.045)
(0.104)
atages
13-16
0.122∗∗
∗0.109∗∗
∗0.025
0.100∗∗
0.054
0.235∗∗
-0.148
0.136∗∗
∗-0.037
(0.037)
(0.037)
(0.035)
(0.046)
(0.038)
(0.100)
(0.120)
(0.049)
(0.103)
Observations
218,134
218,134
218,134
218,134
Panel
B:Tanzania
1.Highest
gradeattended
E�ectofpreschool
atages
8-9
-0.237∗∗
∗-0.510∗∗
∗-0.256∗∗
∗0.087∗∗
∗-0.255∗∗
∗0.070
-0.205∗∗
∗-0.000
(0.054)
(0.083)
(0.028)
(0.029)
(0.043)
(0.049)
(0.027)
(0.068)
atages
10-12
0.081∗∗
0.116∗∗
-0.080∗∗
∗0.012
-0.127∗∗
∗0.058
-0.095∗∗
∗0.102
(0.038)
(0.056)
(0.028)
(0.029)
(0.046)
(0.047)
(0.026)
(0.072)
atages
13-16
0.185∗∗
∗0.332∗∗
∗0.100∗∗
∗-0.010
-0.047
0.167∗∗
∗0.048∗
0.310∗∗
∗
(0.055)
(0.098)
(0.032)
(0.039)
(0.055)
(0.062)
(0.027)
(0.104)
Observations
107,825
284,396
284,396
284,396
2.Composite
test
score
E�ectofpreschool
atages
8-9
0.080∗∗
∗0.157∗∗
∗0.080∗∗
∗0.054∗∗
0.080∗∗
0.031
0.096∗∗
∗0.029
(0.034)
(0.039)
(0.022)
(0.025)
(0.039)
(0.050)
(0.018)
(0.060)
atages
10-12
0.047
-0.013
0.089∗∗
∗0.048∗∗
∗0.140∗∗
∗-0.039
0.097∗∗
∗0.090∗∗
∗
(0.029)
(0.030)
(0.016)
(0.018)
(0.037)
(0.044)
(0.015)
(0.032)
atages
13-16
0.044
-0.089∗∗
0.069∗∗
∗0.024
0.144∗∗
∗-0.082∗
0.075∗∗
∗0.105∗∗
(0.037)
(0.042)
(0.017)
(0.018)
(0.040)
(0.046)
(0.014)
(0.049)
Observations
107,605
288,084
288,084
288,084
Notes:
Thetable
reportsestimatesfrom
speci�cationsin
whichthedummyforpreschoolattendance
isinteracted
withthreeage-groupdummiesasin
Tables3and4and
additionallywithtwodummiesforattendingpreschoolfortwoandthreeyears
(columns1-3),afemale
dummy(columns4-5),adummyforhavingamother
withatleast
someform
aleducation(columns6-7),andadummyforlivingin
adistrictwithnightlightdensity
abovethe85thnationalpercentile
intheyear2000(columns8-9).
The
table
reportsthemain
e�ects
foreach
agegroupaswellasthecoe�
cients
ontheinteractionswiththesecharacteristics.Base
levelsin
columns1/4/6/8:attended
for1
year/male/noform
aleducation/districtnightlightsbelow
the85thnationalpercentile.Outcomevariablesare
indicatedin
cursivein
therowsabovetherespectiveregressions.
Allregressionsincludehousehold
�xed
e�ects
andcontrolsasin
column4ofTables3and4.Standard
errors
inparentheses
are
clustered
atthedistrictlevel.
∗p<0.10,∗∗
p<0.05,∗∗
∗p<0.01.

Table 6
E�ect of preschool attendance on composite test scores
after controlling for highest grade attended
Baseline Controlling forhighest gradeattended
(1) (2)
Panel A: Kenya
E�ect of preschoolat ages 7-9 0.042 0.157∗∗∗
(0.040) (0.036)at ages 10-12 0.114∗∗∗ 0.148∗∗∗
(0.041) (0.035)at ages 13-16 0.125∗∗∗ 0.177∗∗∗
(0.044) (0.039)
Observations 218,134 218,134
Panel B: Tanzania
E�ect of preschoolat ages 8-9 0.108∗∗∗ 0.157∗∗∗
(0.018) (0.017)at ages 10-12 0.113∗∗∗ 0.126∗∗∗
(0.014) (0.014)at ages 13-16 0.081∗∗∗ 0.104∗∗∗
(0.014) (0.013)
Observations 288,084 288,084
Notes: Column 1 replicates the estimates shown in column 4 of Table 4. Speci�-cations in column 2 add separate dummies for the number of grades attended tothese regressions as controls. See the notes to Table 4 for further details on includedcontrol variables. Standard errors in parentheses are clustered at the district level. ∗
p<0.10, ∗∗ p<0.05, ∗∗∗ p<0.01.

Table 7
E�ects of preschool attendance on other educational investments
After-school tutoring Private school attendance
Estimates Outcomemeans
Estimates Outcomemeans
(1) (2) (3) (4)
Panel A: Kenya
E�ect of preschoolat ages 7-9 -0.002 0.268 -0.004 0.239
(0.011) (0.010)at ages 10-12 0.005 0.312 -0.014 0.153
(0.011) (0.011)at ages 13-16 0.020 0.371 -0.015 0.092
(0.017) (0.011)
Observations 223,339 208,424
Panel B: Tanzania
E�ect of preschoolat ages 8-9 -0.000 0.219 -0.005 0.060
(0.025) (0.004)at ages 10-12 0.018 0.245 -0.006∗ 0.047
(0.024) (0.003)at ages 13-16 0.020 0.253 -0.001 0.077
(0.019) (0.003)
Observations 25,346 264,810
Notes: Column 1 shows estimates from regressions in which the dependent variable is an indicator for receivingprivate after-school tutoring, and column 3 shows estimates from regressions in which the dependent variableis an indicator for currently attending private school. All speci�cations are otherwise identical to the ones incolumn 4 of Tables 3 and 4. Columns 2 and 4 show age-group-speci�c means of the dependent variables. Samplesize is reduced in column 1 for Tanzania because the outcome is only observed in the 2014 wave there. Samplesize is reduced for both countries in column 3 because private school attendance is only observed for studentswho are currently enrolled in school. Standard errors in parentheses are clustered at the district level. ∗ p<0.10,∗∗ p<0.05, ∗∗∗ p<0.01.

Table 8
Judging the importance of selection on unobservables
Highest grade attended Composite test score
(1) (2) (3) (4)
Panel A: Kenya
E�ect of preschoolat ages 7-9 -0.703∗∗∗ -0.423∗∗∗ -0.104 0.023
(0.072) (0.070) (0.063) (0.066)at ages 10-12 0.110 -0.090 0.251∗∗∗ 0.165∗∗
(0.070) (0.078) (0.064) (0.066)at ages 13-16 0.144∗ -0.020 0.092 0.111
(0.086) (0.085) (0.069) (0.075)
R-squared 0.688 0.869 0.114 0.619δ (13-16 years) -0.119 11.317Observations 7,229 7,229 7,141 7,141
Panel B: Tanzania
E�ect of preschoolat ages 8-9 -0.115∗∗∗ -0.147∗∗∗ 0.108∗∗∗ 0.093∗∗∗
(0.030) (0.041) (0.028) (0.032)at ages 10-12 -0.154∗∗∗ -0.088∗∗ 0.073∗∗∗ 0.111∗∗∗
(0.034) (0.038) (0.023) (0.022)at ages 13-16 0.110∗∗∗ 0.083∗∗ 0.128∗∗∗ 0.120∗∗∗
(0.042) (0.038) (0.022) (0.024)
R-squared 0.622 0.831 0.072 0.637δ (13-16 years) 1.150 4.553Observations 29,981 29,981 30,427 30,427
Controls included in panels A and B
Age × cohort e�ects Yes Yes Yes YesDistrict �xed e�ects Yes No Yes NoSocio-demographics No Yes No YesEarly-life conditions No Yes No YesHousehold �xed e�ects No Yes No Yes
Notes: The table reports regression estimates that provide the inputs into the computation of Oster's (2017)δ, that is, the ratio of the impact of unobservables to the impact of observable controls that would drive thecoe�cient on preschool attendance for 13- to 16-year-olds to zero. For details on the underlying method, see textand Oster (2017). For this analysis, the sample is restricted to households with variation in preschool attendance.The regressions are otherwise identical to those in columns 1 and 4 in Table 3 (columns 1 and 2 in the currenttable) and columns 1 and 4 in Table 4 (columns 3 and 4 in the current table). To calculate δ, we use the Statacommand -psacalc-, setting the maximum achievable R-squared (`Rmax ') to 1.3 times the R-squared in theregression with household �xed e�ects (and at most 1). ∗ p<0.10, ∗∗ p<0.05, ∗∗∗ p<0.01.

Appendix Table 1
Grade progression, enrollment, and literacy and numeracy skills, by age
Highestgradeat-
tended
Currentlyen-
rolled
Still inpreschool
Rawnumer-acyscore
RawEnglishlit.score
RawSwahililit.score
Has2nd-gradelit./num.
Panel A: Kenya
Age 7 1.49 1.00 0.13 3.33 2.00 2.01 0.14Age 8 2.27 1.00 0.06 4.12 2.43 2.46 0.26Age 9 3.00 1.00 0.03 4.70 2.82 2.87 0.40Age 10 3.80 1.00 0.02 5.05 3.10 3.15 0.51Age 11 4.66 0.99 0.00 5.40 3.36 3.41 0.65Age 12 5.39 0.99 0.00 5.56 3.53 3.57 0.73Age 13 6.17 0.99 0.00 5.70 3.66 3.70 0.80Age 14 6.83 0.98 0.00 5.75 3.75 3.78 0.84Age 15 7.42 0.97 0.00 5.78 3.80 3.83 0.88Age 16 8.15 0.95 0.00 5.81 3.84 3.85 0.90
Panel B: Tanzania
Age 8 1.73 0.98 0.04 3.09 1.01 1.64 0.10Age 9 2.43 0.98 0.02 3.71 1.29 2.06 0.18Age 10 3.19 0.98 0.01 4.17 1.58 2.41 0.27Age 11 3.96 0.97 0.01 4.62 1.87 2.75 0.39Age 12 4.73 0.96 0.00 4.88 2.11 2.97 0.46Age 13 5.55 0.94 0.00 5.12 2.38 3.20 0.56Age 14 6.19 0.91 0.00 5.30 2.65 3.35 0.64Age 15 6.71 0.86 0.00 5.39 2.81 3.44 0.69Age 16 7.28 0.82 0.00 5.47 2.99 3.50 0.73
Notes: The table reports means of the variables indicated in the column heads across children of the age indicatedin rows. Raw numeracy scores range from 0 to 6. Raw English and Swahili literacy scores range from 0 to 4. Forde�nitions of all other variables, see the notes to Table 1 and Online Appendix A. Note that the �gures reportedhere can di�er from the enrollment statistics reported in Section 2 of the paper because those statistics are basedon the unrestricted sample of children in the Uwezo data.

Appendix Table 2
Reported preschool attendance by cohort and wave
Wave: 2011 2012 2013 2014
Panel A: Kenya
Cohort1997 0.831998 0.84 0.831999 0.84 0.842000 0.83 0.842001 0.84 0.852002 0.85 0.842003 0.84 0.852004 0.85 0.842005 0.85 0.852006 0.87 0.852007 0.85
Panel B: Tanzania
Cohort1995 0.571996 0.59 0.581997 0.59 0.58 0.601998 0.61 0.60 0.611999 0.63 0.61 0.622000 0.65 0.64 0.642001 0.66 0.65 0.632002 0.69 0.66 0.652003 0.69 0.67 0.642004 0.68 0.652005 0.64
Notes: The table shows the fractions of children reporting to have attended preschool by country,cohort, and Uwezo survey wave. The sample is restricted to districts that were visited in allwaves of the Uwezo survey. We disregard the 2014 wave in Tanzania because only a subsample ofdistricts were sampled (45 districts versus more than 120 districts in the three previous waves).In the raw data, we observe level shifts in preschool attendance rates for all cohorts betweensome of the waves, likely because the question asking about preschool attendance changed. Thetable therefore shows regression-adjusted attendance rates after taking out wave �xed e�ects.

Appendix
Table
3
Resultsforthefullsample
vs.
thesample
ofhouseholdswithwithin
variationin
preschoolattendance
Highestgradeattended
Composite
test
score
Main
sample
Sub-sample
p(equale�ects)
Main
sample
Sub-sample
p(equale�ects)
(1)
(2)
(3)
(4)
(5)
(6)
PanelA:Kenya
E�ectofpreschool
atages
7-9
-0.336∗
∗∗-0.423∗∗
∗0.121
0.042∗
∗∗0.023
0.670
(0.021)
(0.051)
(0.015)
(0.041)
atages
10-12
-0.123∗∗
∗-0.090∗
0.547
0.114∗
∗∗0.165∗∗
∗0.283
(0.021)
(0.049)
(0.015)
(0.041)
atages
13-16
-0.023
-0.020
0.967
0.125∗∗
∗0.111∗∗
∗0.785
(0.021)
(0.047)
(0.015)
(0.039)
Observations
218,728
7,229
218,134
7,141
PanelB:Tanzania
E�ectofpreschool
atages
8-9
-0.212∗
∗∗-0.147∗∗
∗0.069
0.108∗
∗∗0.093∗∗
∗0.589
(0.013)
(0.033)
(0.008)
(0.021)
atages
10-12
-0.074∗∗
∗-0.088∗∗
∗0.625
0.113∗
∗∗0.111∗∗
∗0.889
(0.011)
(0.023)
(0.006)
(0.015)
atages
13-16
0.096∗
∗∗0.083∗∗
∗0.602
0.081∗
∗∗0.120∗∗
∗0.034
(0.010)
(0.022)
(0.006)
(0.014)
Observations
284,396
29,981
288,084
30,427
Controlsincluded
inpanelsAandB
Age×
cohort
e�ects
Yes
Yes
Yes
Yes
Socio-dem
ographics
Yes
Yes
Yes
Yes
Early-lifeconditions
Yes
Yes
Yes
Yes
Household
�xed
e�ects
Yes
Yes
Yes
Yes
Notes:
Thetable
show
sestimatesoftheim
pact
ofpreschoolattendance
onhighestgradeattended
andthecomposite
test
score,separately
forthefullsample
usedin
the
main
analysisandfortherestricted
sampleofhouseholdswithwithin
variationin
preschoolattendance.Columns1and4re-estim
ate
themain
speci�cationsofTables3and
4.Columns2and5presentthecorrespondingestimatesfortherestricted
sample.Columns3and6presentpvalues
from
Wald
testsofthehypothesisthattheage-group
speci�ce�ects
inthetwocolumnsto
theleftare
equal.
Thesecross-speci�cationtestsare
conducted
usingseem
ingly
unrelatedregressionusingStata's
-suest-command.
Dueto
computationalconstraints,rather
thanestimatingthehousehold
�xed
e�ects
modelsdirectly,we�rstdem
eanthedata
using-xtdata-,andthen
estimate
regressions
thatexcludethehousehold
�xed
e�ects
onthesedata.Thisresultsin
thesamecoe�
cientestimates,butlower
standard
errors.Thisin
turn
increasesthechance
ofrejecting
thenullofequalcoe�
cients
intheWald
tests,whichmeansthatweerrontheconservativesidein
ourinterpretationofthepvalues.