Embed Size (px)
Citation preview

Prescient Limited
Results Presentation6 Months to 30 September 2014
Presented by: Herman Steyn (CEO) and Michael Buckham (FD)
27 November 2014

2
CONTENTS
Business environment
About Prescient
Our business mission and strategy
Financial highlights
Operational overview
The year ahead
Questions
Appendices

3
Business Environment

4
GLOBAL MARKETS
Source: Bloomberg; Wind – Total Return USD Source: Bloomberg
Source: Bloomberg Source: iNet

5
BUSINESS ENVIRONMENT
Retirement reform
– Shift to retail
Regulatory burden
Challenges of dealing in new markets (global compliance)
Transparency and investment in technology
Demand for alternative investments
ABIL

6
THE AFRICAN GROWTH STORY
Source: IMF (WEO April 2013), Prescient

7
TOP COUNTRIES IN THE MSCI WORLD VS GDP
Source: Factset 2013
• 2005 - CNY de-peg from USD
• CNY has strengthened 30% from 8,2 to 6,2 to USD currently. PPP by IMF puts the level at around 4.1
• QFII program started in 2004. By 2011 $20.7 billion. The target for the near future is $80 billion. Currently 0.8% of market capitalization.
• As of this year total trade in China larger than USA
• Foreigners own approximately 26% of other markets, for China it is 0.8%
0%
10%
20%
30%
40%
50%
60%
Weight in MSCI AC world
Weight In Global GDP as % of top20
• 2005 - CNY de-peg from USD
• CNY has strengthened 30% from 8,2 to 6,2 to USD currently. PPP by IMF puts the level at around 4.1
• QFII program started in 2004. By 2011 $20.7 billion. The target for the near future is $80 billion. Currently 0.8% of market capitalization.
• As of this year total trade in China larger than USA
• Foreigners own approximately 26% of other markets, for China it is 0.8%

8
About Prescient

9
GROUP ORGANOGRAM
Current AUM in investment management – R60.4 billion (FY14: R59.1 billion)
Current third party AUA in administration business
• South Africa – R52.1 billion (FY14: R31.1 billion)
• Ireland – €812.5 million (FY14: €1.2 billion)
Prescient Holdings and subsidiaries – Level II contributor in terms of the DTI code
PRES
CIE
NT
LIM
ITED
Financial Services
Prescient Holdings
PBT Group
Information Management Services
Prescient Capital

10
Our Business Mission and StrategyInnovative solutions to
market
Continual learning and
sharing with our clients
Peace of Mind
Entrepreneurial

11
Financial Highlights

12
FINANCIAL HIGHLIGHTS
Prescient Investment Management– AUM slightly higher with increased flows from retail sales– Continued good performance– Additional quota for China Fund
Prescient Fund Services and Stadia Fund Management– Significant growth in third party AUA
Prescient Life– Growth in Prescient Life AUM– Well capitalised
Prescient Securities– Highly rated research and execution offering– Pressure on revenues
Prescient Wealth– Costs incurred for future growth
Financial Services

13
FINANCIAL HIGHLIGHTS
Strong growth in revenue and earnings
Demand for services remains high across all technology stacks
Rand depreciation has enhanced revenue
Strong local growth maintains revenue generated in foreign currency
at 50%
Weakening rand has limited effect on costs
Very satisfactory contribution from PBT Australia
Information Management Services

14
FINANCIAL OVERVIEWStatement of Profit and Loss – continuing operations
Six months to 30 Sep 2014
Six months to 30 Sep 2013
% Change Full year to 31 March 2014
R'000s
Revenue 389 370 332 841 17% 664 626
Operating expenses (306 762) (254 553) 21% (518 319)
Profit from operations 82 608 78 288 6% 146 307
Other income 2 601 2 780 10 652
Share of loss of equity accounted investee (1 223) (364) (573)
Finance costs (4 401) (3 002) (4 155)
Profit before taxation 79 585 77 702 2% 152 231
Income tax expense (23 169) (22 792) (39 591)
Profit from continuing operations for the period 56 416 54 910 3% 112 640
Non controlling interests 292 (2 207) (777)Total comprehensive income attributable to the parent for continuing operations 56 708 52 703 8% 111 863
15
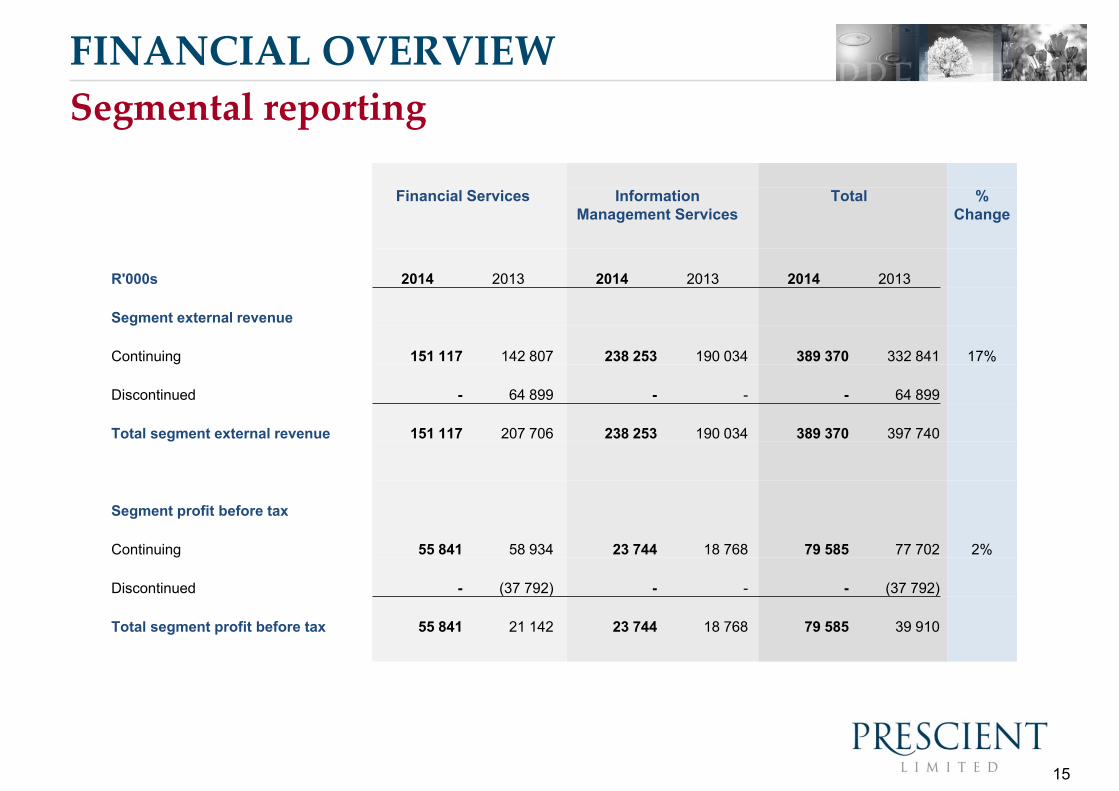
FINANCIAL OVERVIEWSegmental reporting
Financial Services Information Management Services
Total % Change
R'000s 2014 2013 2014 2013 2014 2013
Segment external revenue
Continuing 151 117 142 807 238 253 190 034 389 370 332 841 17%
Discontinued - 64 899 - - - 64 899
Total segment external revenue 151 117 207 706 238 253 190 034 389 370 397 740
Segment profit before tax
Continuing 55 841 58 934 23 744 18 768 79 585 77 702 2%
Discontinued - (37 792) - - - (37 792)
Total segment profit before tax 55 841 21 142 23 744 18 768 79 585 39 910

16
Earnings per shareFINANCIAL OVERVIEW
Six months to 30 Sep 2014
Six months to 30 Sep 2013
% Change Full year to 31 March 2014
Earnings per share - continuing operations
Earnings per share 3.59 3.38 6% 7.15
Headline earnings per share 3.59 3.38 6% 6.96
Earnings per share - discontinued operations
Earnings per share - (2.43) (3.12)
Headline earnings per share - (0.43) (0.43)
Earnings per share - total
Earnings per share 3.59 0.96 275% 4.03
Headline earnings per share 3.59 2.96 21% 6.53
Actual shares in issue (millions) 1 646 1 598 3% 1 598
Weighted average number of shares in issue (millions)
1 580 1 558 1% 1 566
17
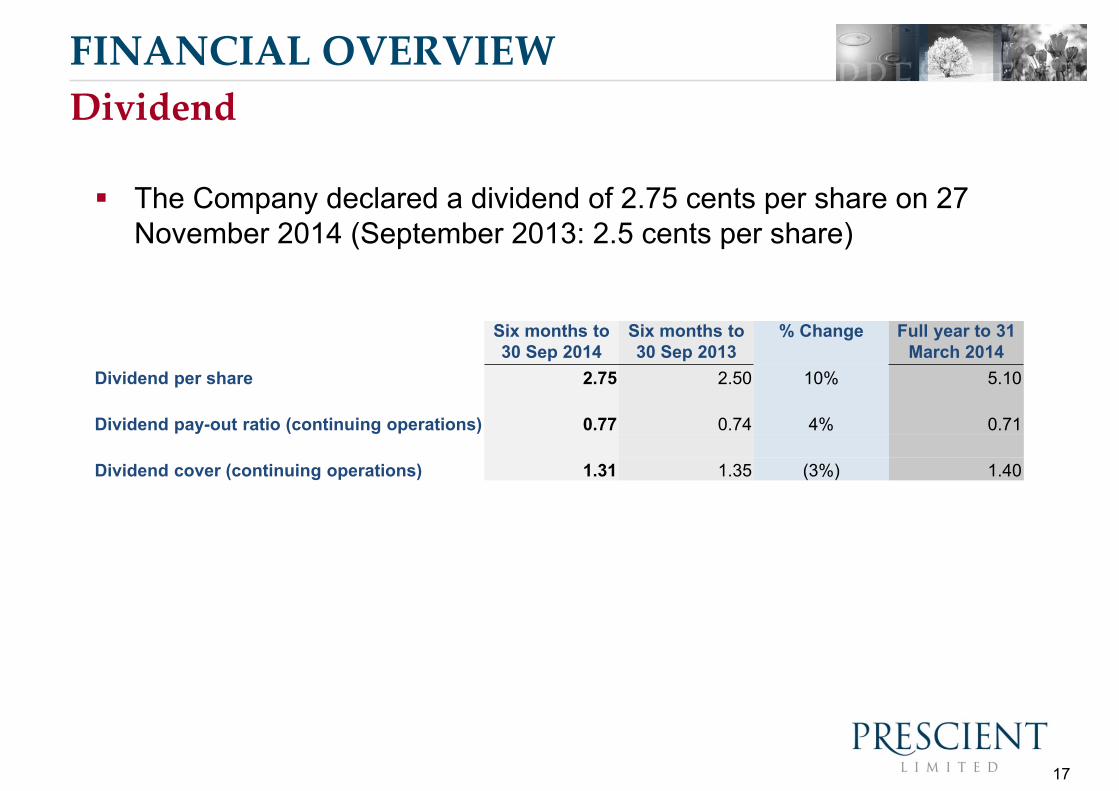
FINANCIAL OVERVIEW
The Company declared a dividend of 2.75 cents per share on 27 November 2014 (September 2013: 2.5 cents per share)
Dividend
Six months to 30 Sep 2014
Six months to 30 Sep 2013
% Change Full year to 31 March 2014
Dividend per share 2.75 2.50 10% 5.10
Dividend pay-out ratio (continuing operations) 0.77 0.74 4% 0.71
Dividend cover (continuing operations) 1.31 1.35 (3%) 1.40

18
Operational Overview

19
16 Year track record
Specialising in the delivery of superior risk
adjusted returns across a range of mandates
Markets include South Africa, Africa, China,
Global Developed Markets
Assets under management of R60.4 billion
(FY14: R59.1 billion)
We focus on providing appropriate solutions
in a changing investment environment
FY15 focus
− Performance across mandates
− Growth in retail base
− Growth of products in new markets - China
and Africa
− Retirement reform
− Providing clients with cost effective
solutions
Assets under management
PRESCIENT INVESTMENT MANAGEMENT

20
CORE PRODUCT RANGE
IncomeProvider
Positive Return
Absolute Balanced
Equity Active Quant
Targets a high income yield with stable capital values.
Targets sustainable real returns over time, while
actively managing downside risk (in foreign
currency for feeder funds).
Targets real returns through income and
capital gains with capital losses
possible over the shorter term.
Targets returns above general equity markets by investing in shares that offer value relative
to its price
Yield QuantPlus®
Yield QuantPlus®
Global Positive Return Feeder
Global Positive Return Feeder
China Balanced
Feeder
China Balanced
Feeder
Global Growth Feeder
Equity QuantEquity Quant
Africa EquityAfrica Equity
Equity IncomeEquity Income
Balanced
Targets real returns similar to the average balanced fund with no
explicit risk target.
GlobalBalancedStrategy Feeder
GlobalBalancedStrategy Feeder
Money MarketMoney Market
Bond QuantPlus®
Bond QuantPlus®
Global IncomeFeeder
Global IncomeFeeder
Equity Defender
Fund
Equity Defender
Fund
China Conservative
Feeder
China Conservative
Feeder
Expected Capital VolatilityEx
pect
ed R
eal R
etur
ns
CORE SATELLITESATELLITEGLOBAL FEEDER FUNDS
GLOBAL FEEDER FUNDS
Global Income Fund ($)
Global Income Fund ($)
Global Positive
Return (Euro) Fund ($,€)
Global Positive
Return (Euro) Fund ($,€)
China Conservative
Fund ($, ¥)
China Conservative
Fund ($, ¥)China
Balanced Fund ($,¥)
China Balanced Fund ($,¥)Global
Growth Fund ($)
Global Growth Fund ($)
GLOBAL FUNDS
GLOBAL FUNDS

PRESCIENT OFFSHORE RANGEEx
pect
ed R
eal R
etur
ns
Expected Capital Volatility
Fund Type UCITS Registered Office 33 Sir John Rogerson’s QuayPricing Daily Dublin 2, IrelandInvestment Manager Prescient Investment Management Client Services 49 Upper Mount StreetCustodian BNY Mellon Trust Company Dublin 2, Ireland Administrator Stadia Fund Management Ltd Tel : 00 353 1 676 6959Auditors KPMG email : [email protected]
Asset Class
Benchmark
GlobalIncome
Interest Bearing
90 day US TB
ChinaConser-vative
China CPI + 2%
Africa Equity
80% Nedbank 100 ex-SA
20% JSE Top 40
ChinaBalanced
China CPI + 3%
Global Positive Return (Euro)
Multi Asset
EU Harmonised CPI + 1%
Global Growth
Equity
MSCI World Index

22
POSITIVE RETURN PERFORMANCE
Source: Prescient – Rolling Returns vs STeFi Call – March 2001 to September 2014

23
PRESCIENT INCOME PROVIDER
Since inception = April 2006

24
PRESCIENT INCOME PROVIDER COMPOSITE
Gross returns to 31 Oct 2014. Inception = April 2006

25
ALPHA – EQUITY FUNDS VS MARKET INDICES
Since Incorporation of China Fund – April 2013
26
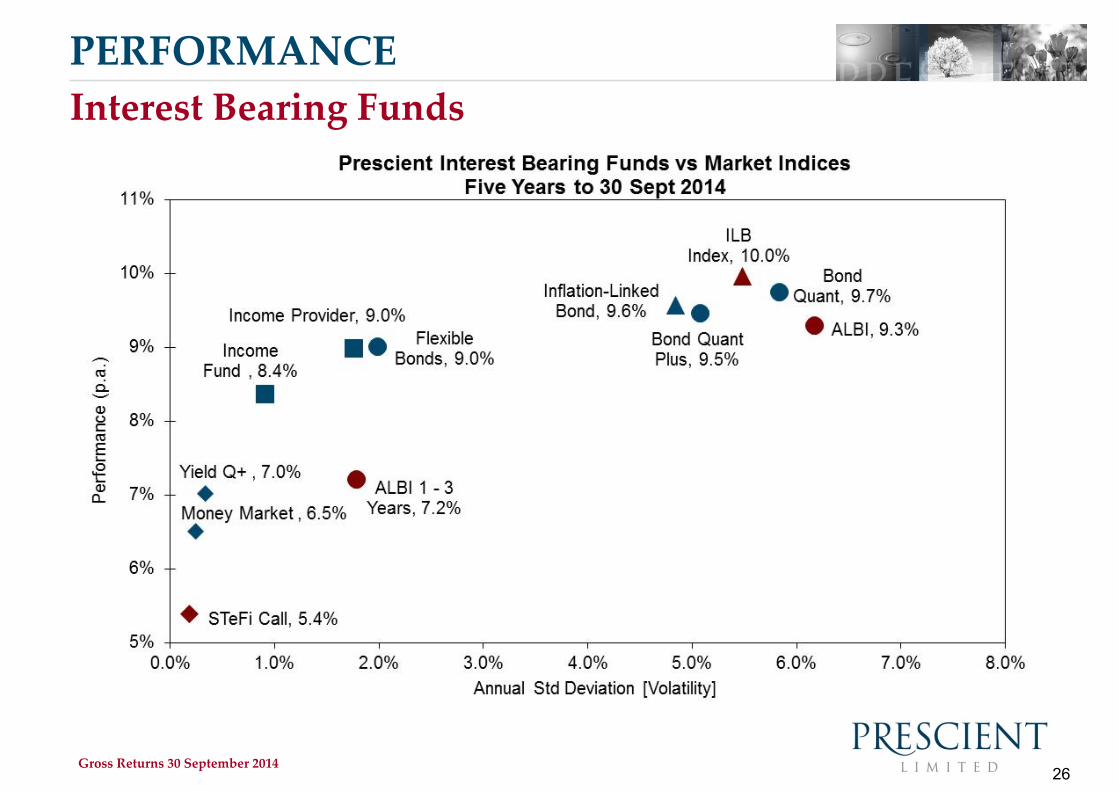
PERFORMANCEInterest Bearing Funds
Gross Returns 30 September 2014

27
PERFORMANCE
Gross composite returns from 31 August 2003 to end October 2014
Positive Return and Absolute Balanced Funds
FTSE/JSE All Share Index, 20.1%
Balanced (60% Equity, 40% Cash), 15.0%Positive Return
Composite , 12.2%
ALBI, 9.4%
Cash, 7.0%
Prescient Absolute Balanced Fund, 15.2%
Inflation, 5.8%
4%
6%
8%
10%
12%
14%
16%
18%
20%
22%
0% 2% 4% 6% 8% 10% 12% 14% 16% 18% 20% 22%
Perf
orm
ance
(p.a
.)
Annual Volatility
Prescient Positive Return and Absolute Balanced Fund vs Benchmarks Risk/Return - Since Inc of Absolute Balanced Fund (Aug 2003) to 31 October 2014

28
PRESCIENT FUND SERVICES AND STADIA FUND MANAGEMENT
Providing outsourced administration services since 2010
Operating in South Africa and Ireland Significant growth in 3rd party AUA:
– South Africa – R52.0 billion (FY14: R31.1 billion)
– Ireland - €812.5 million (FY14: €1.2 billion) Specialist outsourced administration and platform
services to asset managers, multi-managers, hedge funds, pension funds and other institutional investment providers
Significant investment in people and technology. Technology systems include:
– Eagle Investment systems– Thinkfolio– Vermillion
FY15 focus– Growth in third party clients– Successful integration of new clients– Competitive pricing structure– Further enhancement of front office and
reporting capability– Hedge Fund administration capability
South African assets under administration

29
PRESCIENT LIFE LIMITED
Range of products managed by third party managers under a white-labelled arrangement with full administration services
In the retail space, Prescient Life offers retirement annuities, preservation funds, umbrella funds, living annuities and endowment policies
Competitive advantage - solution that we call “seamless transition”
FY15 focus
– Establishing Prescient Life as a fully operational business
– Embracing regulatory changes in preparation for full implementation in 2015
– Liaison with National Treasury to promote “seamless transition”
– Gained traction with trustees and consultants and starting to see new business flows as a result

30
PRESCIENT SECURITIES
Focus on the institutional fund management market
Research and trade offering covers equity, derivatives and fixed income
Consistent performance in FM rankings and Spire awards (refer to Appendix)
FY15 focus - Strengthen research/trade offering across asset classes

31
PRESCIENT WEALTH MANAGEMENT
Operating within the group since 2010
An independent private client wealth and portfolio management business
that provides clients with a comprehensive range of services
FY15 focus
– Grow senior team and private client manager base
– Enhancement of Prescient Wealth’s investment propositions, and the inclusion of
an advisory business
– Implementation of a comprehensive wealth management offering

32
INFORMATION MANAGEMENT SERVICES
The PBT Group is a consulting company, specialising in data management,
to SA, MEA and Australian clients
These professional services are conducted in, amongst others, the Financial
Services, Retail and Mobile Telecommunication sectors
Successful track record in Africa and Middle East, operating since 2003
Well established in Australia, operating since 2005
FY15 focus
– Continued growing contribution to Prescient Group revenue and earnings
– 50% of earnings generated offshore to diversify earnings base
– Continued service delivery to clients in buoyant trading environment

33
The Year Ahead

34
THE YEAR AHEAD
Focus on investment performance
Positioned for growth
– Strong balance sheet
– Technology platform
– Appropriate solutions
Maintain competitive positioning
Specific focus areas:
– Retail
– Life products – “seamless transition”
– Prescient Wealth
– China
– Africa
– Beta funds
Maintain our entrepreneurial culture

35
THE YEAR AHEAD
Challenges
– Regulatory burden
– Pressure to reduce costs of investment management services
– Dollar denominated costs for systems
– Conversion time for Prescient Wealth
– Pressure on revenue for Prescient Securities
– Regulatory capital can lead to a drag in financial performance
Earnings growth drivers
– Improved performance
– Growth of assets
– Improved margins due to increase in retail flows
– Economies of scale for administration
– High demand for information management services

36
Q&A

Thank YouRegulatory InformationThe information contained herein is provided for general information purposes only. This information does not constitute a solicitation, recommendation,
guidance or proposal, and the service provided is not intended nor does it constitute financial, tax, legal, investment or other advice.
Whilst reasonable steps are taken to ensure the accuracy and integrity of information contained herein, Prescient accepts no liability or responsibility
whatsoever if any information is, for whatever reason, incorrect. Prescient further accepts no responsibility for any loss or damage that may arise from reliance
on information contained herein.
Business address:
Prescient House, Westlake Business Park,
Otto Close, Westlake, Cape Town, 7945
Tel: 021 700 3600
Fax: 021 700 3700
38
Appendices

39
GROUP ORGANOGRAMFI
NA
NC
IAL
SER
VIC
ESPrescient Investment Management
EMH Prescient Investment Management
Prescient Securities
Prescient Wealth Management
Prescient Fund Services
Prescient Management Company
Prescient Life
Prescient Property Investment Management
Stadia Capital
Greenfields Institute of Business
INFO
RM
ATI
ON
MA
NA
GEM
ENT
SER
VIC
ES PBT Group
PBT Insurance Technologies (PBTit)
PBT Australia
BI-Blue Consulting
CyberPro Consulting
Technique Business Intelligence Software (TBIS)
Stadia Fund Management
40
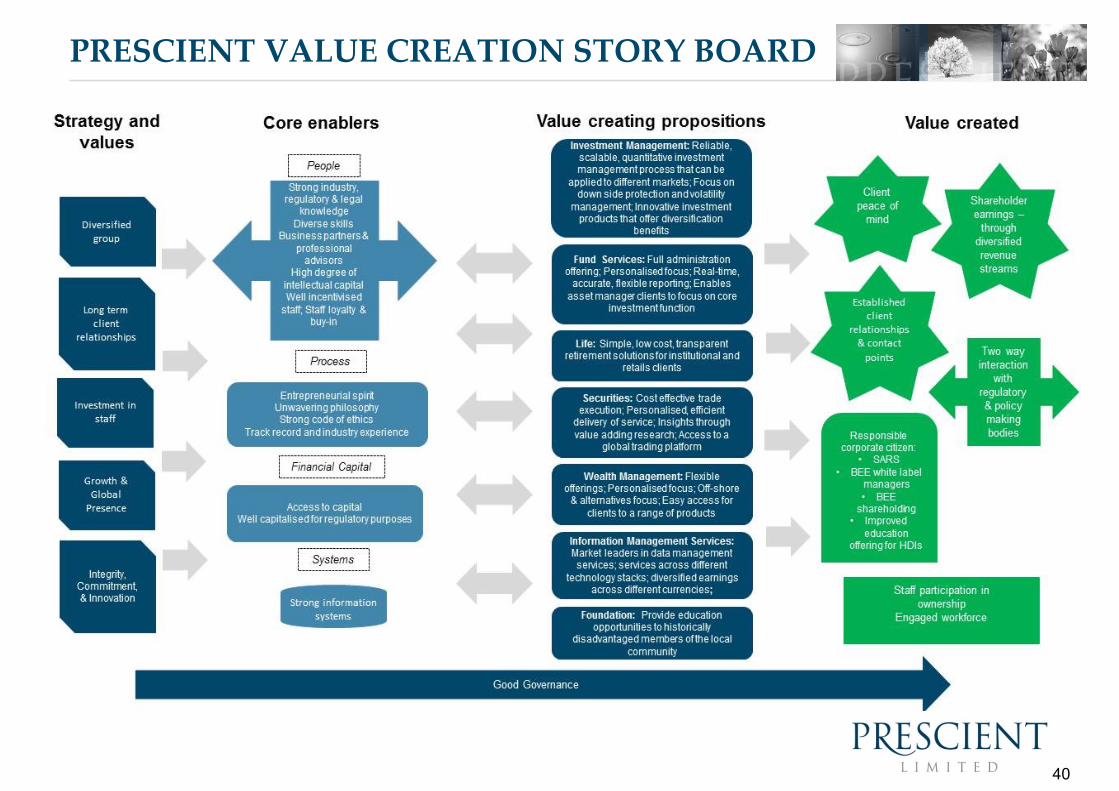
PRESCIENT VALUE CREATION STORY BOARD

41
REVENUE

42
PROFIT BEFORE TAX

43
INDUSTRY RECOGNITION
2014 Raging Bull Award– Positive Return – Best SA Multi-Asset Medium Equity Fund– Positive Return – Best SA Multi-Asset Medium Equity Fund on a risk adjusted
basis 2014 Morningstar
– Nominated in Diversified Bond category– Nominated in Global Bond category
2013 POA Imbasa Yegolide Absolute Return Manager of the Year
Prescient Fund Services uses Eagle Investment Systems as its primary administration system. The business unit received an award from Eagle for innovative use of its software.

44
INDUSTRY RECOGNITION
The 2014 Financial Mail “Rating the Analysts (equities and derivatives) Awards”:– #1 – Resources small and medium market cap companies– #1 – Electronic and electrical equipment– #1 – Derivatives research– #2 – Hotels, travel and leisure– #3 – Financial and industrial small and medium market cap companies (#1 when weighted by
AUM)– #3 – Derivatives dealing (#2 when weighted by AUM)– #3 – Risk management– #4 – Innovative research– #4 – Credit analysis– #4 – Other African economies and markets
The 2014 Spire Awards:– #1 – Best Agency Broker House (Roll-up award)– #1 – Best Agency Broker – Bonds – #1 – Best Agency Broker – Listed Interest Rare Derivatives– #2 – Best Agency Broker – Listed FX Derivatives– #2 – Best Research Team – Quantitative Research

45
ANALYSIS OF SHAREHOLDERS
17%
8%
51%
2%
21%
2%
External BEE shareholding
BEE staff and management
Other staff and management
Non-executive directors and other related parties
Other
Treasury shares
As at 31 March 2014