Embed Size (px)
Citation preview

99
Prescription Audit towards Quality Indicators at a Tertiary Care Teaching Hospital in South India
Ananya Chakraborthy1, (MD); *Mohammad Riyash1,(Pharm.D);Kumar Srinivasan2,(MD); Vijaya Lakshmi3
1. Department of Pharmacology, Vydehi Institute of Medical Sciences and Research Centre. 2. Department of General Medicine, Vydehi Institute of Medical Sciences and Research Centre. 3. MBA Hospital Administration, NABH Co-ordinator, Quality & Control Department, Vydehi Institute of Medical Sciences and Research Centre.
A R T I C L E I N F O A B S T R A C T
Article type: Original Article
Introduction: The World Health Organization has laid down guidelines for rational prescriptions. Adherence to those guidelines is an important aspect of medication safety. In India, such adherence is mandatory towards National Accreditation Board for Hospitals and Health-care Providers (NABH) accreditation of health-care facilities. The audition of the prescriptions is therefore a quality improvement process that indirectly benefits the health-care stakeholders. Such an audit is part of the NABH Management of Medication and is monitored by the Pharmacy and Therapeutics (P&T) committee in most hospitals. Materials and Methods: This prospective study was conducted between December 2018 and November 2019. An
audit was carried out using 4800 case sheets from different in-patient departments of Vydehi
Institute of Medical Sciences and Research Centre, Bengaluru, India. The data were recorded
in a predefined audit form. Results: Out of 4800 prescriptions, 71% (n=3408) of the audited orders had drugs written down in the
capital; moreover, 97% (n=4656) and 47% (n=2256) of the prescriptions were legible and
were written in generics, respectively. Furthermore, 97% (n=4656) of the orders had a
physician’s signature, and 70% (3360) of them had a clinical review. It should be noted that
only 1% (n=48) of the orders had drug-drug and drug-food documented interactions.
Conclusion: According to the results of this study, physicians did not document suggestions regarding
drug-drug and drug-food interactions. Moreover, there were fewer numbers of prescriptions
written in generics. In addition, the majority of the medication orders were legible and
adhered to standards in the 12th month. This may be due to sharing the monthly audit reports
with various departments and the continuous feedback process involving the P&T committee.
Article History: Received: 18-Feb-2020 Accepted: 27-Jun-2020
Key words: Medication order, NABH,
Management of medication,
Prescription audit
Please cite this paper as: Chakraborthy A, Riyash M, Srinivasan K, Lakshmi V. Prescription Audit towards Quality Indicators at a Tertiary Care Teaching Hospital in South India .Journal of Patient Safety and Quality Improvement. 2020; 8(2): 99-105. Doi: 10.22038/psj.2020.45796.1260
Introduction
The rational use of drugs requires that medications are prescribed appropriately to
the clinical needs of the patients in doses that meet their requirements for an adequate period and at the lowest cost to them and their community (1).
*Coresponding author: 82 EPIP Area, Whitefield, Bengaluru - 560036, Karnataka – India. E-mail: [email protected]
Chakraborthy A, et al Prescription Audit towards Quality Car
100 PSQI J, Vol. 8, No. 2, Spr 2020
Therefore, prescription writing needs to be properly addressed concerning its correctness and appropriateness. Moreover, compliance and outcome of therapy are totally dependent on the doctor-patient relationship, communication skills of both, the physician's commitment and empathy towards the patient, and patient's compliance with the prescription (2). In India, the Medical Council of India (MCI) mandates that prescriptions are written in generics, are legible, and follow the World Health Organization (WHO) guidelines for a rational prescription. The same is a requirement by the National Accreditation Board for Hospitals and Health-care Providers (NABH) towards quality indicators of Management of Medication (MOM) (3-5). The audition of the medication orders is thus a quality improvement process that enhances patient care. A recent clinical audit conducted by a team of pharmacists in India concluded that despite several attempts to bring rationality in the prescribing pattern, no effective impacts of any attempts have brought potential minimization in the medication errors, and there is still the need for vigorous surveillance (6).They concluded that the legibility problem encounters the major medication error in the wards, and sometimes it is proven to be fatal in emergency cases. They have also documented that the drugs prescribed by generic names are much higher, compared to other Indian studies conducted around the year 2013. With this background in mind, this study aimed to audit the medication orders towards quality indicators at a tertiary care teaching hospital in South India.
Material and Methods
A prospective audit of medication orders was conducted at 1500 bedded tertiary care hospital (Vydehi Institute of Medical Sciences and Research Centre), Bengaluru, India. The prescription data of the inpatients admitted to the hospital from December 2018 to November 2019 were collected from various clinical departments, as well as the Medical Records Department (MRD), and transcribed on a pre-designed audit form. There was no interaction with the patients, and the patient case sheets were referred
after taking prior permission from the hospital authority. The audit form covered such information as the inpatient number, clinical diagnoses, number of drugs prescribed by generic name, drugs written down in capitals, legibility, drug-drug interactions, clinical review, and doctors’ signature. Moreover, the prescriptions of the indoor patients were reviewed only after 48 h of the patient’s admission to the hospital. A total of 15-20 orders were evaluated daily and double checked by the researchers in this study.All collected data were recorded and analyzed using the MS Excel spreadsheet and Microsoft Office 2010. After data transcription and cleaning, few prescribing indicators were calculated using the following formula adopted from the manual of prescribing indicators by WHO (7). a) An average number of drugs per prescription=Total number of drugs prescribed/Total number of prescriptions encountered. b) Percentage of drugs prescribed by generic name=Number of drugs prescribed by generic name/Total number of drugs prescribed*100
Results
A total of 400 medication orders were audited every month, and therefore, 4800 prescriptions were audited over one year.
1. Department wise distribution of data Out of 4800 prescription audits, general medicine had the highest order frequency (n=956, 19.91%) followed by obstetrics and gynaecology (n=732, 15.25%), general surgery (n=714, 14.87%), paediatrics (n=452, 9.41%), and orthopaedics (n=395, 8.22%). Moreover, the order frequencies of cardiology, emergency medicine, urology, respiratory medicine, as well as ear, nose and throat were 6.29% (n=302), 5.62% (n=270), 4.75% (n=228), 3.60% (n=173), and 08% (n=1483), respectively. Furthermore, the lower order frequencies belonged to ophthalmology (n=120, 2.5%), gastroenterology (n=102, 2.12%), neurosurgery (n=83, 1.72%), psychiatry (n=71, 1.47%), oncology (n=20, 0.41%), endocrinology (n=13, 0.27%), dermatology (n=11, 0.22%), and other departments 0.20% (n=10) (Figure 1).
Prescription Audit towards Quality Care Chakraborthy A, et al
PSQI J, Vol. 8, No. 2, Spr 2020 101
Fig 1: Department wise distribution of data
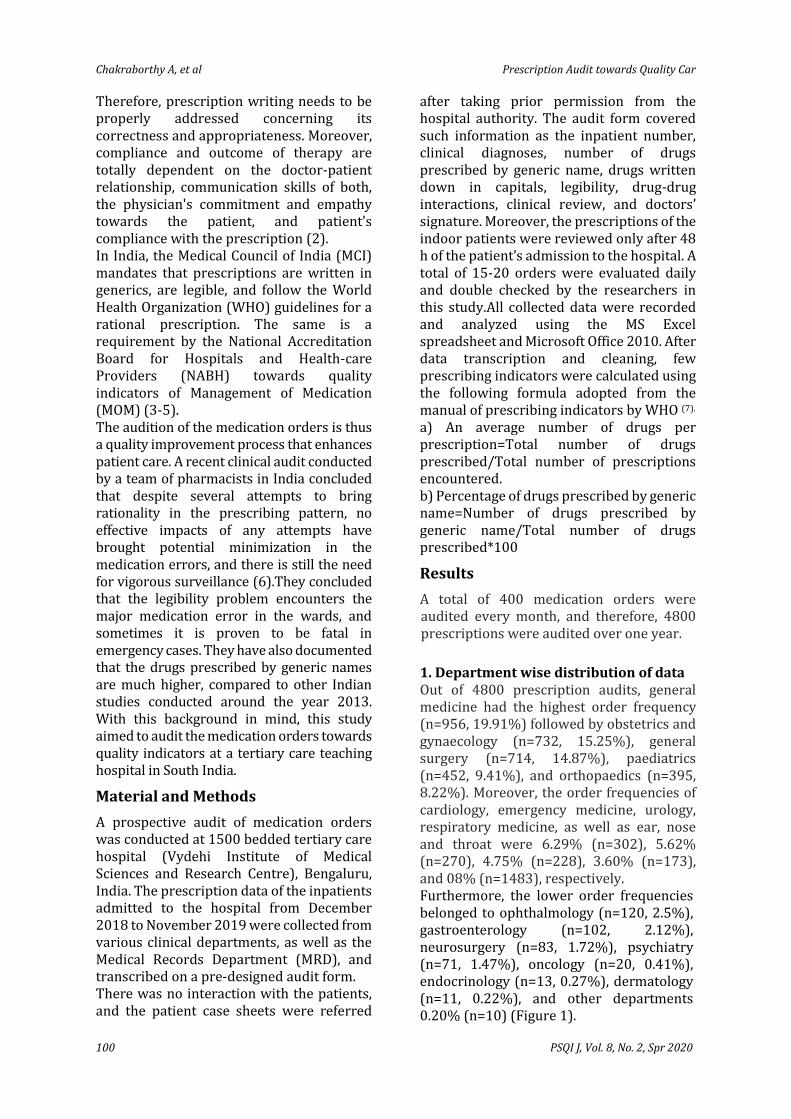
2. Compliance with the medication orders Out of 4800 prescriptions, 3408 (71%) of the medications were prescribed in capitals. Moreover, 4656 (97%) and 2256 (47%) medications were legible and were written in generics, respectively. It was observed
that most of the prescribers failed to document advice on drug-drug and drug-food interactions. The results are shown in Figure 2.
Fig 2: Compliance with the medication orders
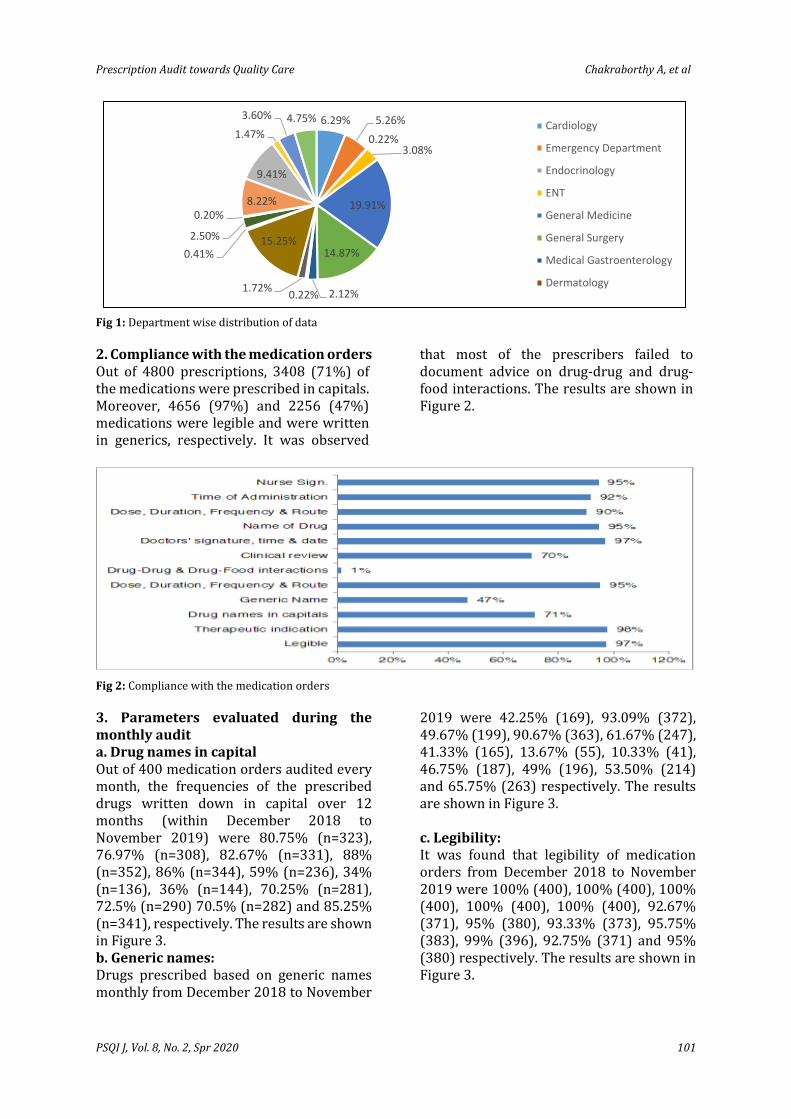
3. Parameters evaluated during the monthly audit a. Drug names in capital Out of 400 medication orders audited every month, the frequencies of the prescribed drugs written down in capital over 12 months (within December 2018 to November 2019) were 80.75% (n=323), 76.97% (n=308), 82.67% (n=331), 88% (n=352), 86% (n=344), 59% (n=236), 34% (n=136), 36% (n=144), 70.25% (n=281), 72.5% (n=290) 70.5% (n=282) and 85.25% (n=341), respectively. The results are shown in Figure 3. b. Generic names: Drugs prescribed based on generic names monthly from December 2018 to November
2019 were 42.25% (169), 93.09% (372), 49.67% (199), 90.67% (363), 61.67% (247), 41.33% (165), 13.67% (55), 10.33% (41), 46.75% (187), 49% (196), 53.50% (214) and 65.75% (263) respectively. The results are shown in Figure 3. c. Legibility: It was found that legibility of medication orders from December 2018 to November 2019 were 100% (400), 100% (400), 100% (400), 100% (400), 100% (400), 92.67% (371), 95% (380), 93.33% (373), 95.75% (383), 99% (396), 92.75% (371) and 95% (380) respectively. The results are shown in Figure 3.
6.29% 5.26%
0.22%3.08%
19.91%
14.87%
2.12%0.22%1.72%
15.25%0.41%
2.50%
0.20%8.22%
9.41%
1.47%
3.60% 4.75%Cardiology
Emergency Department
Endocrinology
ENT
General Medicine
General Surgery
Medical Gastroenterology
Dermatology
Chakraborthy A, et al Prescription Audit towards Quality Car
102 PSQI J, Vol. 8, No. 2, Spr 2020
Fig 3: Parameters evaluated during monthly audit
d. Dose, duration, frequency, and route Dose, duration, frequency, and route were clubbed together and audited. If any one of them was incomplete, it was given a score of zero. Considering the completeness of the orders in terms of these four parameters and over a 12-month period (within December 2018 to November 2019), the corresponding values were 98% (n=392), 94.74% (n=379), 100% (n=400), 96% (n=384), 80.67% (n=323), 89.67% (n=359), 82% (n=328), 89% (n=356), 94.25% (n=377), 98.25% (n=393), 99.5% (n=398), and 99.5% (n=398), respectively (Figure 3). e. Doctors’ signature accompanied by time and date The adherence frequencies to signature accompanied by time and date by the physician over a 12-month period (within December 2018 to November 2019 were
obtained at 99.75% (n=397), 100% (n=400), 99.67% (n=399), 100% (n=400), 100% (n=400), 93% (n=372), 79.67% (n=319), 92.33% (n=369), 98% (n=392), 99.25% (n=397), 99.75% (n=399), and 100% (n=400), respectively (Figure 3).
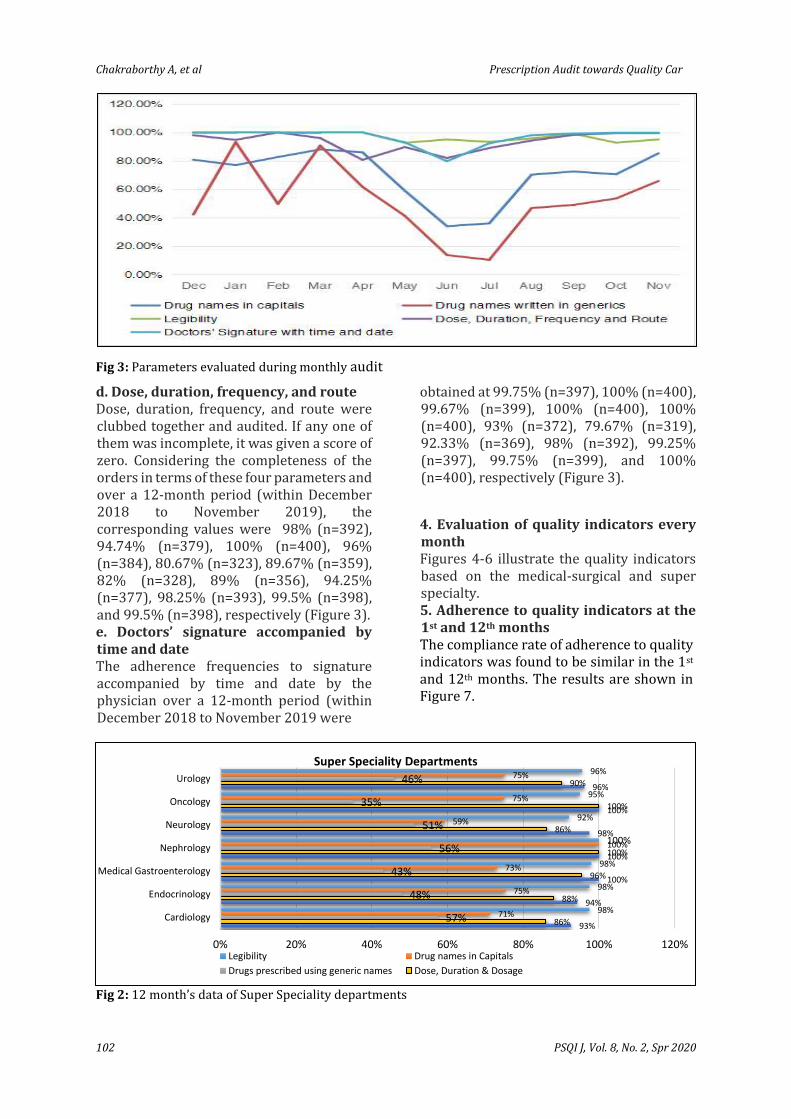
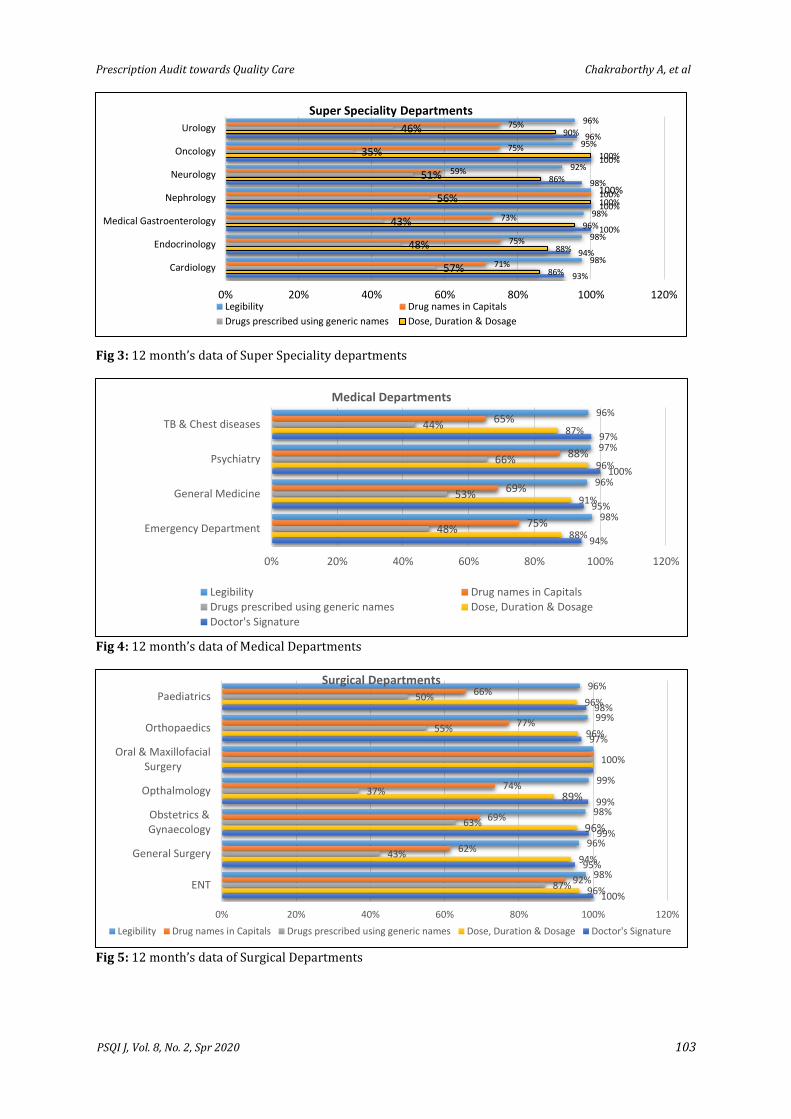
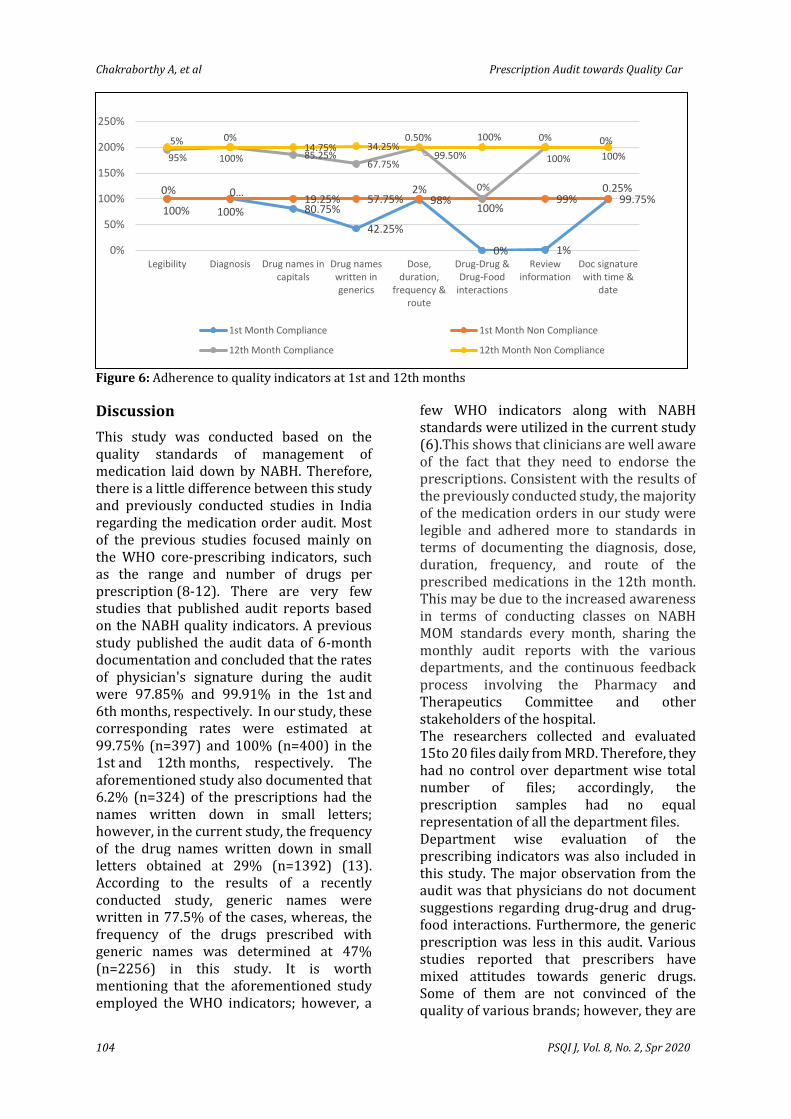
4. Evaluation of quality indicators every month Figures 4-6 illustrate the quality indicators based on the medical-surgical and super specialty. 5. Adherence to quality indicators at the 1st and 12th months The compliance rate of adherence to quality indicators was found to be similar in the 1st and 12th months. The results are shown in Figure 7.
Fig 2: 12 month’s data of Super Speciality departments
93%
94%
100%
100%
98%
100%
96%
86%
88%
96%
100%
86%
100%
90%
57%
48%
43%
56%
51%
35%
46%
71%
75%
73%
100%
59%
75%
75%
98%
98%
98%
100%
92%
95%
96%
0% 20% 40% 60% 80% 100% 120%
Cardiology
Endocrinology
Medical Gastroenterology
Nephrology
Neurology
Oncology
Urology
Super Speciality Departments
Legibility Drug names in Capitals
Drugs prescribed using generic names Dose, Duration & Dosage
Prescription Audit towards Quality Care Chakraborthy A, et al
PSQI J, Vol. 8, No. 2, Spr 2020 103
Fig 3: 12 month’s data of Super Speciality departments
Fig 4: 12 month’s data of Medical Departments
Fig 5: 12 month’s data of Surgical Departments
93%
94%
100%
100%
98%
100%
96%
86%
88%
96%
100%
86%
100%
90%
57%
48%
43%
56%
51%
35%
46%
71%
75%
73%
100%
59%
75%
75%
98%
98%
98%
100%
92%
95%
96%
0% 20% 40% 60% 80% 100% 120%
Cardiology
Endocrinology
Medical Gastroenterology
Nephrology
Neurology
Oncology
Urology
Super Speciality Departments
Legibility Drug names in Capitals
Drugs prescribed using generic names Dose, Duration & Dosage
94%
95%
100%
97%
88%
91%
96%
87%
48%
53%
66%
44%
75%
69%
88%
65%
98%
96%
97%
96%
0% 20% 40% 60% 80% 100% 120%
Emergency Department
General Medicine
Psychiatry
TB & Chest diseases
Medical Departments
Legibility Drug names in CapitalsDrugs prescribed using generic names Dose, Duration & DosageDoctor's Signature
100%
95%
99%
99%
97%
98%
96%
94%
96%
89%
96%
96%
87%
43%
63%
37%
100%
55%
50%
92%
62%
69%
74%
77%
66%
98%
96%
98%
99%
99%
96%
0% 20% 40% 60% 80% 100% 120%
ENT
General Surgery
Obstetrics &Gynaecology
Opthalmology
Oral & MaxillofacialSurgery
Orthopaedics
Paediatrics
Surgical Departments
Legibility Drug names in Capitals Drugs prescribed using generic names Dose, Duration & Dosage Doctor's Signature
Chakraborthy A, et al Prescription Audit towards Quality Car
104 PSQI J, Vol. 8, No. 2, Spr 2020
Figure 6: Adherence to quality indicators at 1st and 12th months
Discussion
This study was conducted based on the quality standards of management of medication laid down by NABH. Therefore, there is a little difference between this study and previously conducted studies in India regarding the medication order audit. Most of the previous studies focused mainly on the WHO core-prescribing indicators, such as the range and number of drugs per prescription (8-12). There are very few studies that published audit reports based on the NABH quality indicators. A previous study published the audit data of 6-month documentation and concluded that the rates of physician's signature during the audit were 97.85% and 99.91% in the 1st and 6th months, respectively. In our study, these corresponding rates were estimated at 99.75% (n=397) and 100% (n=400) in the 1st and 12th months, respectively. The aforementioned study also documented that 6.2% (n=324) of the prescriptions had the names written down in small letters; however, in the current study, the frequency of the drug names written down in small letters obtained at 29% (n=1392) (13). According to the results of a recently conducted study, generic names were written in 77.5% of the cases, whereas, the frequency of the drugs prescribed with generic names was determined at 47% (n=2256) in this study. It is worth mentioning that the aforementioned study employed the WHO indicators; however, a
few WHO indicators along with NABH standards were utilized in the current study (6).This shows that clinicians are well aware of the fact that they need to endorse the prescriptions. Consistent with the results of the previously conducted study, the majority of the medication orders in our study were legible and adhered more to standards in terms of documenting the diagnosis, dose, duration, frequency, and route of the prescribed medications in the 12th month. This may be due to the increased awareness in terms of conducting classes on NABH MOM standards every month, sharing the monthly audit reports with the various departments, and the continuous feedback process involving the Pharmacy and Therapeutics Committee and other stakeholders of the hospital. The researchers collected and evaluated 15to 20 files daily from MRD. Therefore, they had no control over department wise total number of files; accordingly, the prescription samples had no equal representation of all the department files. Department wise evaluation of the
prescribing indicators was also included in this study. The major observation from the audit was that physicians do not document suggestions regarding drug-drug and drug-food interactions. Furthermore, the generic prescription was less in this audit. Various studies reported that prescribers have mixed attitudes towards generic drugs. Some of them are not convinced of the quality of various brands; however, they are
100% 100% 80.75%
42.25%
98%
0% 1%
99.75%0% 0…
19.25% 57.75%2%
100%99%
0.25%
95% 100% 85.25%67.75%
99.50%
0%
100% 100%
5% 0%14.75% 34.25%
0.50% 100% 0% 0%
0%
50%
100%
150%
200%
250%
Legibility Diagnosis Drug names incapitals
Drug nameswritten ingenerics
Dose,duration,
frequency &route
Drug-Drug &Drug-Food
interactions
Reviewinformation
Doc signaturewith time &
date
1st Month Compliance 1st Month Non Compliance
12th Month Compliance 12th Month Non Compliance
Prescription Audit towards Quality Care Chakraborthy A, et al
PSQI J, Vol. 8, No. 2, Spr 2020 105
concerned about the patient's confusion following substitution (14). Keeping this in mind, every department in our hospital was asked to give two generic preferences for the commonly used drugs, which were then updated in the hospital formulary. Moreover, the electronic prescription is encouraged where they are given these two generic options along with two brands. Regular orientation is conducted to make clinicians aware of the benefits of generic prescription and recent MCI update on prescriptions in generics (15). To the best of our knowledge, this is the first study on the prescription audit based on the NABH MOM standards from a medical teaching institution in India. It should be noted that the present study facilitated the accreditation of the current status of the prescription audit process. Based on the findings, it can be concluded that the enhancement of quality and patient safety is a combined approach that requires the involvement of various stakeholders. This study was initiated with a small adherence at our institute; however, it was improved over time, and additional parameters have been added so far to our audit forms, such as drug reconciliation and error-prone abbreviations. Future studies with more data are recommended to include more centers to get an idea about MOM standards in India.
References
1. World Health Organization (WHO) The World Medicine Situation. Geneva: World Health Organization Press. World Health Organization; 2004. Available at https://apps. who.int/ medicinedocs/ pdf/s6160e/s6160e.pdf, accessed on December 10 2018. 2. Batta A, Singh B. Rational approach to prescription writing: A preview. Neurol India 2018; 66:928-33. 3. Medical Council of India: Code of Medical Ethics Regulations. 2002. Available from https:// www.mciindia.org/CMS/rules-regulations/code-of-medical-ethics-regulations-2002. 4. NABH: Pre Accreditation Entry Level Standards for AYUSH Hospitals 2018. Available from https://www. nabh.co/Announcement/ AYUSH%20Hosp%20Entry%20Level.pdf
5. Documented policies and procedures guide the safe and rational prescription of medications. Available at: https://www. nabh.co/Announcement/DraftAccreditationStandardsfor Hospital4thEdition.pdf, accessed on December 20, 2018. 6. Naresh Sah, Balakeshwa Ramaiah*, Raju Koneri. The Pharmacist Role in Clinical Audit at an Indian Accredited Hospital: An Interventional Study. IJOPP 2019; Volume 12, Issue 2; 117-125. 7. WHO. How to Investigate Drug Use in Health Facilities: Selected Drug Use Indicators – EDM Research Series No. 007. 1993. (Last accessed on 2015 May 05). Available from: http://www.apps.who.int/medicinedocs/en/d/Js2289e/ 8. Batta A, Madan N, Kalra BS, Arora S. Prescription audit, drug utilization pattern and adverse drug reaction monitoring in outpatients of orthopedic department of tertiary care teaching hospital: A pilot study. MAMC J Med Sci 2019;5: 77-82. 9. Singh T, Banerjee B, Garg S, Sharma S. A prescription audit using the World Health Organization-recommended core drug use indicators in a rural hospital of Delhi. J Educ Health Promot. 2019;8:37. 10. Muraraiah S, Rajarathna K, Vishwanath M, Ramaswamy A, Kamath SD, Seshu S et al. Evaluation of WHO prescribing indicators among orthopaedic in-patients at a tertiary care hospital. J Chem Pharm Res 2014;6:278-80. 11. Rajeshwari Hanumantharaya N. Drug utilization study in postoperative patients in obstetrics and gynaecology ward of tertiary care hospital. Int J Basic Clin Pharmacol 2016;5: 329-34. 12. Potharaju HR, Kabra SG. Prescription audit of outpatient attendees of secondary level government hospitals in Maharashtra. Indian J Pharmacol 2011;43:150-6. 13. Bhowmik S, Jana S, Das A, Saren P. Prescription audit study from a tertiary care private hospital (TCPH) in Kolkata, India. QAI J Healthc Qual Patient Saf 2019;1: 13-8. 14. Toverud EL, Hartmann K, Hakonsen H. A systematic review of physicians' and pharmacists' perspectives on generic drug use: What are the global challenges? .Appl Health Econ Health Policy 2015;13(1): 35-45. 15. Medical Council of India: Circular on Generic Medicine. 2017. Available from https://old.mciindia.org/circulars/Public-Notice-Generic-Drugs-21.04.2017.pdf.