Embed Size (px)
Citation preview

Jean Laherrere «Present & future energy problems» HEC MBA Sustainable Development seminar 8 Sept. 2004
1
Present and future energy problemsJean Laherrère [email protected]
-Present basic facts
-What goes up must come down, life is cycle-what was born will die: sun, earth, mankind, and civilization-constant growth has no future in a limited worldbacteria doubling every half an hour in a world without constraints will occupy the solarsystem in one week and the universe in 11 days!-several peaks and symmetrical cycles as Atlantic cod rise, fall and extinctionFigure 1: Cod landings for Northern Atlantic Fisheries Organization
Cod landings for North Atlantic Fisheries Organization
0
100
200
300
400
500
600
700
800
1850 1875 1900 1925 1950 1975 2000year
H1+H2+H3
Berkeley data
territorial limit in mile
2yr moratorium
http://www.osglobec.berkeley.edu/usglobec/Reports/Jean Laherrere
cod wars UK-Iceland
technological progress: trawlers
cycle=cod generation
Figure 2: US drilling activity modeled with 7 cycles

Jean Laherrere «Present & future energy problems» HEC MBA Sustainable Development seminar 8 Sept. 2004
2
The US stock market in percentage of the GDP when displayed since 1870 shows several lowcycles with two peaks one in 1930 with the depression and another a little lower in 2000.Figure 3: US stock market in % of GDP 1875-2001
(Le Figaro Economie 12-13 Octobre 2002 pII)The US credit market debt in % of GDP shows also a rise reminding the depression of the 30sFigure 4:US total credit market debt as % of GDP
Jean Laherrere «Present & future energy problems» HEC MBA Sustainable Development seminar 8 Sept. 2004
3
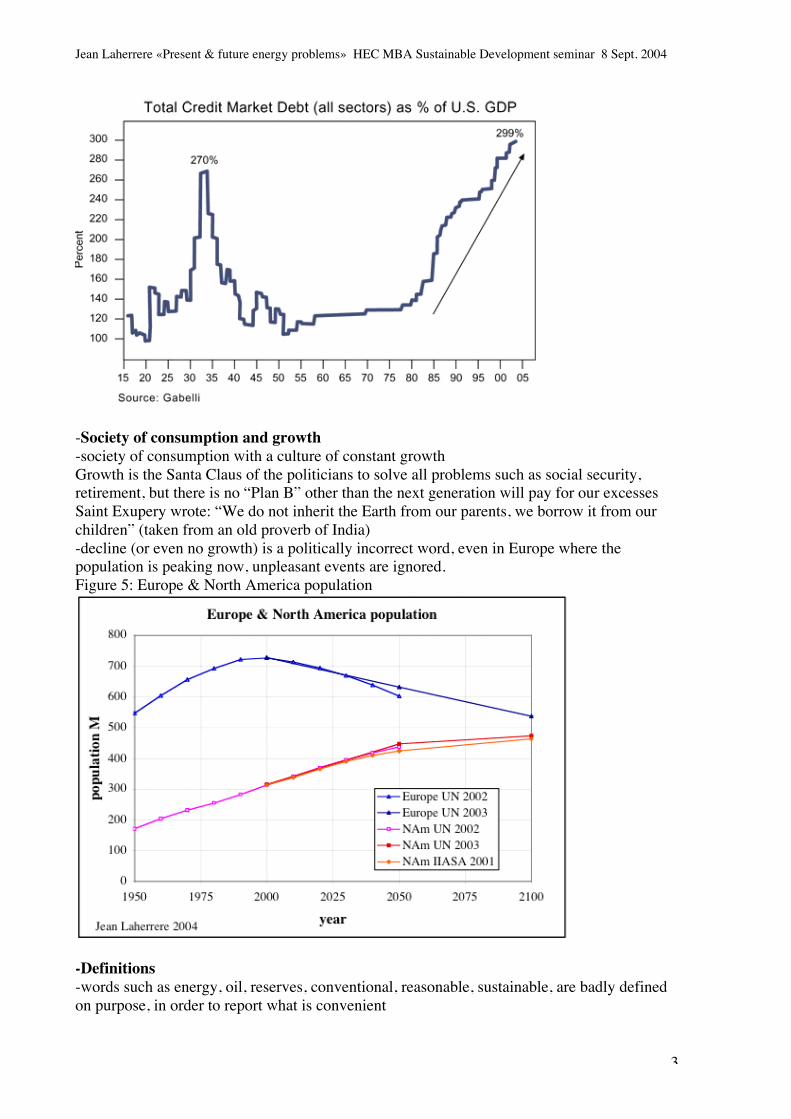
-Society of consumption and growth-society of consumption with a culture of constant growthGrowth is the Santa Claus of the politicians to solve all problems such as social security,retirement, but there is no “Plan B” other than the next generation will pay for our excessesSaint Exupery wrote: “We do not inherit the Earth from our parents, we borrow it from ourchildren” (taken from an old proverb of India)-decline (or even no growth) is a politically incorrect word, even in Europe where thepopulation is peaking now, unpleasant events are ignored.Figure 5: Europe & North America population
-Definitions-words such as energy, oil, reserves, conventional, reasonable, sustainable, are badly definedon purpose, in order to report what is convenient

Jean Laherrere «Present & future energy problems» HEC MBA Sustainable Development seminar 8 Sept. 2004
4
-most debates come from lack of clear definition-gas is gasoline for the Americans, but natural gas for the rest of the world-the product oil is also badly defined and oil production can be either 70 Mb/d for crude,including some condensate but not NGL (Natural Gas Liquids), or 80 Mb/d for liquids (the oildemand is for liquids), or regular oil (Campbell) 60 Mb/d. Condensate (at wellhead) and NGL(at gas plants) are badly reported. The demand is almost always for liquids, but supply is oftenfor crude oil: OPEC quotas are only for crude oil.-as OPEC members cheat on quotas, production data is badly reported and the only reliabledata on shipped oil on seas is from a scout company: Petrologistics in Geneva with spies inevery harbor. Losses or thefts are not reported-oil is reported in barrel, cubic meter or tonne, but barrel has no legal definition, except anindustrial one and USDOE, in their reports, are obliged to add after the unit barrel “(42 USgallons)”, when legal liquid barrel in Texas is 31.5 US gallons-converting oil in barrels into oil in tonnes requires knowing the density of the oil, but it isoften unspecified and it varies with time for the same field.-symbol bbl often used for barrel has no known meaning and could be a blue barrel to indicatecrude oil-wooden barrels stood in the beginning for 30 to 50 US gallons and around 1870 werereplaced by 42 gallons, being millions, but none has survived.
-Energy-energy unit is the Joule, which is also the unit for heat, work-unit system: every country outside the US, Liberia and Bangladesh use the SystemInternational of units (SI), so there are two worlds: metric and non metric: Mars ClimateOrbitor was lost because NASA sent the instructions in metric when the probe was built non-metric.-heat can be a goal but also a nuisance, calorie is obsolete and replaced by Joule-power is defined from energy, as one watt is one joule per second and MWh is 3.6 GJ-energy is always conserved (energy is not created but degraded) but changes in quality(entropy increases going towards chaotic status (heat))-only commercial energy is taken into account in most studies-food is also energy as muscles work (human and animal) The Roman Empire was built byslaves.-energy equivalence needs assumption and is badly explained and handled. The so-calledenergy mix is poorly reported. France changed conventions in 2001 and the change wasdrastic-hydrogen is not energy, but a vector as electricity
-Reserves: Uncertainty is presented as certainty-reserves represent what will be recovered in future or expected future production-resource is what is in the ground; reserves are only a small part of resource-reserves are always used with plural, but almost always given with one value, when theyshould be reported as a range-reserves are uncertain, but many definition as the SEC rules deal with “reasonable certainty“(as FDA for new product) and refuses the probabilistic approach because the risk aversion ofbankers and shareholders-reserve growth occurs when reserves are reported as the minimum but not statistically whenreported as mean (expected) value

Jean Laherrere «Present & future energy problems» HEC MBA Sustainable Development seminar 8 Sept. 2004
5
-there is no worldwide reserve rule and the SEC (Securities and Exchange Commission) rulesfor the companies listed in the US are obsolete and different from the rest of the world,obliging to ignore probable reserves and probabilistic approach.-uncertainty should be represented by reporting a large range with 3 values: minimum, mostlikely or mean, maximum), but medias and stock markets want only one value.-uncertainty versus certainty; deterministic approach versus probabilistic approach; riskaversion.Experts are assumed to be always right. Explorers are wrong 8 times out of ten in wildcatdrilling. Managers and engineers are more risk averse than explorers.-any measure has to be reported with a number of significant digits compatible with theaccuracy of the measure, but now few bother to estimate the accuracy and most reserve dataare given with an unrealistic accuracy. Reporting any data with more than 2 significant digitsshows that the author is incompetent.-unequal distribution: out of more than 50 000 oil & gas fields less than 2% are giants fields(over 500 Mboe) and they retain over 75 % of the total discoveries.-law of diminishing return = creaming curve= cumulative discoveries (mean values) versuscumulative number of New Field Wildcats = NFWSaudi Arabia displays a poor return not by lack of exploration but of large fieldsFigure 6: Saudi Arabia creaming curve
The estimates on the total discoveries 2P varies from 236 Gb (WM) to 391 Gb (SaudiAramco).-UNFC reserve rules issued in 1997 were never accepted by the oil industry and the newclassification to gather petroleum, coal and uranium is a poor compromise, hiding underwords the discrepancy between fossil fuels-OPEC members fight between themselves on the quotas, which are based in particular onreserves. Between 1985 and 1990 OPEC members increased their oil reserves by more than50% and 300 Gb was added (gas reserves were not)-publishing data is a political act and depends upon the image the author wants to give (rich infront of banker (or quotas) or poor in front of taxes). The author chooses within the largerange of uncertainty the value he prefers (close to minimum or maximum). It is why reserve

Jean Laherrere «Present & future energy problems» HEC MBA Sustainable Development seminar 8 Sept. 2004
6
definitions are numerous, ambiguous or badly used. The most flawed data come from theOPEC members because of the fight for the quotas. The so-called worldwide accepted reservedefinition by SPE/WPC/AAPG is not respected and contains contradictory items (probable)-remaining reserves data from political sources (published by OPEC, BP Review, Oil and GasJournal (OGJ), World Oil (WO)) reporting current proved reserves show an always risingtrend, when the technical data (based on backdated mean (expected value) reserves reportedby scout companies (IHS (former Petroconsultants) or Wood Mackenzie (WM) shows adecline since 1980. Aggregation of mean values is correct when it is not for proved values (aMonte Carlo simulation should be run).There are three worlds, the world of economists having only access to political data, believingthat technology can do anything, the world of technicians having access to real data andknowing the limits of techniques and the world of managers or politicians who have to showgrowth to be well considered.Figure 7: World remaining conventional oil & gas reserves from political and technicalsources
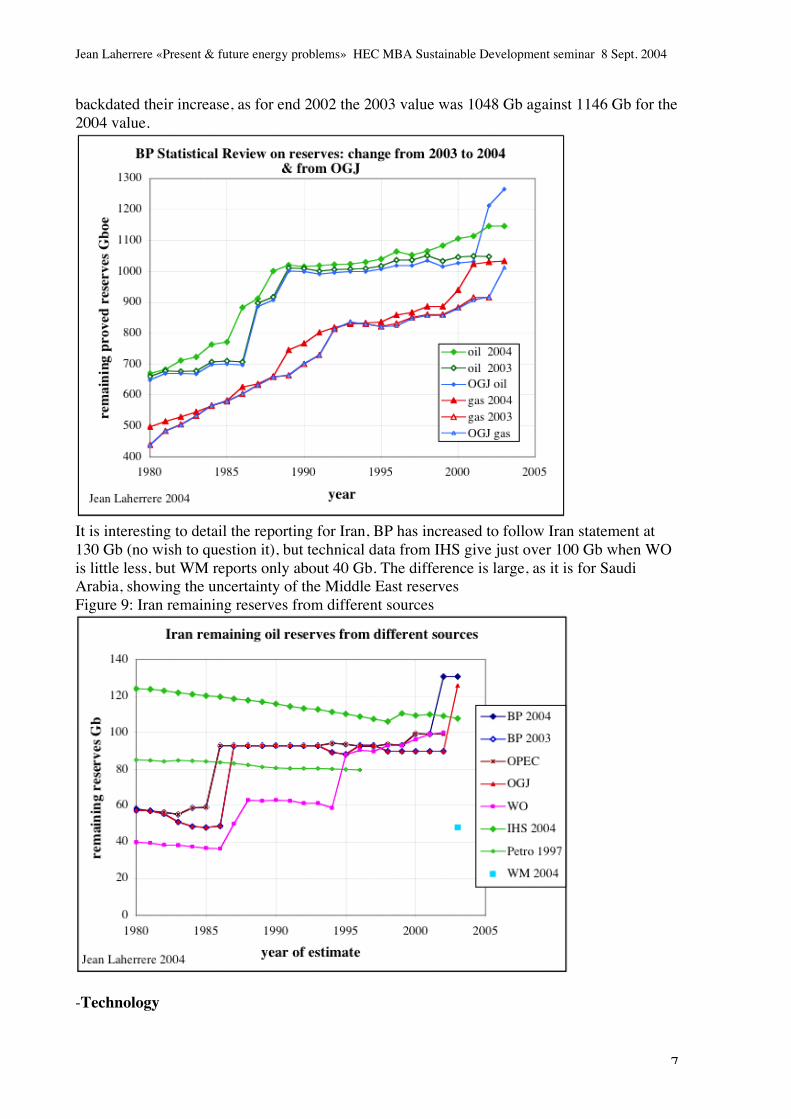
Political reserves at year end are reported by governments before the end of the year(technical studies are not done yet) as an answer to an enquiry sent by OGJ and the results arepublished by OGJ the last week of December as remaining proved reserves (under SEC rules,proved reserves should be estimated with oil price on December 31st, when they are not yetknown!). The estimates were the current values and were never revised by OGJ whereas WOrevises them for the previous year. BP Statistical Review was reporting OGJ data and not itsown data on order not to upset OPEC members (they did it once in the past but werereprimanded and they do not want to do it again). These reserves up to 2003 were assumed tobe conventional estimates excluding oilsands and natural gas liquids (NGL) outside US andCanada, but the production data was including these oilsands and NGL. As in 2003 OGJincluded for Canada 175 Gb of reserves from the Athabasca oilsands (making Canada thesecond largest in front of Iraq), BP did not follow six months later. But in 2004 they includefor Canada the part of the oilsands reportedly developed by the Canadians (11 Gb), andincrease the previous estimate of end of 2002 by 99 Gb. But in order not to attribute thisincrease to 2003 discoveries, they revised their previous estimates since 1980. In fact they
Jean Laherrere «Present & future energy problems» HEC MBA Sustainable Development seminar 8 Sept. 2004
7
backdated their increase, as for end 2002 the 2003 value was 1048 Gb against 1146 Gb for the2004 value.
It is interesting to detail the reporting for Iran, BP has increased to follow Iran statement at130 Gb (no wish to question it), but technical data from IHS give just over 100 Gb when WOis little less, but WM reports only about 40 Gb. The difference is large, as it is for SaudiArabia, showing the uncertainty of the Middle East reservesFigure 9: Iran remaining reserves from different sources
-Technology
Jean Laherrere «Present & future energy problems» HEC MBA Sustainable Development seminar 8 Sept. 2004
8
-is technology the solution or the problem (as for cod)?-technology is the Santa Claus of the economists, but they refuse to listen to technicians-technology allows faster and cheaper production of conventional fields but no increase ofrecovery ratio. Recovery ratios vary from 3% (fractured compact reservoir) to 85% (veryporous reef). Technology (or higher price) cannot change the geology of the reservoir. But forunconventional fields (extra-heavy oils, tarsands, coalbed methane or tight sands) technology(and higher price) does increase recovery.-what is presented as new technology (3D, horizontal wells) is more than 30 years old andused widely on producing fields-contrary to gold or copper, where economy rules the minimum economic concentration, thelimit of fossil fuels are ruled by the net energy, when more energy is invested to extract a fuelthan the energy return, the extraction must cease and subsidies are useless. The concentrationof a conventional oilfield or gasfield is 100% oil or gas over water. Ethanol from corn isreported by Prof. Pimentel as a negative net energy. Gold can be mined at 4000 m depth, butnot coal because net energy would be negative.
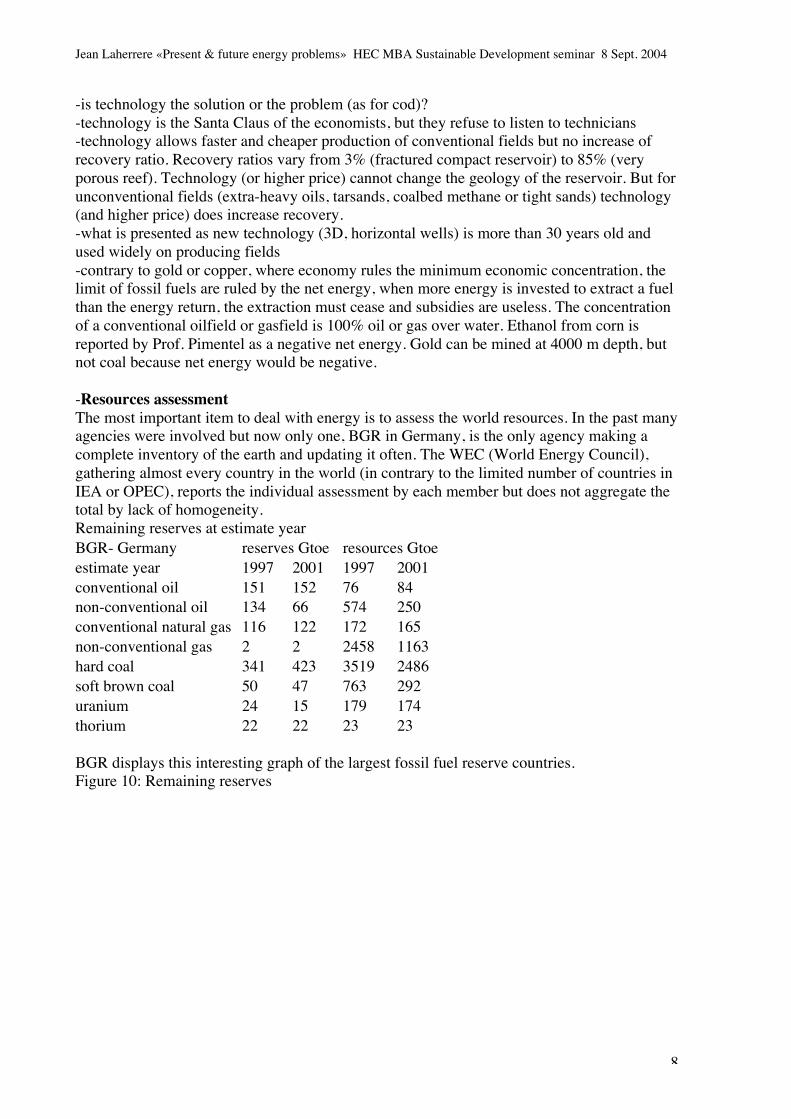
-Resources assessmentThe most important item to deal with energy is to assess the world resources. In the past manyagencies were involved but now only one, BGR in Germany, is the only agency making acomplete inventory of the earth and updating it often. The WEC (World Energy Council),gathering almost every country in the world (in contrary to the limited number of countries inIEA or OPEC), reports the individual assessment by each member but does not aggregate thetotal by lack of homogeneity.Remaining reserves at estimate yearBGR- Germany reserves Gtoe resources Gtoeestimate year 1997 2001 1997 2001conventional oil 151 152 76 84non-conventional oil 134 66 574 250conventional natural gas 116 122 172 165non-conventional gas 2 2 2458 1163hard coal 341 423 3519 2486soft brown coal 50 47 763 292uranium 24 15 179 174thorium 22 22 23 23
BGR displays this interesting graph of the largest fossil fuel reserve countries.Figure 10: Remaining reserves

Jean Laherrere «Present & future energy problems» HEC MBA Sustainable Development seminar 8 Sept. 2004
9
-Future problems
-Oil-oil reserves and probabilityAs said above, reserves are badly defined and estimated, since publishing reserves is apolitical act (in Russia it is State secret and reporting leads to 7 years jail).US proved reserves, under SEC rules (compulsory), are the quantity estimated with“reasonable certainty” to be recovered with present conditions. The definition of reasonablemay vary, according to the assessor, from 51% to 99%. Under the SPE/WPC/AAPG rules (notcompulsory) proved reserves are estimated to be recovered with a probability of 90%.But from the past 25 years of USDOE of annual reports publishing the new discoveries plusthe revisions of past discoveries, the simple ratio of positive revisions of past discoveriesversus the negative plus positive revisions gives the probability of these proved reserves. It isobvious that the probability was for oil about 75 % in 1970 and it is now down to 55% (it wasless than 50% in 2001) and for natural gas and natural gas liquids it was about 50% around1980, it increased a little and now again back to 50%. It means that the so-called US provedreserves are now in fact proven plus probable reserves.Figure 11: US revisions of proved oil & gas reserves giving the probability of the, estimate

Jean Laherrere «Present & future energy problems» HEC MBA Sustainable Development seminar 8 Sept. 2004
10
Where discoveries were large and many, producers were reporting only a part keeping the restfor leaner years. Now that discoveries are small and scarce, the largest value is reported fromstart.Reserve growth was large in the US because only proved reserves were reported and probablereserves were prohibited, but in the rest of the world where reserves are reported as provedplus probable (close to mean value) reserve growth is statistically nil. (Laherrere 1996, 2004).It is likely that US reserve growth will disappear in future.
-oil production forecastOne of the most used parameter for oil future is the ratio R/P; being the remaining reservesover the present annual production given in years. It is often said that oil R/P is 40 yearssuggesting that there is enough oil for the next 40 years. But first production is assumed togrow and the physics of production cannot allow a constant plateau during 40 years and noproduction on the 41st year. For the US proved reserves, R/P has been around 10 years since1947 where statistics start and shows that this parameter has no meaning. From world provedreserves the oil ratio is almost flat since the start of data, but from technical data it was about120 years in 1950 and the linear extrapolation of the last 20 years gives a no reserve in 2035.Of course the ratio will change trend and should be ignored.Figure 12: R/P from technical and political sources for oil & gas
Jean Laherrere «Present & future energy problems» HEC MBA Sustainable Development seminar 8 Sept. 2004
11
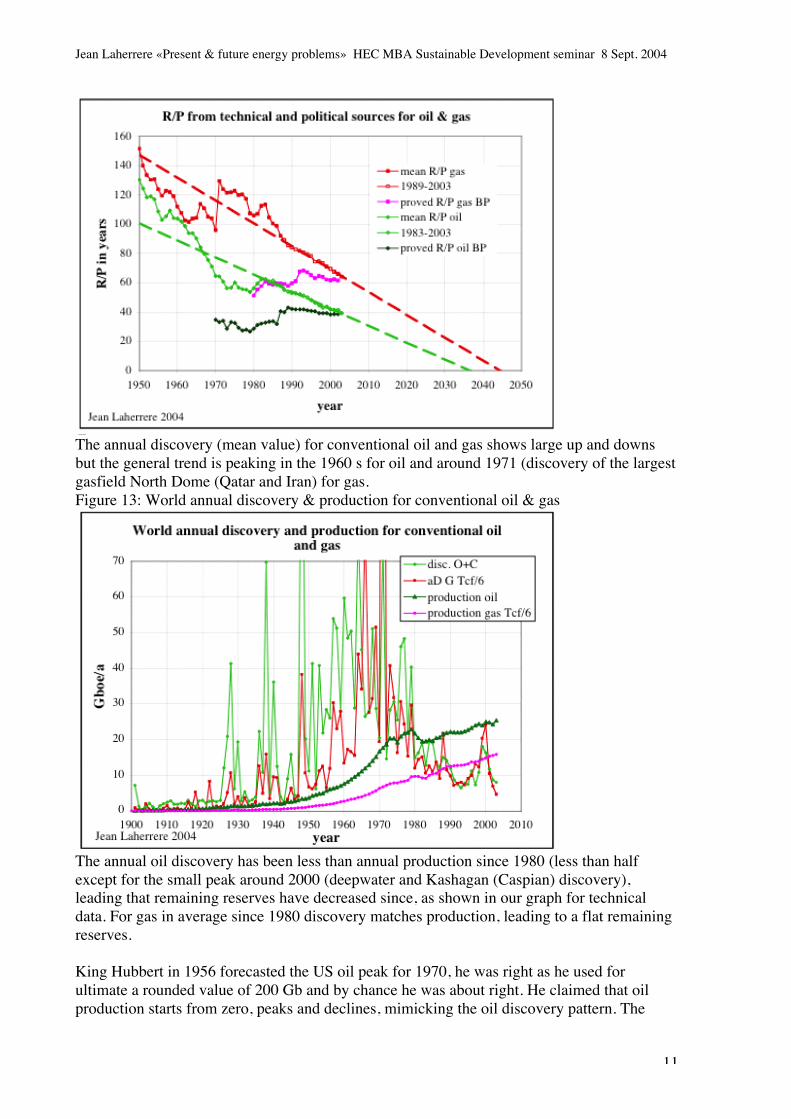
The annual discovery (mean value) for conventional oil and gas shows large up and downsbut the general trend is peaking in the 1960 s for oil and around 1971 (discovery of the largestgasfield North Dome (Qatar and Iran) for gas.Figure 13: World annual discovery & production for conventional oil & gas
The annual oil discovery has been less than annual production since 1980 (less than halfexcept for the small peak around 2000 (deepwater and Kashagan (Caspian) discovery),leading that remaining reserves have decreased since, as shown in our graph for technicaldata. For gas in average since 1980 discovery matches production, leading to a flat remainingreserves.
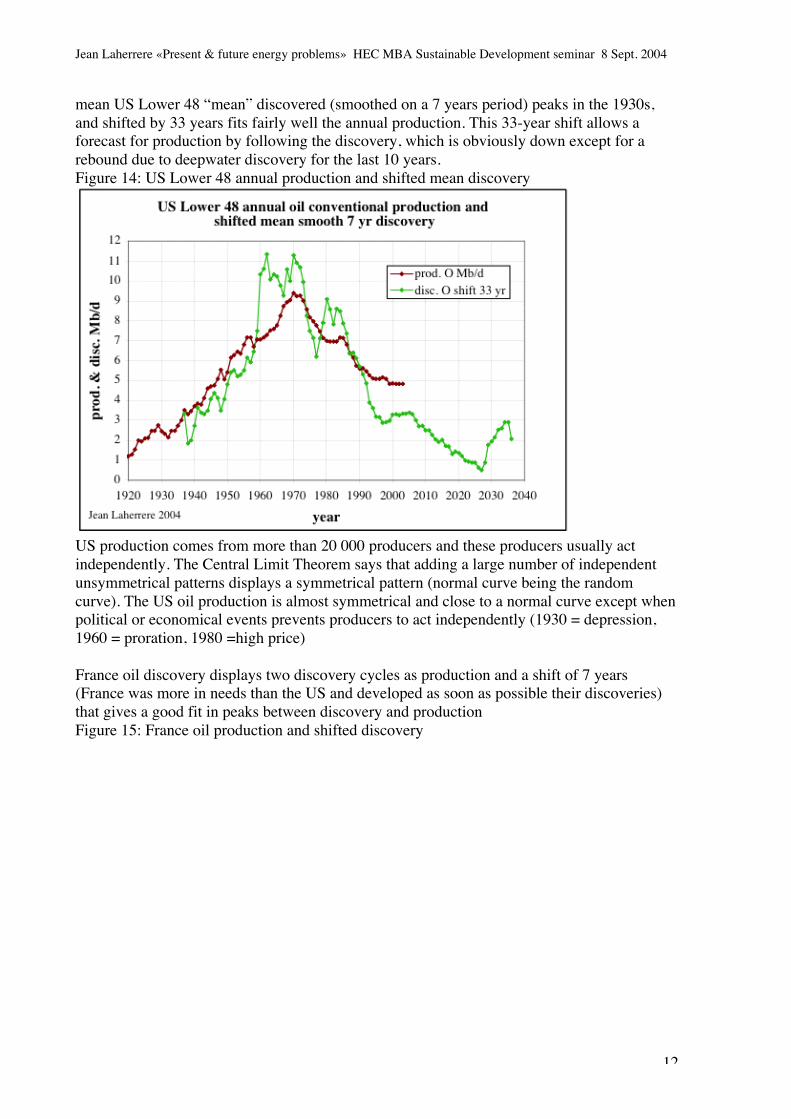
King Hubbert in 1956 forecasted the US oil peak for 1970, he was right as he used forultimate a rounded value of 200 Gb and by chance he was about right. He claimed that oilproduction starts from zero, peaks and declines, mimicking the oil discovery pattern. The
Jean Laherrere «Present & future energy problems» HEC MBA Sustainable Development seminar 8 Sept. 2004
12
mean US Lower 48 “mean” discovered (smoothed on a 7 years period) peaks in the 1930s,and shifted by 33 years fits fairly well the annual production. This 33-year shift allows aforecast for production by following the discovery, which is obviously down except for arebound due to deepwater discovery for the last 10 years.Figure 14: US Lower 48 annual production and shifted mean discovery
US production comes from more than 20 000 producers and these producers usually actindependently. The Central Limit Theorem says that adding a large number of independentunsymmetrical patterns displays a symmetrical pattern (normal curve being the randomcurve). The US oil production is almost symmetrical and close to a normal curve except whenpolitical or economical events prevents producers to act independently (1930 = depression,1960 = proration, 1980 =high price)
France oil discovery displays two discovery cycles as production and a shift of 7 years(France was more in needs than the US and developed as soon as possible their discoveries)that gives a good fit in peaks between discovery and productionFigure 15: France oil production and shifted discovery

Jean Laherrere «Present & future energy problems» HEC MBA Sustainable Development seminar 8 Sept. 2004
13
The world annual oil discovery is shifted by 40 years to try to fit production, guessing a peakin the coming 15 years and for gas by 45 years guessing a peak in the next 25 years.Figure 16: World annual oil & gas production and shifted discovery
The world cumulative conventional oil and gas discovery is close to a logistic curve (curve ofa growing population with resource constraint), tending towards an asymptote, which is calledultimate (2.1 Tb for conventional oil and 1,6 Tboe = 10 Pcf for gas); this ultimate is used tomodel the production curveFigure 17: World conventional oil& gas discoveries and production with logistic models

Jean Laherrere «Present & future energy problems» HEC MBA Sustainable Development seminar 8 Sept. 2004
14
But cumulative discoveries versus time is disturbed by the stop and go of exploration (war,lack of opening, lack of funds) and it is only when they are global that these disturbancesalmost disappear.
-creaming curvesThe best way to estimate ultimate is to draw creaming curves = cumulative discoveries(always mean) versus the cumulative number of new field wildcats (NFW).Figure 18: Conventional oil creaming curve by continent

Jean Laherrere «Present & future energy problems» HEC MBA Sustainable Development seminar 8 Sept. 2004
15
This graph shows the huge inequality of oil distribution where the ME has discovered morethan 800 Gb with less than 4000 NFW (200 Mb/NFW) when Europe has discovered only 100Gb with more than 20 000 NFW (5 Mb/NFW), 40 times less!It is easy to extrapolate creaming (with several hyperbolas) to estimate the ultimate(corresponding to about the double of NFW than presently drilled).
-deepwaterDeepwater is the last frontier. Its definition was first 200 m (the base of the continental shelf),now it is 400 or 500 m, even more. Large discoveries are concentrated in four countries withthe same geological pattern; reservoir being sands from turbidites (sediments coming from theshelf in larger volume and short times in catastrophic event (as the slide of the Nice airport)within a diapyric tectonic (salt or shale).Deepwater is described often as a new technology but in fact this technology started in the 70swith the dynamic positioning drillship.The number of rigs presently in use in water, over 4000 ft, is plotted versus the date ofconstruction and shows 3 cycles, one starting in 1971 but with negative geological results(except in the Gulf of Mexico), a second starting in 1980 with the high oil price and the lastone starting in 1998 with low oil price but looking for large prospects missing onshore and inshallow water.Figure 19: Cumulative number of deepwater drilling rigs in use in 2004, modeled with 3hyperbolas
Sandrea I. Merril Lynch «Deepwater oil discovery rate may have been peaked: productionpeak may follow in 10 years!» (OGJ 26 July 2004) displays the following graph for the fourbig deepwater (>500 m) producers: Gulf of Mexico, Brazil, Angola and Nigeria peaking in2012 at 6 Mb/dFigure 20: Deepwater oil discovery and production from Sandrea

Jean Laherrere «Present & future energy problems» HEC MBA Sustainable Development seminar 8 Sept. 2004
16
The display of the creaming curves (cumulative discoveries versus cumulative number ofexploratory wells) from the data provided in this article shows that Brazil, Angola and Nigeriahave the same pattern and about the same ultimate (20 Gb), when the Gulf of Mexico has alower ultimate (15 Gb) and a less efficient return.Figure 21: Deepwater oil creaming curves from Sandrea
Jean Laherrere «Present & future energy problems» HEC MBA Sustainable Development seminar 8 Sept. 2004
17
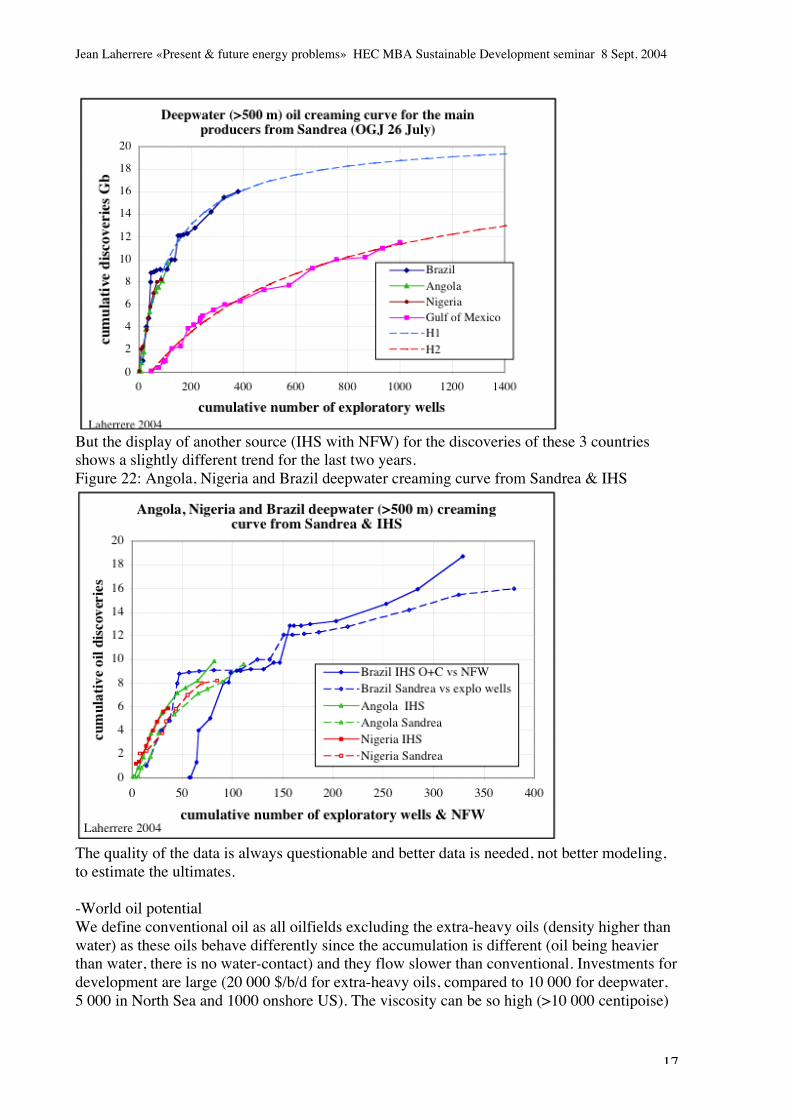
But the display of another source (IHS with NFW) for the discoveries of these 3 countriesshows a slightly different trend for the last two years.Figure 22: Angola, Nigeria and Brazil deepwater creaming curve from Sandrea & IHS
The quality of the data is always questionable and better data is needed, not better modeling,to estimate the ultimates.
-World oil potentialWe define conventional oil as all oilfields excluding the extra-heavy oils (density higher thanwater) as these oils behave differently since the accumulation is different (oil being heavierthan water, there is no water-contact) and they flow slower than conventional. Investments fordevelopment are large (20 000 $/b/d for extra-heavy oils, compared to 10 000 for deepwater,5 000 in North Sea and 1000 onshore US). The viscosity can be so high (>10 000 centipoise)

Jean Laherrere «Present & future energy problems» HEC MBA Sustainable Development seminar 8 Sept. 2004
18
that they are called bitumen (Athabasca in Canada) and needs mining on surface to beextracted or steam in situ.Condensates (extracted at the wellhead) are usually included into conventional oil.Campbell has a different definition for conventional (called regular), since he excludes heavyoil (gravity less than 17 °API), polar and deepwater and regular production is presentlyaround 60 Mb/d.The ultimate of conventional oil (present production 70 Mb/d) is around 2.1 Tb (2100 Gb)and the world is broken down into OPEC, which is subject to quotas and not produced at fullcapacity (up to now!) and the Non-OPEC, which produce at full capacity. Non-OPEC isestimated to peak before 2010 and OPEC after 2010, giving a world peak around 2015 if thereis no demand constraint. If demand is constrained by an economic depression, the productioncan go down as in 1979 and go up later, giving not a peak but a bumpy plateau.Figure 23: World conventional crude oil production and forecast for an ultimate of 2.1 Tb (nodemand constraint)
The oil demand (around 80 Mb/d) includes all liquids, including conventional oil, non-conventional, natural gas liquids (extracted at gas plant, synthetic oil (from gas GTL or coalCTL or from biomass or from oil shale (almost none), and refinery gain of about 1.8 Mb/d(heavy crude is cracked or hydrogenated gaining volume). As the oil (liquids) demand is larger (10 Mb/d) than the oil conventional we need to modelthis difference. Its ultimate is estimated at about 900 Gb to obtain a liquids ultimate of 3 Tb.This rounded figure shows well the uncertainty of this value (over 20%), so the onlyalternative has to be different and we plot also a liquid of 2,6 Tb. The non-conventional oilcan peak either around 2030 or 2050 but the impact on the all liquids is small as theyinfluence not the peak but the slope of the decline. We have plotted the Campbell scenario(2004 b) for a liquids ultimate of 2.5 Tb, but Campbell does not include refinery gains.Campbell’s peak is before 2010 when we see it after 2010, but who knows? The poor qualityof the data (mainly in the Middle East) prevents a better ultimate estimate and furthermorepeak depends upon demand, oil price and economy, as well as political conflicts or terroristacts.Figure 24: World liquids production (no demand constraint)

Jean Laherrere «Present & future energy problems» HEC MBA Sustainable Development seminar 8 Sept. 2004
19
-Natural gasAs for oil, the world cumulative conventional natural gas discovery displays a logistic pattern,but not as smoothed, since the largest gasfield North Dome (2/3 Qatar and 1/3 Iran) represents15 % of the 10 000 Tcf ultimate, when for oil the largest oilfield Ghawar represents only 5%of the ultimate. The cumulative production can be fitted with a similar logistic curve of 10000 Tcf ultimate.Figure 25: World conventional gas cumulative discovery & production with logistic models
The creaming curve also shows also the great inequality of gas distribution, the ME havingthe largest endowment, then the FSU in between with the other continentsFigure 26: Conventional gas creaming curve by continent

Jean Laherrere «Present & future energy problems» HEC MBA Sustainable Development seminar 8 Sept. 2004
20
The total ultimate of gas is about 12 Pcf as unconventional is about 2000 Tcf and the futureproduction could be fitted with a Hubbert curve, showing a gas peak around2030 at 140 Tcf/awhen USDOE forecasts a higher level, but 2004 forecast is quite less (20 Tcf/a) than 2003forecast for 2025. In Newsweek Aug.16, 2004 BP CEO states that gas consumption couldgrow threefold by 2050. I wonder: where this gas will come from?Figure 27: World gas production & forecasts
But if oil can be transported very cheaply (1 to 2 $/b) all around the world, gas is much moreexpensive to transport (over 5 times) and many discoveries are still stranded, though manyLNG plants were built. But shipping could be a problem if LNG volumes increase too much.Local gas shortages could occur sooner than the global oil shortage and this will start soonwith North America

Jean Laherrere «Present & future energy problems» HEC MBA Sustainable Development seminar 8 Sept. 2004
21
Up to now North America gas consumption was supplied locally, but production is peaking.The annual conventional natural gas discovery (smooth on 7-year period) is shifted by 23years to fit the past annual conventional production (red curve) and it is easy to see that soonthe decline will be a waterfall as claimed by Matt Simmons (ASPO Berlin 2004).Figure 28: US+Canada +Mexico annual conventional gas production and shifted discovery
The US demand is assumed to increase by more than 20 % in 2025 and Canada was supposedto compensate for US decline, but the last USDOE 2004 forecast has doubled, compared tothe 2003 forecast, the US import in 2025 and has halved the Canadian import. It is quite achange.Figure 29: US gas imports from Canada and as NGL
Europe gas production is peaking now and will decline after 2010 and must count on FSU andAfrica

Jean Laherrere «Present & future energy problems» HEC MBA Sustainable Development seminar 8 Sept. 2004
22
Figure 30: Europe annual gas production and discovery
But FSU reported gas reserves are overestimated and needs to be reduced by 30 % (Laherrere2004 ASPO & IIASA) to represent the mean value. The ultimate is about 1500 Tcf and gasproduction will peak at about 30 Tcf/a around 2015 and the decline will be steep.Figure 31: FSU gas production and shifted discovery
Zittel’s (LBST) graph of past and future production by field confirms this forecastFigure 32: Zittel Russia gas production from large fields

Jean Laherrere «Present & future energy problems» HEC MBA Sustainable Development seminar 8 Sept. 2004
23
After 2020 the decline of Europe and FSU will be hardly compensated by other sourceswithout very expensive investment.
-oil + gasSome believes that high price leads to more discoveries, but it is not what the past shows,because the oil shock (1979) corresponds to a fall in discovery and the trough of price in 1999corresponds to the peak of deepwaterThe annual discovery of conventional oil + gas (smoothed on a 7 year period) shows that 81% of the discovery occurs before 1979 (but only 39% of the production).Figure 34: World oil+gas production & discovery and oil price
-Fossil Fuels

Jean Laherrere «Present & future energy problems» HEC MBA Sustainable Development seminar 8 Sept. 2004
24
Ultimate can be estimated by extrapolating the past production (annual/cumulative versuscumulative) and for coal we have a value of 450 Gtoe compared to 600 Gtoe from the BGR2001.Figure 35: World coal annual/cumulative versus cumulative production giving an ultimate of450 Gtoe
Coal is modeled with Hubbert curve for two ultimates (450 and 600 Gtoe) as the oil for 400Gtoe (3 Tb) and gas for 300 Gtoe (12 Pcf). Coal peak is reached in 2035 (U=450 Gtoe) &2055 (U= 600 Gtoe), far from the reported 250-year life in most medias.Figure 36: World annual production of coal, oil and gas with models and USDOE forecasts
Oil peak is about 2015 (the model with two cycles of conventional and liquids minusconventional gave the same peak but a slightly different slope) with the assumption that therewill be no demand constraint (no depression). Gas peak is about 2030.

Jean Laherrere «Present & future energy problems» HEC MBA Sustainable Development seminar 8 Sept. 2004
25
The fossil fuels consumption will peak around 2025 at 10 Gtoe, but EIA/IEO 2004 forecasts asteep linear rise to over 13 Gtoe, up to the sky!Using a population model (UN and my own) the fossil fuel consumption per capita shows thatthe plateau of 1.3 toe/cap from 1975 to 2003 could continue for the next 25 years, followed bya slow decline going only to 1.1 toe in 2050.Figure 37: World fossil fuels consumption per capita with my forecast & USDOE
There is no decline of average fossil fuels per capita for the next two decades, the problem isthat the growth wishes of the developing countries have to be compensated by saving from thedeveloped country. Since North Americans consume twice more than Europeans, energysavings can be developed as they were in 1979 (France going towards nuclear and US towardssmall cars), in front of high energy prices forecasts
-Energy mix-some energy figures in Mtoevolcanic eruptions date energy MtoeTambora 1815 20 000Krakatoa 1883 24 St Helens 1980 20 Hiroshima bomb 1945 0,003World oil production 2003 3 700World primary energy 2003 10 000
-basic human needs: air = oxygen, water, food = energy, substitute= animals, slaves (RomanEmpire had 3 million slaves for 4 million free people), fuels, nuclear, solar, wind,waterpower, geothermy,-energy mix, usually only commercial when many countries rely on non-commercial energy:wood, dung, prehistoric societies were estimated to use 0.3 toe per capita to compare to 0.5for India and 1.7 toe/cap for the world average today

Jean Laherrere «Present & future energy problems» HEC MBA Sustainable Development seminar 8 Sept. 2004
26
-draught animals are omitted, as horses to carry humans in a carriage when horsepower iscounted in carsIn the US (Ayres et al 2002) work animals peaked during the First World War at 27 millionsand declined until 1960 replaced by about 8 millions tractors.Figure 38: US farm mechanization, substitution of machinery for animals
from Ayres et al 2002/52/EPS/CMER-most Europeans cities were built mainly with human muscle (coming from food) andwatermills (500 000 in Europe in 1800).-food would be added in the energy mix, but about 13 energy unit of fossil fuel is expendedper energy unit of food supplied to each American (Pimentel et al 2003).-each energy is converted into the same unit and the equivalence for electricity requires someassumptions on the efficiency. The most often used are IEA equivalence factor and France in2001 changed its old conventions for IEA conventions. The change was drastic, mainly forfinal energy decreasing from 232 Mtoe down to 175 Mtoe but in percentage oil increasingfrom 40% to 51 %.Consommation d'énergie primaire en 2001 (corrigée du climat)
Nouvelle méthode Ancienne méthodeMtep % Mtep %
Charbon 11,9 4,4 11,9 4,6Pétrole 96,5 35,9 99,0 38.5Gaz 37,2 13,8 37,2 14,5Nucléaire 104,4 38,8 79,1 30,8Hydraulique, éolien, photovolt. 6,8 2,5 . 17,7 6,9Autres énergies renouvelables 12,2 4,5 12,1 4,7Total 269,0 100 257,1 100
Consommation d'énergie finale en 2001 (corrigée du climat)Nouvelle méthode Ancienne méthodeMtep % Mtep %
Charbon 6,8 3,9 6,8 2,9Pétrole 89,9 51,3 92,4 39,8

Jean Laherrere «Present & future energy problems» HEC MBA Sustainable Development seminar 8 Sept. 2004
27
Gaz 33,4 19,0 33,3 14,4Electricité 34,4 19,6 88,9 38,3Energies renouvelables thermiques 10,7 6,1 10,7 4,6Total 175,1 100 232,1 100dont non énergétique 16,6 9,5 16,7 7,2
-loss between input (primary resources) and output final consumption)(as between the starting line where all equals and the arrival line where only one winner).-energy chart for FranceThe loss for 2003 between primary energy (280 Mtoe) and final energy (175 Mtoe) is quiteimportant.Figure 39: France energetic flow in 2003 from 280 Mtoe to 175 Mtoe
-US electricity flow: losses represent 65 %Figure 40: US electricity flow in 2002

Jean Laherrere «Present & future energy problems» HEC MBA Sustainable Development seminar 8 Sept. 2004
28
US Electricity flow 2002
coal
gas
nuclearnuclear renewable
losses
The primary energy mix displays a continuous increase for coal, a sharp increase for oil from1950 to 1979, a significant increase of biomass after 1980, a slow increase of hydropower andinsignificant amount of sun; wind and others.Figure 41: World primary energy mix
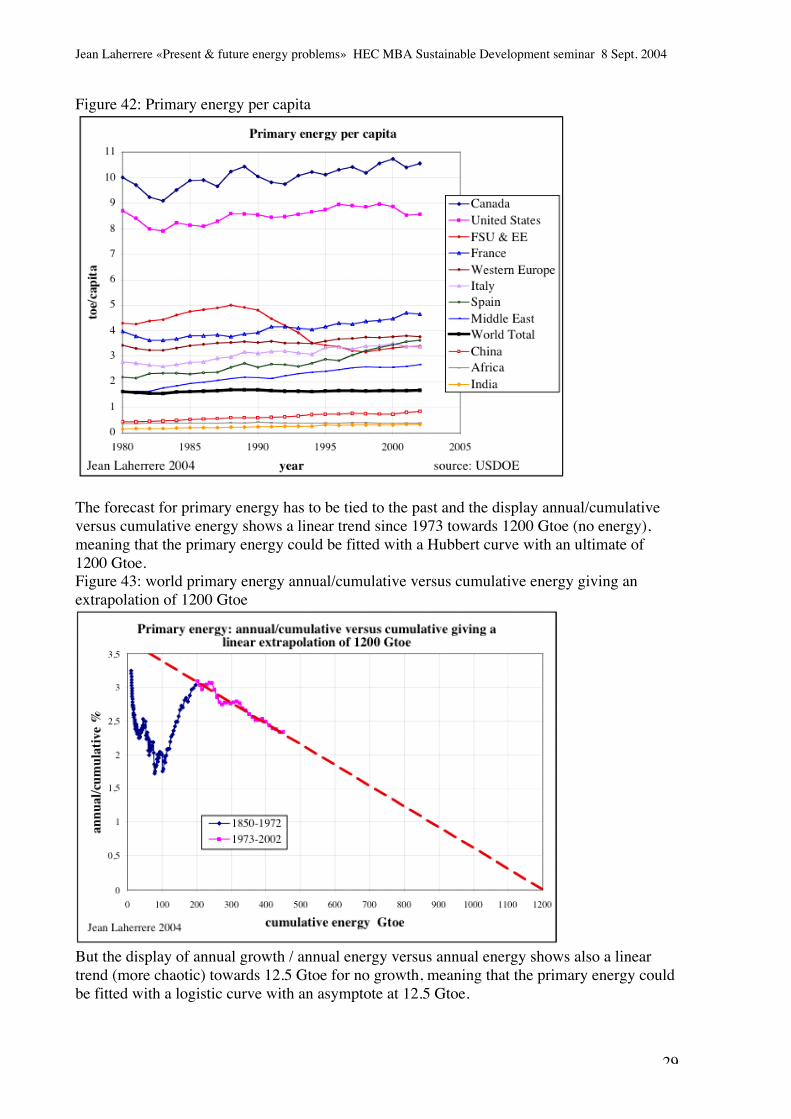
The primary energy per capita is almost constant for the world average at 1,7 toe/cap, but therange in 2002 is huge between Canadian (over 10 and up) US (8.5 and up) Europe (3,8 andup), Africa (flat 0.4), India (0.35 but up)
Jean Laherrere «Present & future energy problems» HEC MBA Sustainable Development seminar 8 Sept. 2004
29
Figure 42: Primary energy per capita
The forecast for primary energy has to be tied to the past and the display annual/cumulativeversus cumulative energy shows a linear trend since 1973 towards 1200 Gtoe (no energy),meaning that the primary energy could be fitted with a Hubbert curve with an ultimate of1200 Gtoe.Figure 43: world primary energy annual/cumulative versus cumulative energy giving anextrapolation of 1200 Gtoe
But the display of annual growth / annual energy versus annual energy shows also a lineartrend (more chaotic) towards 12.5 Gtoe for no growth, meaning that the primary energy couldbe fitted with a logistic curve with an asymptote at 12.5 Gtoe.

Jean Laherrere «Present & future energy problems» HEC MBA Sustainable Development seminar 8 Sept. 2004
30
Figure 44: world primary energy annual growth/energy versus energy giving an extrapolationof 12.5 Gtoe
The Hubbert and logistic models are a good fit to the past but it is unlikely to see a peakaround 2025 (unless a sharp depression) and the flattening towards 12.5 Gtoe is more likely.The USDOE 2004 forecast with 16 Gtoe in 2025 is quite far from these flattening models, andas we said “what goes up must come down!” because the world population will come downthis century, the fossil fuels will be lacking in few decades and the renewables are limited byspace. The only uncertain future is nuclear with high potential if fusion or fast breedersbecome accepted by consumers.Figure 45: World primary energy with two models and USDOE forecast
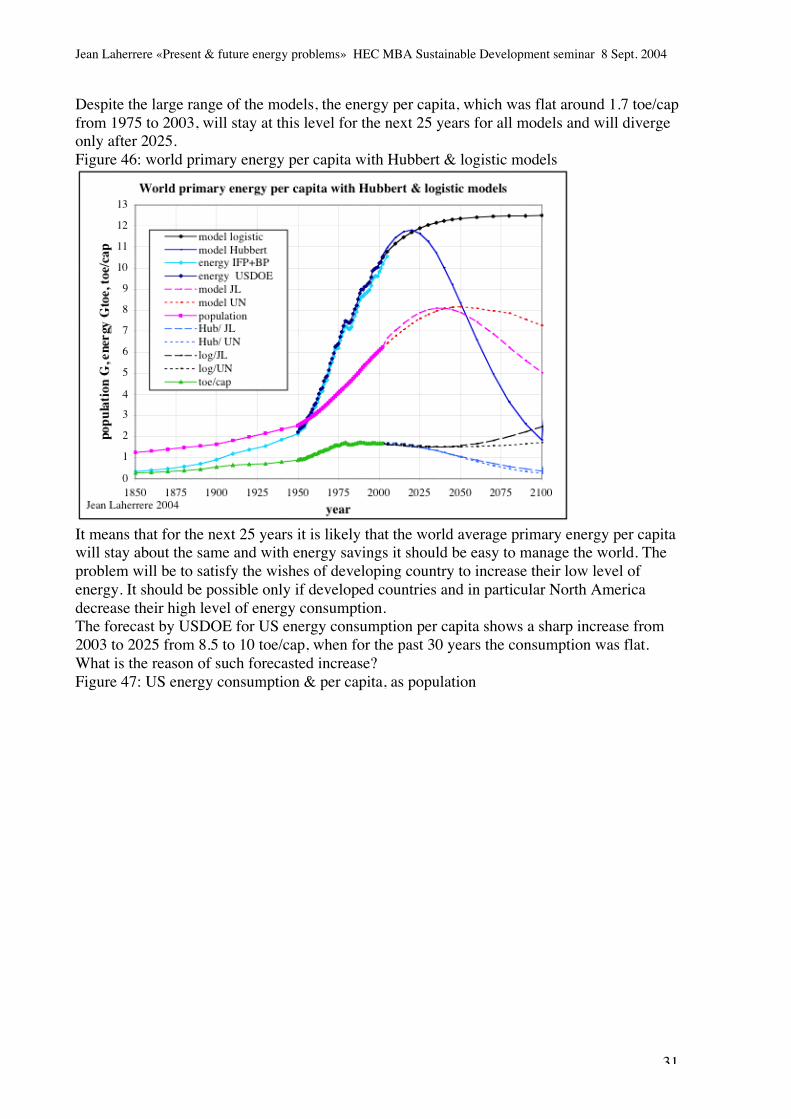
The energy forecasts (Hubbert & logistic) are associated with the population forecasts (UNand mine) to obtain the primary energy per capita.
Jean Laherrere «Present & future energy problems» HEC MBA Sustainable Development seminar 8 Sept. 2004
31
Despite the large range of the models, the energy per capita, which was flat around 1.7 toe/capfrom 1975 to 2003, will stay at this level for the next 25 years for all models and will divergeonly after 2025.Figure 46: world primary energy per capita with Hubbert & logistic models
It means that for the next 25 years it is likely that the world average primary energy per capitawill stay about the same and with energy savings it should be easy to manage the world. Theproblem will be to satisfy the wishes of developing country to increase their low level ofenergy. It should be possible only if developed countries and in particular North Americadecrease their high level of energy consumption.The forecast by USDOE for US energy consumption per capita shows a sharp increase from2003 to 2025 from 8.5 to 10 toe/cap, when for the past 30 years the consumption was flat.What is the reason of such forecasted increase?Figure 47: US energy consumption & per capita, as population

Jean Laherrere «Present & future energy problems» HEC MBA Sustainable Development seminar 8 Sept. 2004
32
-energetic intensity per dollar GDPMany reports are studying in great details the energetic intensity, which is the primary energyper GDP dollar. But it is a poor parameter as GDP is manipulated as in the US with hedonicfactors; or China, or Russia during the 90s where barters were the rules. GDP represents theexpenditures and not the wealth of a country.See the chapter on US economyOn easiest way to see the energy use is to look at the lights during the night on satellitespictures: see the chapter (Laherrere 2004 Quimper).
-PopulationEnergy per capita is more important for the consumer than global energy and population dataand forecast are needed.If oil and gas data is badly reported, it is the same for population, since population, asreserves, indicates strength. In 1990 the UN reported Nigeria with 120 millions and thefollowing census showed that this value was overestimated by 30%.It was announced on all the medias that the sixth billion child was born on October 12, 1999.It is a joke. It is as the English Bible for centuries was giving the birth of Earth estimated in1650 by Bishop Ussher as Sunday Oct. 23 4004 BC at noon. They don’t have any idea of theaccuracy of their estimates or it is just a political misinformation. The accuracy on populationeven with census is over 3% and many countries have no census.Modeling world population implies studying the annual growth rate versus time, which showsa linear trend from 1988 to 2000 extrapolation to no growth in 2035.Figure 48: World population 1800-2000 annual growth versus time

Jean Laherrere «Present & future energy problems» HEC MBA Sustainable Development seminar 8 Sept. 2004
33
The annual growth rate versus population shows a linear trend (1988-2000) extrapolated to nogrowth at 8.8 billion.Figure 49: World population 1800-2000: annual growth versus population
Bourgeois-Pichat head of the INED (Institut National d’Etudes Demographiques) in 1988modeled the world population with two symmetrical curves, one for the industrial countriesand one for the developing countries. In 1999, I used 3 cycles adding a lack of education andno comfort countries in order not to go to complete extinctionFigure 50: World population forecast in 1999

Jean Laherrere «Present & future energy problems» HEC MBA Sustainable Development seminar 8 Sept. 2004
34
World population modeled with 3 cycles . compared to 1998 UN scenarios .
0
1
2
3
4
5
6
7
8
9
10
11
12
1850 1900 1950 2000 2050 2100 2150year
popu
latio
n in
bill
ions
industrial countrieslack comfort & education
developing countries développement
Bourgeois-Pichat model
UN 1998 scenarios
fertilityhigh/medium mediumlow/medium
Data
Every population forecast is based mainly on the fertility rate, but this rate is badly measured(data from INED and from CIA disagree) and even not reported in some troubled countriessuch as Somalia, where USCB reports figures with 4 decimals!The correlation between fertility rate and education of the women is fairly strongFigure 51: relationship fertility rate and women education
The 58 educated countries totaling 2.7 G or 45 % of the world population, which have afertility rate less than the replacement rate, have no future, going toward extinction if womendo not change their behavior of freedom and choice (having only no more than two children

Jean Laherrere «Present & future energy problems» HEC MBA Sustainable Development seminar 8 Sept. 2004
35
and after what to go back to work or outside house). Developing countries imitate developedcountries and have decreasing fertility rate. But a certain number of countries that are opposedto women education have a high fertility rate which is not decreasing (as Somalia, Niger,Yemen) and they will in the long term (two centuries) be the majority on earth when westerncivilization has disappeared.In order to show their power, US forecast that in 2050 US women will be more fertile thanIndia or Mexico women.Figure 52: Fertility rate forecasts by USCB (Census Bureau)
But in fact the US is growing mainly from immigrationUSDOE forecasts on population were until 2003 in line with the trend before 1990, but in2004 they realized that the trend has changed for a higher value.Figure 53: US population forecasts by USDOE

Jean Laherrere «Present & future energy problems» HEC MBA Sustainable Development seminar 8 Sept. 2004
36
The plot annual growth rate versus population shows a linear trend from 1991 to 2003 toward440 million.Figure 54!: US population: annual growth versus population
Figure 55: US population and several forecasts
UN reports that Europe population has peaked in 2000 and will decrease by 100 million in2050, when North America is still on the increase in 2100Figure 56: Europe and North America population forecasts

Jean Laherrere «Present & future energy problems» HEC MBA Sustainable Development seminar 8 Sept. 2004
37
France will peak around 2025 according to forecasts of the Utrecht University, that of INSEE,or USCB (Census Bureau)Figure 57: France population
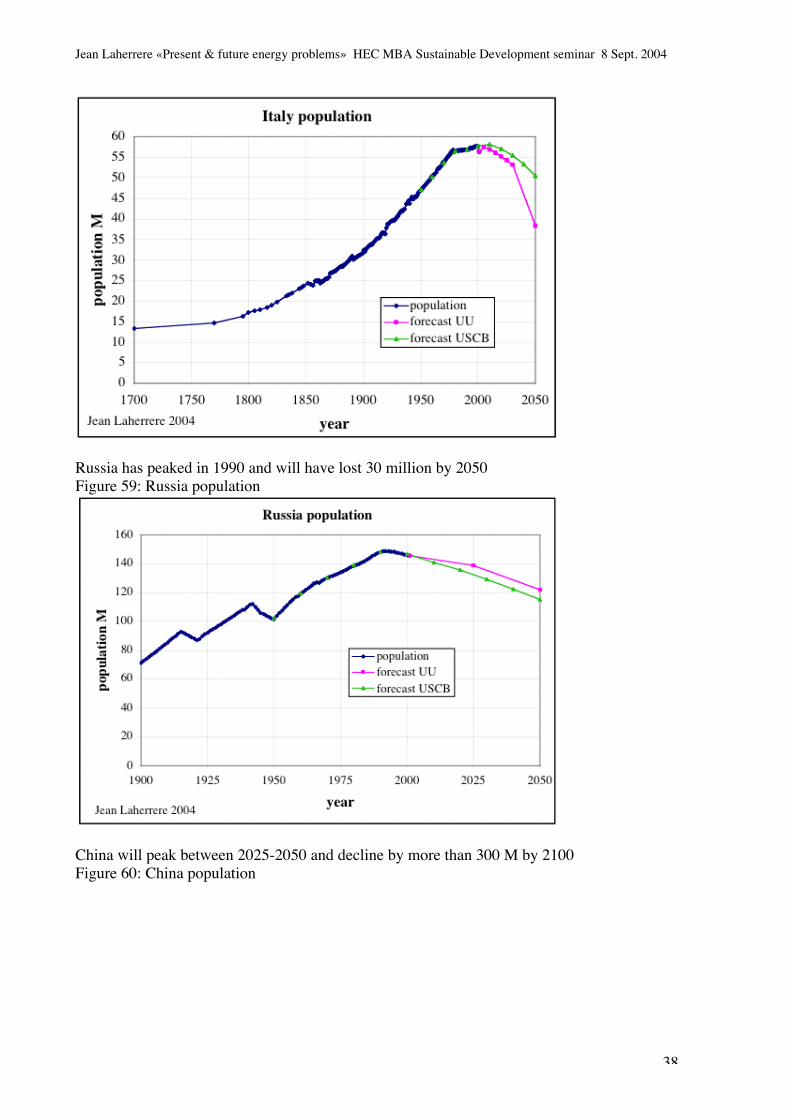
Italy is peaking and will decrease by 10 million in 2050Figure 58: Italy population
Jean Laherrere «Present & future energy problems» HEC MBA Sustainable Development seminar 8 Sept. 2004
38
Russia has peaked in 1990 and will have lost 30 million by 2050Figure 59: Russia population
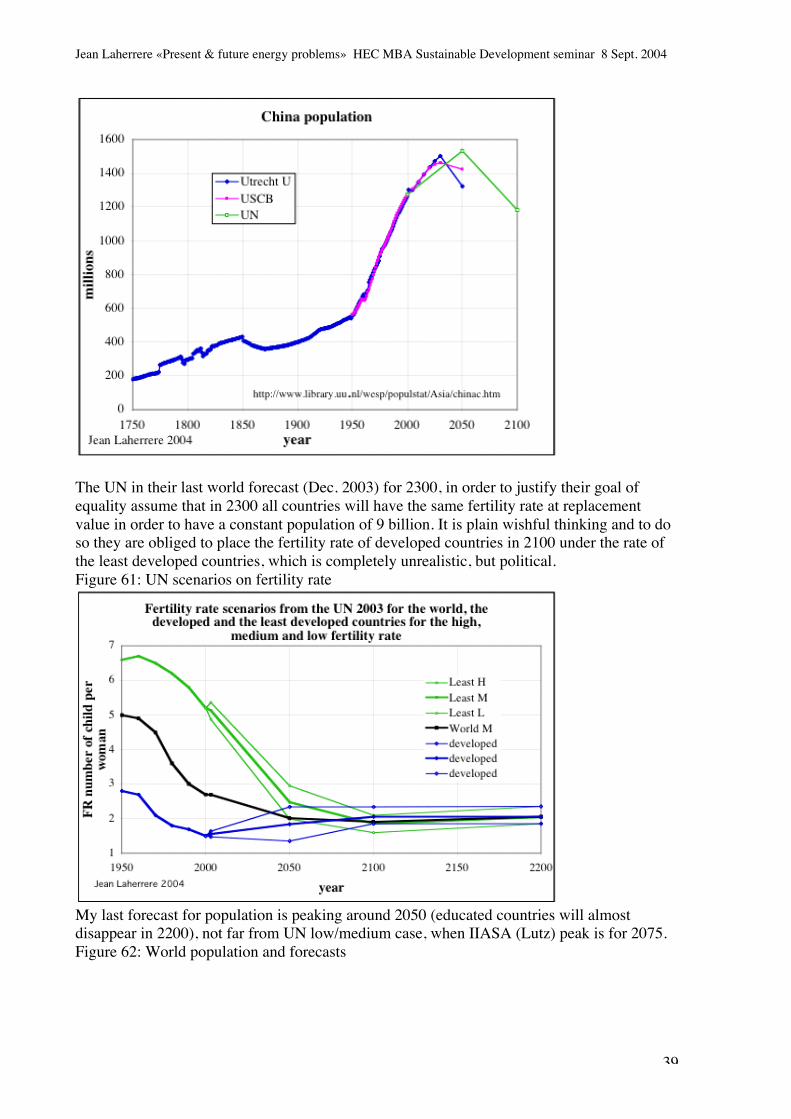
China will peak between 2025-2050 and decline by more than 300 M by 2100Figure 60: China population
Jean Laherrere «Present & future energy problems» HEC MBA Sustainable Development seminar 8 Sept. 2004
39
The UN in their last world forecast (Dec. 2003) for 2300, in order to justify their goal ofequality assume that in 2300 all countries will have the same fertility rate at replacementvalue in order to have a constant population of 9 billion. It is plain wishful thinking and to doso they are obliged to place the fertility rate of developed countries in 2100 under the rate ofthe least developed countries, which is completely unrealistic, but political.Figure 61: UN scenarios on fertility rate
My last forecast for population is peaking around 2050 (educated countries will almostdisappear in 2200), not far from UN low/medium case, when IIASA (Lutz) peak is for 2075.Figure 62: World population and forecasts

Jean Laherrere «Present & future energy problems» HEC MBA Sustainable Development seminar 8 Sept. 2004
40
-PriceBefore the first commercial oil discovery in 1859, whale oil was expensive, peaking in the USat 2000 $2003/b in 1855, as the whale oil US production displayed a good Hubbert curve(Bardi 2004) and price went up after the peak, then declined when oil production started to besignificant, but being in 1875 30 times more expensive than oil.Figure 63a: US whale oil production and price compared to oil 1800-1900
The world oil price in 2003 $ started close to 80 $/b in 1870 and went down to 10 $/b in 1970,then raised to 80 $/b in 1979 to go down to about 20 $/b before the present 40 $/bFigure 63b: World oil price 1860-2003

Jean Laherrere «Present & future energy problems» HEC MBA Sustainable Development seminar 8 Sept. 2004
41
Figure 64: Gold price 1344-1998Gold displays also a large range of variation
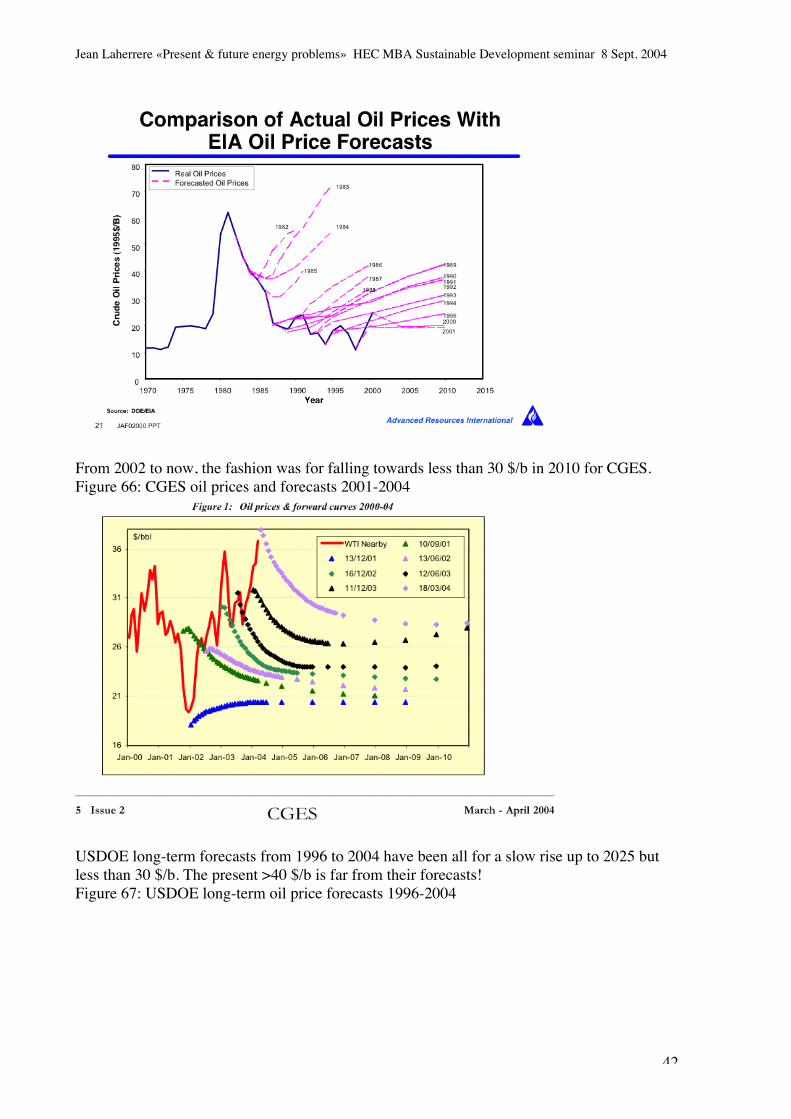
Oil price forecasts were always wrong and follow, as the height of gown, a fashion trend: upand down.From 1982 to 1994 fashion was for high growth, but since 1995 rather flat lines.Figure 65: USDOE/EIA oil price forecasts 1982-2001 and actual price
Jean Laherrere «Present & future energy problems» HEC MBA Sustainable Development seminar 8 Sept. 2004
42
From 2002 to now, the fashion was for falling towards less than 30 $/b in 2010 for CGES.Figure 66: CGES oil prices and forecasts 2001-2004
USDOE long-term forecasts from 1996 to 2004 have been all for a slow rise up to 2025 butless than 30 $/b. The present >40 $/b is far from their forecasts!Figure 67: USDOE long-term oil price forecasts 1996-2004

Jean Laherrere «Present & future energy problems» HEC MBA Sustainable Development seminar 8 Sept. 2004
43
The short-term USDOE forecast is more chaoticFigure 68: USDOE short-term oil price forecasts 1997-2004
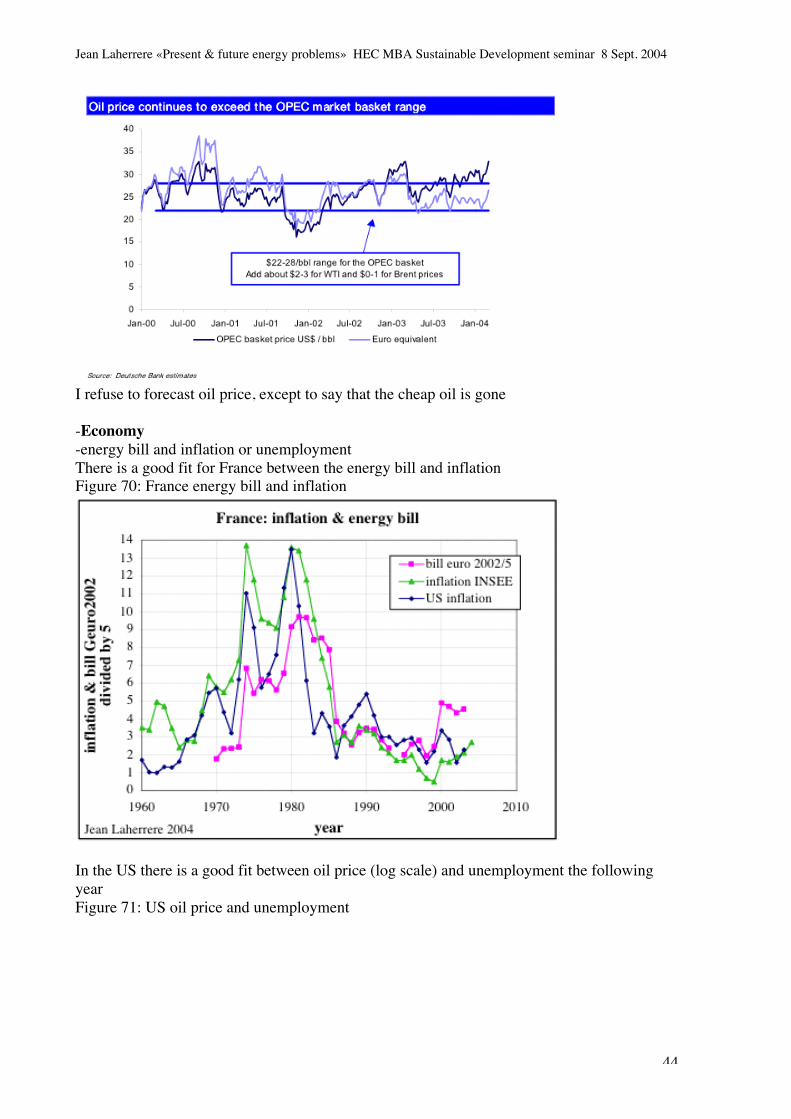
The OPEC 22-28 $/b mechanism has worked well in the past to stabilize the oil market andOPEC was not thanked enough for that. But when euro rose last year the mechanism wasconverted to stay in the euro range. And now the mechanism does not work anymore, forthere is no spare capacity left to play on quotas.Figure 69: Oil price in $ & euro 2000-2004
Jean Laherrere «Present & future energy problems» HEC MBA Sustainable Development seminar 8 Sept. 2004
44
I refuse to forecast oil price, except to say that the cheap oil is gone
-Economy-energy bill and inflation or unemploymentThere is a good fit for France between the energy bill and inflationFigure 70: France energy bill and inflation
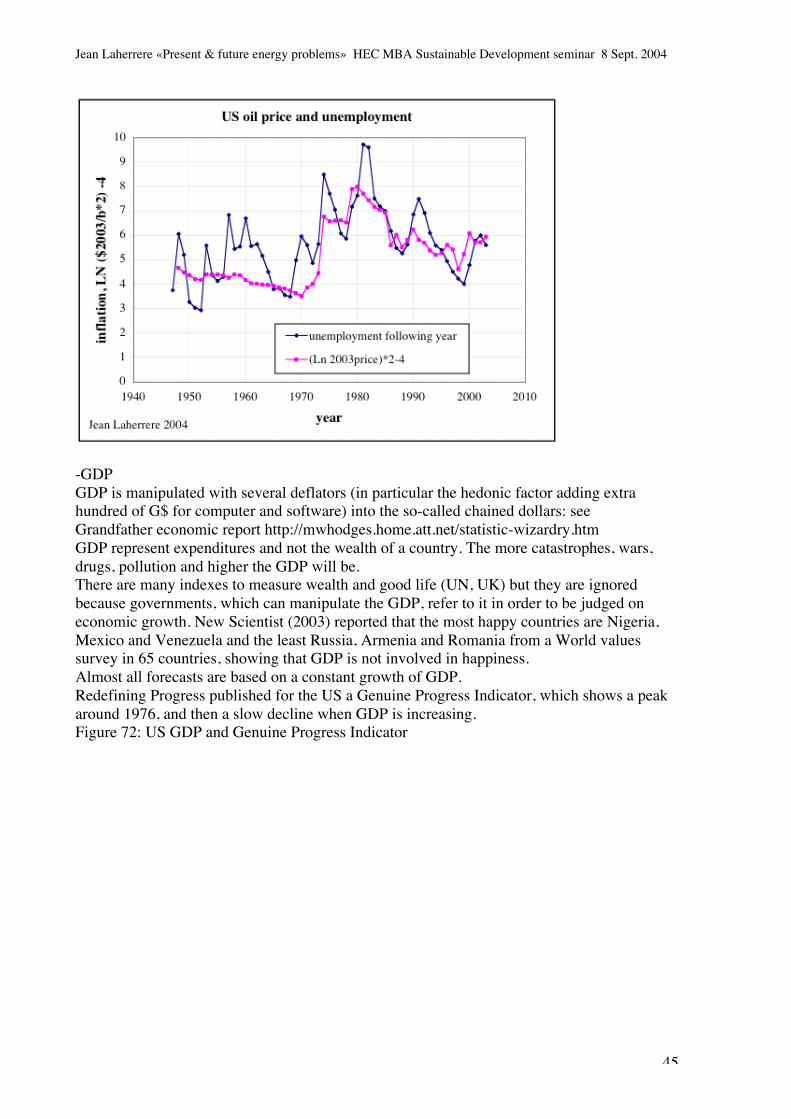
In the US there is a good fit between oil price (log scale) and unemployment the followingyearFigure 71: US oil price and unemployment
Jean Laherrere «Present & future energy problems» HEC MBA Sustainable Development seminar 8 Sept. 2004
45
-GDPGDP is manipulated with several deflators (in particular the hedonic factor adding extrahundred of G$ for computer and software) into the so-called chained dollars: seeGrandfather economic report http://mwhodges.home.att.net/statistic-wizardry.htmGDP represent expenditures and not the wealth of a country. The more catastrophes, wars,drugs, pollution and higher the GDP will be.There are many indexes to measure wealth and good life (UN, UK) but they are ignoredbecause governments, which can manipulate the GDP, refer to it in order to be judged oneconomic growth. New Scientist (2003) reported that the most happy countries are Nigeria,Mexico and Venezuela and the least Russia, Armenia and Romania from a World valuessurvey in 65 countries, showing that GDP is not involved in happiness.Almost all forecasts are based on a constant growth of GDP.Redefining Progress published for the US a Genuine Progress Indicator, which shows a peakaround 1976, and then a slow decline when GDP is increasing.Figure 72: US GDP and Genuine Progress Indicator

Jean Laherrere «Present & future energy problems» HEC MBA Sustainable Development seminar 8 Sept. 2004
46
The short-term forecast of USDOE for GDP is mainly off marks.Figure 73: USDOE GDP short-term forecasts
-US economyfrom Grand Father Economic Report: http://mwhodges.home.att.net/12 graphs of interestTotal US debt grows much more than income

Jean Laherrere «Present & future energy problems» HEC MBA Sustainable Development seminar 8 Sept. 2004
47
The most important component is the domestic debt
Private sector % of national income in US economy decreases from 88% to 57%

Jean Laherrere «Present & future energy problems» HEC MBA Sustainable Development seminar 8 Sept. 2004
48
Government take is 43 % of the consumer basket
Household debt has increased to 100% of national income

Jean Laherrere «Present & future energy problems» HEC MBA Sustainable Development seminar 8 Sept. 2004
49
Personal savings are falling drastically
Months worked to pay government has increased from 1.3 to 5.2 months
Business productivity is going down

Jean Laherrere «Present & future energy problems» HEC MBA Sustainable Development seminar 8 Sept. 2004
50
US productivity is less than Germany or Japan
Imports are rising and exports falling
Jean Laherrere «Present & future energy problems» HEC MBA Sustainable Development seminar 8 Sept. 2004
51
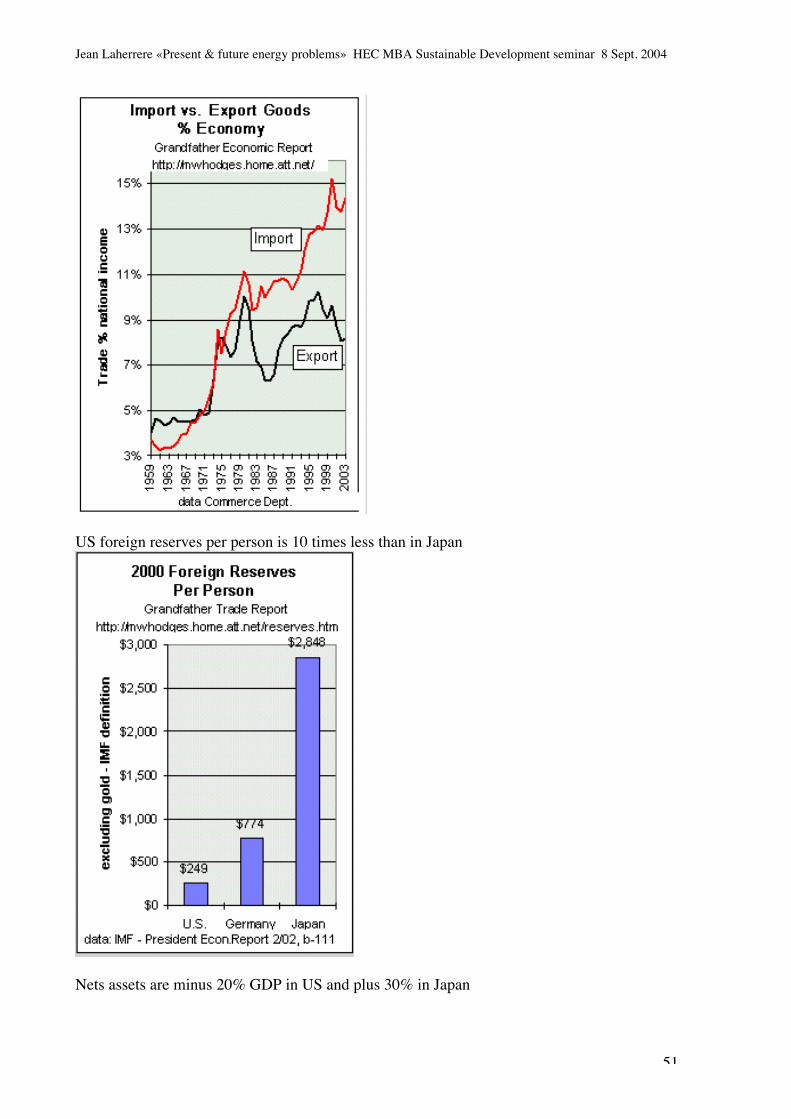
US foreign reserves per person is 10 times less than in Japan
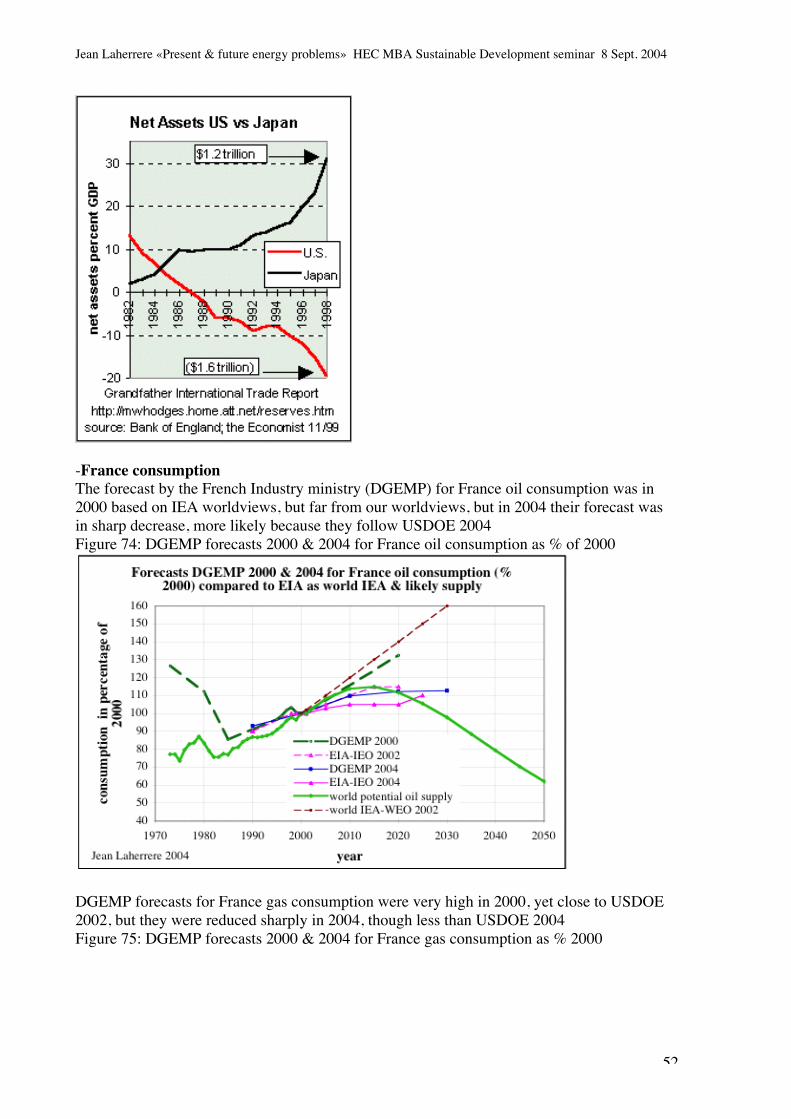
Nets assets are minus 20% GDP in US and plus 30% in Japan
Jean Laherrere «Present & future energy problems» HEC MBA Sustainable Development seminar 8 Sept. 2004
52
-France consumptionThe forecast by the French Industry ministry (DGEMP) for France oil consumption was in2000 based on IEA worldviews, but far from our worldviews, but in 2004 their forecast wasin sharp decrease, more likely because they follow USDOE 2004Figure 74: DGEMP forecasts 2000 & 2004 for France oil consumption as % of 2000
DGEMP forecasts for France gas consumption were very high in 2000, yet close to USDOE2002, but they were reduced sharply in 2004, though less than USDOE 2004Figure 75: DGEMP forecasts 2000 & 2004 for France gas consumption as % 2000

Jean Laherrere «Present & future energy problems» HEC MBA Sustainable Development seminar 8 Sept. 2004
53
Change of forecasts are more interesting than their values and DGEMP forecasts show littlechange for the France primary energy from 2000 to 2004, in fact they sharply reduce gas, alittle less oil, but increase coal and nuclear (but hide the change by lumping nuclear tohydropower.Figure 76: DGEMP forecasts 2000 & 2004 for France primary energy
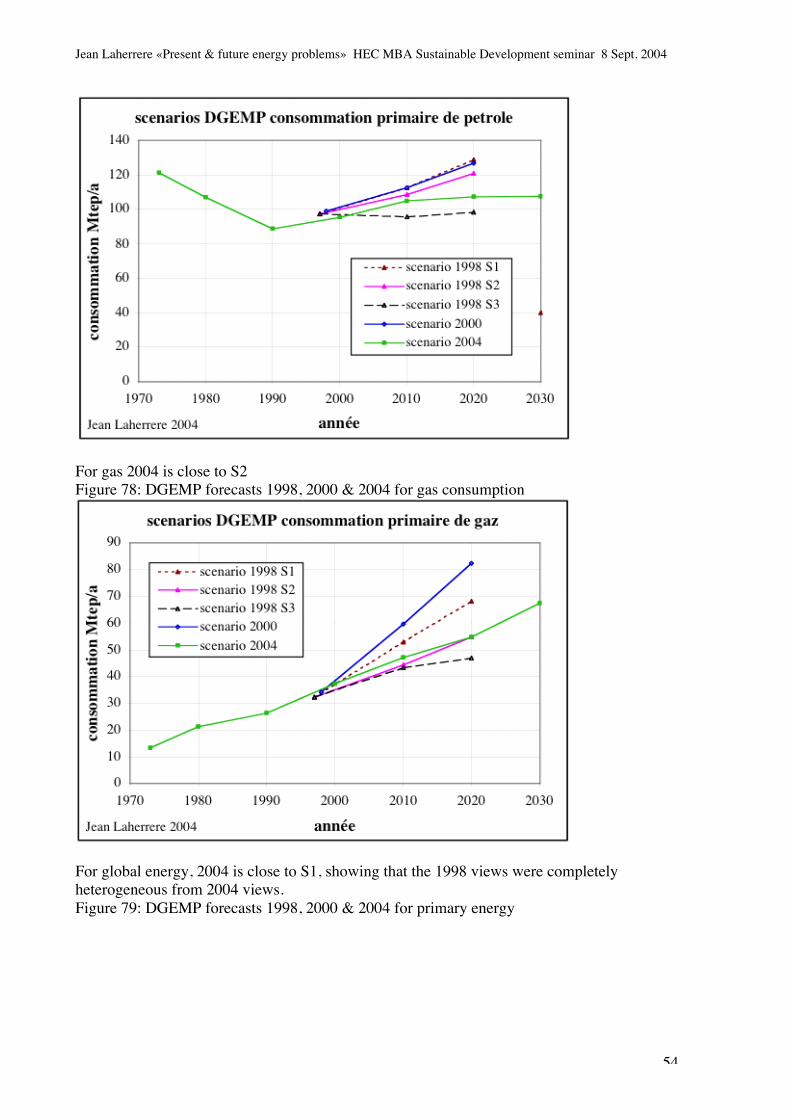
The comparison between DGEMP forecasts in 1998, 2000 and 2004, shows for oilconsumption that the 3 scenarios of 1998 (S1, S2 & S3) showing a large range wereabandoned for just one in 1999 which now looks wild and that the 2004 one is morereasonable being not far from S3.Figure 77: DGEMP forecasts 1998, 2000 & 2004 for oil consumption
Jean Laherrere «Present & future energy problems» HEC MBA Sustainable Development seminar 8 Sept. 2004
54
For gas 2004 is close to S2Figure 78: DGEMP forecasts 1998, 2000 & 2004 for gas consumption
For global energy, 2004 is close to S1, showing that the 1998 views were completelyheterogeneous from 2004 views.Figure 79: DGEMP forecasts 1998, 2000 & 2004 for primary energy

Jean Laherrere «Present & future energy problems» HEC MBA Sustainable Development seminar 8 Sept. 2004
55
-AgricultureAgriculture is described now as a way to convert oil into food (Bartlett) when in the 60s BP atLavera was trying to convert oil into food. Agriculture depends so much upon oil (fertilizer,pesticide, tractor, irrigation) that oil shortage means immediately food shortage, as it was inCuba when oil imports from Russia were cut (or North Korea). Petroleum consumptioncorrelates fairly well with agriculture productivity.Figure 80: Petroleum consumption and agriculture productivity 1990=100
World agriculture productivity has grown with the fertilizer productionFigure 81: World agriculture productivity and fertilizer production

Jean Laherrere «Present & future energy problems» HEC MBA Sustainable Development seminar 8 Sept. 2004
56
World grain production has risen as well as oil productionFigure 82: World production of grain and oil
Food is transported all around the world at a very low cost. I was always surprised during thelast few years to find at the supermarket all year around onions from Tasmania (and garlicfrom Argentina), since Tasmania is more than 20 000 km away, Australian farmers have asimilar life level to us (no aborigines in Tasmania!) and there is no shortage of onions inFrance at any period. Food travels in average 2000 km. It is why there are so many trucks onthe road and it is a waste of energy.World grain production is leveling, now that the limits (productivity, soil, irrigation, fossilaquifers) have been reached. Production and consumption increased more than population

Jean Laherrere «Present & future energy problems» HEC MBA Sustainable Development seminar 8 Sept. 2004
57
before 1985, but less after. Now consumption is larger than production and reserves aredeclining.Figure 83: World grain production, consumption, reserves and population
It seems that world grain peak will come sooner than oil peak
-Global warmingWe are presently in an interglacial period within a glaciation which started two million yearsago. From the birth of Earth, temperature has been most of time warmer than now.Figure 84: Earth temperature since birth
15 000 years ago during glaciation, water level was 120 m lower, but during Cretaceous timewater level was much higher than now.

Jean Laherrere «Present & future energy problems» HEC MBA Sustainable Development seminar 8 Sept. 2004
58
Figure 85: temperature, continent drift and water level since 600 Ma
The previous glaciation was 300 millions years before, as glaciations depend upon thepresence of continents at (or around) poles and because of continent drift, there was nocontinent at the poles during Cretaceous time.For 420 000 years the interglacial periods have been in minority and we are going toward anew glaciation where New York will be again covered by ice and Paris by permafrost!Figure 86: temperature measured at Vostok over 420 000 years
These temperature variations depend mainly upon the Earth insolation, which varies withthree astronomic parameters (Milankovich): orbit eccentricity around the Sun, angle of tiltingand date of perihelion.
There is a relationship between temperature, CO2 and methane. But CO2 change seems tohappen later than temperature change.Figure 86: temperature, CO2 & CH4 at Vostok

Jean Laherrere «Present & future energy problems» HEC MBA Sustainable Development seminar 8 Sept. 2004
59
CO2 (life being about a century) rises with temperature with a lag of several hundred years,because of rising ocean temperature (life about a millennium) cannot dissolve as much CO2World temperatures measured at meteorological stations (close to towns or airports) showsince 1880 lows and highs. From 1940-1975 temperature was down by minus 0.5 °C andglobal cooling was feared (J.M. Cavada on TV in 1975)Figure 87: world temperature since 1880
Human activities have an impact on climate, but it is small compared to natural events;astronomical (sun and earth, continent drift, ocean cycle).Figure 88: Human emissions are of the 4th order in climate change

Jean Laherrere «Present & future energy problems» HEC MBA Sustainable Development seminar 8 Sept. 2004
60
Sun activity (solar spots and magnetic bursts) has to be added to the Milankovich astronomicparameters, and can be modeled with cycles of several decades:-Nesme-Ribes E., Thuillier G. 2000 "Histoire solaire et climatique" editions Belin-Pour lascienceSun impact seems to be unfortunately positive until 2030 ,but for 1940-1975, it was negativeand it has compensated the human emissions.Figure 89: sun impact on climate 1880-2080

Jean Laherrere «Present & future energy problems» HEC MBA Sustainable Development seminar 8 Sept. 2004
61
Greenhouse effect is due at 90% to water vapor i.e. clouds which are neglected by IPCC, inparticular with the relationship clouds and cosmic rays due to solar bursts.Oceans contain 50 to 65 times more CO2 than atmosphere.Half of the CO2 disappear in an unknown sink.The IPCC 2000 third report (used by Kyoto Protocol) is based on 40 scenarios of energeticconsumptions done by academic scientists (IIASA) with little knowledge of industrial realitiesIIASA forecasts a «!Methane age!» based on a huge potential of oceanic methane hydrate, butthe last estimate (Soloviev 2000, Milkov 2004) divides the old estimates by a hundred!The huge range of IIASA gas scenarios (based on theoretical concepts) is outside of myforecast based on technical dataFigure 90: IIASA scenarios (IPCC report) for gas consumption compared to mine
It is about the same for the oil scenarioFigure 91: IIASA scenarios (IPCC report) for oil consumption compared to mine

Jean Laherrere «Present & future energy problems» HEC MBA Sustainable Development seminar 8 Sept. 2004
62
And also for most scenarios for coal compared to the forecast from BGR ultimateFigure 92: IIASA scenarios (IPCC report) for coal consumption compared to mine
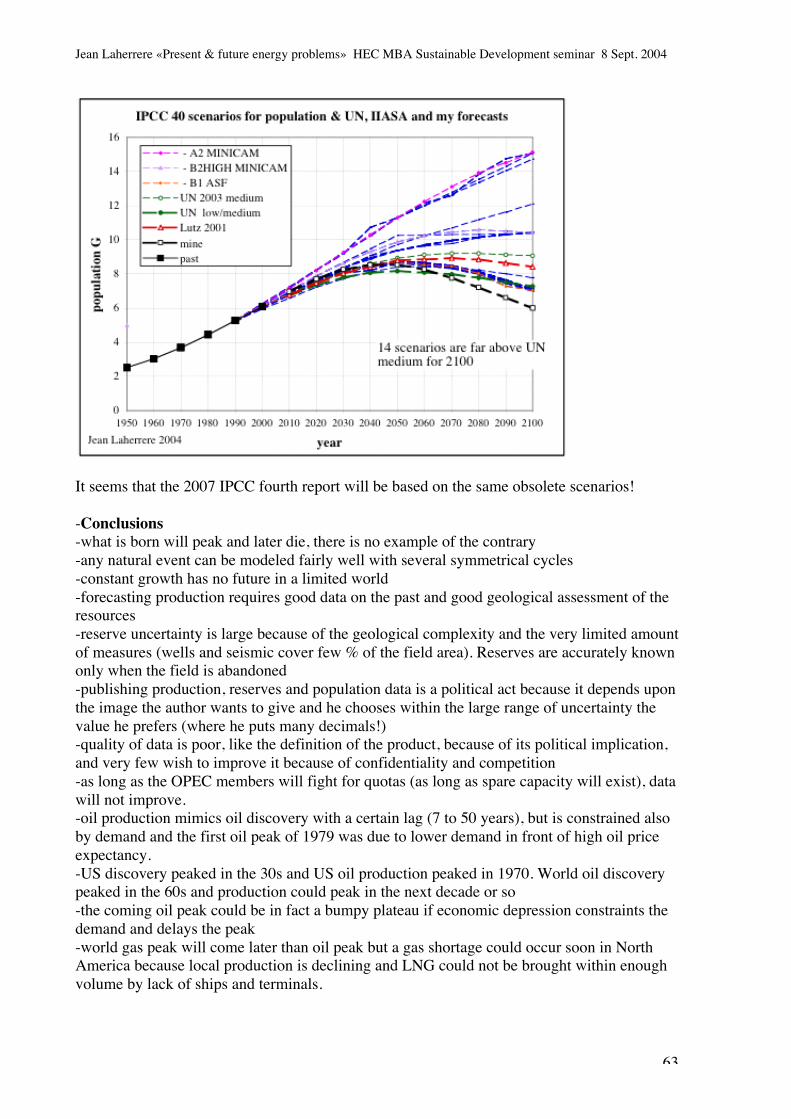
and also for population where 40% of the scenarios for 2100 are well above the UN mediumforecast (always reduced later on)Figure 93: IIASA scenarios (IPCC report) for population compared to UN; IIASA (Lutz) andmy forecast
Jean Laherrere «Present & future energy problems» HEC MBA Sustainable Development seminar 8 Sept. 2004
63
It seems that the 2007 IPCC fourth report will be based on the same obsolete scenarios!
-Conclusions-what is born will peak and later die, there is no example of the contrary-any natural event can be modeled fairly well with several symmetrical cycles-constant growth has no future in a limited world-forecasting production requires good data on the past and good geological assessment of theresources-reserve uncertainty is large because of the geological complexity and the very limited amountof measures (wells and seismic cover few % of the field area). Reserves are accurately knownonly when the field is abandoned-publishing production, reserves and population data is a political act because it depends uponthe image the author wants to give and he chooses within the large range of uncertainty thevalue he prefers (where he puts many decimals!)-quality of data is poor, like the definition of the product, because of its political implication,and very few wish to improve it because of confidentiality and competition-as long as the OPEC members will fight for quotas (as long as spare capacity will exist), datawill not improve.-oil production mimics oil discovery with a certain lag (7 to 50 years), but is constrained alsoby demand and the first oil peak of 1979 was due to lower demand in front of high oil priceexpectancy.-US discovery peaked in the 30s and US oil production peaked in 1970. World oil discoverypeaked in the 60s and production could peak in the next decade or so-the coming oil peak could be in fact a bumpy plateau if economic depression constraints thedemand and delays the peak-world gas peak will come later than oil peak but a gas shortage could occur soon in NorthAmerica because local production is declining and LNG could not be brought within enoughvolume by lack of ships and terminals.

Jean Laherrere «Present & future energy problems» HEC MBA Sustainable Development seminar 8 Sept. 2004
64
-coal resources seem to be less than reported by lack of good inventory and good definition;coal could peak much sooner than expected-fossil fuels will peak around 2030, but the production per capita, which was flat for the last25 years, will stay flat for the next 25 years, and the problem is sharing this limited energybetween rich and poor countries.-primary energy extrapolation of the past (10 Gtoe in 2003) leads to models of either peakingor flattening at 12.5 Gtoe-high-energy price is the best solution to save energy and save future demand problems-societies of endless consumption and growth have to change behavior soon-limits in water, agriculture and fishery will likely occur sooner than for fossil fuels-educated countries have no future with fertility rate less than replacement-oil and gas IIASA scenarios of IPCC last report are unrealistic, making IPCC conclusionsunreliable
More graphs and papers are on the site www.oilcrisis.com/laherrere
References:-Ayres et al 2002 “Exergy, power and work in the US economy” INSEAD working papers2002/52/EPS/CMER-Bardi U. 2004 «Price trends over a complete Hubbert cycle!: the case of the Americanwhaling industry in the 19th century!»-Bartlett A. 1998 "Forgotten Fundamentals of the Energy Crisis"-BGR 2002” Reserves, Resources and Availability of Energy Resources 2002!» FederalInstitute for Geosciences and Natural Resources, Hanover-Bourgeois-Pichat J. 1988 "Du XXe siecle au XXIe siecle, l'Europe et sa population apres l'an2000" Popul 1-BP Statistical Review of world energy http://www.bp.com/statisticalreview2004-Campbell’s scenario (2004 b)-DGEMP 2000 & 2004 http://www.industrie.gouv.fr/energie/statisti/se_stats.htm-DGEMP energy chart for France-DGEMP http://www.industrie.gouv.fr/cgi-bin/industrie/frame0.pl?url=/energie/sommaire.htm-FAO http://faostat.fao.org/faostat/collections?subset=agriculture-Grand Father Economic Report: http://mwhodges.home.att.net/http://www.npg.org/specialreports/bartlett_index.htm-Hubbert M.K 1956 "Nuclear energy and fossil fuels " Am. Petrol. Inst. Drilling & ProductionPractice, Proc. Spring Meeting San Antonio Texas p7-25. !-IIASA scenarios for IPCC 2000 http://www.grida.no/climate/ipcc/emission/data/allscen.xls-Laherrère J.H. 2004 «Review for Petroleum Geoscience of an article by Klett & Gauthier«Reserve growth in oil fields of the North Sea»http://www.oilcrisis.com/laherrere/reviewKlettGautier.pdf-Laherrère J.H. 2004 «Natural gas future supply» IIASA-IEW Paris IEA June 22-24http://www.hubbertpeak.com/laherrere/IIASA2004.pdf-Laherrère J.H. 2004 «Future of natural gas supply» ASPO Berlin May 25-26http://www.peakoil.net/JL/JeanL.html,http://www.hubbertpeak.com/laherrere/ASPO2004JL.pdf-Laherrère J.H. 2004 «Perspectives energetiques et scientifiques» Club des jeunes dirigeantsQuimper 22 Avril http://www.hubbertpeak.com/laherrere/quimper.pdf-Laherrère J.H. 1996 “Discovery and production trends” OPEC bulletin - Feb p7-11http://www.oilcrisis.com/laherrere/disctrnd.htm

Jean Laherrere «Present & future energy problems» HEC MBA Sustainable Development seminar 8 Sept. 2004
65
-Laherrère J.H. 1998 "The evolution of the world's hydrocarbons reserves" translation of SPEJune 17, http://dieoff.com/page178.htm-Lutz W., W.Sanderson & S.Scherbov 2001 "The end of world population growth" Naturevol 412, 2 August , p546-545-Lutz W., W.Sanderson & S.Scherbov 2004 «!The End of World Population Growth in the21st Century: New Challenges for Human Capital Formation and Sustainable Development.!»Editors London, UK: Earthscan,-Maillard D. et Lavergne R. 2002 "Statistiques Energétiques: Eléments pour un débat" Revuede l'Energie n° 538 Juillet-Aout p456-459-Milkow A.V. 2004 “Global estimates of hydrate-bound das in marine sediments: how muchis really trhere?” Earth-Science Review-Nesme-Ribes E., Thuillier G. 2000 "Histoire solaire et climatique" editions Belin-Pour lascience-New Scientist (2003)-Newsweek Aug.16, 2004 BP CEO states that gas consumption could grow threefold by 2050.-Petit JR. et al 1997 "Four climates cycles in Vostok ice core" Nature, v387, 22 May p359.-Pimentel D. 1998 "Energy and dollar costs of ethanol; production with corn" Hubbert centerNewsletter http://hubbert.mines.edu/news/v98n2/mkh-new7.html-Pimentel et al 2003-Redefining Progress http://www.redefiningprogress.org/reserve growth is statistically nil. (Laherrere 1996, 2004)-Sandrea I. Merril Lynch «Deepwater oil discovery rate may have been peaked: productionpeak may follow in 10 years!» OGJ 26 July 2004:-Saudi Aramco 2004 Baqi M.M.A. & Saleri N.G. “Fifty-year crude oil supply scenarios;Saudi Aramco’s perspective” 24 Feb. CSIS Washington DC-Simmons M. 2004 “A case study on peak energy: the US’s natural gas disaster” ASPOconference Berlin http://www.simmonsco-intl.com/web/downloads-Soloviev V A et al 2000 “Gas Hydrate Accumulations and Global Estimation of MethaneContent in Submarine Gas Hydrates” Western Pacific Geophysics Meeting AGU-SPE/WPC 1997: "SPE/WPC reserves definitions approved" JPT May p527-528-UN 2003 “World population in 2300” ESA/P/WP 187 9 December-University Utrecht "populstat" site: Jan Lahmeyer-US electricity flow http://www.eia.doe.gov/emeu/aer/diagram5.html-USCB http://www.census.gov/ipc/www/idbsprd.html-USDOE AEO 2004 Report: DOE/EIA-0383(2004), Januaryhttp://www.eia.doe.gov/oiaf/aeo/index.html-USDOE IEA http://www.eia.doe.gov/emeu/iea/contents.html-USDOE IEO 2004 Report: DOE/EIA-0484(2004), Aprilhttp://www.eia.doe.gov/oiaf/ieo/index.html-WEC 2003 «!Drivers of the enrgy scene!: what are they!? what do they lead us!?!» Studychaired by Dr. Al^Moneef, presneted by J.M. Bourdaire 23rd IAEE North Americanconference Mexico Cith Oct.21-Zittel W., Schindler J. 2003 “the imminent peak of oil production” Nov.7, Berlin