Embed Size (px)
Citation preview
Geodesy and Geodynamics 2013 ,4(3) :65 -70
http :llwww. jgg09. com
Doi:10.3724/SP.J. 1246.2013.03065
Present-day deformation of Agung volcano, Indonesia,
as determined using SBAS-InSAR
Ji Lingyun, Wang Qingliang and Qin Shanlan
Second Crust Monitoring and Application Center, China Earthquake Administration, Xi'an 710054, China
Abstract:Based on ALOS PALSAR images, time senes deformation fields of the Agung volcano area were
obtained using SBAS-lnSAR in 2007 - 2009. The time series deformation showed obvious inflation around the
Agung volcano area, which was positively correlated with time. We modeled the cumulated deformation
interferogram based on Mogi point source and vertical prolate spheroid source. The deformation model
indicated that the vertical prolate spheroid model fit the observed deformation reasonably well. The magma
chamber was located beneath the center of the volcano at a depth of approximately 5 km beneath the summit.
Key words : SBAS-lnSAR; time series deformation; magma chamber parameter; atmospheric phase screen;
volcanic activity
1 Introduction
Agung is a stratovolcano located on the eastern side of
Bali Island, Indonesia, and possesses a summit eleva
tion of 3142 meters (Fig. 1). The volcano lies 300 km
north of the Java trench, where the Indo-Australian
plate subducts beneath southeast Asia. Agung presents
the highest peak on Bali Island. The volcano's cone is
steep and is almost barren on top , possessing an open
performed in the Agung volcano area until now due to
socioeconomic and logistical barriers , which makes the
application of satellite-based monitoring techniques
such as satellite-based synthetic aperture radar interfer
ometry ( lnSAR) highly desirable. lnSAR combines
two SAR images taken at different times from nearly the
same point in space to determine the deformation of the
area along the radar's line of sight (LOS) over time.
funnel-shaped crater measuring 520 X 375 meters[ 1l . 8.1°8
Over the past 200 years , Agung has erupted several
times, including in 1808, 1821, 1843, 1963-64. The
tremendous explosive eruption in 1963, which was
classified as a Plinian eruption , claimed more than
1000 lives , and the dust cloud spread over the entire
globe[21. Due to these contemporary eruptions, it is
necessary to determine whether Agung is still active.
However, ground-based monitoring has not been
Received :2013.{)2.{)6; Accepted :2013.{)3-04
Corresponding author:Ji Lingyun, Tel: + 86-29-85506715, E-mail: din·
smDlO@ 163. com
This work was supported by the Special Earthquake Research Project,
China Earthquake Administration ( 201208009).
8.4°8
115.5°E 115.8°E 116.1 °E
Figure 1 Shaded relief topographic map of the area surrounding
the Agung volcano in eastern Bali Island. The inset
shows the location of Bali Island (small rectangle) and
the surrounding area. The dashed -line box outlines the
interferogram area. The heavy solid line in the inset
maps the Java trench
66 Geodesy and Geodynamics Vol.4
In the past two decades, InSAR has been proved to be
a useful tool for surveying large regions of deformation
in volcanic areas['-'l. Currently, SBAS-InSAR (Small
Baseline Subsets, Interferometric Synthetic Aperture
Radar) is widely used in detecting volcanic deforma
tion[7 -ll] for it could reduce clecorrelation. In the pres
ent study , we used SBAS-InSAR to detect potential
deformation fields in 2007 - 2009. To understand the
physical development of the volcanic system during this
time period, we used a Mogi source model and a vertical
prolate spheroid model to inverse the parameters of the
magma chamber.
2 Data and method
2.1 SAR data and analysis
Due to the presence of dense vegetation cover, we used
ALOS PALSAR data, which operates on the L band
and is less susceptible to vegetation. Between January
of 2007 and January of 2009, ALOS acquired 14 radar
images covering the Agung volcano region and provided
2 years of continuous observations.
Our goal was to detect any possible deformations ;
thus, the most efficient strategy was to make interfero
grams spanning long time periods so that the magnitude
of the deformation was as high as possible. However,
this approach failed for the Agung volcano area due to
temporal decorrelation, which was caused by densely
covered forest. Even though L-band SAR images were
selected , interferograms spanning time intervals of 6
months or longer typically possessed large decorrelated
areas. Even at intervals of less than 6 months, the
western flank of the volcano was decorrelated in many
interlerograms , but coherence on the northeastern flank
was good. Longer perpendicular baselines can be used
to increase the percentage of decorrelation, but ouly at
the shortest time intervals , and perpendicular baseline
values up to 800 m usually produce good results["].
2. 2 Method of lnSAR data processing
Traditional InSAR studies can often be contaminated by
potential atmospheric artifacts in SAR images and phase
unwrapping errors such as DEM errors. Zebker[n] sug
gested that a 20% spatial or temporal change in rela-
live humidity could result in a 10-to 14-cm error in
deformation measurement retrievals. In the Agung
volcano area, atmospheric artifacts were severe in cer
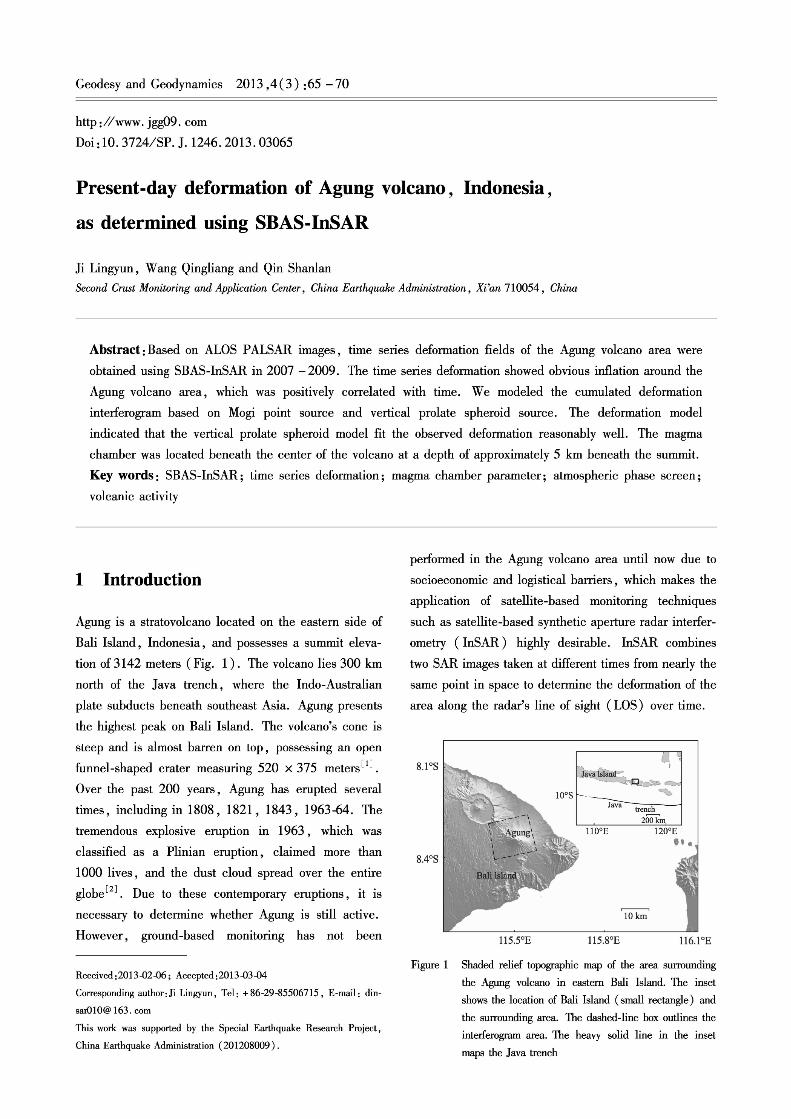
tain SAR images. Figure 2 shows three unwrapped
interferograms. The first interferogram was created
using two images taken on July 9, 2007 and August
24 , 2007. The second interferogram was produced
using images taken on August 24 , 2007 and October 9 ,
2007. The third interferogram was obtained using ima
ges taken on July 9, 2007 and October 9, 2007. As
shown in the figure , the color patterns of the first two
interferograms were very different from one another.
Moreover, the phase difference between the cone and
flank was approximately 3 - 4 radians, which was high
compared to the topography. Typically, this character
istic is induced by atmospheric artifacts. Furthermore,
the third interferogram did not show significant phase
differences. Thus, we concluded that the large phase
differences shown in figures 2(a) and 2(b) were caused
by atmospheric artifacts on the image obtained on
August 24 , 2007.
Due to the presence of atmospheric artifacts , we
used the SBAS-InSAR algurithm, which was originally
proposed by Berardino[l4J and refined by Jung["l. The
SBAS-InSAR algorithm is a robust InSAR time series
analytical approach that uses interferograms with small
baselines to minimize the effects of spatial decorrelation
and topographic errors. The atmospheric artifacts were
mitigated through temporal high-pass and spatial low
pass filtering of interferograms because atmospheric
artifacts are highly correlated in space but poorly corre
lated in time[l4-!6l. The refined SBAS-InSAR algo
rithm improved the time series deformation in four
ways. Namely, high-quality interferograms were used
to correct phase unwrapping errors , an iteration proce
dure was performed to estimate the deformation and
errors , the finite difference smoothing approach was
used to reduce the temporal noise , and error in the reference point was corrected [ lSJ •
To select InSAR pairs for using in SBAS processing,
the baselines of all possible combinations were esti
mated. Subsequently, we selected the InSAR combina
tions that exhibited a mutual perpendicular baseline
less than 1000 m , and the corresponding time span
intervals were set to less than 6 months. From all of the
No.3 Ji Lingyun,et al. Present-day deformation of Agung volcano, Indonesia, as determined using SBAS-InSAR 67
8.30°S
8.40°S
115.500E 115.50°E 115.50°E
(a) Images taken on July 9, 2007 and August 24, 2007
(b) Images taken on August 24, 2007 and October 9, 2007
(c) Images taken on July 9, 2007 and October 9, 2007
-4 -2 0 2 unit (rad)
Figure 2 Unwrapped interferograms showing atmospheric artifacts
interferograms , a complex multi -look operation was
applied , with 4 by 9 looks in the range and azimuth ,
respectively. The ground range pixel dimensions of the
interferograms were approximately 30 X 30 m in the
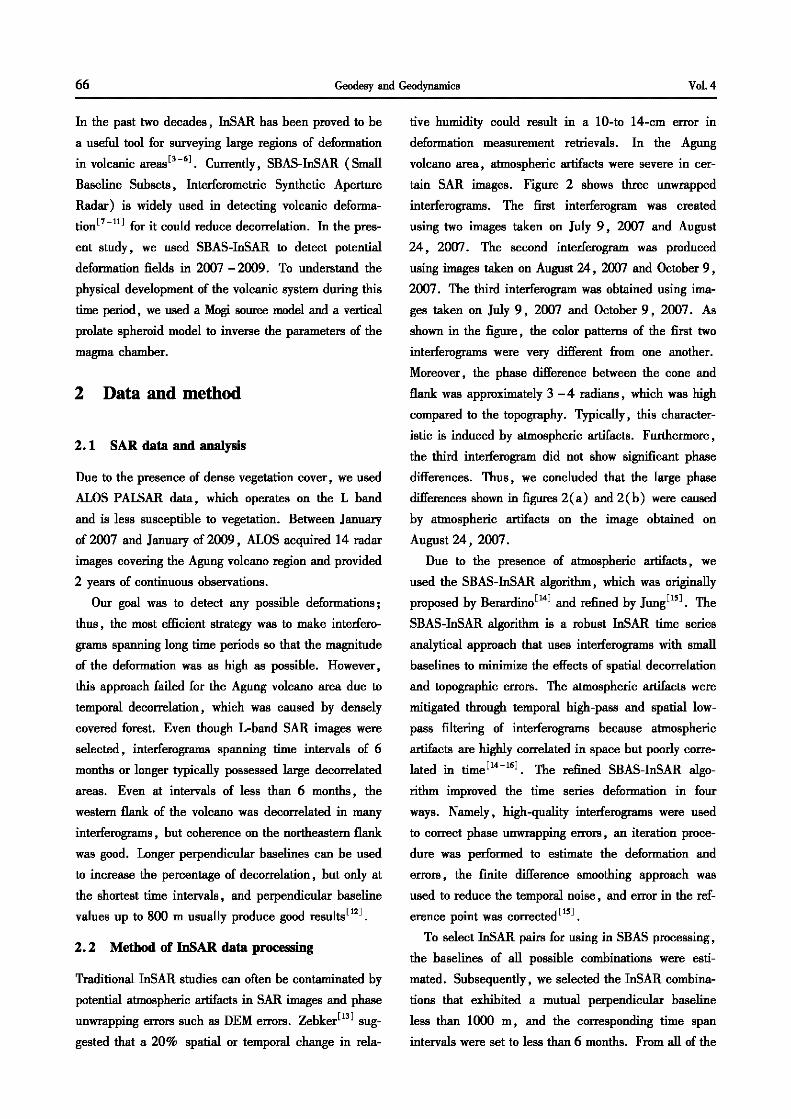
range and azimuth directions. We selected 12 high sig
nals to noise ratio interferograms, which were con
tained in one subset , as indicated by the connecting
lines in figure 3. Prior to SBAS processing , we deter
mined and removed baseline errors in several interfero
grams based on an existing DEM using a least-squares
approach[n,IsJ.
2.0
1.5
2008 Time (year)
Figure 3 Baselines and InSAR combinations. Images are
denoted by black triangles and labeled with the
corresponding date. Black solid lines connecting
triangles represent perpendicular baselines of the
corresponding interferograms
2. 3 SBAS-InSAR-derived time series deformation
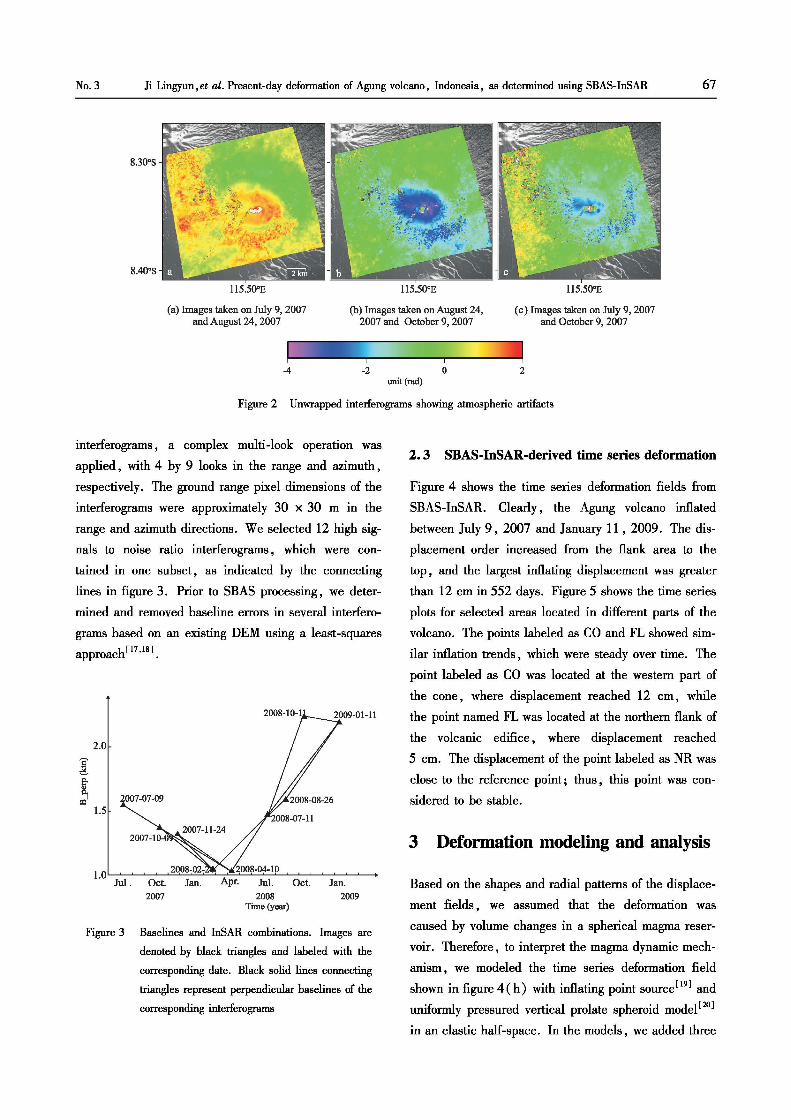
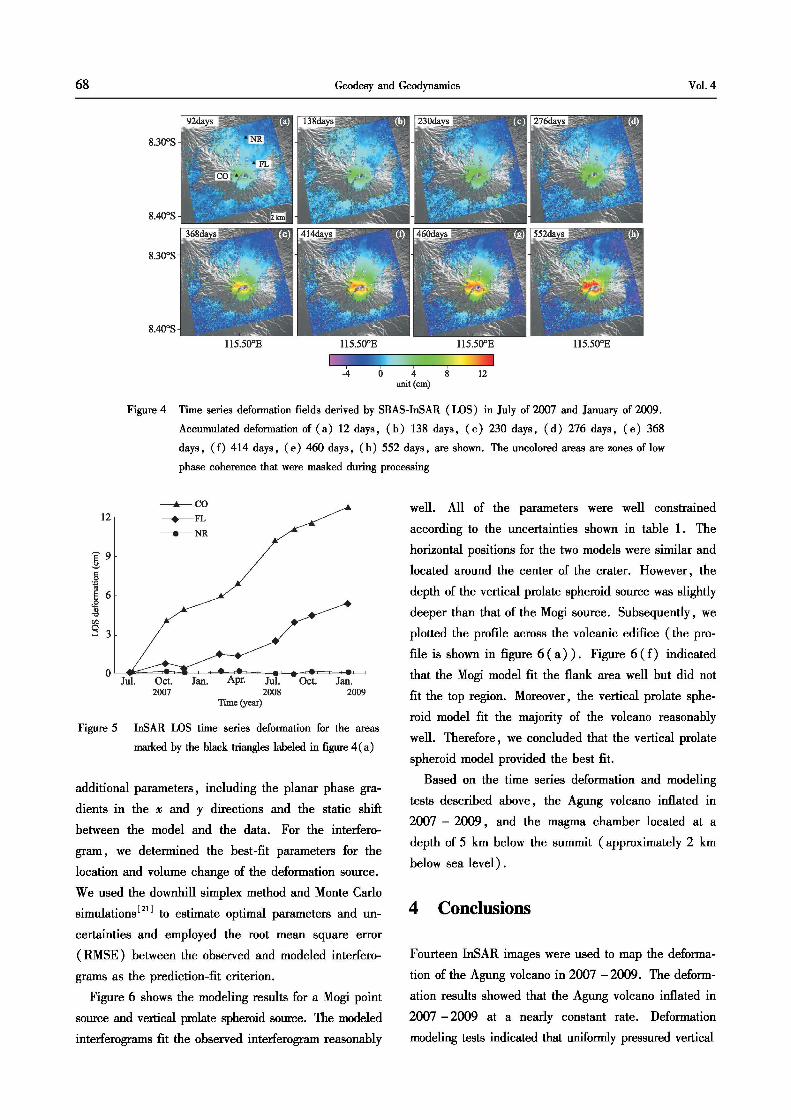
Figure 4 shows the time series deformation fields from
SBAS-InSAR. Clearly, the Agung volcano inflated
between July 9 , 2007 and January 11 , 2009. The dis
placement order increased from the flank area to the
top , and the largest inflating displacement was greater
than 12 em in 552 days. Figure 5 shows the time series
plots for selected areas located in different parts of the
volcano. The points labeled as CO and FL showed sim
ilar inflation trends, which were steady over time. The
point labeled as CO was located at the western part of
the cone, where displacement reached 12 em, while
the point named FL was located at the northern flank of
the volcanic edifice , where displacement reached
5 em. The displacement of the point labeled as NR was
close to the reference point; thus, this point was con
sidered to be stable.
3 Deformation modeling and analysis
Based on the shapes and radial patterns of the displace
ment fields , we assumed that the deformation was
caused by volume changes in a spherical magma reser
voir. Therefore , to interpret the magma dynamic mech
anism , we modeled the time series deformation field
shown in figure 4 ( h) with inflating point source [ 19] and
uniformly pressured vertical prolate spheroid model [2o]
in an elastic half-space. In the models, we added three
68 Geodesy and Geodynamics Vol.4
-4 0 4 8 12 unit (em)
Figure 4 Time series deformation fields derived by SBAS-InSAR (LOS) in July of 2007 and January of 2009.
Accumulated deformation of (a) 12 days, (b) 138 days, ( c) 230 days, ( d) 276 days, (e) 368
days , (f) 414 days , ( e) 460 days, ( h) 552 days , are shown. The uncolored areas are zones of low
phase coherence that were masked during processing
12
_____._____co ----+--FL
--------NR
Jan. Jul. Oct. Jan. 2008 2009
Time (year)
Figure 5 InSAR LOS time series deformation for the areas
marked by the black triangles labeled in figure 4 (a)
additional parameters, including the planar phase gra
dients in the x and y directions and the static shift
between the model and the data. For the interfero
gram, we determined the best-fit parameters for the
location and volume change of the deformation source.
We used the downhill simplex method and Monte Carlo
simulations[ltJ to estimate optimal parameters and un
certainties and employed the root mean square error
( RMSE ) between the observed and modeled interfero
grams as the prediction-fit criterion.
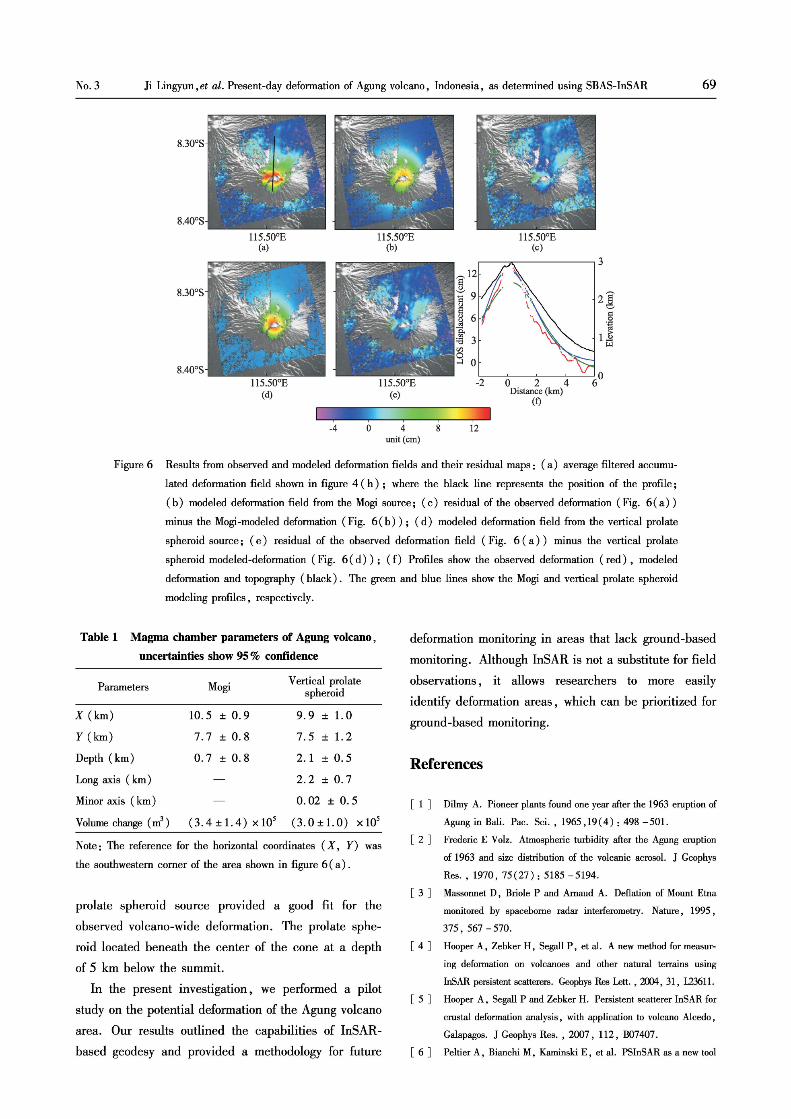
Figure 6 shows the modeling results for a Mogi point
source and vertical prolate spheroid source. The modeled
interferograms fit the observed interferogram reasonably
well. All of the parameters were well constrained
according to the uncertainties shown in table 1. The
horizontal positions for the two models were similar and
located around the center of the crater. However, the
depth of the vertical prolate spheroid source was slightly
deeper than that of the Mogi source. Subsequently, we
plotted the profile across the volcanic edifice ( the pro
file is shown in figure 6 (a) ) . Figure 6 (f) indicated
that the Mogi model fit the flank area well but did not
fit the top region. Moreover, the vertical prolate sphe
roid model fit the majority of the volcano reasonably
well. Therefore, we concluded that the vertical prolate
spheroid model provided the best fit.
Based on the time series deformation and modeling
tests described above , the Agung volcano inflated in
2007 - 2009 , and the magma chamber located at a
depth of 5 km below the summit ( approximately 2 km
below sea level) .
4 Conclusions
Fourteen lnSAR images were used to map the deforma
tion of the Agung volcano in 2007 - 2009. The deform
ation results showed that the Agung volcano inflated in
2007 -2009 at a nearly constant rate. Deformation
modeling tests indicated that uniformly pressured vertical
No.3 Ji Lingyun, et al. Present -day deformation of Agung volcano, Indonesia, as determined using SBAS-InSAR 69
115.50°E (c)
3 ,-._ 12 1: :~
! ·--..... :-, ' ·~
2~ i:l 9 \'\; ,
e \\ 8 6 !5 ~ -~ ~
3 1~ ;a r.l.l
~
0 '\.::: ......:l 0
115.50°E (d)
115.50°E (e)
-2 0 2 4 60 Distance (km)
(f)
-4 0 4 unit (em)
12
Figure 6 Results from observed and modeled deformation fields and their residual maps: (a) average filtered accumu
lated deformation field shown in figure 4 ( h ) ; where the black line represents the position of the profile ;
( b) modeled deformation field from the Mogi source ; ( c) residual of the observed deformation ( Fig. 6 ( a) )
minus the Mogi -modeled deformation (Fig. 6 (b) ) ; ( d) modeled deformation field from the vertical prolate
spheroid source ; ( e ) residual of the observed deformation field ( Fig. 6 ( a) ) minus the vertical prolate
spheroid modeled-deformation (Fig. 6 (d) ) ; (f) Profiles show the observed deformation ( red) , modeled
deformation and topography ( black) . The green and blue lines show the Mogi and vertical prolate spheroid
modeling profiles, respectively.
Table 1 Magma chamber parameters of Agung volcano,
uncertainties show 95% confidence
Parameters
X (km)
Y (km)
Depth (km)
Long axis ( km)
Minor axis ( km)
Volume change ( m3 )
Mogi
10.5 ± 0. 9
7.7±0.8
0. 7 ± 0. 8
Vertical prolate spheroid
9.9 ± 1.0
7.5 ± 1.2
2.1 ± 0.5
2. 2 ± 0. 7
0.02 ± 0.5
( 3. 4 ± 1. 4) X 105 ( 3. 0 ± 1. 0) X 105
Note: The reference for the horizontal coordinates (X, Y) was
the southwestern comer of the area shown in figure 6 ( a) .
prolate spheroid source provided a good fit for the
observed volcano-wide deformation. The prolate sphe
roid located beneath the center of the cone at a depth
of 5 km below the summit.
In the present investigation , we performed a pilot
study on the potential deformation of the Agung volcano
area. Our results outlined the capabilities of lnSAR
based geodesy and provided a methodology for future
deformation monitoring in areas that lack ground-based
monitoring. Although InSAR is not a substitute for field
observations, it allows researchers to more easily
identify deformation areas , which can be prioritized for
ground-based monitoring.
References
[ 1 ] Dilmy A. Pioneer plants found one year after the 1963 eruption of
Agung in Bali. Pac. Sci. , 1965,19 ( 4) : 498 -501.
[ 2 ] Frederic E Volz. Atmospheric turbidity after the Agung eruption
of 1963 and size distribution of the volcanic aerosol. J Geophys
Res. , 1970, 75 (27) : 5185 -5194.
[ 3 J Massonnet D, Briole P and Arnaud A. Deflation of Mount Etna
monitored by spacebome radar interferometry. Nature, 1995,
375' 567 -570.
[ 4 ] Hooper A, Zebker H, Segall P, et al. A new method for measur
ing deformation on volcanoes and other natural terrains using
lnSAR persistent scatterers. Geophys Res Lett. , 2(X)4, 31, 123611.
[ 5 ] Hooper A, Segall P and Zebker H. Persistent scatterer lnSAR for
crustal deformation analysis, with application to volcano Alcedo,
Galapagos. J Geophys Res. , 2007, 112, B07407.
[ 6 ] Peltier A, Bianchi M, Kaminski E , et al. PSinSAR as a new tool
70 Geodesy and Geodynamics Vol.4
to monitor preemptive volcano ground deformation: Validation
using CPS measurements on Piton de Ia Fournaise. Geophys Res
Lett. ' 2010. 37 ' L12301.
[ 7 ] Lundgren P, Casu F, Manzo M, et al. Gravity and magma
induced spreading of Mount Etna volcano revealed by satellite
radar interl'erometry. Geophys Res Lett. , 2004 , 31 ( 4 ) : 1..04602
[ 8 ] Pepe A, Manzo M, Casu F, et al. Surface deformation of active
volcanic areas retrieved with the SBAS-DinSAR technique: an
overview. Annals of Geophysics, 2008,51(1) :247-263.
[ 9 ] Casu F, Poland M P, Solaro G, et al. Surface deformation
dynamics of Mauna Loa and Kilauea volcanoes , Hawaii , revealed
by lnSAR time series analysis. American Geophysical Union,
Fall Meeting, 2008, VllB -2023.
[ 10] Lee C W, Lu Z, Jung H S, et al.. Surface defomtation of Augus
tine Volcano , 1992 - 2005 , from multiple-interferogram processing
using a refined Small Baseline Subset ( SBAS) Interferometric
Synthetic Aperture Radar ( lnSAR) approach. The 2006 eruption
of Augustine Volcano, Alaska: U.S. Geological Survey Profes
sional Paper 1769: 453-465.
[11] Ji Lingyun, Wang Qingliang, Cui Duxin, et al. Time series of
deformation in Tengchong volcanic area extracted by SBAS-Din
SAR, Journil of Geodesy and Geodynami.,., 2011, 31 ( 4),
149-154. (in Chine•e)
[ 12] Philihosian B and Simons M. A survey of volcanic deformation on
Java using ALOS PALS.AR interferometric time series. Geochem
Geoph)"' Geo"Y"t-, 2011,12, Q11004.
[ 13] Zebker H A, Rosen P A and Hensley S. Atmospheric effects in
interferometric synthetic aperture radar surface deformation and
topographic maps. I Geophys Res. , 1997, 102, 7547 -7563.
[ 14] Berardino P, Fomaro G, l.aruui Rand Sansosti E. A new algo-
rithm for surface deformation monitoring based on small baseline
differential SAR interferograms. Institute of Electrical and Elec
tronics Engineers Transactions on Geosciences and Remote Sens
ing, 2002, 40(11), 2375-2383.
[15] Jung H S, Lee C W, Pork J W, Kim K D and Won J S. Im
provement of small baseline subset ( SBAS) algorithm for measur
ing time-series surface deformations from differential SAR inter
ferograms. Korean Journal of Remote Sensing, 2008,24, 165-
177. (in Korean)
[16] Ferretti A, Prati C and Rocca F. Nonlinear subsidence rate esti
mation using pennanent scatterers in differential SAR interferome
try. IEEE Transactions on Geoscience and Remote Sensing,
2000, 38(5)' 2202-2212.
[ 17 ] Ro•en P , Hensley S , Zebk« H , Webb F H and Fielding E !.
Surface deformation and coherence measurements of Kilauea Vol
cano, Hawaii, from SIR-C radar interferometry. Jour Geophys
Rea., 1996, 101,23109-23125.
[ 18] lu Z. lnSAR imaging of volcanic deformation over cloud-prone
areas-Aleutian islands. Photog Engi Rem Sens. , 2007,73 ( 3) :
245 -257.
[ 19 ] Mogi K. Relations between the eruptions of various volcanoes and
the deformations of the ground surface around them. Bull Earth
quake Res. , Institute University. Tokyo, 1958,36: 99 -134.
[ 20] Yang X M, Davis P and Dieterich J H. Deformation from infla
tion of a dipping finite prolate spheroid in an elastic half-space as
a model for volcanic stressing. J Geophys Res. , 1988 ,93: 4249 -
4257.
[21] Preos W, Teukolaky S, Vetteding Wand Flannery B. Numerioil
Recipes in C, the Art of Scientific Computing. Cambridge Uni
versity. Press, New York, 1992,994.