Embed Size (px)
Citation preview
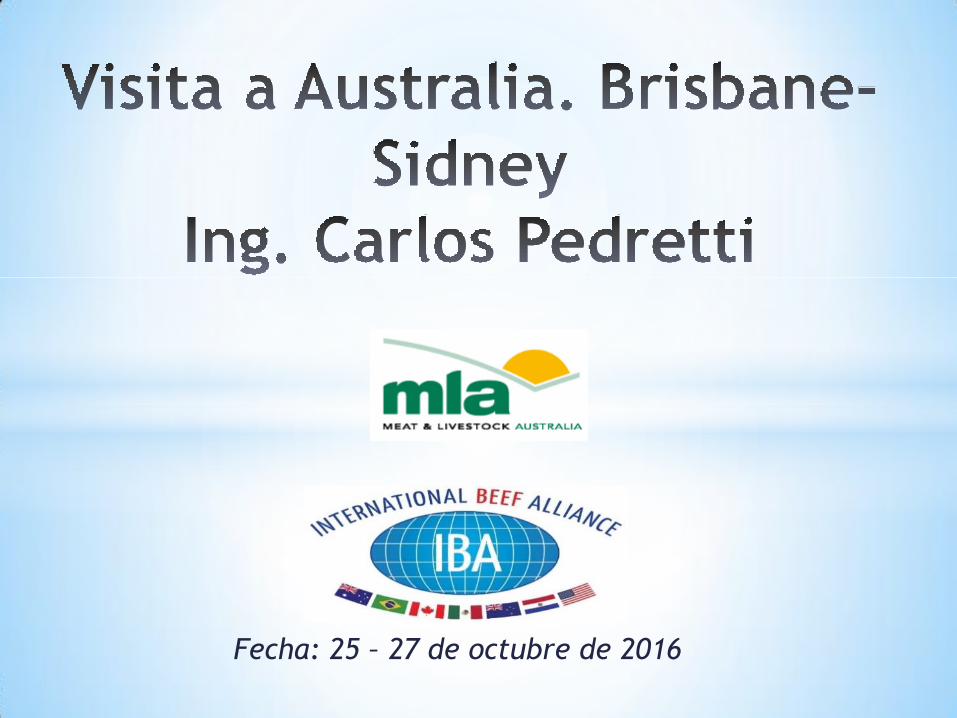
Fecha: 25 – 27 de octubre de 2016
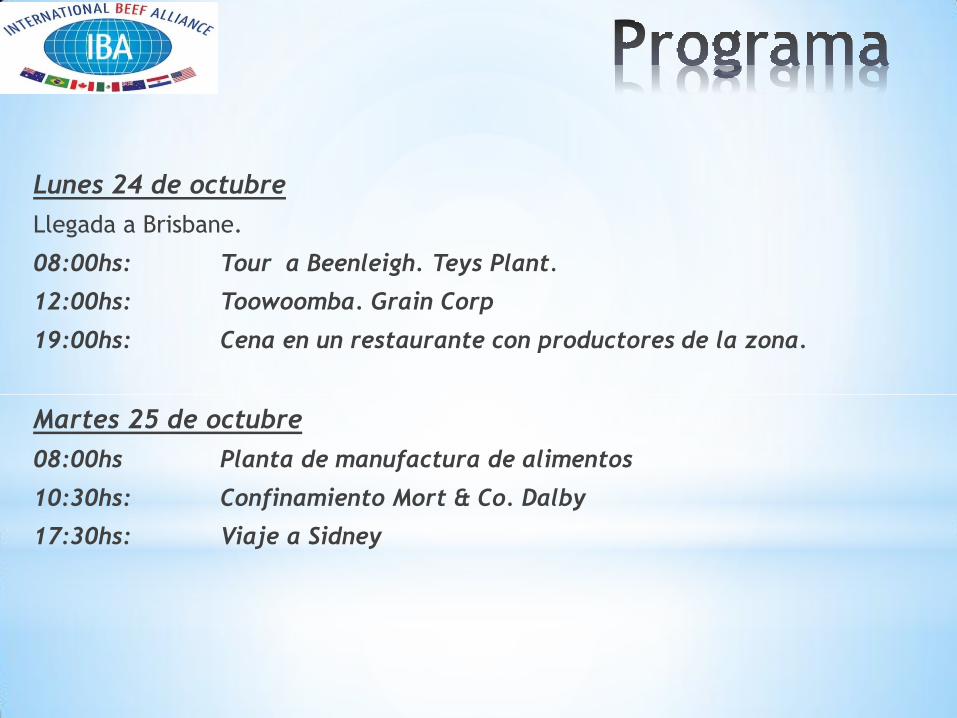
Lunes 24 de octubre
Llegada a Brisbane.
08:00hs: Tour a Beenleigh. Teys Plant.
12:00hs: Toowoomba. Grain Corp
19:00hs: Cena en un restaurante con productores de la zona.
Martes 25 de octubre
08:00hs Planta de manufactura de alimentos
10:30hs: Confinamiento Mort & Co. Dalby
17:30hs: Viaje a Sidney
Miércoles 26 de octubre
08:00hs Reunión en MLA para ver los temas:
*Visión General de Meat and Livestock Australia (MLA), estructura,
fondos, leyes y acuerdos.
*MLA y alianzas con el sector público.
*Plan estratégico, plan de inversión anual.
*Programas (marketing, investigaciones, etc.)
*Evaluación de los programas, retorno de inversiones.
El Ing. Carlos Pedretti por sus propios medios realizó un viaje a Australia
para interiorizarse en lo que es el sector cárnico, su estructura y
funciones de cada organización. Gracias a los contactos hechos a través
de la Alianza, se pudo interiorizar en el sistema de trazabilidad
australiano, el sistema es netamente privado, es el productor el que se
encarga de poner las caravanas.
En cuanto a la fuente de financiación del MLA, el mismo es financiado
por un pago que realizan los productores por cada animal vendido, en el
caso de ganado bovino es de AU$ 5 por cabeza, totalizando un
presupuesto final de AU$ 198 millones anuales. En el caso de las
investigaciones por cada dólar invertido en investigación de los fondos
del MLA el estado colabora el mismo dólar, duplicando así los fondos
para los programas de investigaciones y desarrollo.


7 7
8 8
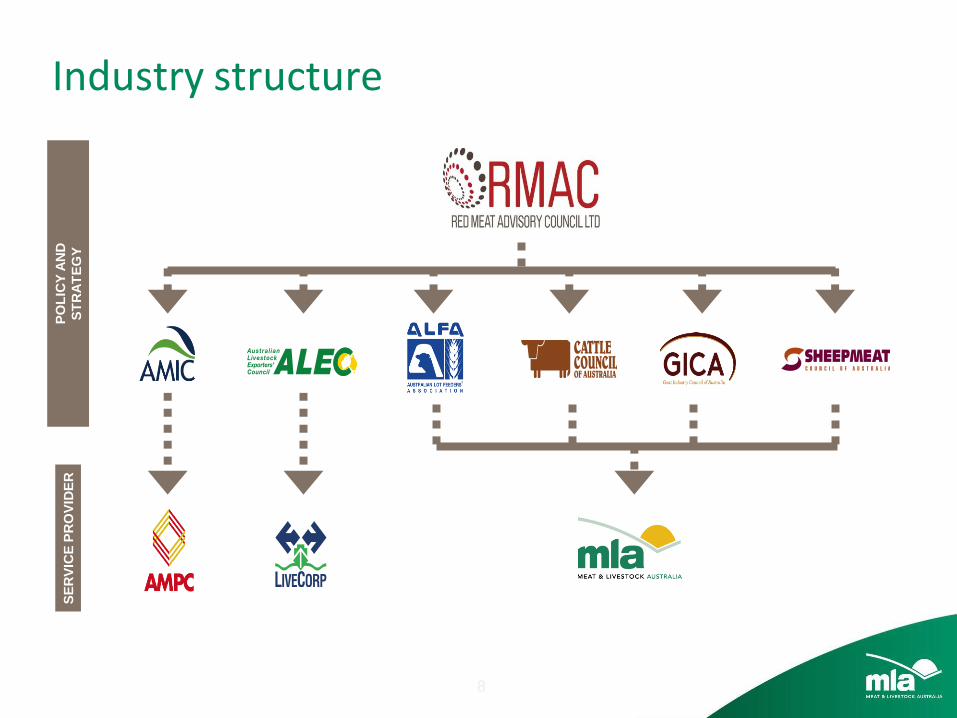
Industry structure P
OL
ICY
AN
D
ST
RA
TE
GY
S
ER
VIC
E P
RO
VID
ER
9 9
Meat & Livestock Australia (MLA)
MLA was established in 1998 as a public company limited by
guarantee, following the merging of two industry statutory
organisations – the Australian Meat & Livestock Corporation
and the Meat Research Corporation
MLA is the declared industry marketing body and the industry
research body under sections 60(1) and 60(2) of the Australian
Meat and Live-stock Industry Act 1997 AMLI Act)

10 10
MLA
MLA’s obligations are set out under a Statutory Funding
Agreement with the Commonwealth of Australia (Deed), and in
accordance with the ASX Corporate Governance Council’s
Corporate Governance Principles and Recommendations (3rd
edition)
This framework has been implemented to ensure MLA remains
accountable to its stakeholders and stakeholder interests are
protected

MLA governance framework
12 12
Our funding
MLA is primarily funded by transaction levies paid on livestock sales by producers
The Australian Government also contributes a dollar for each levy dollar MLA invests in research and development
Other funding streams come from specific unmatched grants from the Australian Government and cooperative funding contributions from other Research and Development Corporations, individual processors, wholesalers, foodservice operators and retailers
13 13
Our funding (cont)
Processors and live animal exporters also co-invest levies into MLA programs through their service companies: the Australian Meat Processor Corporation and LiveCorp
Individual exporters and importers can also co-invest with MLA on marketing activities
MLA generates additional income via commercial funding contributions which are matched by the Australian Government - this funding is invested in research and development partnerships that benefit the Australian red meat industry through MLA Donor Company
14 14
MLA’s members
Membership of MLA is voluntary and free to all levy-paying grassfed cattle, grainfed cattle, sheep, lamb and goat producers
MLA had 49,892 members at 30 June 2016

15 15
The Australian Government collects the levy
16 16
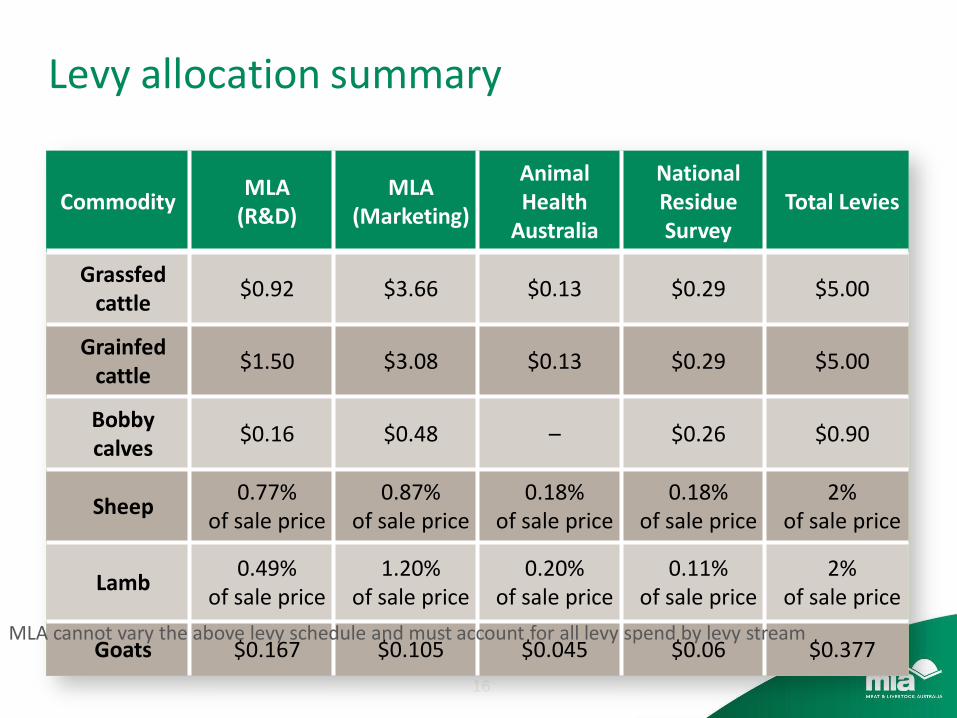
Levy allocation summary
Commodity MLA
(R&D) MLA
(Marketing)
Animal Health
Australia
National Residue Survey
Total Levies
Grassfed cattle
$0.92 $3.66 $0.13 $0.29 $5.00
Grainfed cattle
$1.50 $3.08 $0.13 $0.29 $5.00
Bobby calves
$0.16 $0.48 – $0.26 $0.90
Sheep 0.77%
of sale price 0.87%
of sale price 0.18%
of sale price 0.18%
of sale price 2%
of sale price
Lamb 0.49%
of sale price 1.20%
of sale price 0.20%
of sale price 0.11%
of sale price 2%
of sale price
Goats $0.167 $0.105 $0.045 $0.06 $0.377 MLA cannot vary the above levy schedule and must account for all levy spend by levy stream
MLA’s revenue 2015/16
A$198m
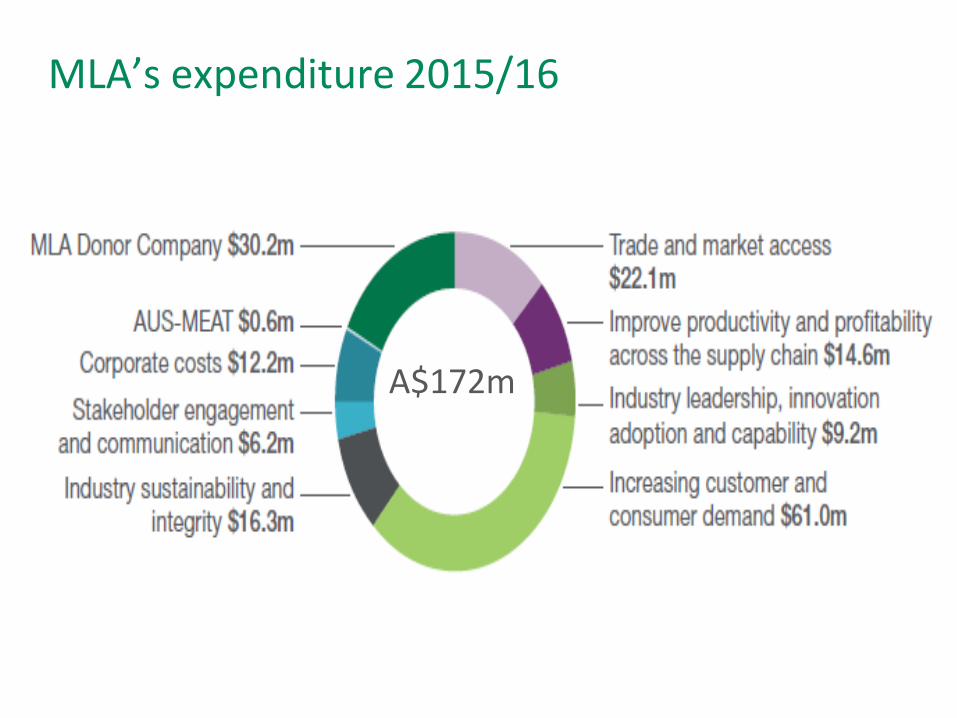
MLA’s expenditure 2015/16
A$172m

19 19
MLA’s role
MLA delivers research, development and marketing services to Australia's cattle, sheep and goat producers
Working with the Australian Government and the industry, MLA’s mission is to deliver value to levy payers by investing in initiatives that contribute to producer profitability, sustainability and global competiveness
MLA is a producer-owned, not-for-profit organisation and not an industry representative body

20 20
Our stakeholders
MLA works in partnership with industry and government to deliver products and services to the cattle, sheep and goat industries
Through the Science and Research Priorities and the Rural Research, Development and Extension Priorities, the Australian Government sets high-level priority research and development objectives covering community, industry and environmental concerns

Our stakeholders
Peak industry councils provide policy direction, scrutinise budgets and monitor MLA’s performance
These are: Australian Lot Feeders’ Association, Cattle Council of Australia, Goat Industry Council of Australia and Sheepmeat Council of Australia
MLA also works closely with the Australian Meat Processor Corporation, Australian Meat Industry Council, Australian Livestock Export Corporation (LiveCorp) and Australian Livestock Exporters’ Council to develop programs
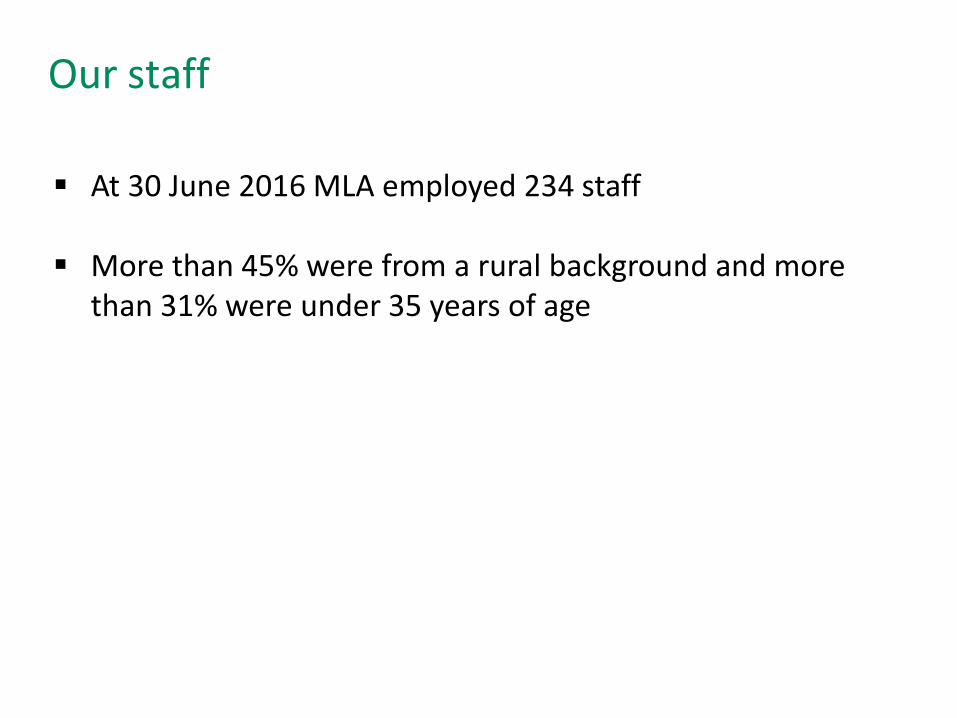
Our staff
At 30 June 2016 MLA employed 234 staff
More than 45% were from a rural background and more than 31% were under 35 years of age
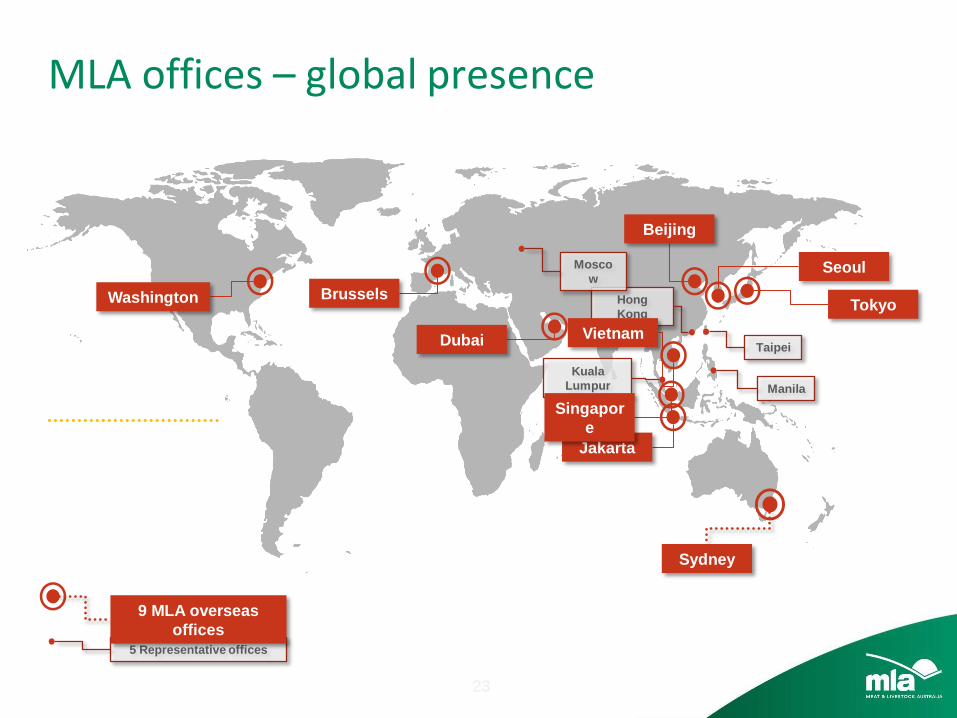
23 23
MLA offices – global presence
Sydney
Tokyo
Seoul
Beijing
Dubai
Brussels Washington
Kuala
Lumpur Manila
Taipei
Hong
Kong
Mosco
w
5 Representative offices
9 MLA overseas
offices
Jakarta
Singapor
e
Vietnam
24 24
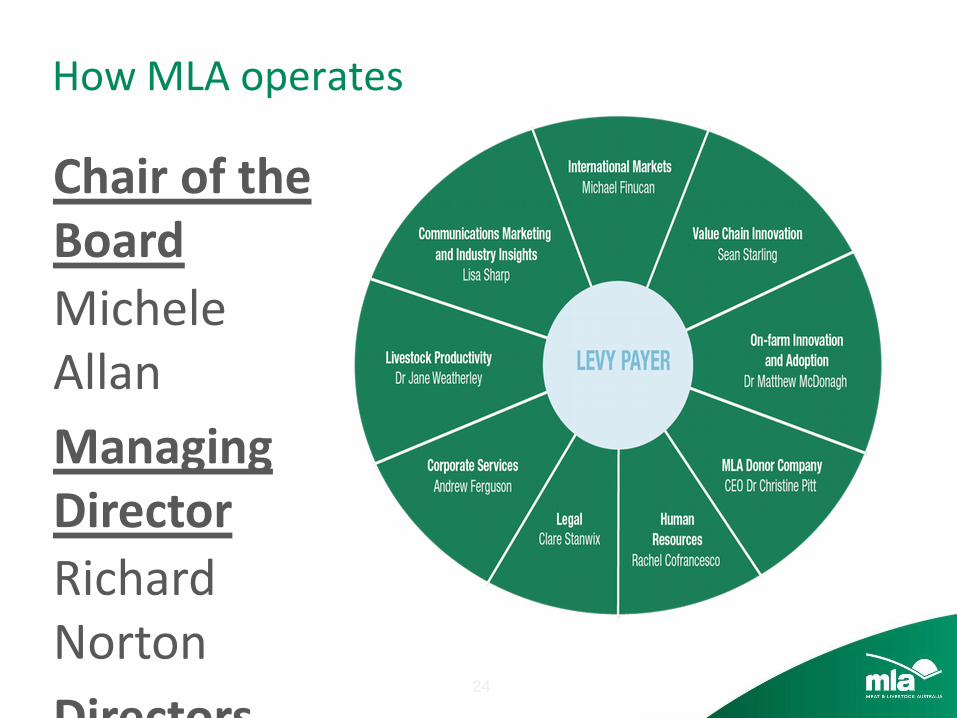
How MLA operates
Chair of the Board
Michele Allan
Managing Director
Richard Norton
Directors
Alan Beckett Lucinda Corrigan Geoff Maynard Erin Gorter Chris Mirams George Scott Steven Chaur Robert Fitzpatrick MLA has a skills based board
25 25
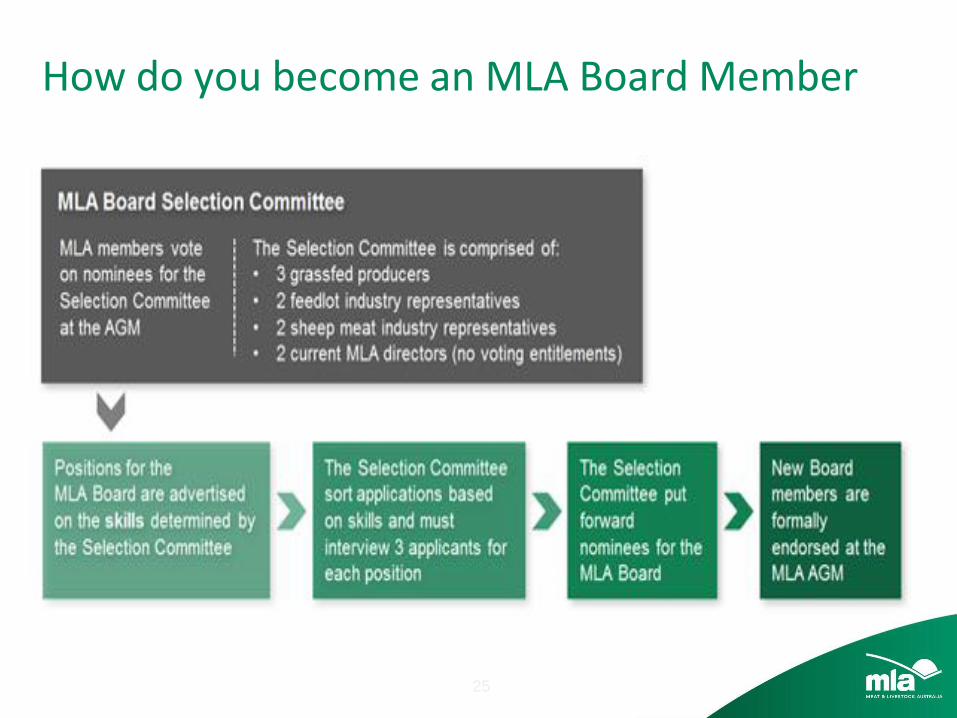
How do you become an MLA Board Member
26 26
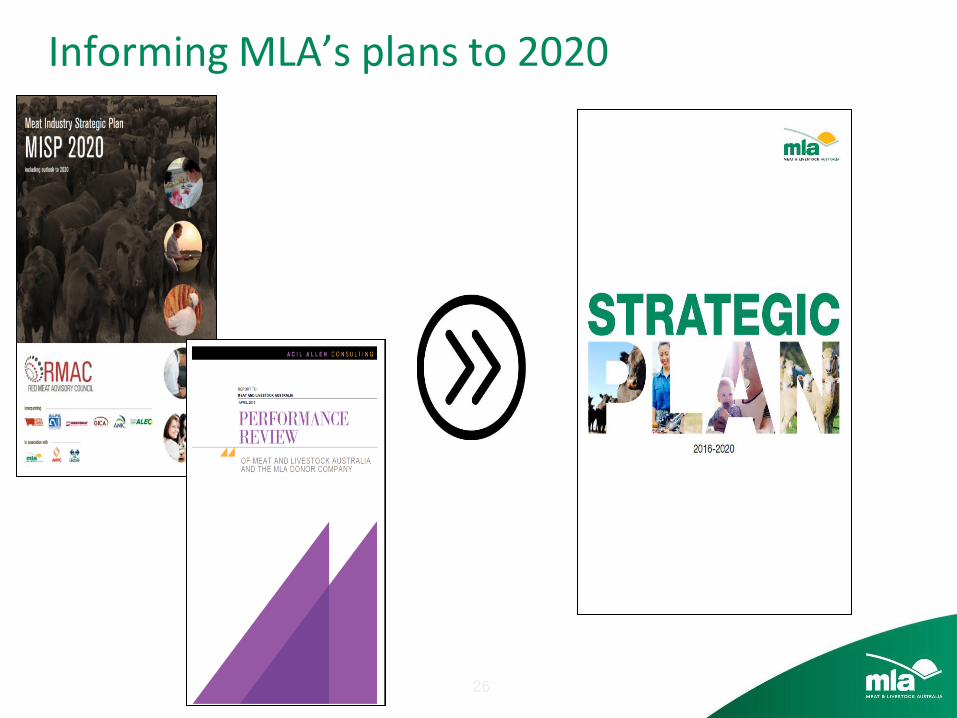
Informing MLA’s plans to 2020

27 27
Improved access to
markets, with
marketing programs
and value creating
innovation driving
increased consumer
and customer
preference and
premiums for
Australian red meat
The community
continues to support
and trust the
Australia red meat
and livestock
industry, with
industry practices in
step with community
expectations
Increased returns
through the value
chain, with
participants and
customers confident
in product quality,
pricing and integrity
systems
Productivity gains
through the value
chain from the
adoption of tools and
technologies
Industry participants
are confident in
industry leadership
capability
Industry participants
are confident that
the levy investment
is delivering value
MLA’s Strategic Plan 2016-2020
2
Market
growth and
diversificati
on
1
Consumer
and
community
support
3
Supply chain
efficiency
and integrity
4
Productivity
and
profitability
5
Leadership
and
collaborative
culture
6
Stakeholder
engagement
Pilla
r
Ou
tco
me
$58.7m $19.6m $20.6m $23.7m $5.3m $2.7m
Pro
jecte
d
$2016-1
7
28 28
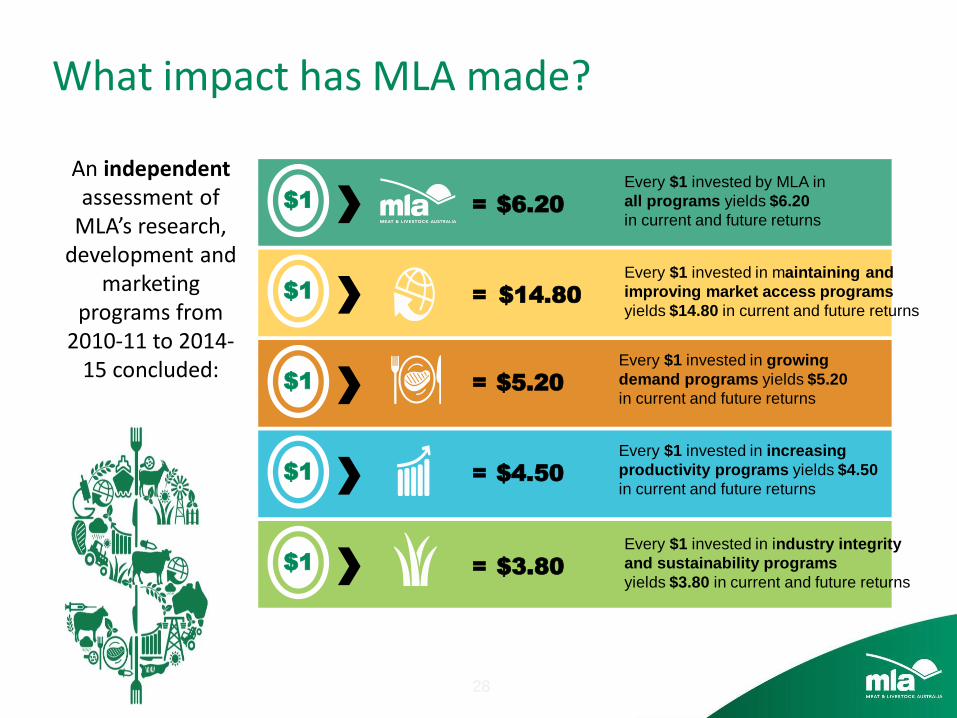
What impact has MLA made?
$1 = $14.80
Every $1 invested in maintaining and
improving market access programs
yields $14.80 in current and future returns
$1 = $4.50
Every $1 invested in increasing
productivity programs yields $4.50
in current and future returns
$1 = $5.20
Every $1 invested in growing
demand programs yields $5.20
in current and future returns
$1 = $3.80
Every $1 invested in industry integrity
and sustainability programs
yields $3.80 in current and future returns
An independent assessment of
MLA’s research, development and
marketing programs from
2010-11 to 2014-15 concluded:
$1 = $6.20
Every $1 invested by MLA in
all programs yields $6.20
in current and future returns
Beef Marketing in Australia
October 28th
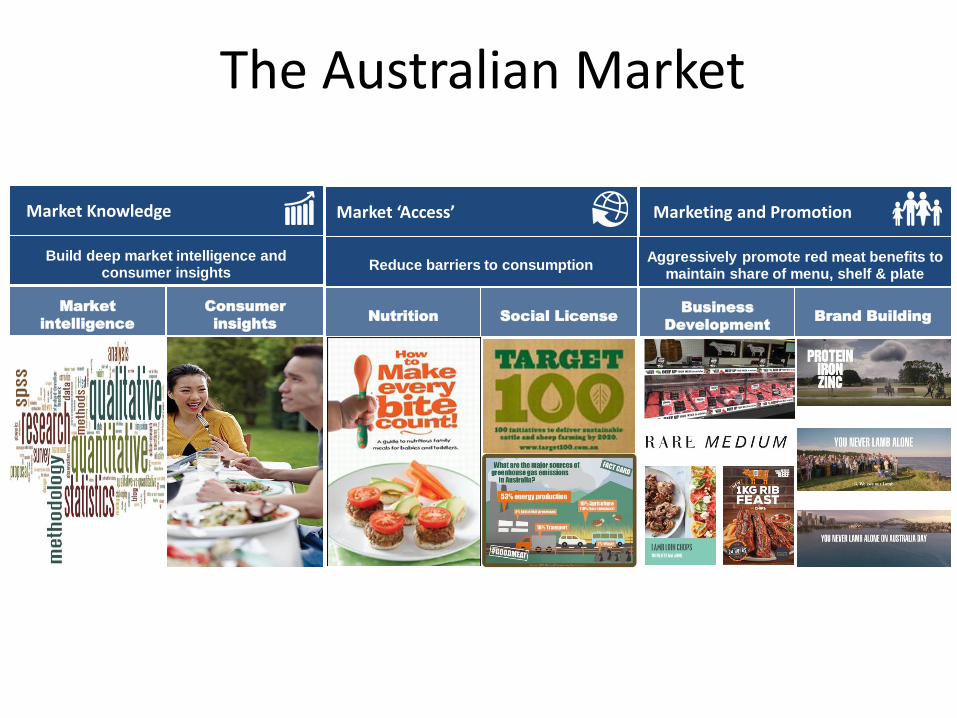
Market Knowledge
Market
intelligence
Consumer
insights
Build deep market intelligence and consumer insights
Market ‘Access’
Nutrition Social License
Reduce barriers to consumption
Marketing and Promotion
Business
Development Brand Building
Aggressively promote red meat benefits to maintain share of menu, shelf & plate
The Australian Market

Where does our beef go around the world?
Source: MLA estimates
30%
19% 18%
16%
11%
6%
Consumption of Australian beef by volume January to August 2016
Australia
US
Japan
Other
Korea
China
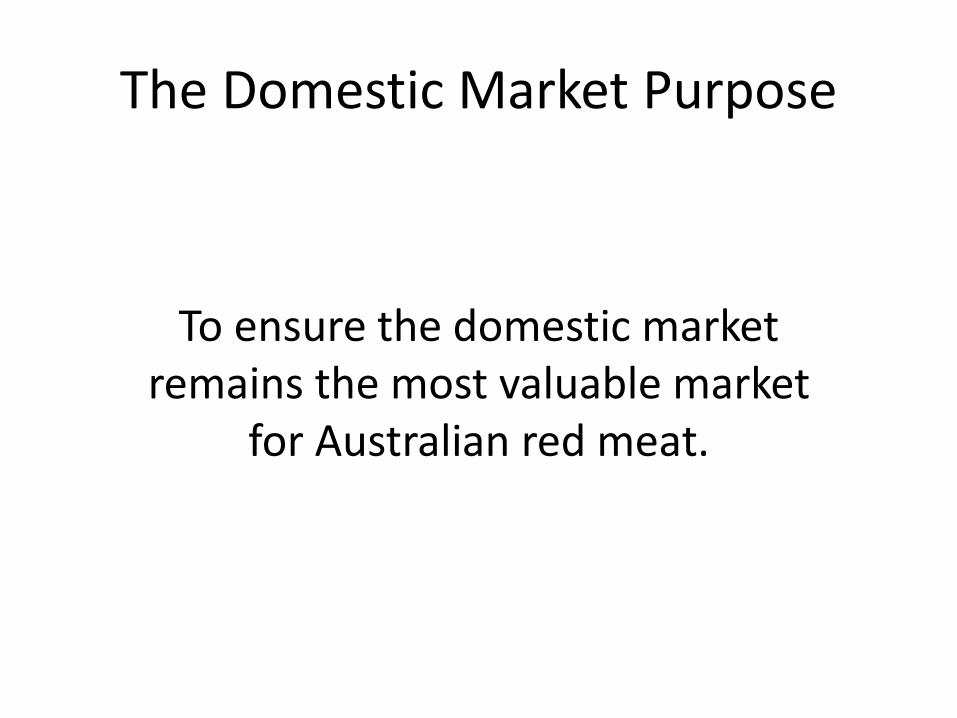
The Domestic Market Purpose
To ensure the domestic market remains the most valuable market
for Australian red meat.
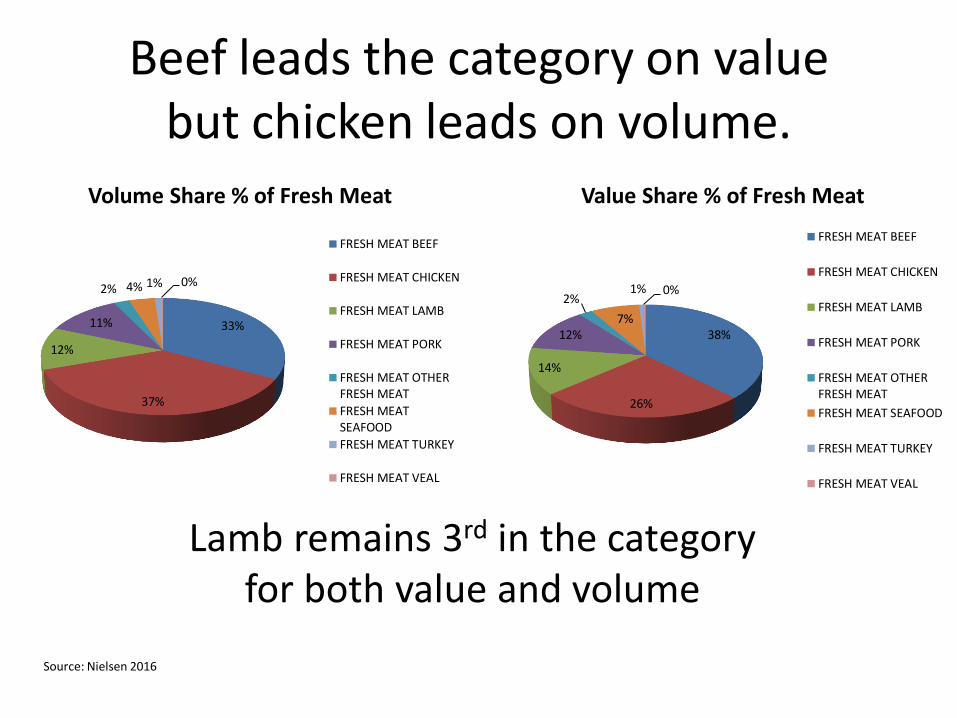
Beef leads the category on value but chicken leads on volume.
33%
37%
12%
11%
2% 4% 1% 0%
Volume Share % of Fresh Meat
FRESH MEAT BEEF
FRESH MEAT CHICKEN
FRESH MEAT LAMB
FRESH MEAT PORK
FRESH MEAT OTHERFRESH MEAT
FRESH MEATSEAFOOD
FRESH MEAT TURKEY
FRESH MEAT VEAL
Source: Nielsen 2016
38%
26%
14%
12%
2%
7%
1% 0%
Value Share % of Fresh Meat
FRESH MEAT BEEF
FRESH MEAT CHICKEN
FRESH MEAT LAMB
FRESH MEAT PORK
FRESH MEAT OTHERFRESH MEAT
FRESH MEAT SEAFOOD
FRESH MEAT TURKEY
FRESH MEAT VEAL
Lamb remains 3rd in the category for both value and volume

Beef commands a significant price premium within the category
0,0
500,0
1000,0
1500,0
2000,0
2500,0
mar
-00
sep
-00
mar
-01
sep
-01
mar
-02
sep
-02
mar
-03
sep
-03
mar
-04
sep
-04
mar
-05
sep
-05
mar
-06
sep
-06
mar
-07
sep
-07
mar
-08
sep
-08
mar
-09
sep
-09
mar
-10
sep
-10
mar
-11
sep
-11
mar
-12
sep
-12
mar
-13
sep
-13
mar
-14
sep
-14
mar
-15
sep
-15
mar
-16
Australian Retail Meat Prices by Meat Type (c/kg)
Beef Lamb Pork Chicken
Source: ABARES 2016, calculated using ABS data
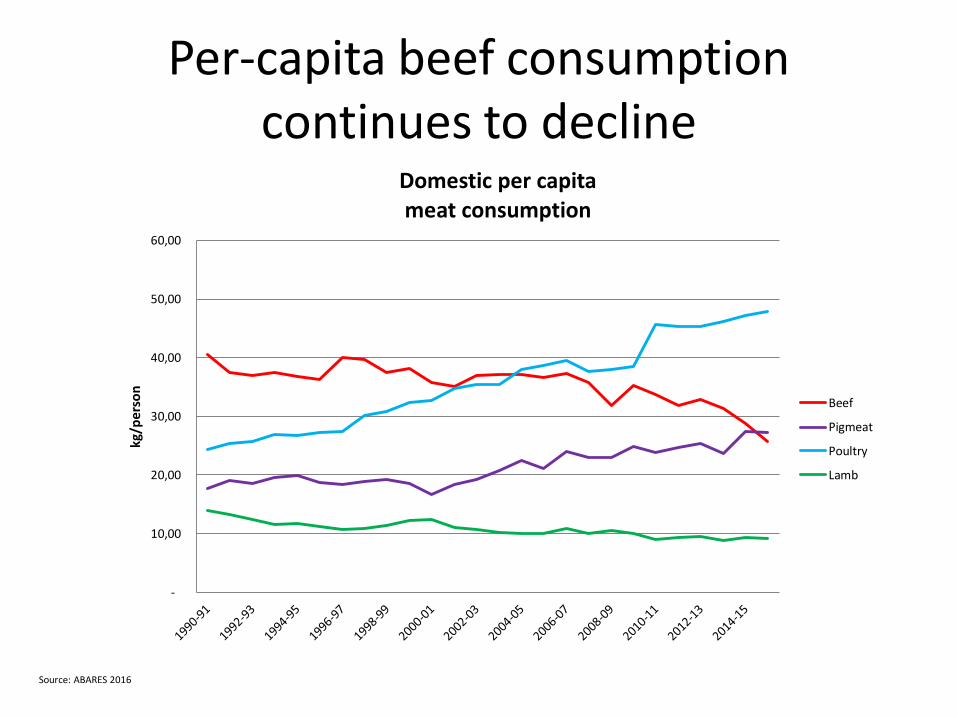
Per-capita beef consumption continues to decline
-
10,00
20,00
30,00
40,00
50,00
60,00
kg/p
erso
n
Domestic per capita meat consumption
Beef
Pigmeat
Poultry
Lamb
Source: ABARES 2016
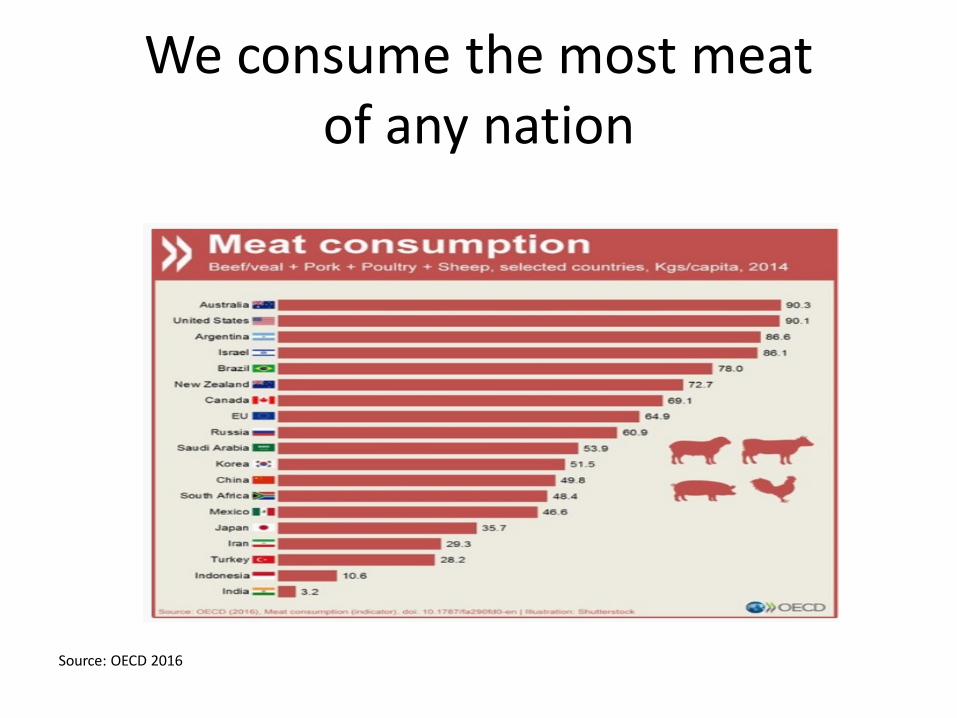
We consume the most meat of any nation
Source: OECD 2016
0
10
20
30
40
50
60
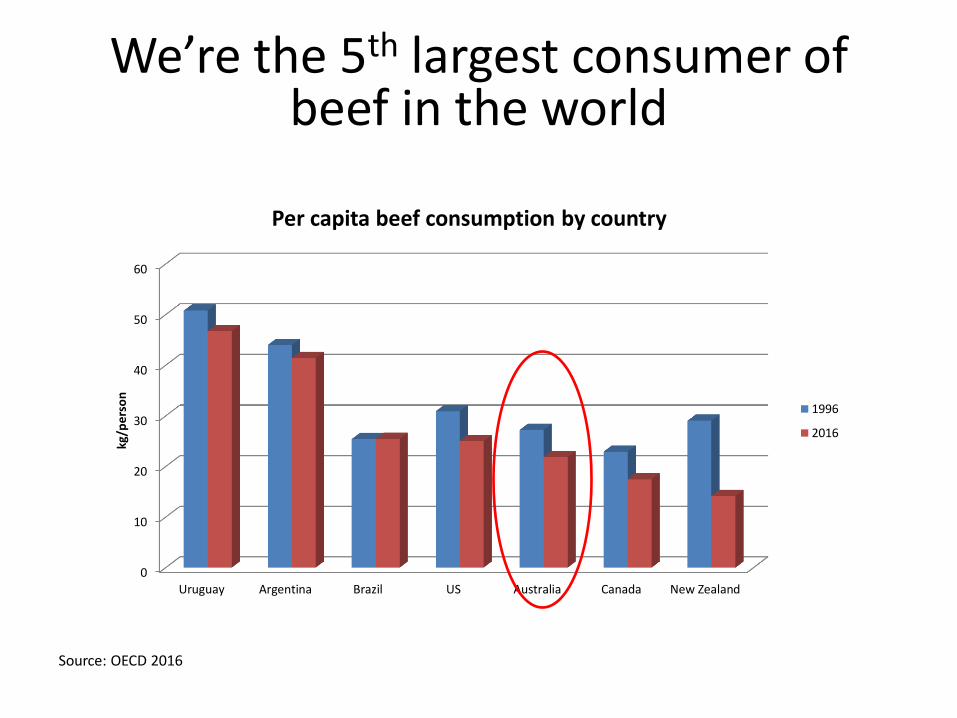
Uruguay Argentina Brazil US Australia Canada New Zealand
kg/p
erso
n
Per capita beef consumption by country
1996
2016
Source: OECD 2016
We’re the 5th largest consumer of beef in the world
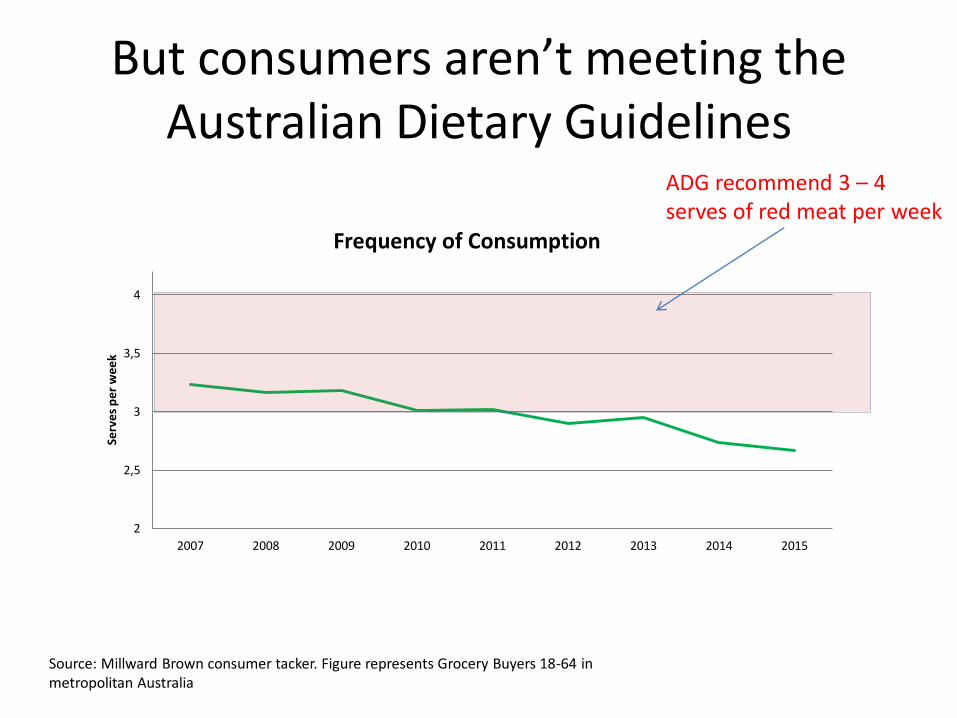
But consumers aren’t meeting the Australian Dietary Guidelines
2
2,5
3
3,5
4
2007 2008 2009 2010 2011 2012 2013 2014 2015
Serv
es
pe
r w
ee
k
Frequency of Consumption
Source: Millward Brown consumer tacker. Figure represents Grocery Buyers 18-64 in metropolitan Australia
ADG recommend 3 – 4 serves of red meat per week
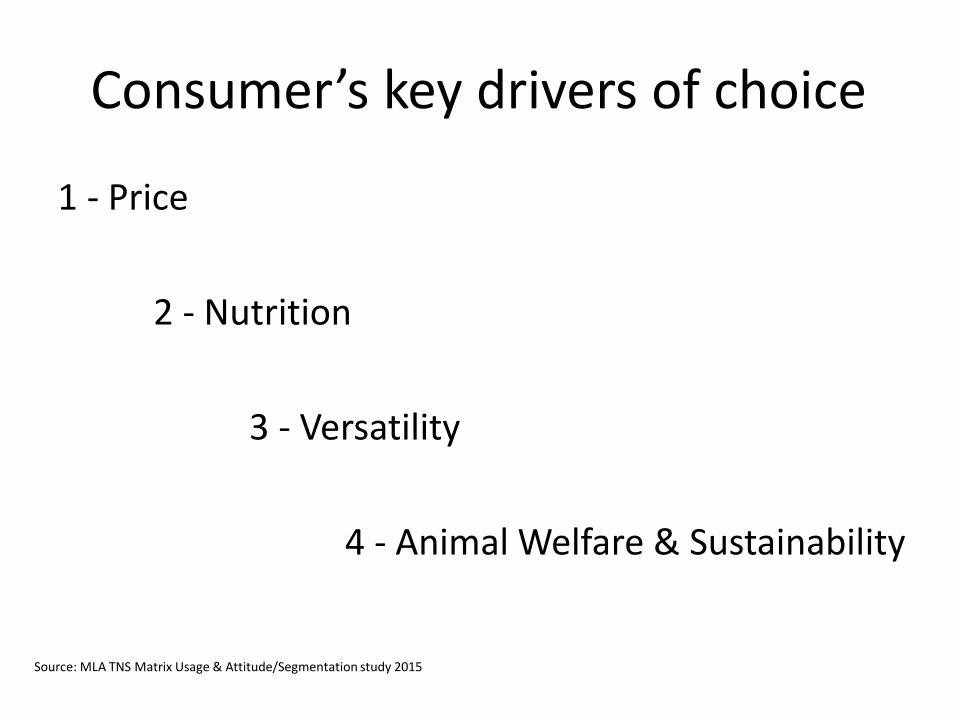
Consumer’s key drivers of choice
1 - Price
2 - Nutrition
3 - Versatility
4 - Animal Welfare & Sustainability
Source: MLA TNS Matrix Usage & Attitude/Segmentation study 2015

Reduce barriers to consumption by giving consumers permission to eat more beef
‘You’re Better on Beef’
Our brand strategy


1x ONLINE FILM 3 x 30’ TVCs
4 x 15’ RADIO SPOTS
DIGITAL / PRE-ROLL
SOCIAL / INFLUENCER
OUTDOOR POINT OF SALE
Home Shop
Emotional “Beef gives me the energy
to overcome everyday challenges”
Functional “Beef is the best source of
absorbable iron”
Beef nutrients
Beef vs. Chicken
Beef vs. Pork
Beef vs. Spinach
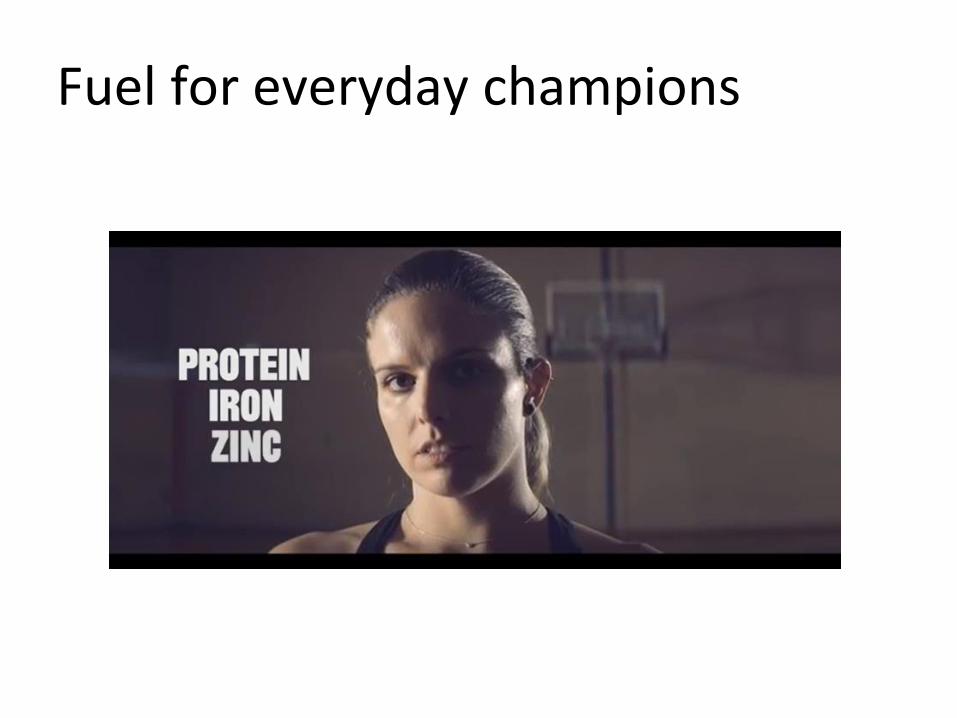
Fuel for everyday champions
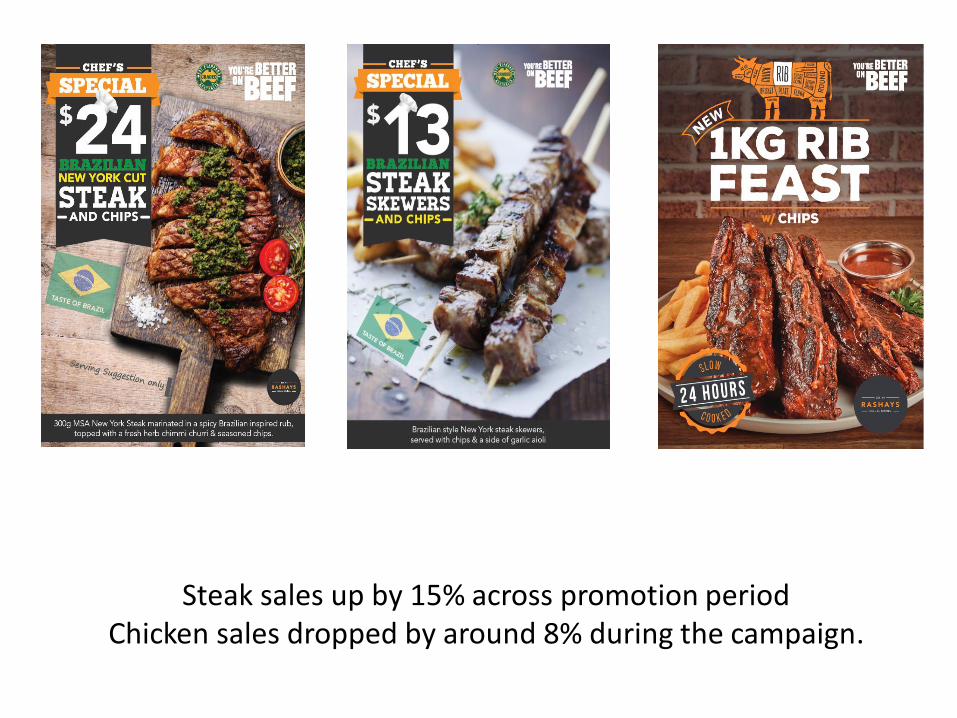
Steak sales up by 15% across promotion period Chicken sales dropped by around 8% during the campaign.
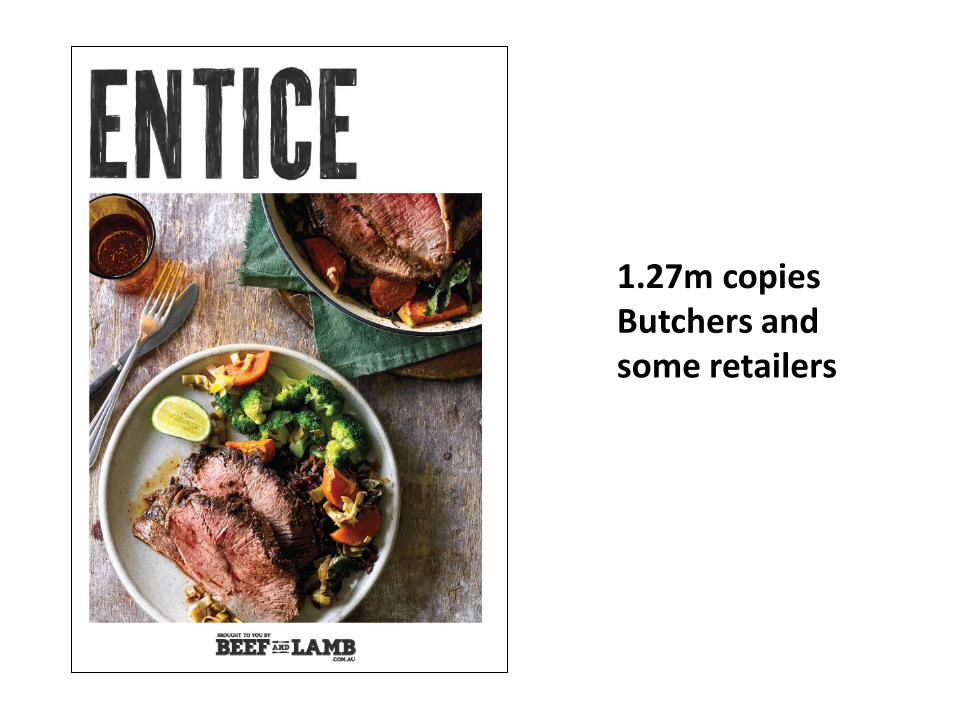
1.27m copies Butchers and some retailers

QUESTIONS?