Embed Size (px)
Citation preview

“Estero Morales, Maipo River Basin, Región Metropolitana, Chile.”
07 / 06 / 2016YOHANN VIDELA GIERNG
CRHMCold Regions Hydrological Model
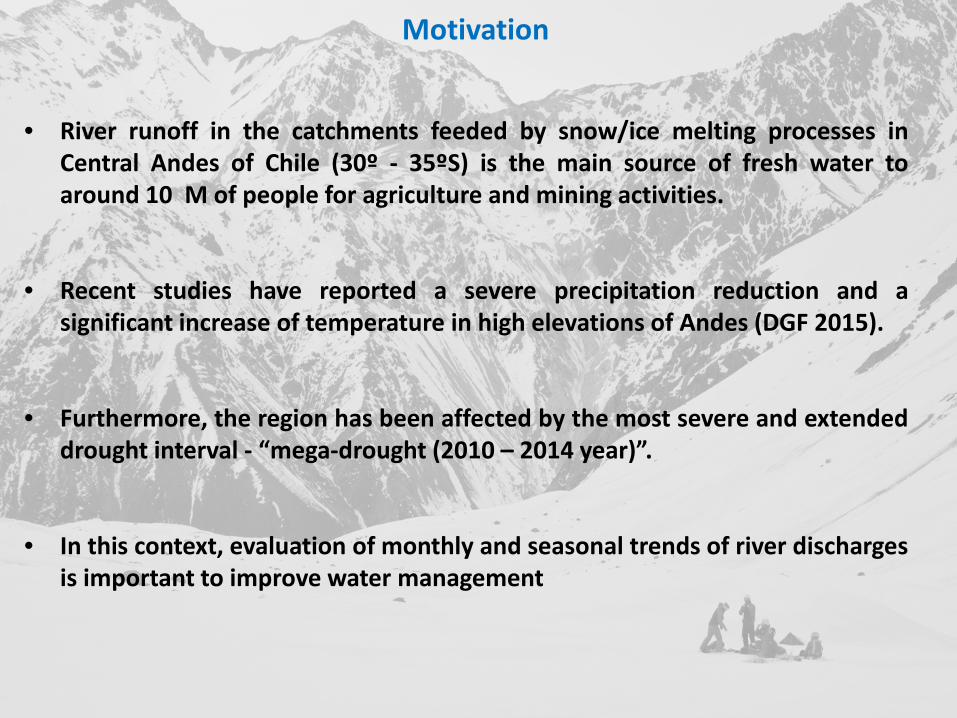
Motivation
• River runoff in the catchments feeded by snow/ice melting processes inCentral Andes of Chile (30º - 35ºS) is the main source of fresh water toaround 10 M of people for agriculture and mining activities.
• Recent studies have reported a severe precipitation reduction and asignificant increase of temperature in high elevations of Andes (DGF 2015).
• Furthermore, the region has been affected by the most severe and extendeddrought interval - “mega-drought (2010 – 2014 year)”.
• In this context, evaluation of monthly and seasonal trends of river dischargesis important to improve water management

- 93 km from Santiago- Area 37.7 km^2- Average height 2930 masl- Dominated by the mountainclimate.
Study area

Study area
San francisco Glacier
1.7 Km^2


Based on the distribution of meteorological stations in thestudy area, is applied themethodology
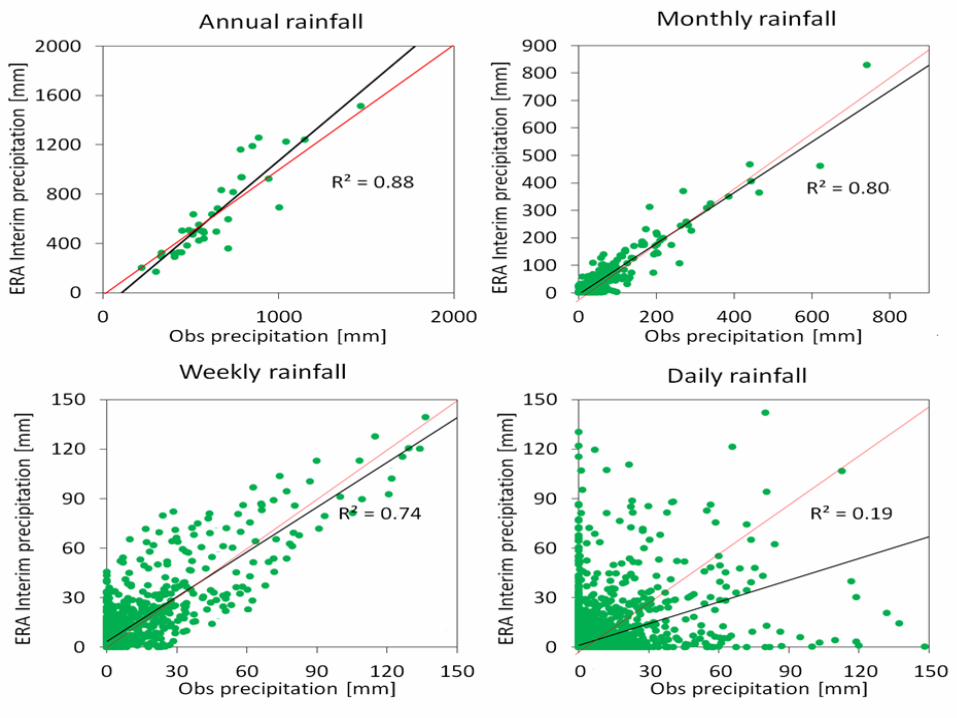
Statistical downscaling of ERA-I Precipitation in Complex Terrainusing LASSO Algorithm Gao, Schulz, and Bernhardt (2014) http://www.hindawi.com/journals/amete/2014/472741/
Downscale (ppt and temp.)

Down-scale (ppt)
0.25º x 0.25º
Statistical Downscaling of ERA-Interim Forecast Precipitation Data in Complex Terrain usingLASSO Algorithm Gao, Schulz, and Bernhardt2014
0.125º x 0.125º
0.0625º x 0.0625º
Morales Basin
ERA-I
First downscale
Second downscale

Down-scale “LASSO” (ppt)

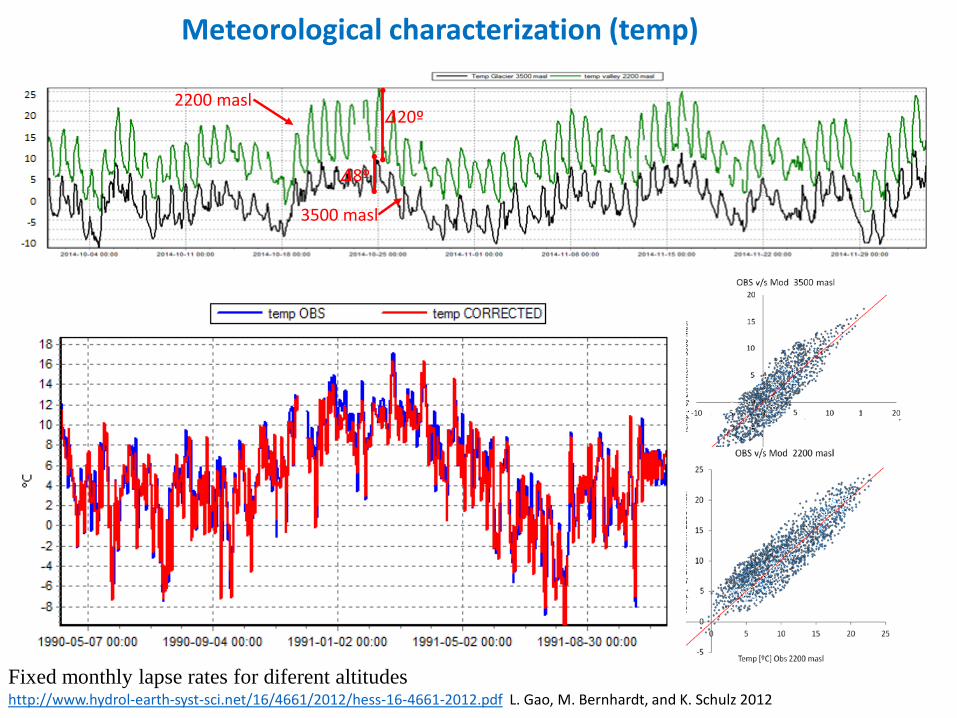
Meteorological characterization (temp)
http://www.hydrol-earth-syst-sci.net/16/4661/2012/hess-16-4661-2012.pdfL. Gao, M. Bernhardt, and K. Schulz 2012
Fixed monthly lapse rates for diferent altitudes
2000 masl
3000 masl
4000 masl

Meteorological characterization (temp)
2200 masl
3500 masl
3500 masl
2200 masl
http://www.hydrol-earth-syst-sci.net/16/4661/2012/hess-16-4661-2012.pdf L. Gao, M. Bernhardt, and K. Schulz 2012Fixed monthly lapse rates for diferent altitudes
𝜟𝜟20º
𝜟𝜟8º
Meteorological characterization (temp)
2200 masl
3500 masl
3500 masl
2200 masl
http://www.hydrol-earth-syst-sci.net/16/4661/2012/hess-16-4661-2012.pdf L. Gao, M. Bernhardt, and K. Schulz 2012Fixed monthly lapse rates for diferent altitudes
𝜟𝜟20º
𝜟𝜟8º

Wind speed[m/s]
Jua Feb Mar Apr
May Jun Jul Aug
Sep Oct Nov Dec
Meteorological characterization(Wind speed and direction)

HRU’s and Geomorpholicalcharacterization (landcover)
Short grass
Wetland
Bare
Glacier Rock
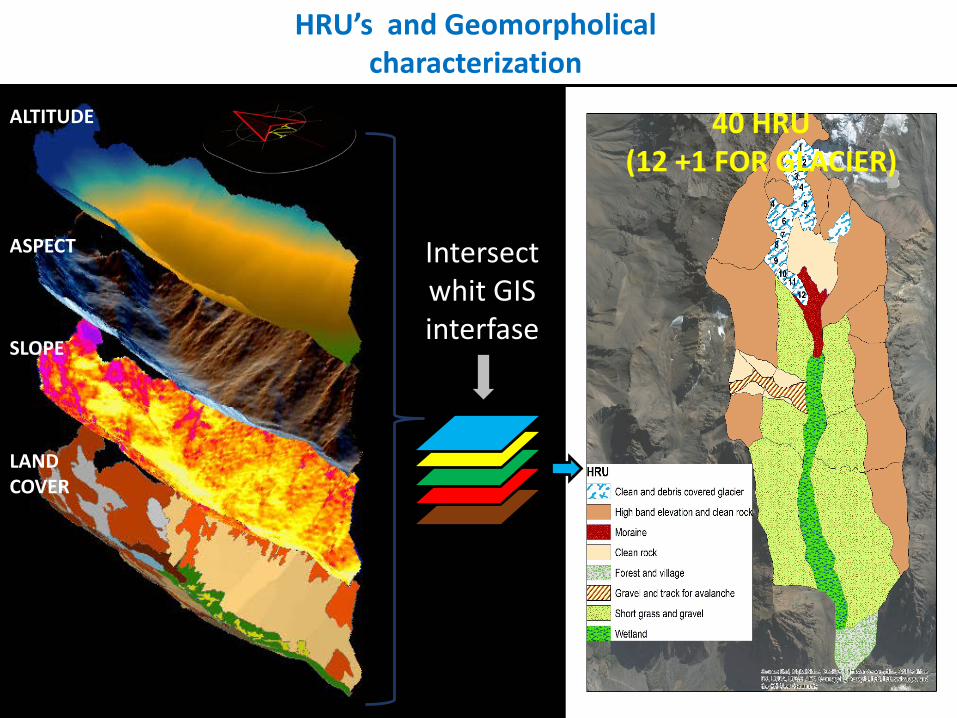
Intersectwhit GIS interfase
HRU’s and Geomorpholicalcharacterization
ALTITUDE
ASPECT
SLOPE
LAND COVER
40 HRU(12 +1 FOR GLACIER)

HRUs20 y 21 > 2927 y 28 > 2924 y 25 > 2930 y 31 > 3432 y 33 > 34Avalanche
redistribution
HRUs 1-12 Glacier retreat
and massbalance
HRUs 23, 29, 34, 38, 39, 40
domain of infiltration
HRUs26 and 2030 and 3233 and 3137 and 36
Comparable with altitudeand aspect
HRUs29 y 34
Comparable with snow
pick and AWS nodes
Gauge pointdownflow of
moraine
Gauge point“Aguas
Panimávida”
Gauge point“Puente Conaf”
Characterization according to hydrological processes
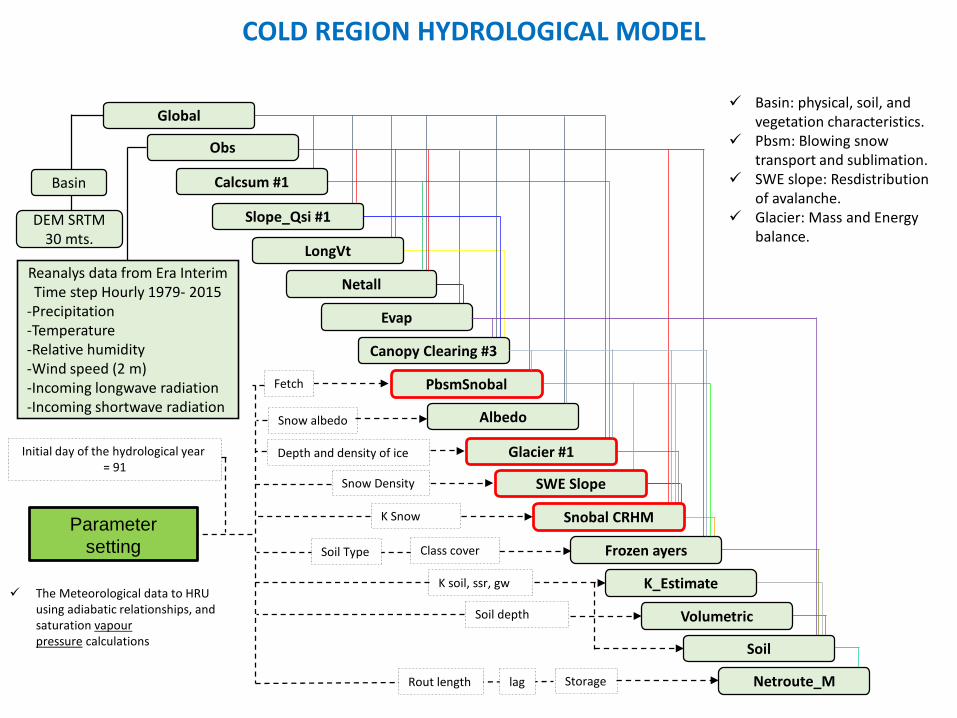
COLD REGION HYDROLOGICAL MODEL
Reanalys data from Era InterimTime step Hourly 1979- 2015
-Precipitation-Temperature-Relative humidity-Wind speed (2 m)-Incoming longwave radiation-Incoming shortwave radiation
Obs
Basin
DEM SRTM 30 mts.
Global
Calcsum #1
Slope_Qsi #1
LongVt
Netall
Evap
Canopy Clearing #3
PbsmSnobal
Albedo
Glacier #1
SWE Slope
Snobal CRHM
Frozen ayers
Netroute_M
K_Estimate
Volumetric
Soil
The Meteorological data to HRU using adiabatic relationships, and saturation vapourpressure calculations
Parametersetting
Storage
Snow albedo
Fetch
K Snow
K soil, ssr, gw
Soil depth
lagRout length
Soil Type Class cover
Initial day of the hydrological year = 91
Depth and density of ice
Snow Density
Basin: physical, soil, and vegetation characteristics.
Pbsm: Blowing snowtransport and sublimation.
SWE slope: Resdistributionof avalanche.
Glacier: Mass and Energybalance.

Snow depth (CRHM)Preliminary results
0
0.5
1
1.5
5/26
/201
5
6/5/
2015
6/15
/201
5
6/25
/201
5
7/5/
2015
7/15
/201
5
7/25
/201
5
8/4/
2015
8/14
/201
5
8/24
/201
5
9/3/
2015
SNO
W D
EPTH
[M]
Snow depth Mod v/s Obs HRU 34
Mod Obs
SR50A Snow Depth Sensor

SWE(CRHM)Preliminary results
OBS V/S MOD HRU 23

SWE(CRHM)Preliminary results

SWE(CRHM) preliminary resultsHRU 20 HRU 21 HRU 23
HRU 26 HRU 29
HRU 30 HRU 32
HRU 33 HRU 34 HRU 35
HRU 28
HRU 31

SWE(CRHM) preliminary resultsSnow Slide model

SWE Slope (CRHM) preliminary results(Snow Slide model)

Glacier Model (CRHM)
Sonwlayer
Firnlayer
Ice layer
Energy-budget glacier melt model
SNOBAL CRHM
Pradhananga (2016) oral communication
𝑸𝑸𝒎𝒎 = 𝑸𝑸𝒏𝒏 + 𝑸𝑸𝒆𝒆 + 𝑸𝑸𝐡𝐡 + 𝑸𝑸𝐩𝐩 [MJ/d]

Ice depth (San Francisco Glacier)
(DGA 2012) http://documentos.dga.cl/GLA5398.pdf
Previous experience in temperate glaciers in Patagonia and polithermal glaciers in the SwissAlps and the Antarctic Peninsula indicates that radar with low frequency is suitable fordetecting ice thickness in temperate glaciers, always taking into consideration that the
maximum thicknesses obtained are of the order of 700 [m].

Ice depth (San Francisco Glacier)

Data set of ice depth ( ice_init in crhm)
TRANSECT LENGTH DEPTH MIN DEPTH MAX DEPTH MEAN STD DEV ELEV. MIN ELEV. MAX
[name] [m] [m] [m] [m] [m][masl]
LIDAR 2012[masl]
LIDAR2012L-L' 1749 5.6 89.5 40.8 22.8 3290 3698
T1-T1' 416 10.5 43.4 25.9 8.6 3612 3698T2-T2' 843 2.2 76.9 48.2 23.8 3278 3521T3-T3' 361 21.1 82.4 60.1 16.9 3236 3312
2011
2014TRANSECT LENGTH DEPTH MIN DEPTH MAX DEPTH MEAN STD DEV ELEV. MIN ELEV. MAX
[name] [m] [m] [m] [m] [m][masl]
LIDAR 2014[masl]
LIDAR 2014L-L' 1768 3.8 85.2 37.4 28.8 3288 3696
T1-T1' 425 8.4 40.1 22.9 10.4 3611 3694T2-T2' 852 1.5 71.1 44.2 19.8 3275 3518T3-T3' 349 17.2 80.1 57.3 14.9 3233 3309
TRANSECT LENGTH DEPTH MIN DEPTH MAX DEPTH MEAN STD DEV ELEV. MIN ELEV. MAX
[name] [m] [m] [m] [m] [m][masl] [masl]
LIDAR 2014 LIDAR 2014L-L' -19 1.8 4.3 3.4 -6 2 2
T1-T1' -9 2.1 3.3 3 -1.8 1 4T2-T2' -9 0.7 5.8 4 4 3 3T3-T3' 12 3.9 2.3 2.8 2 3 3
DIFFERENCE 2012 – 2014
BGR radar-P30 at a frequency of 20 [MHz]which manage to penetrate a maximum ice thickness of 370 [m]

Initial conditions 2011 (radar ice depth)
dh/dt from Glacier model
Final conditions (2014) (radar ice depth)firn lag [h] 5firn storage [d] 1firn albedo - 0.65firn layer 1 h [mm] 0firn layer 2 h [mm] 0firn dens l 1 Kg/m^3 550firn dens l 2 Kg/m^3 680ice lag [h] 5ice storage [d] 3ice albedo - 0.35ice dens [Kg/m^3] 900ice init [mm] 45000SWE to firn [Julian day] 91
Dh mod v/s obs = 35 cms
Mass balance (CRHM) Preliminary results

Icedepth[mt]NO DATA

Mass balance (CRHM) preliminary results

Mass balance (CRHM) preliminary results

Progress Report“Estero Morales, Maipo River Basin,
Región Metropolitana, Chile.”
CRHMCold Regions Hydrological Model