Embed Size (px)
Citation preview

ctrl DSS
WT
KO
Supplementary information
Figure S1. Histological scans and scores of whole colon “swiss roles”.
(A) Representative images from the 4 experimental groups after five days are shown (Bars=2mm).
(B) Histological scores of the 4 experimental groups determined in a blinded fashion as described
in materials and methods.
A B
0
5
10
15
20
25
30
35
40
His
tolo
gic
al score
***
***

Figure S2. Goblet cell staining and quantification.
(A) Periodic acid-Schiff stainings of paraffin-embedded colon tissues. Representative images of distal
colon areas from 3 independent preparations are shown. Bar = 50 µm.
(B) Quantification of goblet cell numbers. Goblet cells were counted in random 500 µm areas of distal
colons. Four of such areas were analyzed per swiss rolls from 3 different mice in each group.
(C) Circularity of goblet cells (a score of 1 represents round cells). 50 random goblet cells of distal
colons were measured per slide in 3 independent preparations using the circularity tool of Image J.
Data are displayed as means+/-SDM. *p<0.05; **p<0.01; ***p<0.001.
B C
0
50
100
150
200
250
300
350
WT KO WT+DSS KO+DSS
Goble
t cell
num
bers
***
***
**
*
A ctrl DSS
WT
KO
0
0,2
0,4
0,6
0,8
1
WT KO WT+DSS KO+DSS
Goble
t cell
circula
rity
***

Figure S3. KI67 staining (in red; and nuclei in blue) in untreated and DSS-treated WT and
cortactin KO mice 5 days after starting the experiment. Under inflammatory conditions,
cortactin deficiency no longer causes increased proliferation. Images representative of
3 independent experiments. Bar = 50 µm.
WT KO WT+DSS KO+DSS

Figure S4. Immunohistochemical stainings for leukocytes using antibodies against CD45 and CD68.
(A, B) Representative images of CD45 (A) and CD68 (B) stainings of the 4 experimental groups (n=5)
after five days of starting the experiment are shown. Positive leukocytes appear dark brown.
Nuclei are shown in blue. Bars=50 µm.
(C,D) Quantification of CD45-positive (C) and CD68-positive (D) leukocytes in the colons of the 4
experimental groups. Leukocytes were counted in 10 random images taken of the distal colon
of 3 independent stainings. Data are displayed as mean leukocyte numbers per image+/-SDM.
*p<0.05; **p<0.01; ***p<0.001.
A
B
ctrl DSS
WT
KO
ctrl DSS
WT
KO
C D
0
5
10
15
20
25
30
35
WT KO WT+DSS KO+DSS
Num
ber
of
CD
45
+ c
ells
** ***
*
0
5
10
15
20
25
WT KO WT+DSS KO+DSS
Num
ber
of
CD
68
+ c
ells
** ***
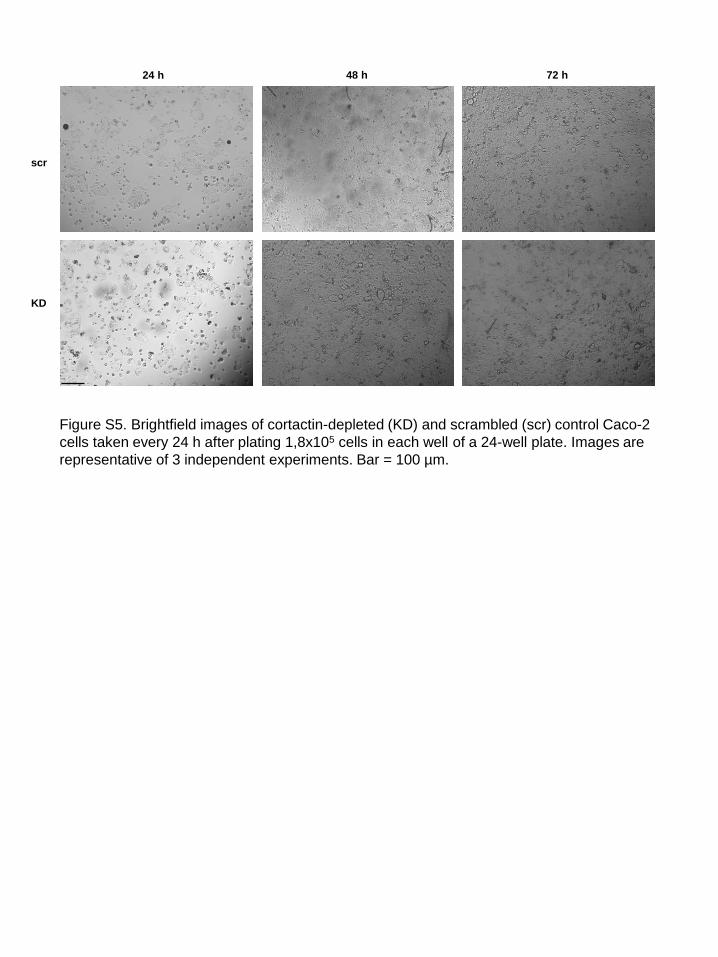
Figure S5. Brightfield images of cortactin-depleted (KD) and scrambled (scr) control Caco-2
cells taken every 24 h after plating 1,8x10⁵ cells in each well of a 24-well plate. Images are
representative of 3 independent experiments. Bar = 100 µm.
scr
KD
24 h 48 h 72 h

Figure S6. Representative images (n=3) of cortactin-depleted and scrambled (scr) control Caco-2
stained for actin (red) and ZO-1 (green). Images show a clear increase in actin fibers in the apical
regions of cortactin-depleted cells. Actin and ZO-1 colocalization appears yellow. Bar = 20 µm.
actin ZO-1 merge actin ZO-1 merge
shRNA scr shRNA cortactin
total view
apical
basal
center

Figure S7. Representative images (n=3) of cortactin KO and WT colon tissue cross-sections stained for
actin (red) and ZO-1 (green). Images show a clear increase in actin fibers and internalization of ZO-1.
Bar = 50 µm.
WT
KO
actin ZO-1 nuclei merge