Embed Size (px)
Citation preview

July 2017

Forward Looking Statements & Non-GAAP Measures
Forward-Looking Statements
This presentation contains, and oral statements made from time to time by our representatives may contain, “forward-
looking statements”. Forward-looking statements include statements under “Outlook” and other statements identified by
words such as “could,” “may,” “might,” “will,” “likely,” “anticipates,” “intends,” “plans,” “seeks,” “believes,” “estimates,”
“expects,” “continues,” “projects” and similar references to future periods, or by the inclusion of forecasts or projections.
Forward-looking statements are based on our current expectations and assumptions regarding capital market conditions,
our business, the economy and other future conditions. Because forward-looking statements relate to the future, by their
nature, they are subject to inherent uncertainties, risks and changes in circumstances that are difficult to predict. As a
result, our actual results may differ materially from those contemplated by the forward-looking statements. Important
factors that could cause actual results to differ materially from those in the forward-looking statements include regional,
national or global political, economic, business, competitive, market and regulatory conditions, including risk regarding,
our ability to manage inventory or anticipate consumer demand; changes in consumer confidence and spending; our
competitive environment; our failure to open new profitable stores or successfully enter new markets and other factors set
forth under “Risk Factors” in the Form 10-K, as amended, filed with the U.S. Securities and Exchange Commission on April
28, 2017. Any forward-looking statement made in this presentation speaks only as of the date on which it is made. J.Jill
undertakes no obligation to publicly update or revise any forward-looking statement, whether as a result of new
information, future developments or otherwise.
Non-GAAP Measures
This presentation includes certain non-GAAP financial measures, including Adjusted EBITDA and Adjusted EBITDA Margin.
Non-GAAP financial measures such as Adjusted EBITDA and Adjusted EBITDA Margin should be considered only as
supplemental to, and not as superior to, financial measures prepared in accordance with GAAP. Other companies may use
similarly titled non‐GAAP financial measures that are calculated differently from the way we calculate such measures.
Accordingly, our non‐GAAP financial measures may not be comparable to similar measures used by other companies. We
caution investors not to place undue reliance on such non‐GAAP measures, but instead to consider them with the most
directly comparable GAAP measure. Non‐GAAP financial measures have limitations as analytical tools, and should not be
considered in isolation, or as a substitute for our results as reported under GAAP. A reconciliation of non‐GAAP measures to
the most directly comparable financial measure prepared in accordance with GAAP is included as an appendix to this
presentation.
1

43%
57%
(1) Represents the fiscal year ended January 28, 2017
(2) Represents net sales from our full-price stores, open for more than 52 weeks, and our direct channel
(3) Please refer to the reconciliation in the appendix
Net Sales $639M
Comparable Sales 11.2%
# Stores 275
Adjusted EBITDA $106M
% Margin 16.6%
Profitable Omni-Channel Model
FY2016 Financials
Direct
Retail
• Proven, Profitable Omni-Channel Model That
Positions Us for Share Gains and Margin
Increases
• Data-Centric Approach That Guides Our Success
• Strong Relationship With Our Affluent, Highly
Loyal Customers
• Distinct, Well-Recognized Brand That Resonates
With Our Customers
• Aligned, Customer-Focused Product Strategy
Driving Superior Margins
• Clear, Sustainable Growth Strategies
• Team, Culture and Investments to Deliver
Consistent, Profitable Growth
Who we are
(Net Sales by Channel (1))
(2)
(3)
2
(1)

$297 $338
$363
$158
$192
$245 $28
$31
$31
$483
$562
$639
33%
34%
38%
2014 2015 2016E
E-commerce Sales E-comm Sales % of Total
645
275
Peer MedianJ.Jill
17%43%
Peer MedianJ.Jill
(Direct Sales % of Total Revenue)
Source: Company filings, publicly available information and Euromonitor
(1) Based on last fiscal year for peers. Peers include ASNA, CHS, EXPR, FRAN, GPS, J Crew, KATE, LB, LULU, Talbots and URBN. Median calculation
excludes J.Jill
Our Proven Omni-Channel Model Positions Us for Share Gains and Margin Increases
We Are Well
Positioned to Take Share
J.Jill E-commerce Channel Has Grown
at a 25% CAGR Since 2014
($ in millions)
And Underpenetrated in Retail
(1)
(1)Retail Sales Catalog Sales
Strong Penetration in Direct
(Retail Doors)
50%
375
Potential
3

Our Channels Complement and Drive Traffic to One Another
Catalog
Direct
43% of Net Sales (1)
■ Offers full range of styles, colors and sizes
■ A full representation of our brand and features:
― Updates on new collections
― Guidance on how to wear and match
products
― Ability to chat live with a customer
representative
■ E-commerce serves as an efficient inventory
clearance vehicle
Retail
57% of Net Sales (1)
■ 275 stores nationwide, 52% located within
lifestyle centers and 48% within premium malls (1)
■ Merchandise showcases newest collection,
reflecting our brand concept and promoting full-
price selling
■ 64% of new customers make their first purchase
through our retail store
■ In-store concierge service to order and ship any
item
One of our primary marketing vehicles to drive customer acquisition and engagement across channels
Produce 25 annual editions
(1) Represents the fiscal year ended January 28, 2017 4

48%52%
Our Retail Store Base Is Profitable and Well-Positioned for Growth
PremiumMallsLifestyle
Centers
Growing Presence in Lifestyle Centers Store Design Elevates Shopping Experience
■ Introduced a store design that brings the J.Jill brand
concept to life
― Showcases our brand concept and elevates, yet
simplifies, the J.Jill shopping experience
― Provides a welcoming, easy-to-shop format that
guides her through clearly merchandised product
stories
We are in the best centers in America where traffic remains healthy
5
(1)
(1) Represents the fiscal year ended January 28, 2017

Industry Leading DatabaseCustomer Acquisition and Retention
■ Utilize data insights to strategically expand marketing
investment and to acquire and retain customers
Product and Merchandising
■ Leverage customer feedback to develop products and
identify new category opportunities
Omni-Channel Portfolio
■ Combine market demographics with customer purchase
behavior to frame our store portfolio
■ Leverage both quantitative and qualitative data
sources to deliver a best-in-class omni experience
■ Personal Identifiers
■ Demographic Overlay
■ Contact History
■ Transaction History
■ Channel History
1.7MM active customers and
can match ~97% of
transactions to an identifiable
customer
Our Data-Centric Approach Guides Our Success
What We Capture/ Track
Marketing Investment and Mix of Medium
■ On-going optimization of spend (e.g. catalog, digital
marketing) toward more effective and targeted
communications
Data Guides Our Success
6

Population Breakdown by Age (2015)
10%
20%
26%
33%35%
37%35% 34%
27%25%
17%
9%
15-24 25-29 30-34 35-39 40-44 45-49 50-54 55-59 60-64 65-69 70-74 75+
Target Customer
Source: U.S. Census Bureau
% of U.S. Households Earning More than $100K / year by Age
We Target an Attractive, Highly Loyal Customer
We Target the Largest Segment
of the Female Population
She Has Tremendous Spending Power
18%
13%
20%
34%
15%
Children
(0-14 years)
Youth
(15-24 years)
Adults
(25-39 years)
JJ Customers
(40-65 years)
Seniors
(66 years+)
Target Customer■ We can match 97% of our transactions
to an identifiable customer
■ Extensive customer database allows us
to build and maintain relationships with
her to drive optimum value
■ Our customer is college educated,
works outside the home and has an
average household income > $150,000
We Know Our Customer…
…And She Is Extremely Loyal
7 Years
Average Customer Tenure
7

1. Grow Size and Value of Our
Active Customer Base
2. Increase Direct Sales
3. Strengthen Omni-Channel
Capabilities
4. Profitably Expand Our Store Base
5. Enhance Product Assortment
We Are Just Getting Started
Clear, Sustainable Growth Strategies Significant Whitespace Opportunity
SportswearFemales/Age 40+
$42.0B
$0.6B
79.0M
1.7M
NPD Market Size Customers
Market Opportunity
Source: NPD, US Census data, publicly reported sales
We Have Less Than 2% of Market Share
8

Active Customer Base Growth
■ Drive growth of our customer base by using data
to efficiently increase marketing Investment
■ Compelling customer acquisition economics for
sustained long-term growth
■ Optimize investment to drive customer retention
and lifetime value
Siz
e
■ Migrate single channel customers to omni-
channel customers
― Omni-channel customers spend 3x as much
and 3x as frequently per year
■ J.Jill credit card penetration of 53% of sales drives
loyalty and spend per customer
■ Leverage our data analytics as well as our brand
voice and customer segmentation initiative
― Identify highest value customer
segmentation and focus targeted
marketing to drive value
Key Drivers
Va
lue
Annual Spend per Customer (1)
CAGR +3%
CAGR +11%
Grow Size and Value of Customer Base
(in 000’s)
(1) Calculated as net sales divided by total customers9
1,387
1,549
1,723
2014 2015 2016
$348
$363
$371
2014 2015 2016

~$300
>$800
Single Channel Omni-Channel
Orders 1X 3X
Annual Spend by Customer TypeCustomer Growth’14 -’16
CAGR
Omni+19%
Single
10%
We Are Increasing Our Omni-Channel
Customers Faster…
…Driving Meaningful Sales Uplift
% Omni
Total11%
(in 000’s)
10
Grow Size and Value of Customer Base (Cont.)
1,124
1,349
263
374 1,387
1,723
2014
19%
2016
22%

4%
15%
Global Apparel Sales Global Apparel
E-commerce Sales
…And the Sector is Expected to
Continue Growing Rapidly
(’15 – ’20 CAGR)Expected Global Apparel Sales Growth
15%
25%
Global Apparel
E-commerce Sales
J.Jill
Our Growth Has Outpaced the
Apparel E-commerce Sector…
Increase Direct Sales
Source: Euromonitor
(’14 – ’16 CAGR)
Global E-commerce Apparel Sales Growth
11
We are well positioned to capitalize on the rapidly growing
e-commerce apparel sector growth

Expand InternationallyLeverage MobileEnhance E-commerce Platform
■ Personalize for the customer
― Improve navigation
― Implement guiding service
― Streamline checkout
process
■ Optimize for all device types
■ Estimated completion Fall
2017
■ Enhance and support
omni-channel
customer experience
■ Connect with
customers on mobile
via re-platformed
website
― Social media
― In-store push
notifications
■ Leverage new web
platform to expand
internationally
■ Expand geographic
reach, similar to other
global apparel
businesses
12
Increase Direct Sales (Cont.)
Our strategic initiatives will assist in driving further sales growth
in our Direct channel

Strengthen Omni-Channel Capabilities
Create Personalized Experiences
■ Omni-channel product recommendations
■ Wardrobing features / services in store and online
■ Enhanced product selection tools and features
Enable Seamless
Product Discovery
■ Customer visibility to in-store inventory
■ Reserve online, pickup in store
■ Buy online, pickup in store
Enhance Purchase and Post-Purchase
Service Experience
■ Responsive / device “agnostic” digital design
■ Omni-channel order history and “My Account” features
■ Alternate payment methods, mobile payments
■ Clientelling for in-store customers
What We Will Do What It Will Bring
13

Profitably Expand Our Store Base
Well Positioned to Grow Store BaseDisciplined, Analytical Approach
■ Grow retail store base by up to 100 stores
― 10-15 new stores per year
― New locations in lifestyle centers and
premium malls
■ Market-based approach to targeting
centers using internal and external data
such as customer demographics and
purchasing history, center quality and
tenant mix
■ 64% of new customers make their first
purchase through our retail store
Net Store Growth
J.Jill Store Count
Attractive New Store Model (1)
Net Sales ($ '000s) $1,000
Square Feet 3,600
4-Wall Contribution ($ '000s) $270
Payback Period 2 years
Cash-on-Cash Return 50%
13 14 ~100
14(1) Reflects company target new store model
10
261 275
~375
285
2015 2016 2017(f) Potential

Enhance Product Assortment
Expand Categories
■ Selectively broaden and enhance
assortment across our sub-brands, Pure Jill
and Wearever
■ Leverage strong demand for our extended
sizes
― Expand Women’s offerings to select
stores
■ Leverage our data to fuel growth
Optimize Assortment
■ Leverage our customer database as
well as our data capture capabilities
■ Determine optimal mix of assortment by
geography and by store
■ Ensure each of our monthly offerings
delivers right mix of fashion and basics
We will continue delivering high-quality, customer-focused product assortments across
each of our channels while strengthening visual merchandising
15

We Deliver

We Drive Superior Financial Results
Net Sales Adjusted EBITDA (1)
(1) Please refer to the Adjusted EBITDA reconciliation in the appendix
(2) Represents, for any period, Adjusted EBITDA as a percentage of net sales
MarginTotal Comp.
Sales
($ in millions) ($ in millions)
17
(2)
$44
$54
$66
$82
$106
2012
10.2%
2013
11.9%
2014
13.6%
2015
14.6%
2016
16.6%

Continued Momentum in 2017
18
- Total Sales Growth of 12.5%
- Comparable Sales Growth of 9.9%
- 90 basis points Gross Margin
Expansion
- Adjusted EPS growth of 50%
(1) Reference appendix for reconciliation of GAAP to Adjusted EPS

% ConversionFree Cash Flow
(1) Free Cash Flow defined as Adjusted EBITDA less Gross Capital Expenditures
(2) Conversion defined as Free Cash Flow divided by Adjusted EBITDA
Strong Free Cash Flow Generation and Conversion
Strong Free Cash Flow Generation While Investing in Growth
Free Cash Flow and % Conversion (1)(2)
(Free Cash Flow in $ millions)
Gross Capital Expenditures
Store Capital Expenditures Technology Other
($ in millions)
19
$29 $28
$42$48
$70
2012 2013 2014 2015 2016
69% 51% 64% 57% 66%
$13
$27
$24
$35 $36
2012 2013 2014 2015 2016

($MMs) Amount Maturity Pricing
$40mm ABL Facility $0 05/08/2020 L + 150bps
$290mm Term Loan $277(1) 05/08/2022 L + 500bps
Cash $5
Net Debt $272
LTM Q3’16 Adjusted EBITDA $99
Net Debt / Adjusted EBITDA 2.8x
Adjusted Debt (2) / Adjusted EBITDAR (3) 4.5x
Balance Sheet That Provides Significant Liquidity and Financial Flexibility
(1) Does not include voluntary pre-payment on Term loan of $10.1mm on January 19, 2017
(2) Capitalized at 8x rent expense with FY2015 rent expense of $48.9mm
(3) Adjusted EBITDAR defined as Adjusted EBITDA plus rent expense 20

Positioned to Deliver 2017 Financial Goals
Total Company
Comp Sales
High Single Digits
(7% to 9%)
Adjusted EPS $0.27 to $0.29
21
*Based on 52-week year
Adjusted EPS $0.80 to $0.84
Total Company
Comp Sales
High Single Digits
(7% to 9%)
Full Year Outlook*
Q2 Outlook

Our Long-Term Financial Targets
Sales Growth High Single Digits
EBIT Growth Mid Teens
Net Income Growth ~20%
221

9Appendix

Non-GAAP Measure – Adjusted EBITDA
J.Jill, Inc. Reconciliation of GAAP Net Income to Adjusted EBITDA
(Unaudited)
(Amounts in thousands)
For the Thirteen Weeks Ended
April 29, 2017 April 30, 2016
Net income $ 8,027 $ 6,073
Interest expense 4,945 4,112
Provision for income taxes 5,603 4,249
Depreciation and amortization 8,799 10,261
Equity-based compensation expense (a) 24 75
Write-off of property and equipment (b) 2 -
Other non-recurring expenses (c) 3,585 1,108
Adjusted EBITDA $ 30,985 $ 25,878
(a): Represents expenses associated with equity incentive instruments granted to our management. Incentive instruments are accounted for as
equity-classified awards with the related compensation expense recognized based on fair value at the date of the grants.
(b): Represents net gain or loss on the disposal of fixed assets.
(c): Represents items management believes are not indicative of ongoing operating performance. These expenses are primarily composed of
legal and professional fees associated with the initial public offering completed March 9, 2017.
24

Non-GAAP Measure – Adjusted Net Income & EPS
J.Jill, Inc.Reconciliation of GAAP Net Income to Adjusted Net Income
(Unaudited)
(Amounts in thousands)
For the Thirteen Weeks Ended
April 29, 2017 April 30, 2016
Net income and total comprehensive income $ 8,027 $ 6,073
Add: Provision for income taxes 5,603 4,249
Income before provision for income taxes 13,630 10,322
Add: Other non-recurring expenses(a)
3,585 1,108
Adjusted Income before provision for income taxes 17,215 11,430
Less: Adjusted Tax Provision(b)
6,886 4,572
Adjusted net income $ 10,329 $ 6,858
Adjusted net income per common share attributable to common shareholders
Basic $ 0.24 $ 0.16
Diluted $ 0.24 $ 0.16
Weighted average number of common shares outstanding
Basic 42,518,143 43,747,944
Diluted 43,680,485 43,747,944
(a): Represents items management believes are not indicative of ongoing operating performance. These expenses are primarily
composed of legal and professional fees associated with the initial public offering completed March 9, 2017.
(b): The adjusted tax provision for adjusted net income is estimated by applying 40% to the adjusted income before provision for
income taxes.25
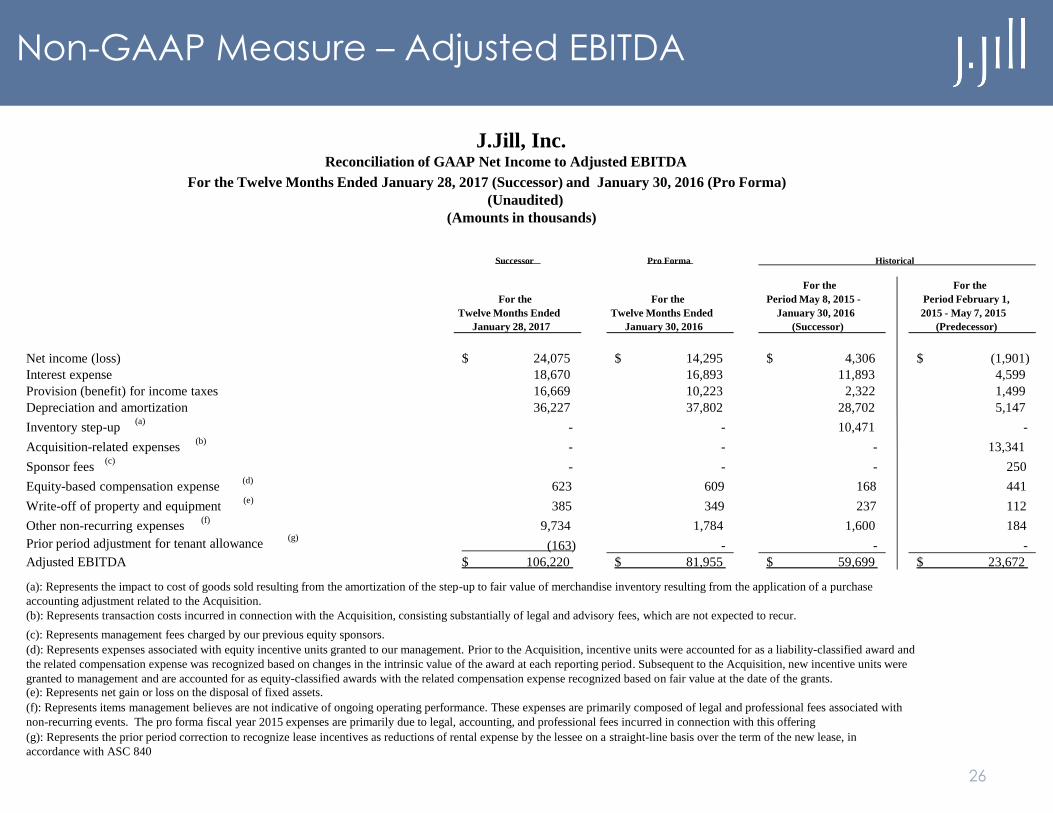
Non-GAAP Measure – Adjusted EBITDA
26
Successor Pro Forma Historical
For the
Twelve Months Ended
January 28, 2017
For the
Twelve Months Ended
January 30, 2016
For the
Period May 8, 2015 -
January 30, 2016
(Successor)
For the
Period February 1,
2015 - May 7, 2015
(Predecessor)
Net income (loss) 24,075$ 14,295$ 4,306$ (1,901)$
Interest expense 18,670 16,893 11,893 4,599
Provision (benefit) for income taxes 16,669 10,223 2,322 1,499
Depreciation and amortization 36,227 37,802 28,702 5,147
Inventory step-up (a)
- - 10,471 -
Acquisition-related expenses(b)
- - - 13,341
Sponsor fees(c)
- - - 250
Equity-based compensation expense(d)
623 609 168 441
Write-off of property and equipment(e)
385 349 237 112
Other non-recurring expenses(f)
9,734 1,784 1,600 184
Prior period adjustment for tenant allowance(g)
(163) - - -
Adjusted EBITDA 106,220$ 81,955$ 59,699$ 23,672$
J.Jill, Inc.Reconciliation of GAAP Net Income to Adjusted EBITDA
For the Twelve Months Ended January 28, 2017 (Successor) and January 30, 2016 (Pro Forma)
(Unaudited)
(Amounts in thousands)
(a): Represents the impact to cost of goods sold resulting from the amortization of the step-up to fair value of merchandise inventory resulting from the application of a purchase
accounting adjustment related to the Acquisition.
(b): Represents transaction costs incurred in connection with the Acquisition, consisting substantially of legal and advisory fees, which are not expected to recur.
(c): Represents management fees charged by our previous equity sponsors.
(d): Represents expenses associated with equity incentive units granted to our management. Prior to the Acquisition, incentive units were accounted for as a liability-classified award and
the related compensation expense was recognized based on changes in the intrinsic value of the award at each reporting period. Subsequent to the Acquisition, new incentive units were
granted to management and are accounted for as equity-classified awards with the related compensation expense recognized based on fair value at the date of the grants.
(e): Represents net gain or loss on the disposal of fixed assets.
(f): Represents items management believes are not indicative of ongoing operating performance. These expenses are primarily composed of legal and professional fees associated with
non-recurring events. The pro forma fiscal year 2015 expenses are primarily due to legal, accounting, and professional fees incurred in connection with this offering
(g): Represents the prior period correction to recognize lease incentives as reductions of rental expense by the lessee on a straight-line basis over the term of the new lease, in
accordance with ASC 840

Non-GAAP Measure – Adjusted Net Income & EPS
27
Successor Pro Forma Historical
For the
Twelve Months Ended
January 28, 2017
For the
Twelve Months Ended
January 30, 2016
For the
Period May 8, 2015 -
January 30, 2016
(Successor)
For the
Period February 1,
2015 - May 7, 2015
(Predecessor)
Net income (loss) 24,075$ 14,295$ 4,306$ (1,901)$
Adjustment: Prior period adjustment for tenant allowance(c)
(163) - - -
Adjustment: Other non-recurring expenses(b)
9,734 1,784 1,600 184
Adjustment: Tax Provision(a) (3,915) (744) (561) 686
Adjusted net income (loss) 29,731$ 15,335$ 5,345$ (1,031)$
Adjusted net income (loss) per share attributable to common stockholders
Basic 0.68$ 0.12$ (0.02)$
Diluted 0.68$ 0.12$ (0.02)$
Weighted average number of common shares outstanding
Basic 43,747,944 43,747,944 43,747,944
Diluted 43,747,944 43,747,944 43,747,944
J.Jill, Inc.Reconciliation of GAAP Net Income to Adjusted Net Income
For the Twelve Months Ended January 28, 2017 (Successor) and January 30, 2016 (Pro Forma)
(Unaudited)
(Amounts in thousands)
(a): The tax provision adjustment for adjusted net income is estimated by applying the effective tax rate for that period to the adjustment
(b): Represents items management believes are not indicative of ongoing operating performance. These expenses are primarily composed of legal and professional fees associated with
non-recurring events. The pro forma fiscal year 2015 expenses are primarily due to legal, accounting, and professional fees incurred in connection with this offering
(c): Represents the prior period correction to recognize lease incentives as reductions of rental expense by the lessee on a straight-line basis over the term of the new lease, in
accordance with ASC 840

Non-GAAP Measure – Historical Adjusted EBITDA
28
Predecessor Successor
Pro Forma
(unaudited)
For the Fiscal
Year Ended
February 2, 2013
For the Fiscal
Year Ended
February 1, 2014
For the Fiscal
Year Ended
January 31, 2015
For the Period
February 1, 2015
to May 7, 2015
For the Period
May 8, 2015 to
January 30, 2016
For the Fiscal
Year Ended
January 30, 2016(in thousands)
NET INCOME/(LOSS) $ (3,601) $ 4,498 $ 10,296 $ (1,901) $ 4,306 $ 14,295
Income tax expense/(benefit) (2,583) 3,884 10,860 1,499 2,322 10,223
Total Interest expense 19,183 19,064 17,895 4,599 11,893 16,893
Depreciation & Amortization 27,333 22,910 19,051 5,147 28,702 37,802
(a) Amortization of inventory step up - - - - 10,471 -
(b) Transaction fees, costs and expenses - - - 13,341 - -
(c) Sponsor fees 1,000 1,000 1,000 250 - -
(d) Stock-based compensation 417 1,930 5,152 441 168 609
(e) Write-off of assets 250 386 58 112 237 349
(f) Other Non-recurring costs 1,914 569 1,408 184 1,600 1,784
Adjusted EBITDA $43,913 $54,241 $65,720 $23,672 $59,699 $81,955
(a) Impact to cost of sales for inventory step-up related to the Acquisition by TowerBrook
(b) Represents transaction costs that have been incurred related to the Acquisition by TowerBrook
(c) For predecessor periods, this includes management fees paid to Arcapita and Golden Gate. For the successor period, it represents expenses reimbursed to
TowerBrook for travel related expenses.
(d) Amount relates to the expense associated with equity incentive units granted to management. Prior to the 2015 acquisition the incentive units were
accounted for as a liability based award and revalued at each reporting period to current fair value. Subsequent to the acquisition by TowerBrook, the units are
accounted for as equity based awards, and are expensed using fair value at the date of the grants.
(e) Represents gain or loss on the disposal of assets
(f) Represents items which management believes are not indicative of our ongoing operating performance. These expenses are primarily composed of outside legal and professional
fees associated with non-recurring events. The 2012 and 2014 costs are primarily associated with legal fees in connection with entering into a forbearance agreement with our lends
for the term loan and revolving credit facility. The 2014 expenses were primarily driven by outside legal and professional services associated with the sale of the company that
occurred in 2015. The 2015 expenses are primarily due to legal, accounting, and professional fees incurred in connection with the Initial Public Offering.