Embed Size (px)
DESCRIPTION
PResentation
Citation preview

A COMPREHENSIVE PROJECT ON“A STUDY OF FACTORS AFFECTING 3G
TECHNOLOGY ADOPTATION”Submitted By:
Ronak Parikh(67)
Project Guide: Project Coordinator :Prof.Parnika Jha Prof.Sandhya Harkavat
Submitted to
S. K. PATEL INSTITUTE OF MANAGEMENT & COMPUTER STUDIES
Gandhinagar, IndiaApr-May 2013

3 G-INTRODUCTIONS
• As we can say 3G stands for “Third Generation”. It is technology for advanced communication. It gives high clarity, real time streaming & high speed internet access anywhere. 3G is next step in wireless communication and have improvement over current 2G technology. Speed, accuracy & security are the key objects behind this technology.
• Approximately 20% of the world population has access to the Internet. India currently has ~550 million telecom subscribers. According to Business Monitor International, India is currently adding 8-10 million mobile subscribers every month.

3G SERVICES
• Video Calls• High Speed Internet • Video On Demand• On line Gaming

TECHNOLOGY ACCEPTANCE MODEL (TAM)
• External variables• Perceived usefulness• Perceived ease of use• Behavioural intention• Actual system use

Research Methodology
• RESEARCH DESIGNDescriptive research designs were used.SOURCES OF DATAPrimary data is collected through Survey.Industry publications, Business Articles, Internet
Surfing, Published Journals

• DATA COLLECTION INSTRUMENTS Questionnaire • POPULATION Ahmedabad • SAMPLING UNIT • Post graduate students at collages.• Visitor at customer care stores such as Vodafone store, Idea care, Airtel
store etc. • SAMPLE SIZE• 198• SAMPLING METHOD CONVINIENCE SAMPLING RANDOM SAMPLING

1.Gender : Male/Female GENDER OF RESPONDENT
Frequency Percent Valid PercentCumulative
Percent
Valid MALE 119 60.1 60.1 60.1
FEMALE 79 39.9 39.9 100.0
Total 198 100.0 100.0
TABLE.2
INTERPRETATIONWe have Surveyed 198 Persons. From the table and graphical presentation we can know that 60.1O% of respondents is male and remaining is female.
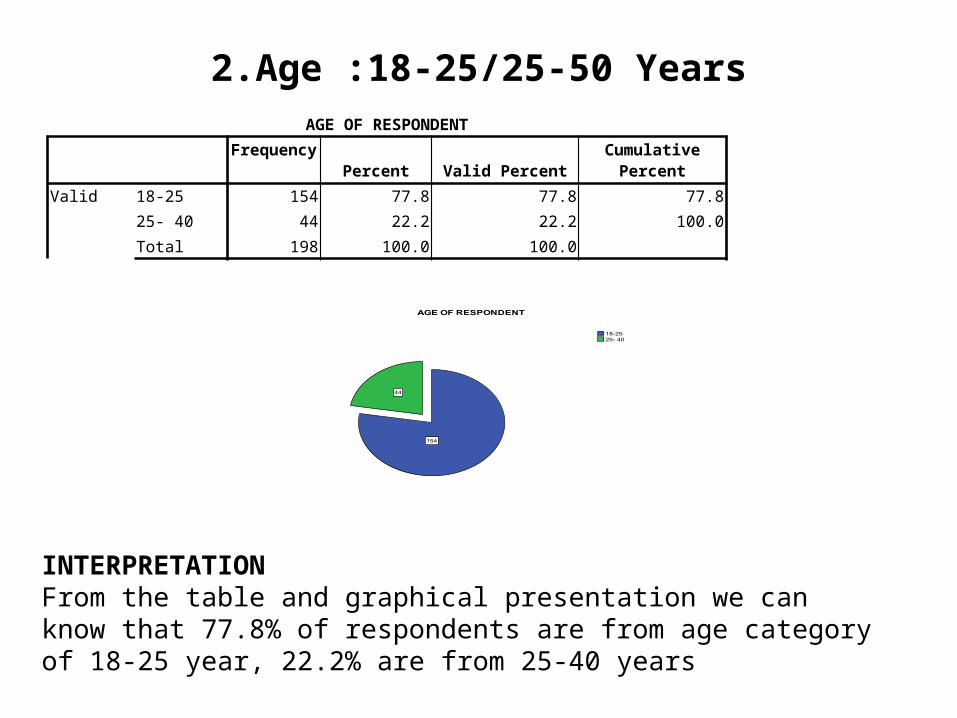
2.Age :18-25/25-50 YearsAGE OF RESPONDENT
Frequency Percent Valid PercentCumulative
Percent
Valid 18-25 154 77.8 77.8 77.8
25- 40 44 22.2 22.2 100.0
Total 198 100.0 100.0
INTERPRETATIONFrom the table and graphical presentation we can know that 77.8% of respondents are from age category of 18-25 year, 22.2% are from 25-40 years

3.Mobile Handsets are Using CurrentlyI-Phone, Samsung, Nokia, Blackberry,
HTC, Mircromax Other
MEAN
N Valid 198
Missing 0
Mean 3.12
Percentiles 25 2.00
50 2.50
75 3.00
RESPONDENT'S HANDSET
Frequency Percent Valid Percent
Cumulative Percent
Valid I-PHONE 10 5.1 5.1 5.1
SAMSUNG
89 44.9 44.9 50.0
NOKIA 57 28.8 28.8 78.8
BLACKBARRY
4 2.0 2.0 80.8
HTC 8 4.0 4.0 84.8
MICROMAX
7 3.5 3.5 88.4
OTHER 23 11.6 11.6 100.0
Total 198 100.0 100.0

INTERPRETATIONOur study includes all mobile handsets companies so full fledge result can be received. In our study 44.9% respondents are using Samsung handset, 28.8% respondents are using Nokia handsets and rest of 26.3% respondents are using I-Phone, Blackberry, HTC, Micromax, Sony, Reliance Handsets.

SERVICE PROVIDER OF RESPONDENTS
Frequency Percent Valid Percent Cumulative Percent
Valid VODAFONE 64 32.3 32.3 32.3
AIRTEL 36 18.2 18.2 50.5
IDEA 14 7.1 7.1 57.6
DOCOMO 25 12.6 12.6 70.2
OTHER 59 29.8 29.8 100.0
Total 198 100.0 100.0
4.Your Currently Service Provider
• Vodafone• Airtel• Idea• Docomo• Others

INTERPRETATIONFrom the above table and graphical presentation we can know that 32.32% of respondents are Vodafone Users,18.18% of Respondents are Airtel Users,12.63% of respondents are DOCOMO Users,7.07% of Respondents are IDEA and rest 29.80% of Respondents having other Service Providers which includes Reliance, BSNL, Uninor ,Aircel, MTS etc

RESPONDENT CONNECTION TYPE
Frequency Percent Valid Percent
Cumulativ
e Percen
t
Valid PRIPAID 153 77.3 77.3 77.3
POSTPAID 45 22.7 22.7 100.0
Total 198 100.0 100.0
5.Type of Connection : Prepaid/Postpaid
INTERPRETATIONFrom the table and graphical presentation we can know that 77.27% respondents are Prepaid Users and 22.73% respondents are Postpaid Users.

6.Monthly Expenditure on Mobile<200 700-1000200-400 >1000400-700
MONTHLY EXPNDITURE OF RESPONDENT
Frequency Percent Valid Percent
Cumulative Percent
Valid <200 41 20.7 20.7 20.7
200-400 74 37.4 37.4 58.1
400-700 51 25.8 25.8 83.8
700-1000 19 9.6 9.6 93.4
>1000 13 6.6 6.6 100.0
Total 198 100.0 100.0
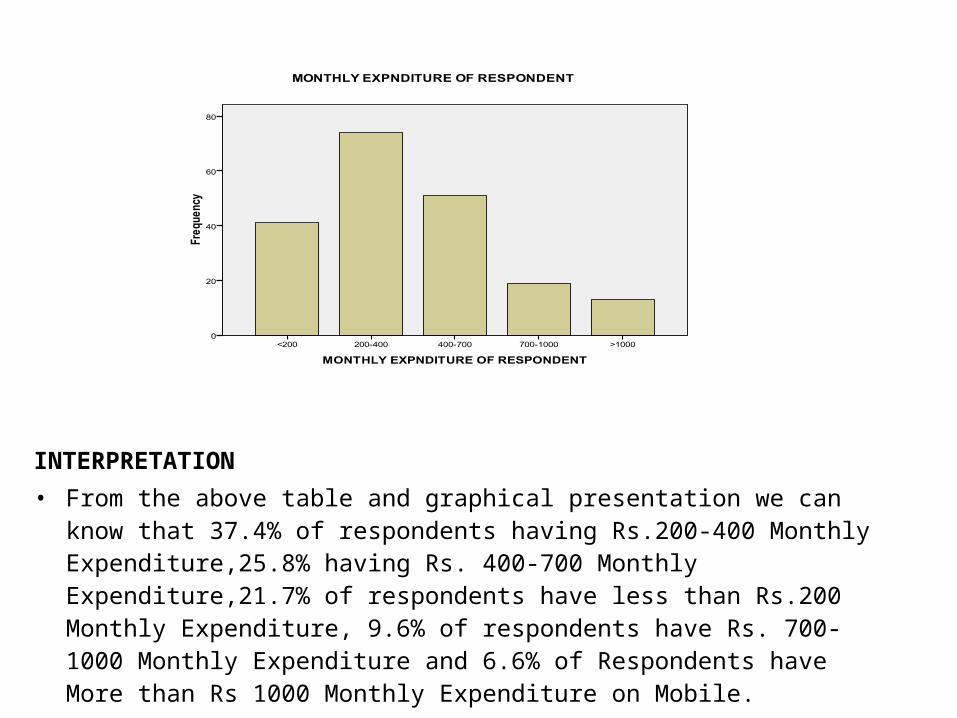
INTERPRETATION• From the above table and graphical presentation we can know that 37.4%
of respondents having Rs.200-400 Monthly Expenditure,25.8% having Rs. 400-700 Monthly Expenditure,21.7% of respondents have less than Rs.200 Monthly Expenditure, 9.6% of respondents have Rs. 700-1000 Monthly Expenditure and 6.6% of Respondents have More than Rs 1000 Monthly Expenditure on Mobile.

7.More Usage OfLocal Sms ServiceSTD Internet(GPRS)ISDRoaming
$MOREUSE Frequencies
Responses Percent of
CasesN Percent
RESPONDENT'S MORE
USAGEa
RESPONDENT'S MORE
USAGE OF LOCAL CALL
155 40.1% 78.3%
RESPONDENT'S MORE
USAGE OF STD CALL
36 9.3% 18.2%
RESPONDENT'S MORE
USAGE OF ISD CALL
8 2.1% 4.0%
RESPONDENT'S MORE
USAGE OF ROAMING
CALL
9 2.3% 4.5%
RESPONDENT'S MORE
USAGE OF SMS SERVICE
65 16.8% 32.8%
RESPONDENT'S MORE
USAGE OF
INTERNET(GPRS)
114 29.5% 57.6%
Total 387 100.0% 195.5%
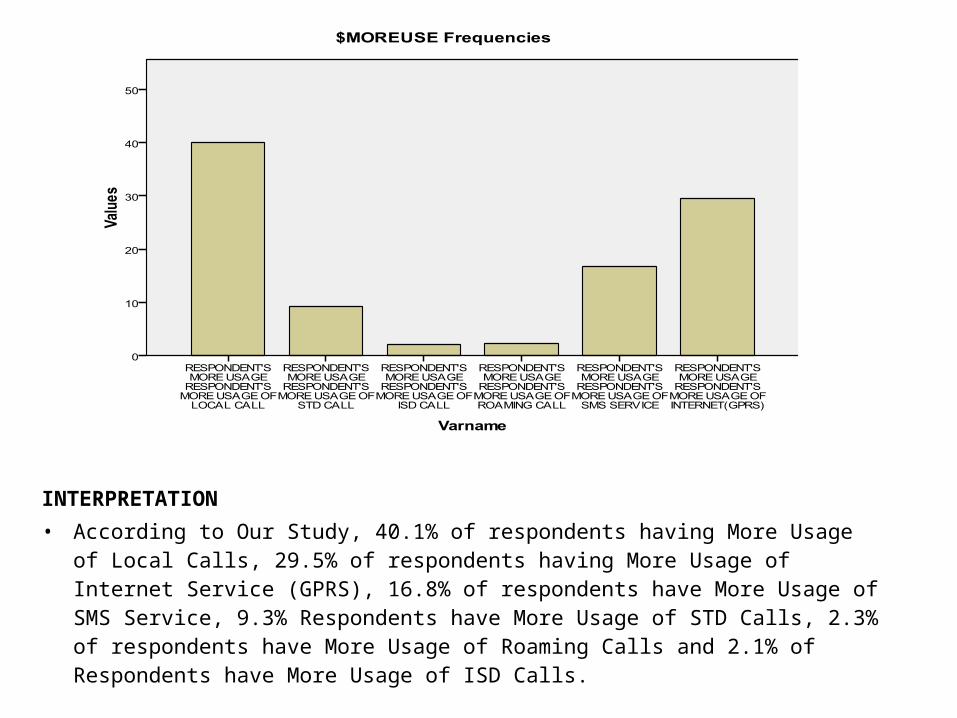
INTERPRETATION• According to Our Study, 40.1% of respondents having More Usage of Local Calls,
29.5% of respondents having More Usage of Internet Service (GPRS), 16.8% of respondents have More Usage of SMS Service, 9.3% Respondents have More Usage of STD Calls, 2.3% of respondents have More Usage of Roaming Calls and 2.1% of Respondents have More Usage of ISD Calls.

8.Are you aware of 3G ServicesYesNoSomewhat
INTERPRETATION• From the above table and graphical presentation we can know that 95.5%
of respondents are aware of 3G Mobile Service and Only 4.5% of Respondents are not aware of 3G Mobile Service
MEAN,MEDIAN AND MODE
N Valid 198
Missing 0
Mean 1.05
Median 1.00
Mode 1
Percentiles
25 1.00
50 1.00
75 1.00
RESPONDENT AWARE OF 3G SERVICE
Frequency Percent Valid PercentCumulative
Percent
Valid YES 189 95.5 95.5 95.5
NO 8 4.0 4.0 99.5
SOMEWHAT 1 .5 .5 100.0
Total 198 100.0 100.0

9.Are you currently user of 3G Mobile Service?YesNo, Planning in Future.No
CURRENT USERS OF 3G
Frequency Percent Valid PercentCumulative Percent
Valid YES 64 32.3 32.3 32.3
NO,PLANING IN FUTURE
124 62.6 62.6 94.9
NO 10 5.1 5.1 100.0
Total 198 100.0 100.0
INTERPRETATIONFrom the above table and graphical presentation we can know that 32.3% of respondents are currently using 3G Mobile Service and 62.6% of respondents are planning to use 3G Mobile Service in Future and Only 5% of respondents are not going to use 3G Mobile Service in future.
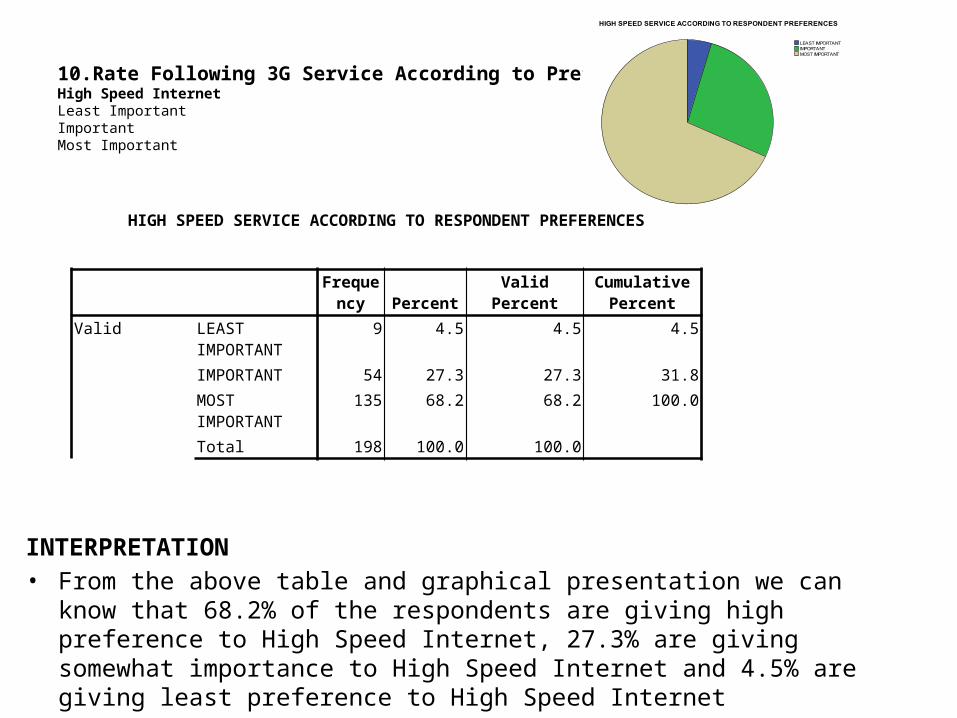
10.Rate Following 3G Service According to PreferencesHigh Speed InternetLeast ImportantImportantMost Important
INTERPRETATION• From the above table and graphical presentation we can know that 68.2%
of the respondents are giving high preference to High Speed Internet, 27.3% are giving somewhat importance to High Speed Internet and 4.5% are giving least preference to High Speed Internet
HIGH SPEED SERVICE ACCORDING TO RESPONDENT PREFERENCES
Frequency Percent Valid Percent
Cumulative Percent
Valid LEAST IMPORTANT
9 4.5 4.5 4.5
IMPORTANT 54 27.3 27.3 31.8
MOST IMPORTANT
135 68.2 68.2 100.0
Total 198 100.0 100.0

VideoLeast ImportantImportantMost Important
INTERPRETATION• From the above table and graphical presentation we can know that 28.2%
of the respondents are giving high preference to Video Service, 58.6% are giving somewhat importance to Video Service and 17.2% are giving least preference to Video Service.
VIDEO SERVICE ACCORDING TO RESPONDENT PREFERENCES
Frequency Percent Valid Percent
Cumulative Percent
Valid LEAST IMPORTANT
34 17.2 17.2 17.2
IMPORTANT 116 58.6 58.6 75.8
MOST IMPORTANT
48 24.2 24.2 100.0
Total 198 100.0 100.0

Live TVMost ImportantImportantLeast Important
INTERPRETATION• From the above table and graphical presentation we can know that 20.2%
of the respondents are giving high preference to Live TV, 40.9% are giving somewhat importance to Live TV and 38.9% are giving least preference to Live TV
LIVE TV ACCORDING TO RESPONDENT PREFERENCES
Frequency Percent Valid Percent
Cumulative Percent
Valid LEAST IMPORTANT
77 38.9 38.9 38.9
IMPORTANT 81 40.9 40.9 79.8
MOST IMPORTANT
40 20.2 20.2 100.0
Total 198 100.0 100.0

Online GamingMost ImportantImportantLeast Important
INTERPRETATION• From the above table and graphical presentation we can know that 18.2%
of the respondents are giving high preference to Online Gaming, 27.3% are giving somewhat importance to Online Gaming and 54.5% are giving least preference to Online Gaming
ONLINE GAMING ACCORDING TO RESPONDENT PREFERENCES
Frequency Percent Valid PercentCumulative
Percent
Valid LEAST IMPORTANT 108 54.5 54.5 54.5
IMPORTANT 54 27.3 27.3 81.8
MOST IMPORTANT 36 18.2 18.2 100.0
Total 198 100.0 100.0

Video, movies and Songs DownloadingMost ImportantImportantLeast Important
INTERPRETATION• From the above table and graphical presentation we can know that 53.5%
of the respondents are giving high preference to Video, Movies and Songs Downloading 35.9% are giving somewhat importance to Video, Movies and Songs Downloading and 10.6% are giving least preference to Video, Movies and Songs Downloading.
VIDEO,MOVIES AND SONG DOWNLOADING ACCORDING TO RESPONDENT PREFERENCES
Frequency Percent Valid PercentCumulative
Percent
Valid LEAST IMPORTANT 21 10.6 10.6 10.6
IMPORTANT 71 35.9 35.9 46.5
MOST IMPORTANT 106 53.5 53.5 100.0
Total 198 100.0 100.0

GPS for Navigation PurposeMost ImportantImportantLeast Important
INTERPRETATION• From the above table and graphical presentation we can know that 29.8%
of the respondents are giving high preference to GPS Service, 53.0% are giving somewhat importance to GPS Service, Movies and Songs Downloading and 17.2% are giving least preference to GPS Service.
GPS FOR NEVIGATION PURPOSE ACCORDING TO RESPONDENT PREFERENCES
Frequency Percent Valid PercentCumulative
Percent
Valid LEAST IMPORTANT 34 17.2 17.2 17.2
IMPORTANT 105 53.0 53.0 70.2
MOST IMPORTANT 59 29.8 29.8 100.0
Total 198 100.0 100.0

11.For what purpose do you want to use 3G multimedia servicesEntertainmentCommunicationDaily life information enquiryBusinessOther
Case Summary
Cases
Valid Missing Total
N Percent N Percent N Percent
$PURPOSEa 197 99.5% 1 .5% 198 100.0%
$PURPOSE Frequencies
Responses Percent of
CasesN Percent
$PURPOSEa RESPONDENT'S PURPOSE OF
USING 3G MULTIMEDIA
SERVICE:ENTERTAINMENT
118 34.2% 59.9%
RESPONDENT'S PURPOSE OF
USING 3G MULTIMEDIA SERVICE :
COMMUNICATION
103 29.9% 52.3%
RESPONDENT'S PURPOSE OF
USING 3G MULTIMEDIA SERVICE :
DAILY ENQUIRY
72 20.9% 36.5%
RESPONDENT'S PURPOSE OF
USING 3G MULTIMEDIA SERVICE :
BUSINESS
47 13.6% 23.9%
RESPONDENT'S PURPOSE OF
USING 3G MULTIMEDIA SERVICE :
OTHER PURPOSE
5 1.4% 2.5%
Total 345 100.0% 175.1%

INTERPRETATION• According to Our Study, 34.2% of respondents are using 3G Multi Media
Service for Entertainment, 29.9% of respondent for Communication, 20.9% of respondent for Daily Enquiry, 13.6% of respondents for Business and Only 1.3% of respondents for Other Purpose.

AGE OF RESPONDENT
18-25 25- 40
Count Count
Pu STRONGLY DISAGREE
16 1
DISAGREE 65 19
NEUTRAL 124 34
AGREE 142 44
STRONGLY AGREE
90 21
Pearson Chi-Square Tests
AGE OF RESPONDENT
Pu Chi-square 8.354
Df 5
Sig. .138
HYPOTHESIS TESTINGNull Hypothesis H0: Age positively affects the Perceived Usefulness of
3G service.Alternate hypothesis H1: Age negatively affects the Perceived
Usefulness of 3G service.
INTERPRETATIONAs Pearson significance value is found to be more than 0.05, null
hypothesis does not get rejected. Above cross table shows significance relevance of perceived usefulness with age. Here relationship of perceived usefulness can established with age.
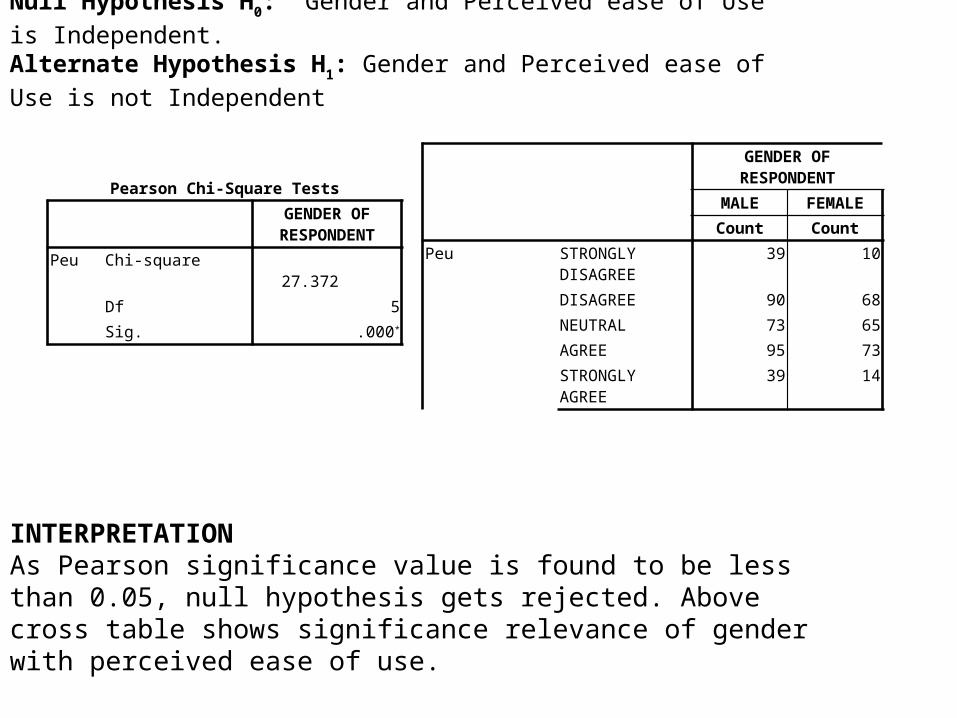
Null Hypothesis H0: Gender and Perceived ease of Use is Independent.
Alternate Hypothesis H1: Gender and Perceived ease of Use is not
Independent
GENDER OF RESPONDENT
MALE FEMALE
Count Count
Peu STRONGLY DISAGREE
39 10
DISAGREE 90 68
NEUTRAL 73 65
AGREE 95 73
STRONGLY AGREE
39 14
Pearson Chi-Square Tests
GENDER OF RESPONDENT
Peu Chi-square27.372
Df 5
Sig. .000*
INTERPRETATIONAs Pearson significance value is found to be less than 0.05, null hypothesis gets rejected. Above cross table shows significance relevance of gender with perceived ease of use.

Null Hypothesis H0: Monthly Expenditure negatively affects User’s Behavioral
intentions to adopt 3G.Alternate hypothesis H1: Monthly Expenditure not negatively affects User’s
Behavioral intentions to adopt 3G.
MONTHLY EXPNDITURE OF RESPONDENT
<200200-400
400-700
700-1000 >1000
Count Count Count Count Count
Bi STRONGLY DISAGREE
4 4 1 0 1
DISAGREE 5 12 10 1 2
NEUTRAL 24 33 23 0 4
AGREE 28 58 44 18 11
STRONGLY AGREE 16 27 14 4 6
Pearson Chi-Square Tests
MONTHLY EXPNDITURE
OF RESPONDEN
T
Bi Chi-square 37.717
Df 20
Sig. .010*,a,b
INTERPRETATIONAs Pearson significance value is found to be greater than 0.05, null hypothesis does not get rejected. Above cross table shows monthly expenditure was found to have a significant negative effect on user’s behavioral intention to adopt 3G.

Null Hypothesis H0: Actual use of 3G Service is independent of Gender.
Alternate Hypothesis H1: Actual use of 3G Service is not independent of Gender.
GENDER OF RESPONDENT
MALE FEMALE
Count Count
AMONG MY PEERS,I AM USUALLY THE FIRST TO TRY NEW TECHNOLOGY
STRONGLY DISAGREE
4 6
DISAGREE 15 21
NEUTRAL 42 29
AGREE 39 23
STRONGLY AGREE 16 3
Pearson Chi-Square Tests
GENDER OF RESPONDENT
AMONG MY PEERS,I AM USUALLY THE FIRST TO TRY NEW TECHNOLOGY
Chi-square 11.299
Df 4
Sig. .023*
INTERPRETATIONAs Pearson significance value is found to be greater than 0.05, null hypothesis does not get rejected. Above cross table shows no significance relevance of gender with actual use of 3G Service.
CONCLUSION
• Results showed that respondents’ intention to use 3G mobile services is determined by their perception on its usefulness and how convenient it is to use and access 3G mobile services’ functions.
• The results highlighted the importance of perceived ease of use towards 3G mobile services’ in terms of how easy or effortless it is to communicate with each other.
• The result highlighted the perceived ease of use towards 3G mobile Service dependent on Gender.

RECOMMENDATIONS
• Telecommunication Companies should try to focus on youngster people having age between 18-25.
• Results suggest most of people use prepaid connection. For that telecommunication companies need to be focused on that segment.
• Results suggest most of mobile users have monthly expenditure between Rs.1-400.For that telecommunication companies need to be provided efficient and attractive 3G plans.