Embed Size (px)
Citation preview
NORDEN – ANNUAL REPORT 2016 RESULTS | 1 Custodians of smarter global trade
NORDEN
RESULTS
Annual Report 2016
Copenhagen, Denmark
1 March 2017
NORDEN – ANNUAL REPORT 2016 RESULTS | 2 Custodians of smarter global trade
AGENDA
� Group highlights
� Financials
� Dry Cargo
� Tankers
� 2017 expectations
� Q & A
NORDEN – ANNUAL REPORT 2016 RESULTS | 3 Custodians of smarter global trade
2016 HIGHLIGHTS
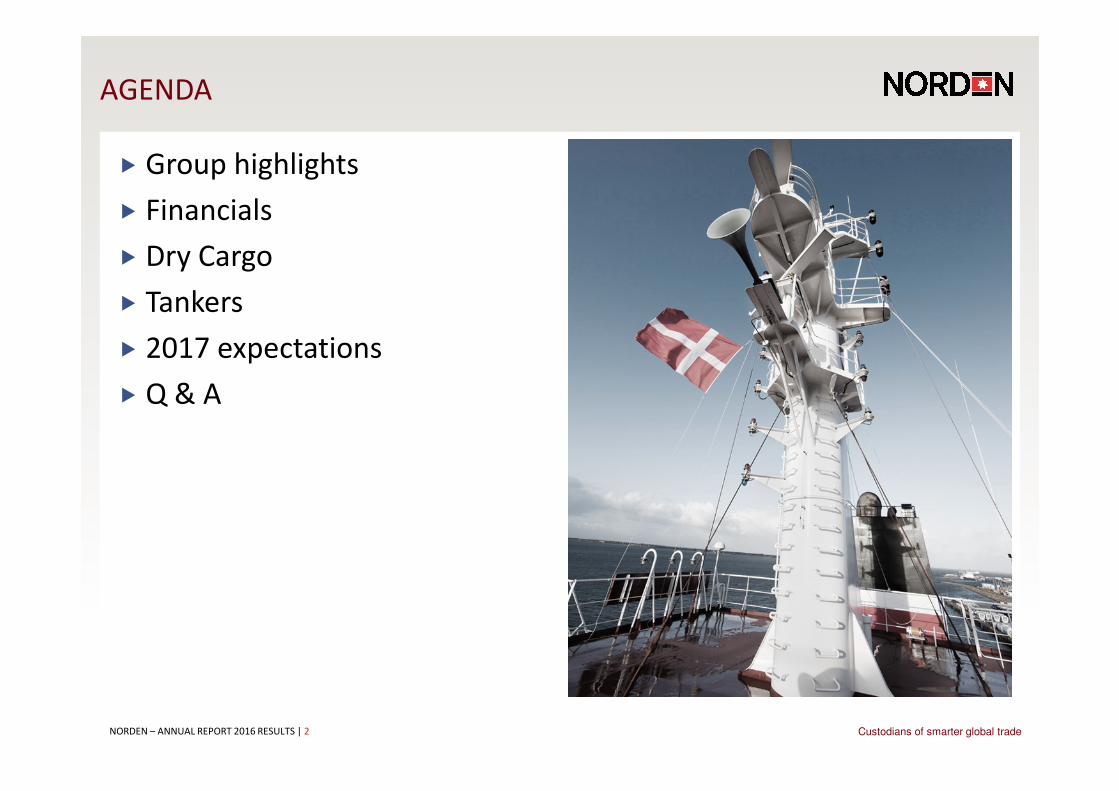
� Adjusted net result USD -35 million
which is within guidance
� Dry Cargo� Low but improving rates in 2016
� Continued gradual recovery in 2017
� Tankers� Gradually declining rates in 2016
� Continued cyclical downturn in 2017
� Net commitments reduced by 37%
� No dividends
� 2017 Guidance: Adjusted net result
USD -20 to 40 million
Key messagesAdjusted net result
Significant exposure to improvement in Dry Cargo market
-61
-350
-263
-35-20
40
-400
-300
-200
-100
0
100
2013 2014 2015 2016 2017 Guidance
US
D m
illi
on
0
2000
4000
6000
8000
10000
12000
2018 2019 2020 2021
US
D/d
ay
Supramax FFA rate 21/2-2017 Supramax FFA rate 1/11-2016
58,000 open ship
days in Dry Cargo
2018-2021
Supramax FFA rates 21/2-2017
Supramax FFA rates 1/11-2016
NORDEN – ANNUAL REPORT 2016 RESULTS | 4 Custodians of smarter global trade
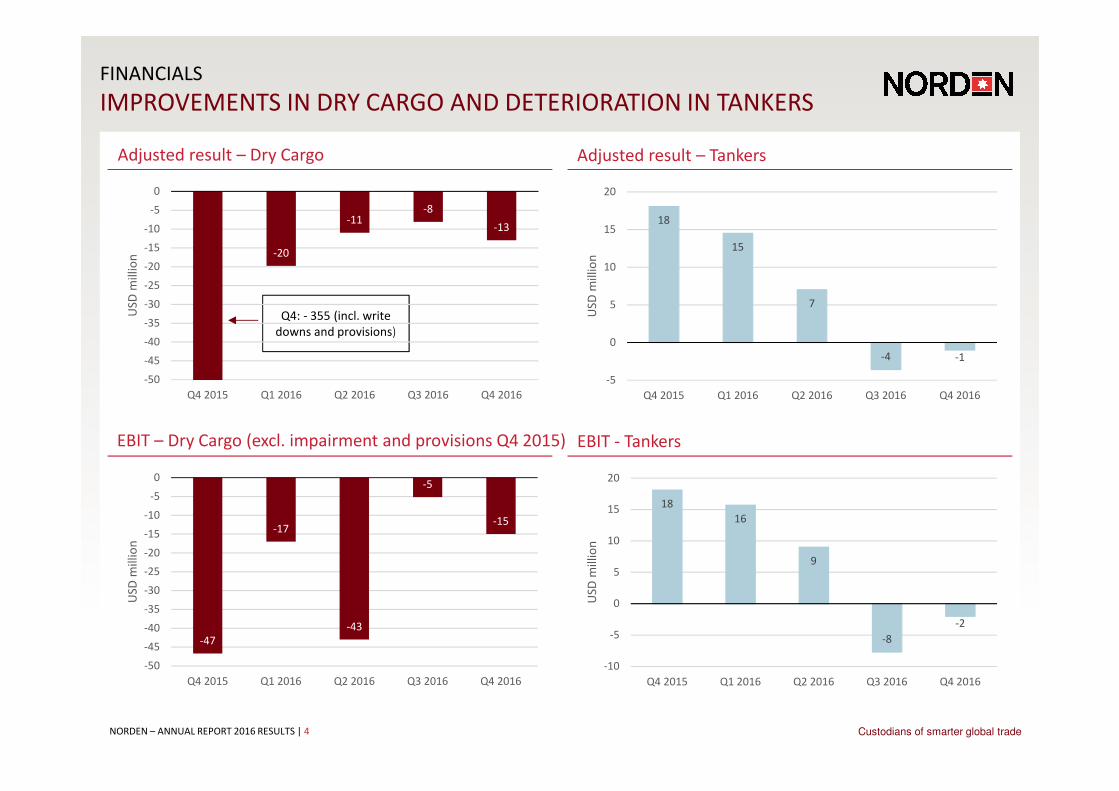
FINANCIALS
IMPROVEMENTS IN DRY CARGO AND DETERIORATION IN TANKERS
Adjusted result – Tankers
EBIT - Tankers
Adjusted result – Dry Cargo
EBIT – Dry Cargo (excl. impairment and provisions Q4 2015)
Q4: - 355 (incl. write
downs and provisions)
-20
-11-8
-13
-50
-45
-40
-35
-30
-25
-20
-15
-10
-5
0
Q4 2015 Q1 2016 Q2 2016 Q3 2016 Q4 2016
US
D m
illi
on
18
15
7
-4 -1
-5
0
5
10
15
20
Q4 2015 Q1 2016 Q2 2016 Q3 2016 Q4 2016
US
D m
illi
on
18
16
9
-8
-2
-10
-5
0
5
10
15
20
Q4 2015 Q1 2016 Q2 2016 Q3 2016 Q4 2016
US
D m
illi
on
-47
-17
-43
-5
-15
-50
-45
-40
-35
-30
-25
-20
-15
-10
-5
0
Q4 2015 Q1 2016 Q2 2016 Q3 2016 Q4 2016
US
D m
illi
on
NORDEN – ANNUAL REPORT 2016 RESULTS | 5 Custodians of smarter global trade
0
200
400
600
800
1,000
1,200
1,400
2014 2015 2016
UD
S m
illi
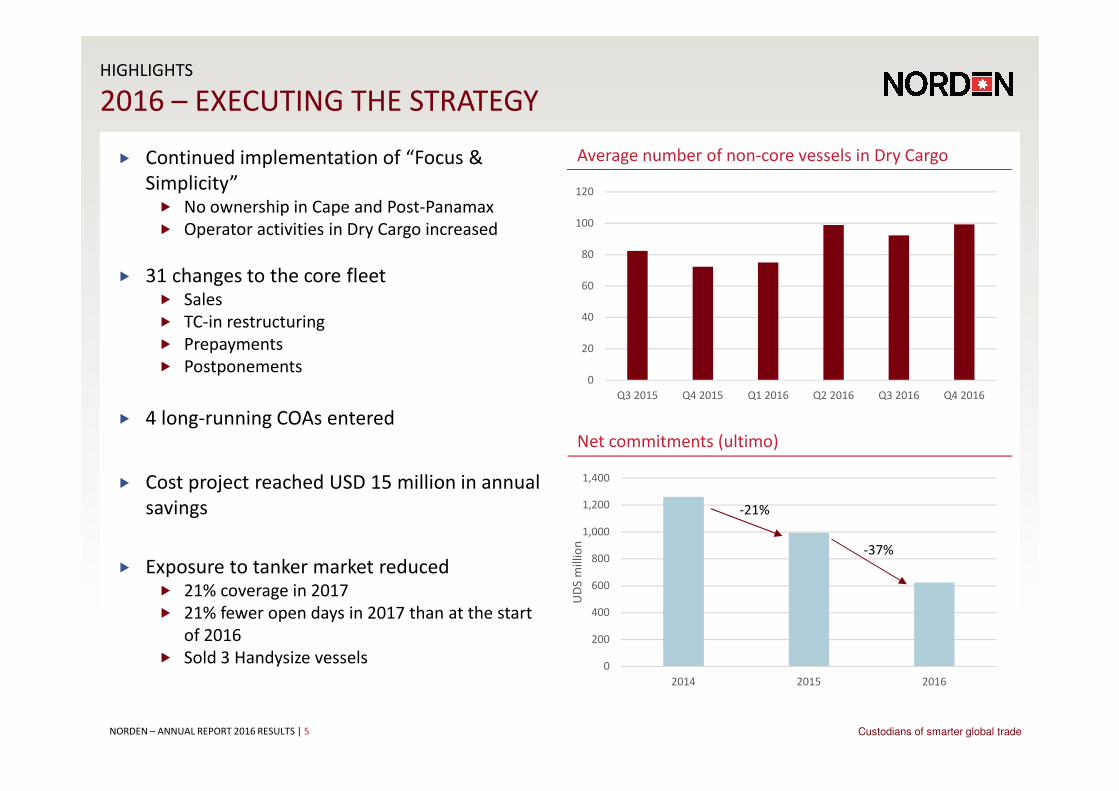
on -37%
HIGHLIGHTS
2016 – EXECUTING THE STRATEGY
Average number of non-core vessels in Dry Cargo
Net commitments (ultimo)
� Continued implementation of “Focus &
Simplicity”� No ownership in Cape and Post-Panamax
� Operator activities in Dry Cargo increased
� 31 changes to the core fleet� Sales
� TC-in restructuring
� Prepayments
� Postponements
� 4 long-running COAs entered
� Cost project reached USD 15 million in annual
savings
� Exposure to tanker market reduced� 21% coverage in 2017
� 21% fewer open days in 2017 than at the start
of 2016
� Sold 3 Handysize vessels
-21%
0
20
40
60
80
100
120
Q3 2015 Q4 2015 Q1 2016 Q2 2016 Q3 2016 Q4 2016
NORDEN – ANNUAL REPORT 2016 RESULTS | 6 Custodians of smarter global trade
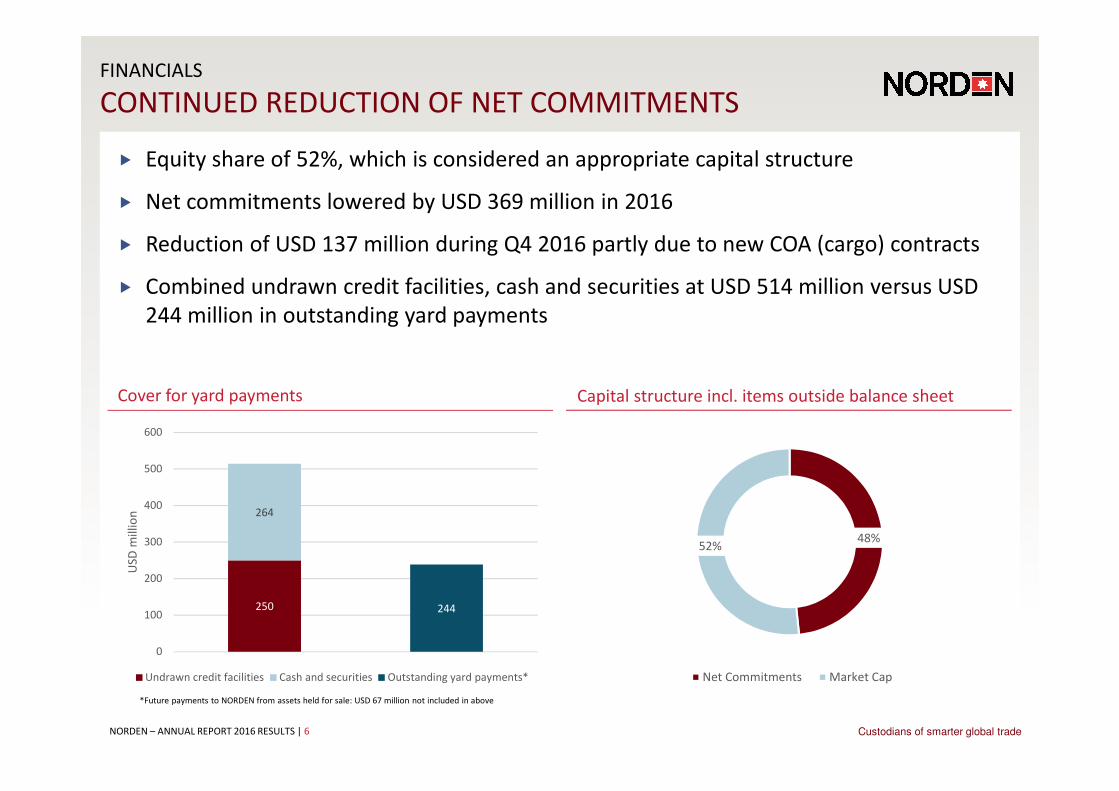
FINANCIALS
CONTINUED REDUCTION OF NET COMMITMENTS
Capital structure incl. items outside balance sheetCover for yard payments
� Equity share of 52%, which is considered an appropriate capital structure
� Net commitments lowered by USD 369 million in 2016
� Reduction of USD 137 million during Q4 2016 partly due to new COA (cargo) contracts
� Combined undrawn credit facilities, cash and securities at USD 514 million versus USD
244 million in outstanding yard payments
48%52%
Net Commitments Market Cap
250
264
244
0
100
200
300
400
500
600
US
D m
illi
on
Undrawn credit facilities Cash and securities Outstanding yard payments*
*Future payments to NORDEN from assets held for sale: USD 67 million not included in above
NORDEN – ANNUAL REPORT 2016 RESULTS | 7 Custodians of smarter global trade
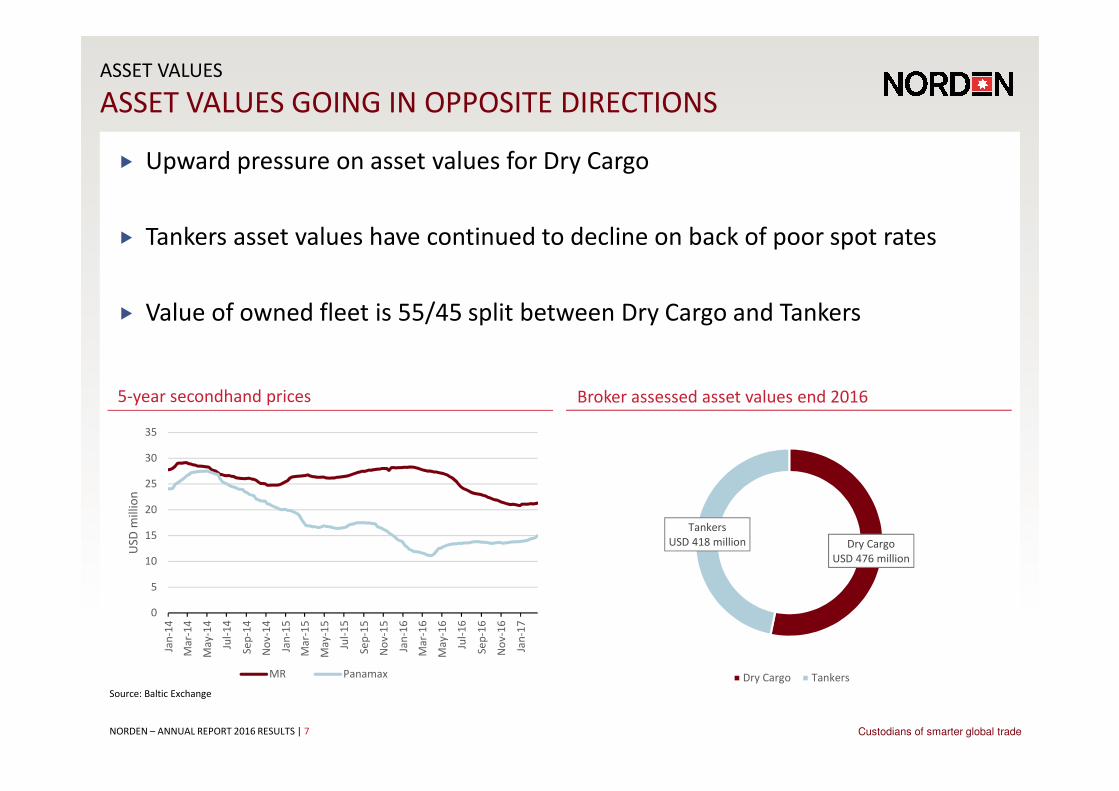
ASSET VALUES
ASSET VALUES GOING IN OPPOSITE DIRECTIONS
Broker assessed asset values end 20165-year secondhand prices
� Upward pressure on asset values for Dry Cargo
� Tankers asset values have continued to decline on back of poor spot rates
� Value of owned fleet is 55/45 split between Dry Cargo and Tankers
Source: Baltic Exchange
0
5
10
15
20
25
30
35
Jan
-14
Ma
r-1
4
Ma
y-1
4
Jul-
14
Se
p-1
4
No
v-1
4
Jan
-15
Ma
r-1
5
Ma
y-1
5
Jul-
15
Se
p-1
5
No
v-1
5
Jan
-16
Ma
r-1
6
Ma
y-1
6
Jul-
16
Se
p-1
6
No
v-1
6
Jan
-17
US
D m
illi
on
MR Panamax
Dry Cargo
USD 476 million
Tankers
USD 418 million
Dry Cargo Tankers
NORDEN – ANNUAL REPORT 2016 RESULTS | 8 Custodians of smarter global trade
DRY CARGO 2016
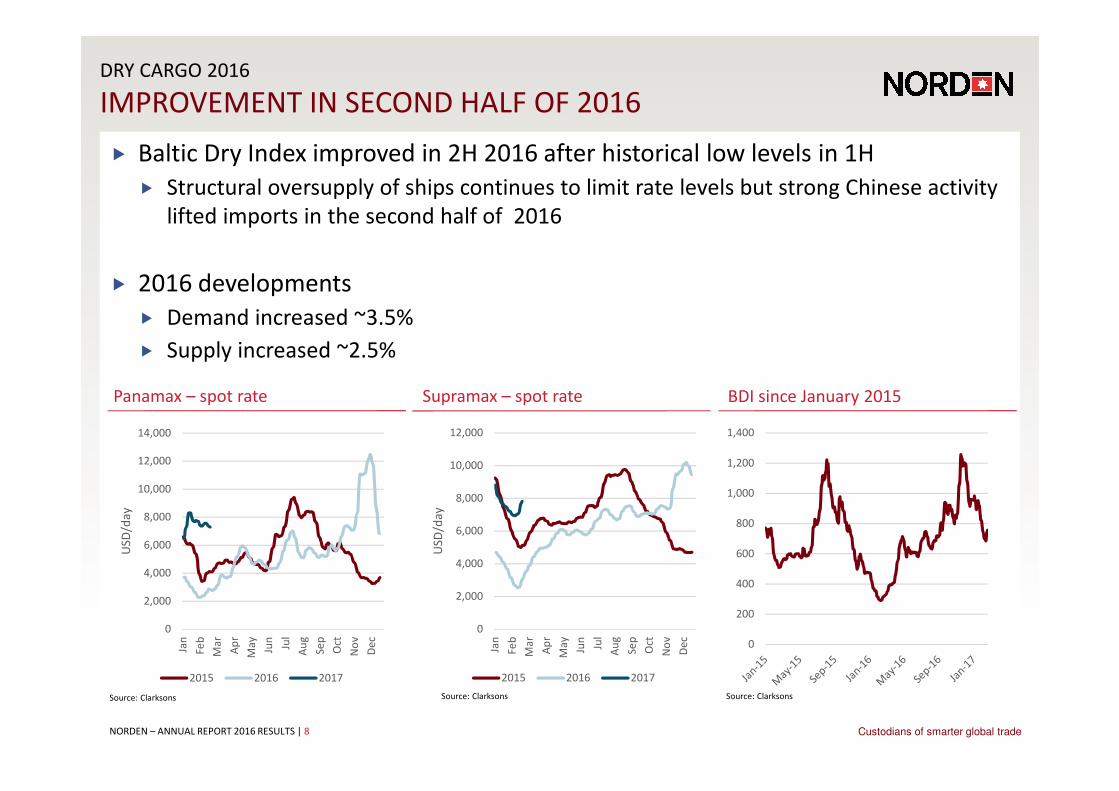
IMPROVEMENT IN SECOND HALF OF 2016
Supramax – spot ratePanamax – spot rate BDI since January 2015
� Baltic Dry Index improved in 2H 2016 after historical low levels in 1H
� Structural oversupply of ships continues to limit rate levels but strong Chinese activity
lifted imports in the second half of 2016
� 2016 developments
� Demand increased ~3.5%
� Supply increased ~2.5%
0
2,000
4,000
6,000
8,000
10,000
12,000
14,000
Jan
Fe
b
Ma
r
Ap
r
Ma
y
Jun
Jul
Au
g
Se
p
Oct
No
v
De
c
US
D/d
ay
2015 2016 2017
0
2,000
4,000
6,000
8,000
10,000
12,000
Jan
Fe
b
Ma
r
Ap
r
Ma
y
Jun
Jul
Au
g
Se
p
Oct
No
v
De
c
US
D/d
ay
2015 2016 2017
0
200
400
600
800
1,000
1,200
1,400
Source: Clarksons Source: Clarksons Source: Clarksons
NORDEN – ANNUAL REPORT 2016 RESULTS | 9 Custodians of smarter global trade
DRY CARGO 2016
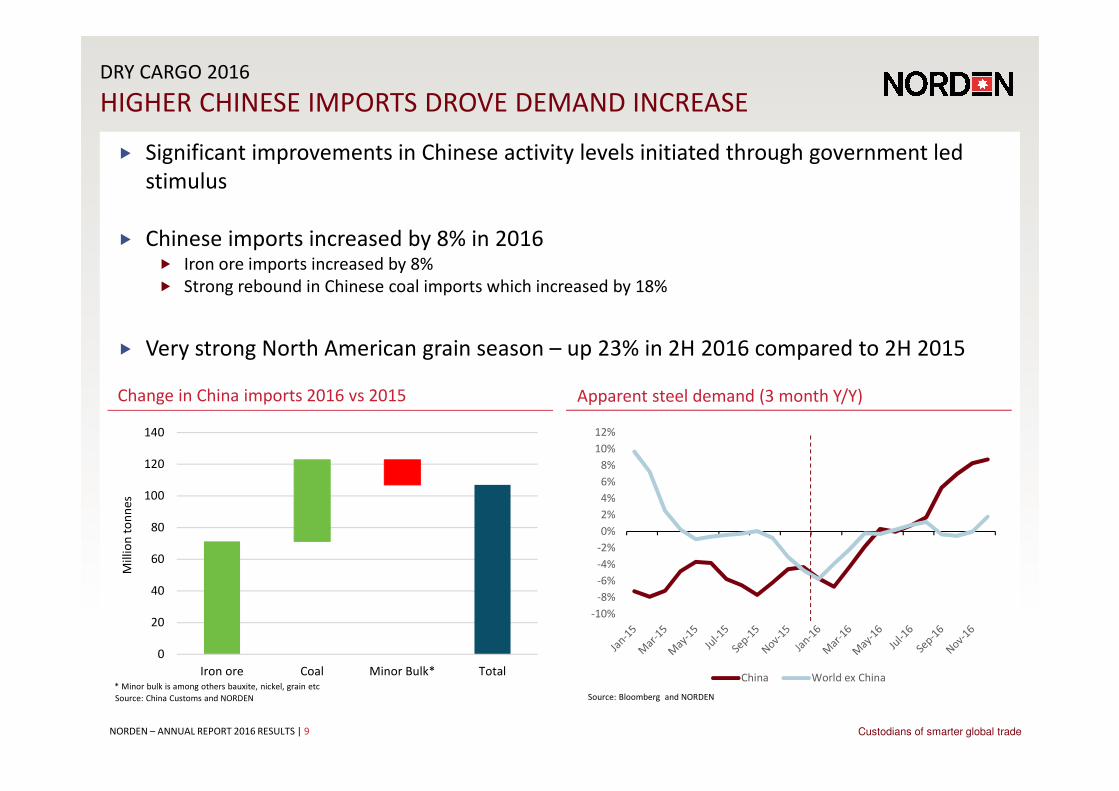
HIGHER CHINESE IMPORTS DROVE DEMAND INCREASE
Apparent steel demand (3 month Y/Y)Change in China imports 2016 vs 2015
� Significant improvements in Chinese activity levels initiated through government led
stimulus
� Chinese imports increased by 8% in 2016� Iron ore imports increased by 8%
� Strong rebound in Chinese coal imports which increased by 18%
� Very strong North American grain season – up 23% in 2H 2016 compared to 2H 2015
Source: China Customs and NORDEN Source: Bloomberg and NORDEN
0
20
40
60
80
100
120
140
Iron ore Coal Minor Bulk* Total
Mil
lio
n t
on
ne
s
* Minor bulk is among others bauxite, nickel, grain etc
-10%
-8%
-6%
-4%
-2%
0%
2%
4%
6%
8%
10%
12%
China World ex China
NORDEN – ANNUAL REPORT 2016 RESULTS | 10 Custodians of smarter global trade
DRY CARGO OUTLOOK
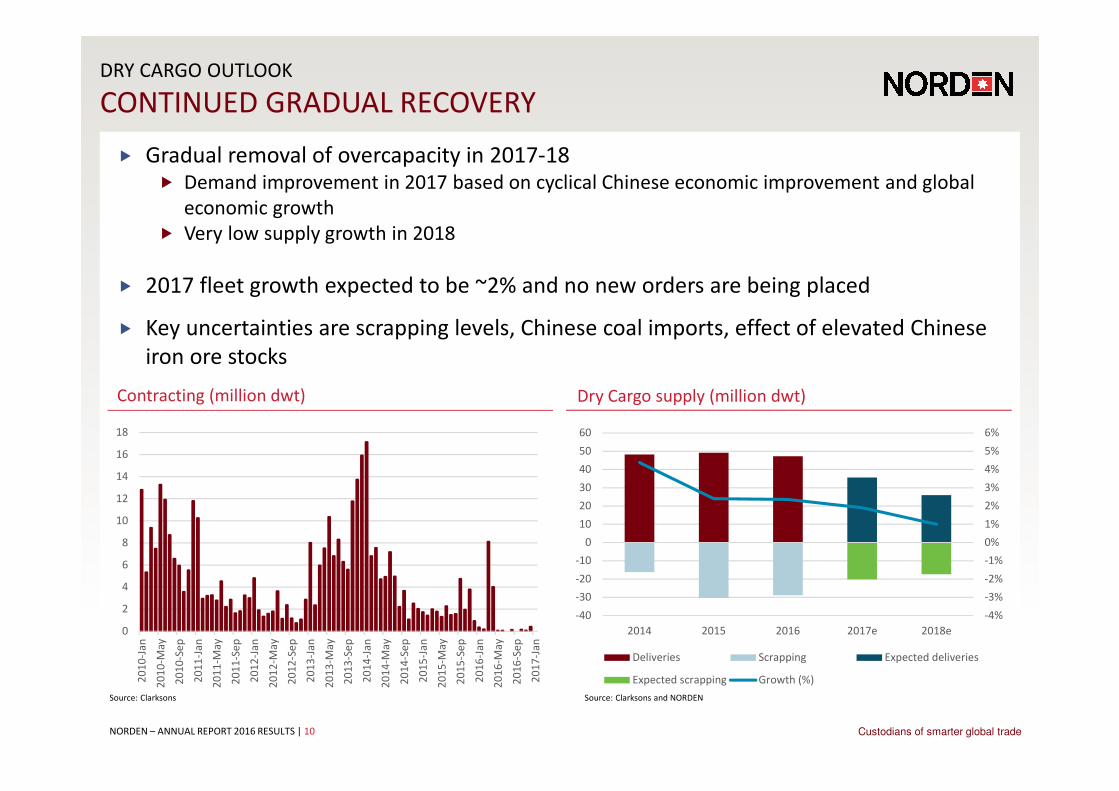
CONTINUED GRADUAL RECOVERY
Dry Cargo supply (million dwt)Contracting (million dwt)
� Gradual removal of overcapacity in 2017-18� Demand improvement in 2017 based on cyclical Chinese economic improvement and global
economic growth
� Very low supply growth in 2018
� 2017 fleet growth expected to be ~2% and no new orders are being placed
� Key uncertainties are scrapping levels, Chinese coal imports, effect of elevated Chinese
iron ore stocks
Source: Clarksons Source: Clarksons and NORDEN
-4%
-3%
-2%
-1%
0%
1%
2%
3%
4%
5%
6%
-40
-30
-20
-10
0
10
20
30
40
50
60
2014 2015 2016 2017e 2018e
Deliveries Scrapping Expected deliveries
Expected scrapping Growth (%)
0
2
4
6
8
10
12
14
16
18
20
10
-Ja
n
20
10
-Ma
y
20
10
-Se
p
20
11
-Ja
n
20
11
-Ma
y
20
11
-Se
p
20
12
-Ja
n
20
12
-Ma
y
20
12
-Se
p
20
13
-Ja
n
20
13
-Ma
y
20
13
-Se
p
20
14
-Ja
n
20
14
-Ma
y
20
14
-Se
p
20
15
-Ja
n
20
15
-Ma
y
20
15
-Se
p
20
16
-Ja
n
20
16
-Ma
y
20
16
-Se
p
20
17
-Ja
n
NORDEN – ANNUAL REPORT 2016 RESULTS | 11 Custodians of smarter global trade
TANKERS
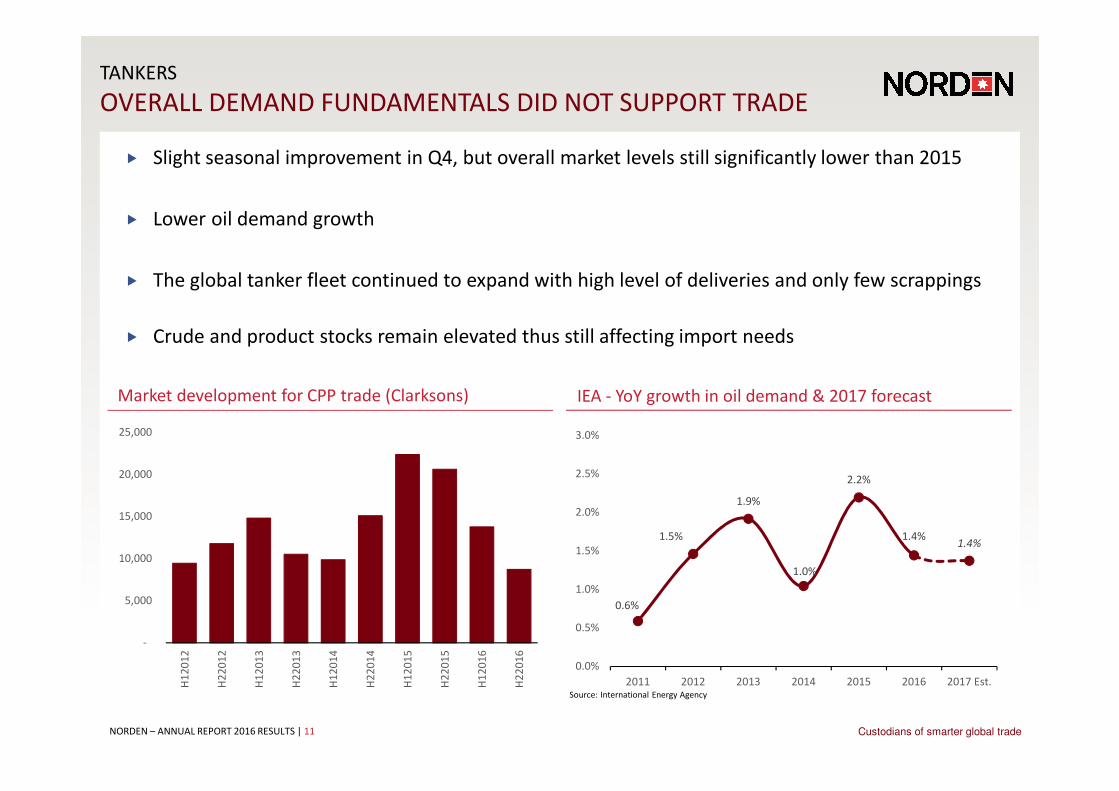
OVERALL DEMAND FUNDAMENTALS DID NOT SUPPORT TRADE
IEA - YoY growth in oil demand & 2017 forecast
0.6%
1.5%
1.9%
1.0%
2.2%
1.4%1.4%
0.0%
0.5%
1.0%
1.5%
2.0%
2.5%
3.0%
2011 2012 2013 2014 2015 2016 2017 Est.
Market development for CPP trade (Clarksons)
� Slight seasonal improvement in Q4, but overall market levels still significantly lower than 2015
� Lower oil demand growth
� The global tanker fleet continued to expand with high level of deliveries and only few scrappings
� Crude and product stocks remain elevated thus still affecting import needs
Source: International Energy Agency
-
5,000
10,000
15,000
20,000
25,000
H1
20
12
H2
20
12
H1
20
13
H2
20
13
H1
20
14
H2
20
14
H1
20
15
H2
20
15
H1
20
16
H2
20
16

NORDEN – ANNUAL REPORT 2016 RESULTS | 12 Custodians of smarter global trade
TANKERS OUTLOOK
CONTINUED CYCLICAL DOWNTURN THROUGH 2017
Contracting (million dwt)Yearly net fleet growth and forecast 2017 (%, dwt)
� Market levels not expected to recover in 2017
� High fleet growth again in 2017 - total tanker fleet growth of 4-5%� Net growth for 2017 expected drop to 2-3% in product tankers
� Lower oil demand growth and high inventories limit tanker demand growth
� Contracting remains well below historical figures
0%
1%
2%
3%
4%
5%
6%
7%
8%
2012 2013 2014 2015 2016 2017 (F)
Ye
arl
y n
et
gro
wth
(%
)
Product Crude Total Tank
Source: SSY, Clarksons, NORDEN
0
2
4
6
8
10
12
20
13
-Jan
20
13
-Ma
y
20
13
-Se
p
20
14
-Jan
20
14
-Ma
y
20
14
-Se
p
20
15
-Jan
20
15
-Ma
y
20
15
-Se
p
20
16
-Jan
20
16
-Ma
y
20
16
-Se
p
Source: Clarksons Platou, all tankers +10k dwt

NORDEN – ANNUAL REPORT 2016 RESULTS | 13 Custodians of smarter global trade
2017 FULL YEAR GUIDANCE
CommentsOutlook
USDm Dry Cargo Tankers Total
Adjusted
results for
the year
-15 to 45 -15 to 15 -20 to 40
� Adjusted net result USD -20 to 40
million
� Corresponds to EBIT of USD -5 to
55 million
� Improving market conditions in
dry cargo
� Continued poor tanker market
NORDEN – ANNUAL REPORT 2016 RESULTS | 14 Custodians of smarter global trade
FORWARD LOOKING STATEMENTSFORWARD LOOKING STATEMENTS
This presentation contains certain forward-looking statements reflecting the
management’s present judgment of future events and financial results.
Statements relating to the remainder of 2017 and subsequent years are subject to
uncertainty, and NORDEN’s actual results may therefore differ from the
projections. Factors that may cause such variance include, but are not limited to,
changes in macro-economic and political conditions, particularly in the
Company’s principal markets; changes to the Company’s rate assumptions and
operating costs; volatility in rates and tonnage prices; regulatory changes; any
disruptions to traffic and operations as a result of external events, etc.
NORDEN – ANNUAL REPORT 2016 RESULTS | 15 Custodians of smarter global trade
Dampskibsselskabet NORDEN A/S
52, Strandvejen
DK-2900 Hellerup
Denmark
Phone: +45 3315 0451
www.ds-norden.com
http://www.linkedin.com/company/ds-norden/
http://twitter.com/DS_NORDEN
http://www.facebook.com/shippingtrainee.com
http://www.facebook.com/dampskibsselskabetnorden
Thank you for your attention
NORDEN – ANNUAL REPORT 2016 RESULTS | 16 Custodians of smarter global trade
FORWARD LOOKING STATEMENTSBACK UP SLIDES
NORDEN – ANNUAL REPORT 2016 RESULTS | 17 Custodians of smarter global trade
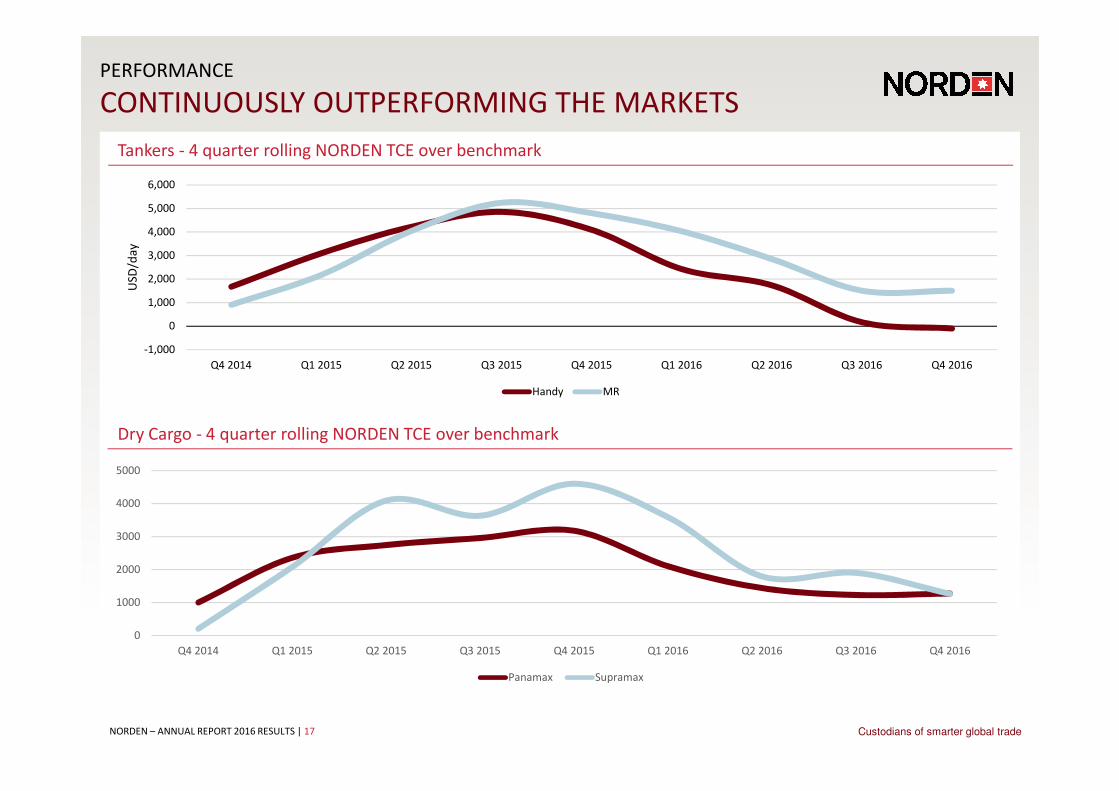
PERFORMANCE
CONTINUOUSLY OUTPERFORMING THE MARKETS
Dry Cargo - 4 quarter rolling NORDEN TCE over benchmark
Tankers - 4 quarter rolling NORDEN TCE over benchmark
0
1000
2000
3000
4000
5000
Q4 2014 Q1 2015 Q2 2015 Q3 2015 Q4 2015 Q1 2016 Q2 2016 Q3 2016 Q4 2016
Panamax Supramax
-1,000
0
1,000
2,000
3,000
4,000
5,000
6,000
Q4 2014 Q1 2015 Q2 2015 Q3 2015 Q4 2015 Q1 2016 Q2 2016 Q3 2016 Q4 2016
US
D/d
ay
Handy MR
NORDEN – ANNUAL REPORT 2016 RESULTS | 18 Custodians of smarter global trade
� 2 Segments - focus on vessel types where we can make a difference
� Dry Cargo
� Tankers
� Full scale operational setup - Direct customer contact
� Portfolio of time charter-in contracts and earnings coverage
� Long track record of overperformance in Dry Cargo and Tankers
� Healthy balance sheet
� Transparency and clear Corporate Governance
WHAT MAKES NORDEN DIFFERENT?
NORDEN – ANNUAL REPORT 2016 RESULTS | 19 Custodians of smarter global trade
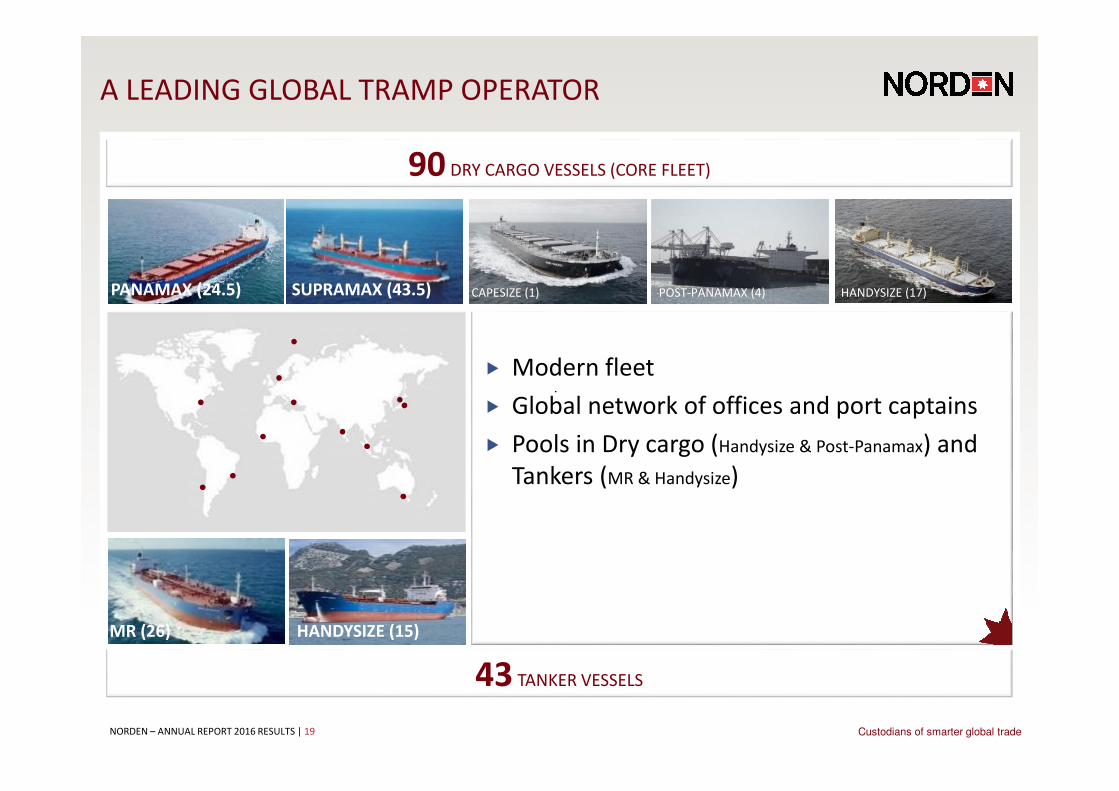
A LEADING GLOBAL TRAMP OPERATOR
Tankers
43 TANKER VESSELS
CAPESIZE (1) POST-PANAMAX (4) PANAMAX (24.5) SUPRAMAX (43.5) HANDYSIZE (17)
MR (26) HANDYSIZE (15)
90 DRY CARGO VESSELS (CORE FLEET)
� Modern fleet
� Global network of offices and port captains
� Pools in Dry cargo (Handysize & Post-Panamax) and
Tankers (MR & Handysize)
NORDEN – ANNUAL REPORT 2016 RESULTS | 20 Custodians of smarter global trade
0
25
50
75
100
125
150
175
200
225
250
275
300
18
71
18
74
18
77
18
80
18
83
18
86
18
89
18
92
18
95
18
98
19
01
19
04
19
07
19
10
19
13
19
16
19
19
19
22
19
25
19
28
19
31
19
34
19
37
19
40
19
43
19
46
19
49
19
53
19
56
19
59
19
62
19
65
19
68
19
71
19
74
19
77
19
80
19
83
19
89
19
92
19
95
19
98
20
01
20
04
20
07
20
10
20
12
20
15
20
16
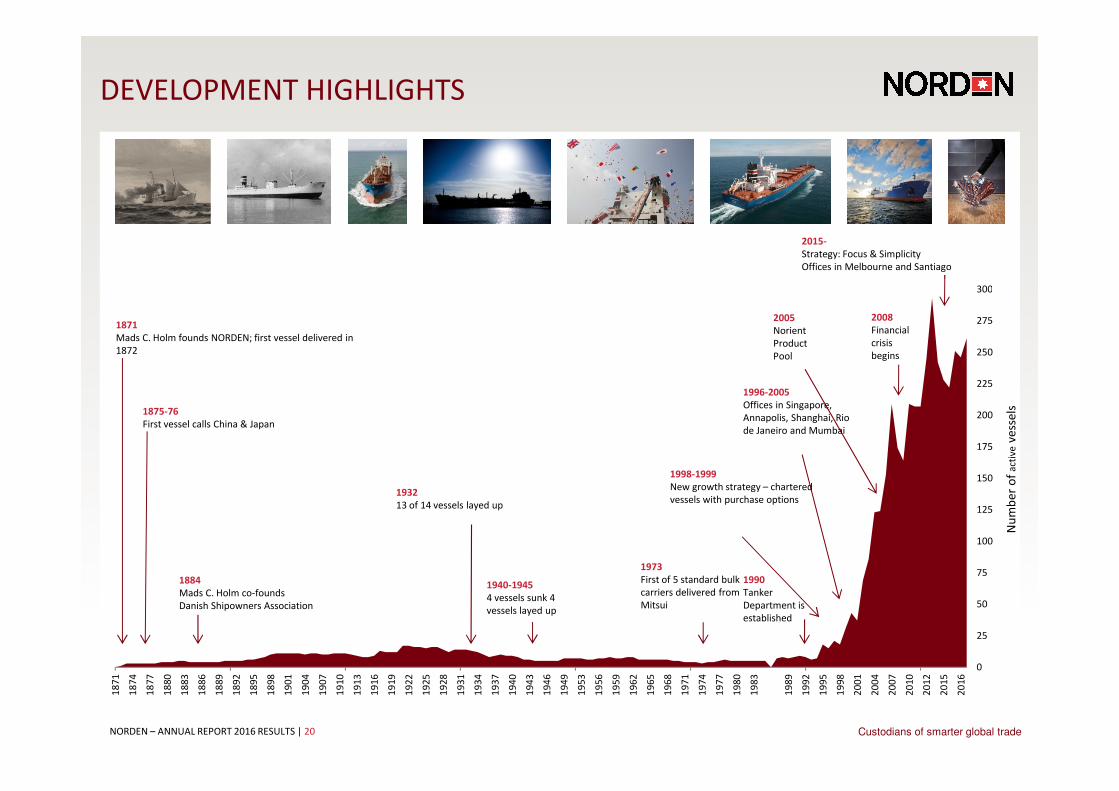
DEVELOPMENT HIGHLIGHTS
Nu
mb
er
of
act
ive
vess
els
2005
Norient
Product
Pool
1871
Mads C. Holm founds NORDEN; first vessel delivered in
1872
1875-76
First vessel calls China & Japan
1990
Tanker
Department is
established
1884
Mads C. Holm co-founds
Danish Shipowners Association
1996-2005
Offices in Singapore,
Annapolis, Shanghai, Rio
de Janeiro and Mumbai
1973
First of 5 standard bulk
carriers delivered from
Mitsui
1998-1999
New growth strategy – chartered
vessels with purchase options1932
13 of 14 vessels layed up
1940-1945
4 vessels sunk 4
vessels layed up
2008
Financial
crisis
begins
2015-
Strategy: Focus & Simplicity
Offices in Melbourne and Santiago

NORDEN – ANNUAL REPORT 2016 RESULTS | 21 Custodians of smarter global trade
ASSET LIGHT BUSINESS MODEL…
� Sale and purchase
� Technical competencies in-
house
Owned (47.5)
Chartered > 13
months (81.5)
Chartered < 13
months (132)
Capacity
� Option-based flexibility
� Some with purchase options
� Flexibility and scale
� Arbitrage
� Single-trip charters
Contracts of
affreightment
TC out
FFA market
Employment
Spot market
� Customer relations
� Logistical efficiencies
� 2-10 year firm periods
� Quick and easy cover
* Active fleet per 30 June 2011
� Active fleet can quickly be adjusted to demand and market conditions
� Fleet employment based on portfolio view
Coverage and customer focusFlexible fleet
BRANDPEOPLE SYSTEMS
* Active fleet per 31 December 2016
� Leverage of scale
� Operator profit
CORE FLEET
NORDEN – ANNUAL REPORT 2016 RESULTS | 22 Custodians of smarter global trade
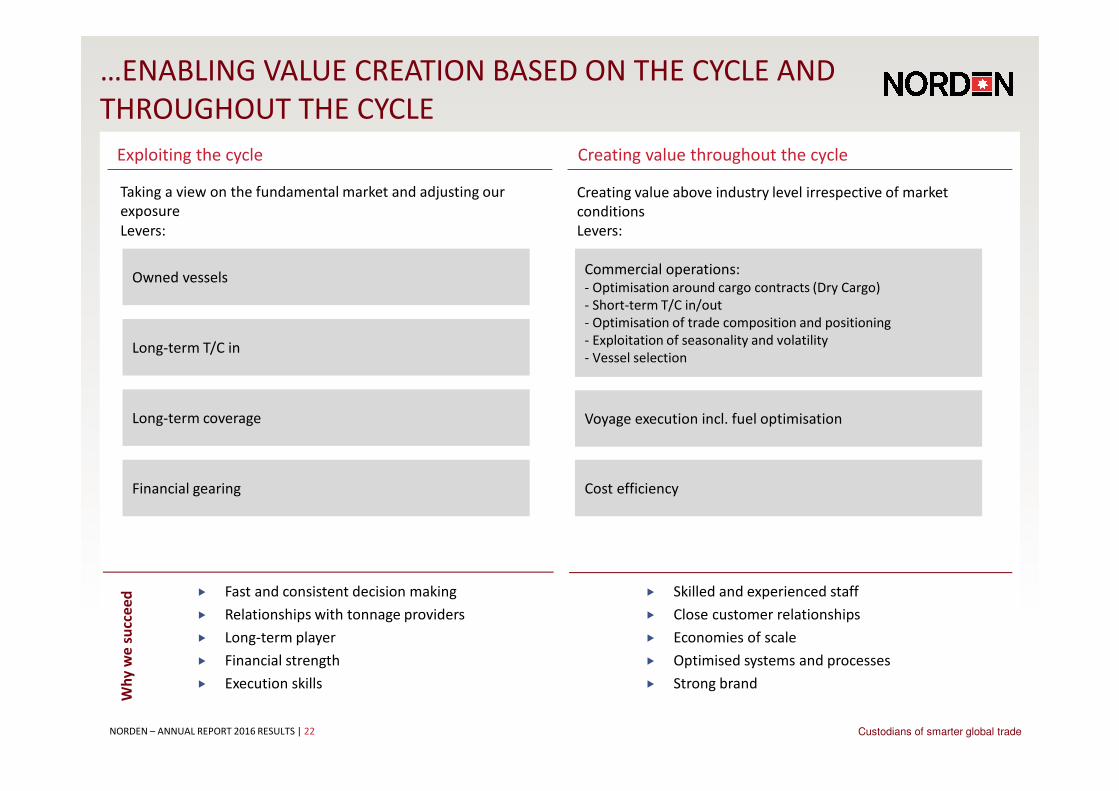
…ENABLING VALUE CREATION BASED ON THE CYCLE AND
THROUGHOUT THE CYCLE
Creating value throughout the cycle
Creating value above industry level irrespective of market
conditions
Exploiting the cycle
� Fast and consistent decision making
� Relationships with tonnage providers
� Long-term player
� Financial strength
� Execution skills
� Skilled and experienced staff
� Close customer relationships
� Economies of scale
� Optimised systems and processes
� Strong brand
Owned vessels
Long-term T/C in
Long-term coverage
Financial gearing
Levers:
Wh
y w
e s
ucc
ee
d
Commercial operations:
- Optimisation around cargo contracts (Dry Cargo)
- Short-term T/C in/out
- Optimisation of trade composition and positioning
- Exploitation of seasonality and volatility
- Vessel selection
Voyage execution incl. fuel optimisation
Cost efficiency
Levers:
Taking a view on the fundamental market and adjusting our
exposure

NORDEN – ANNUAL REPORT 2016 RESULTS | 23 Custodians of smarter global trade
OVERALL RESULTS
USD million Q4 2015 Q1 2016 Q2 2016 Q3 2016 Q4 2016 Total 2016
EBITDA - Dry Cargo -149.0 -12.5 -4.5 -1.9 -4 -24
EBITDA - Tankers 28.0 23.9 16.7 6.0 8 55
EBITDA - Group -120.0 11.4 12.2 4.1 2.9 30.6
Depreciation -197.4 -13.3 -13.8 -11.6 -10.8 -49.6
EBIT Group -368.6 -1.3 -34 -12.9 -16.3 -64.5
Result for the period -379.0 4.6 -24 -14.1 -12.1 -45.6
Adjusted result for the period -338.0 -5.3 -3.5 -11.7 -14.0 -34.6
Cash flow from operations 18.2 6.6 -16 -29 -41.3 -79.7
Net cash flow 35.2 9.2 -42.9 -23.4 -5.8 -62.9
Cash and securities 365.7 375.5 345.5 294.2 263.9 263.9
NORDEN – ANNUAL REPORT 2016 RESULTS | 24 Custodians of smarter global trade
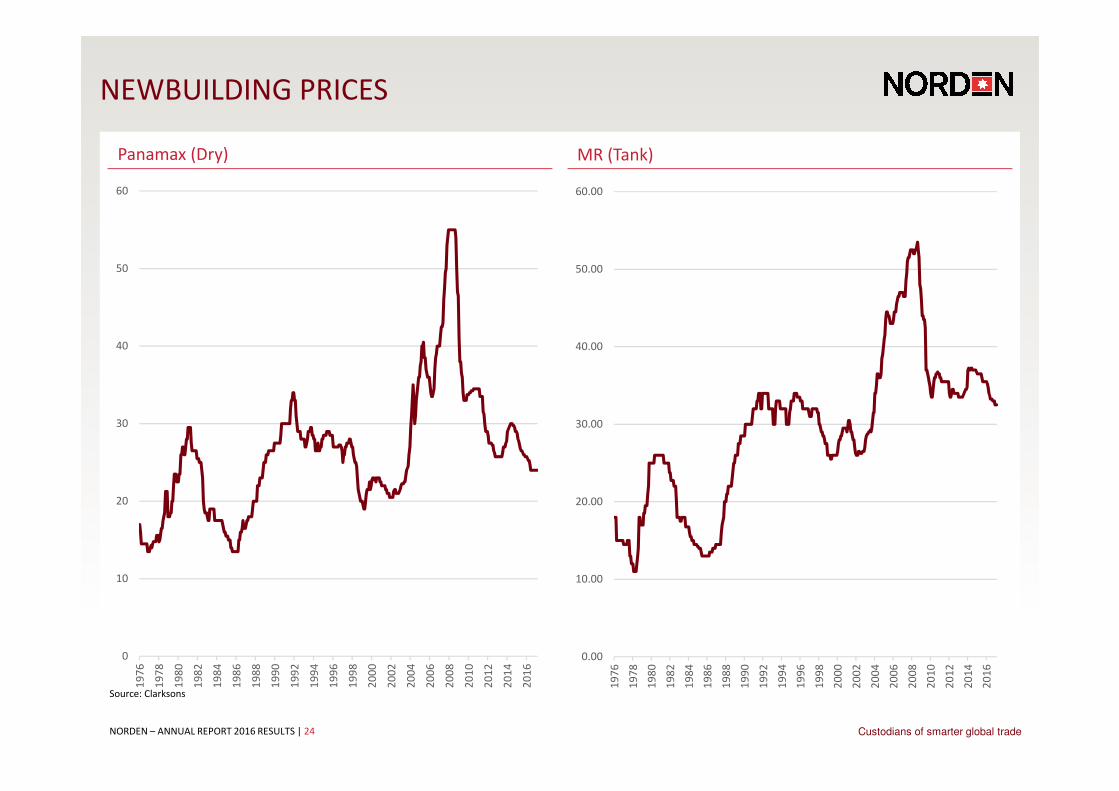
NEWBUILDING PRICES
MR (Tank)Panamax (Dry)
Source: Clarksons
0
10
20
30
40
50
60
19
76
19
78
19
80
19
82
19
84
19
86
19
88
19
90
19
92
19
94
19
96
19
98
20
00
20
02
20
04
20
06
20
08
20
10
20
12
20
14
20
16
0.00
10.00
20.00
30.00
40.00
50.00
60.00
19
76
19
78
19
80
19
82
19
84
19
86
19
88
19
90
19
92
19
94
19
96
19
98
20
00
20
02
20
04
20
06
20
08
20
10
20
12
20
14
20
16
NORDEN – ANNUAL REPORT 2016 RESULTS | 25 Custodians of smarter global trade
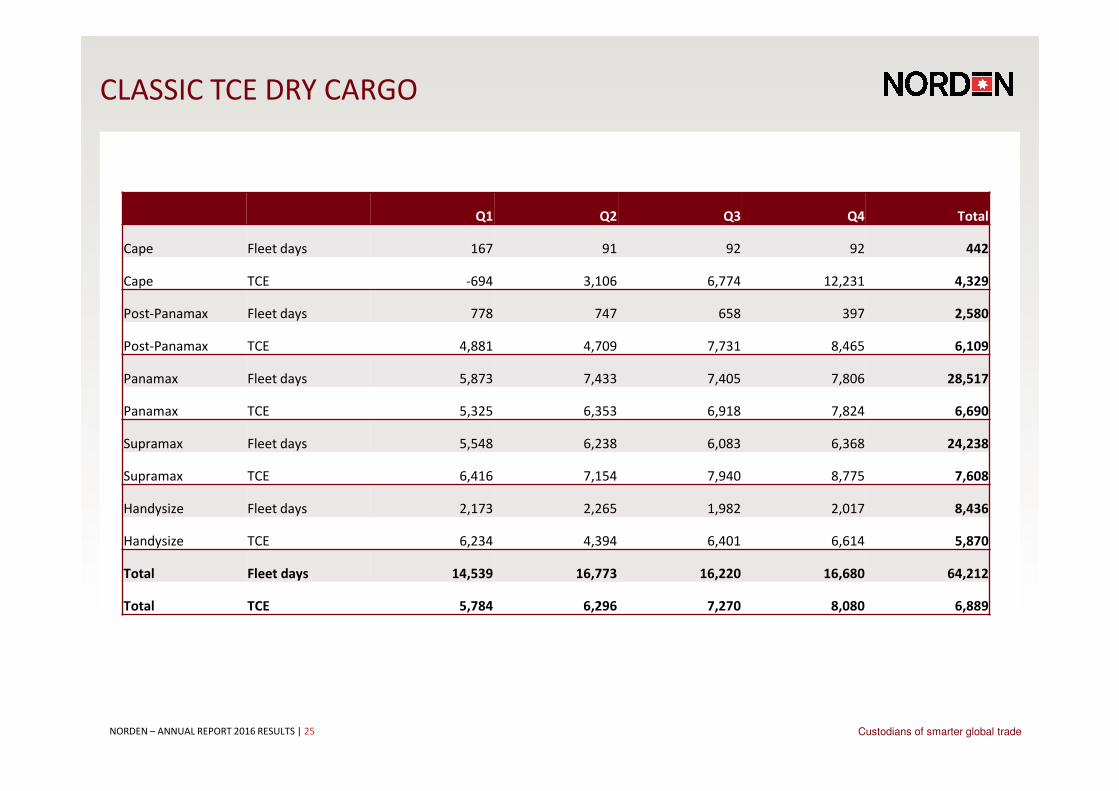
CLASSIC TCE DRY CARGO
Q1 Q2 Q3 Q4 Total
Cape Fleet days 167 91 92 92 442
Cape TCE -694 3,106 6,774 12,231 4,329
Post-Panamax Fleet days 778 747 658 397 2,580
Post-Panamax TCE 4,881 4,709 7,731 8,465 6,109
Panamax Fleet days 5,873 7,433 7,405 7,806 28,517
Panamax TCE 5,325 6,353 6,918 7,824 6,690
Supramax Fleet days 5,548 6,238 6,083 6,368 24,238
Supramax TCE 6,416 7,154 7,940 8,775 7,608
Handysize Fleet days 2,173 2,265 1,982 2,017 8,436
Handysize TCE 6,234 4,394 6,401 6,614 5,870
Total Fleet days 14,539 16,773 16,220 16,680 64,212
Total TCE 5,784 6,296 7,270 8,080 6,889
NORDEN – ANNUAL REPORT 2016 RESULTS | 26 Custodians of smarter global trade
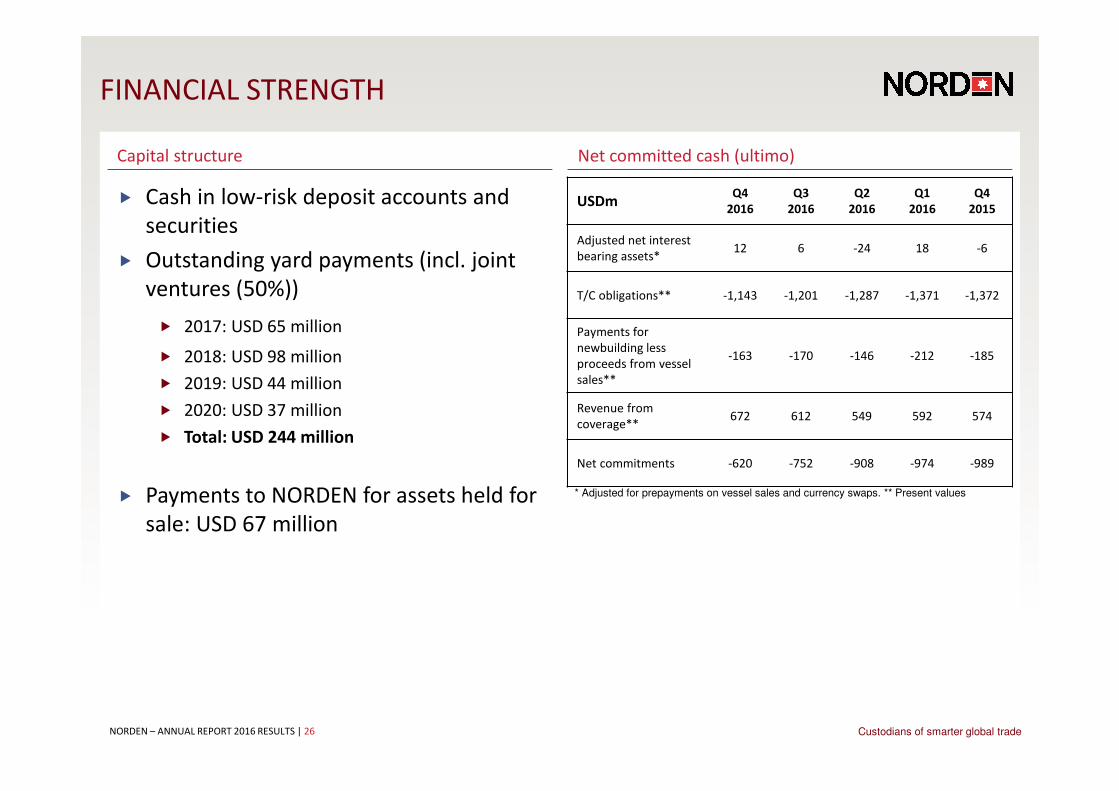
FINANCIAL STRENGTH
Net committed cash (ultimo)
� Cash in low-risk deposit accounts and
securities
� Outstanding yard payments (incl. joint
ventures (50%))
� 2017: USD 65 million
� 2018: USD 98 million
� 2019: USD 44 million
� 2020: USD 37 million
� Total: USD 244 million
� Payments to NORDEN for assets held for
sale: USD 67 million
Capital structure
USDmQ4
2016
Q3
2016
Q2
2016
Q1
2016
Q4
2015
Adjusted net interest
bearing assets*12 6 -24 18 -6
T/C obligations** -1,143 -1,201 -1,287 -1,371 -1,372
Payments for
newbuilding less
proceeds from vessel
sales**
-163 -170 -146 -212 -185
Revenue from
coverage**672 612 549 592 574
Net commitments -620 -752 -908 -974 -989
* Adjusted for prepayments on vessel sales and currency swaps. ** Present values
NORDEN – ANNUAL REPORT 2016 RESULTS | 27 Custodians of smarter global trade
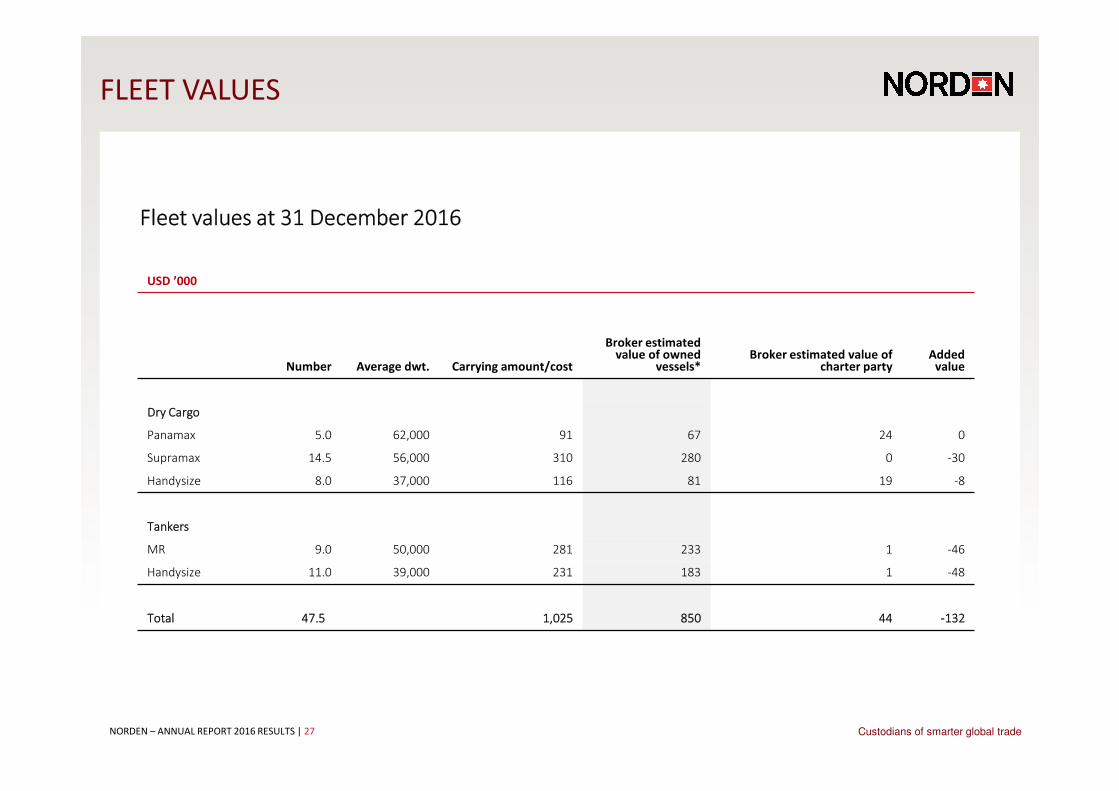
FLEET VALUES
USD ’000
Number Average dwt. Carrying amount/cost
Broker estimated value of owned
vessels*Broker estimated value of
charter partyAdded
value
Dry Cargo
Panamax 5.0 62,000 91 67 24 0
Supramax 14.5 56,000 310 280 0 -30
Handysize 8.0 37,000 116 81 19 -8
Tankers
MR 9.0 50,000 281 233 1 -46
Handysize 11.0 39,000 231 183 1 -48
Total 47.55 1,025 850 44 -132
Fleet values at 31 December 2016
NORDEN – ANNUAL REPORT 2016 RESULTS | 28 Custodians of smarter global trade
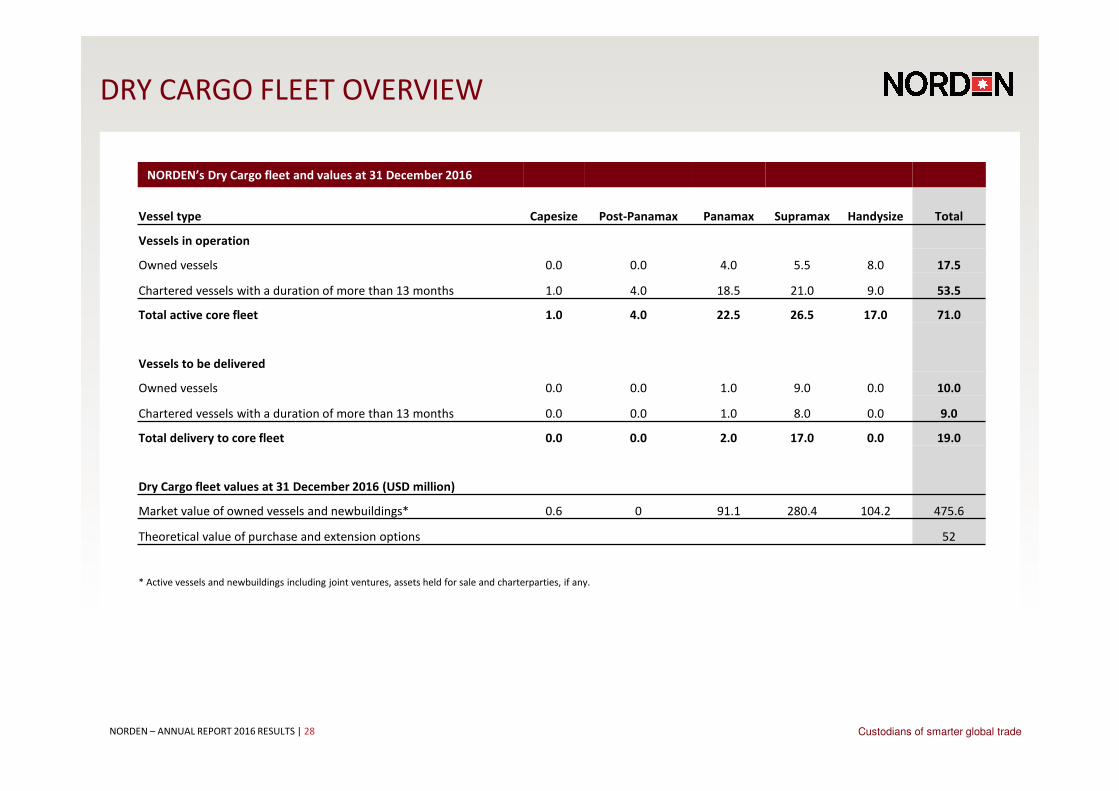
DRY CARGO FLEET OVERVIEW
NORDEN’s Dry Cargo fleet and values at 31 December 2016
Vessel type Capesize Post-Panamax Panamax Supramax Handysize Total
Vessels in operation
Owned vessels 0.0 0.0 4.0 5.5 8.0 17.5
Chartered vessels with a duration of more than 13 months 1.0 4.0 18.5 21.0 9.0 53.5
Total active core fleet 1.0 4.0 22.5 26.5 17.0 71.0
Vessels to be delivered
Owned vessels 0.0 0.0 1.0 9.0 0.0 10.0
Chartered vessels with a duration of more than 13 months 0.0 0.0 1.0 8.0 0.0 9.0
Total delivery to core fleet 0.0 0.0 2.0 17.0 0.0 19.0
Dry Cargo fleet values at 31 December 2016 (USD million)
Market value of owned vessels and newbuildings* 0.6 0 91.1 280.4 104.2 475.6
Theoretical value of purchase and extension options 52
* Active vessels and newbuildings including joint ventures, assets held for sale and charterparties, if any.

NORDEN – ANNUAL REPORT 2016 RESULTS | 29 Custodians of smarter global trade
PRODUCT TANKER FLEET OVERVIEW
NORDEN’s Tanker fleet and values at 31 December 2016
Vessel type LR1 MR Handysize Total
Vessels in operation
Owned vessels 0 9 11 20
Chartered vessels with a duration of more than 13 months 0 13 0 13
Total active core fleet 0 22 11 33
Chartered vessels with a duration of less than 13 months 0 0 4 4
Total active fleet 0 22 15 37
Vessels to be delivered
Owned vessels 0 0 0 0
Chartered vessels with a duration of more than 13 months 2 4 0 6
Total delivery to core fleet 2 4 0 6
Tanker fleet values at 30 September 2016 (USD million)
Market value of owned vessels and newbuildings* 0 235 184 418
Theoretical value of purchase and extension options 1.4
* Active vessels and newbuildings including joint ventures, assets held for sale and charter parties, if any.
NORDEN – ANNUAL REPORT 2016 RESULTS | 30 Custodians of smarter global trade
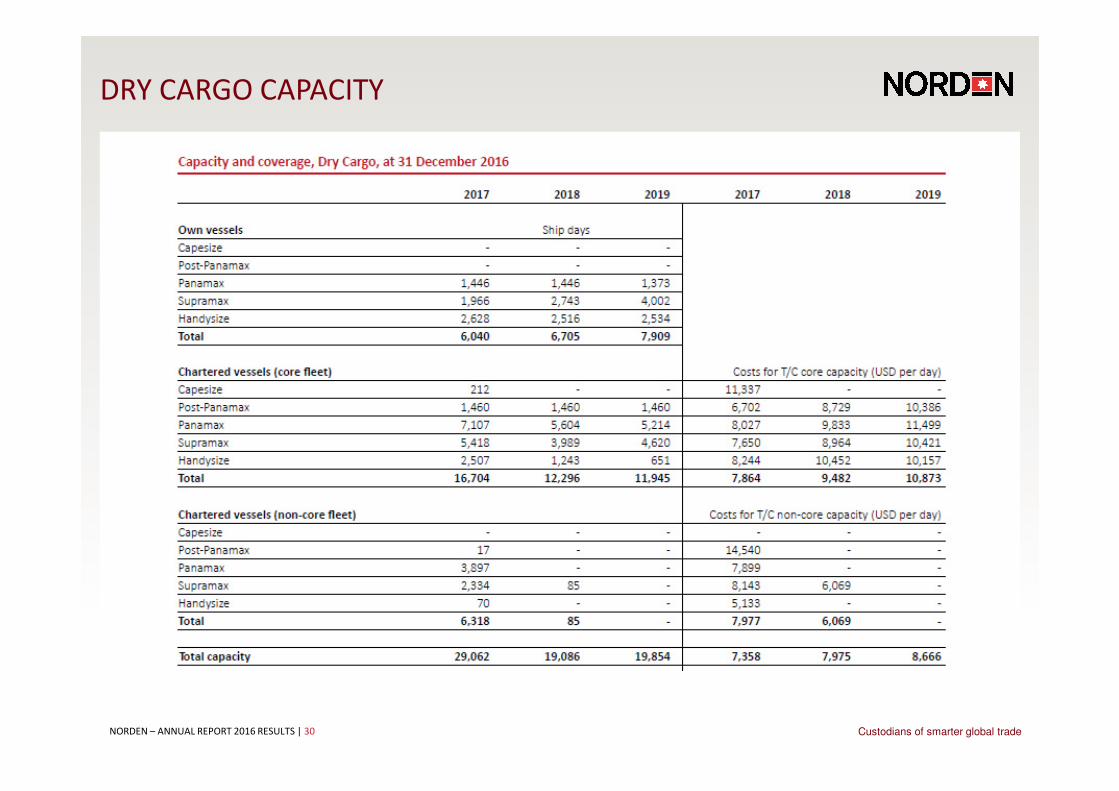
DRY CARGO CAPACITY
NORDEN – ANNUAL REPORT 2016 RESULTS | 31 Custodians of smarter global trade
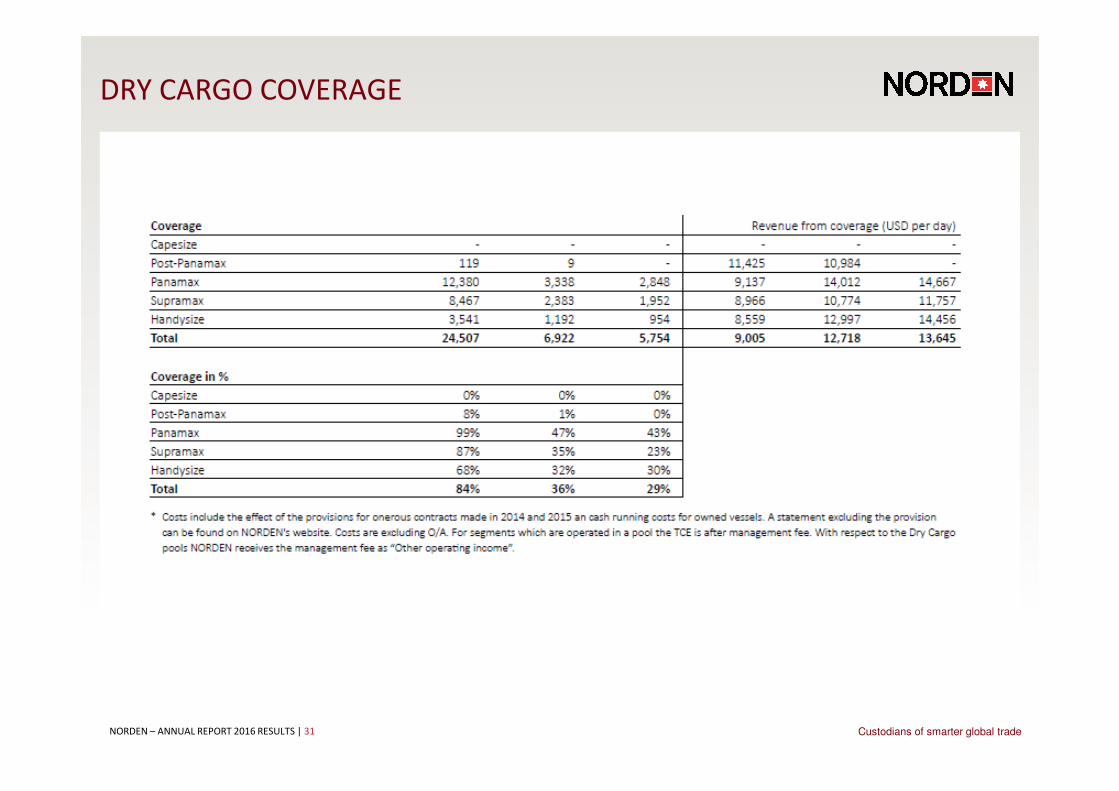
DRY CARGO COVERAGE
NORDEN – ANNUAL REPORT 2016 RESULTS | 32 Custodians of smarter global trade
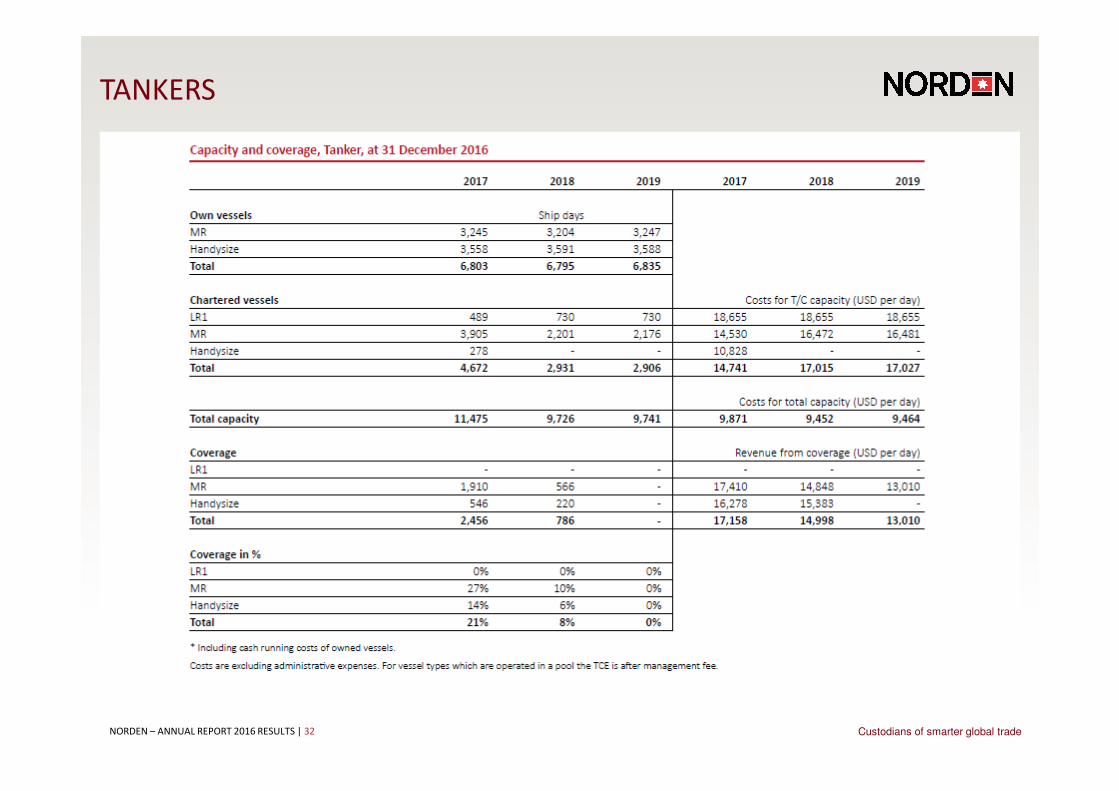
TANKERS
NORDEN – ANNUAL REPORT 2016 RESULTS | 33 Custodians of smarter global trade
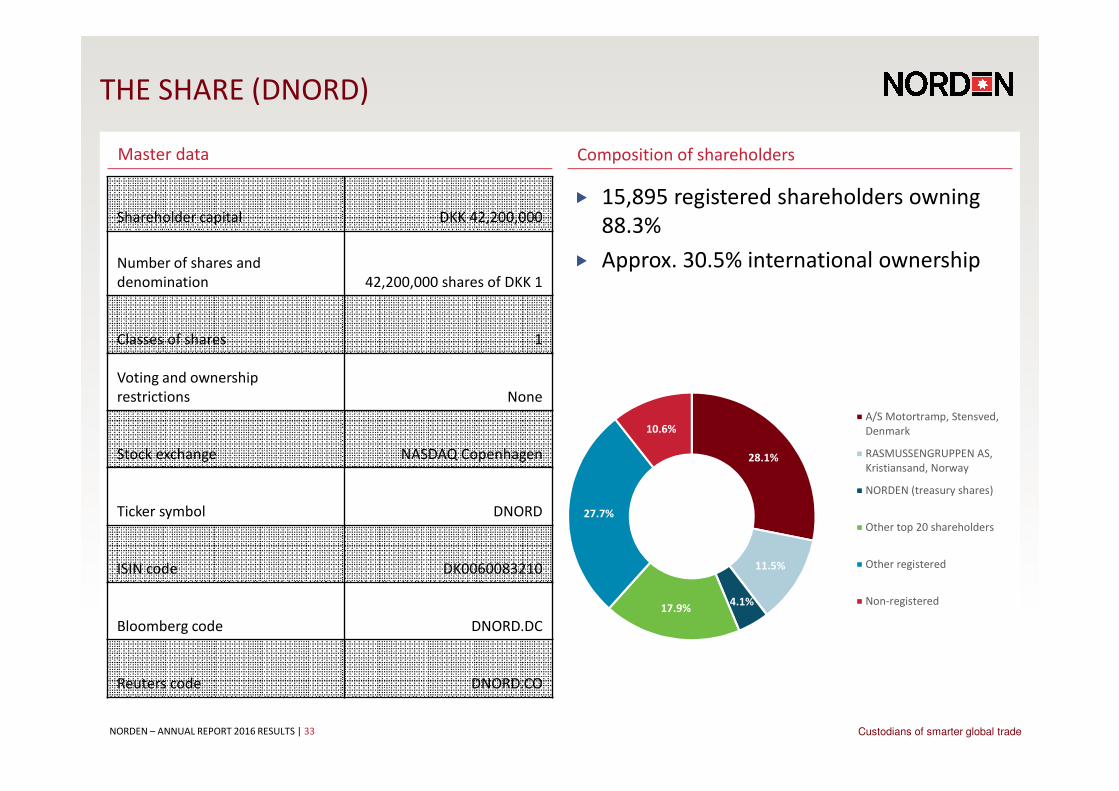
THE SHARE (DNORD)
Composition of shareholdersMaster data
Shareholder capital DKK 42,200,000
Number of shares and
denomination 42,200,000 shares of DKK 1
Classes of shares 1
Voting and ownership
restrictions None
Stock exchange NASDAQ Copenhagen
Ticker symbol DNORD
ISIN code DK0060083210
Bloomberg code DNORD.DC
Reuters code DNORD.CO
� 15,895 registered shareholders owning
88.3%
� Approx. 30.5% international ownership
28.1%
11.5%
4.1%17.9%
27.7%
10.6%A/S Motortramp, Stensved,
Denmark
RASMUSSENGRUPPEN AS,
Kristiansand, Norway
NORDEN (treasury shares)
Other top 20 shareholders
Other registered
Non-registered