Embed Size (px)
Citation preview

Presentation by Alan Johnson to
AUCKLAND UNIVERSITY OF TECHNOLOGYManukau Research Symposium
HOUSING RESEARCH FOR SOUTH AUCKLAND
To monitor changing housing conditions as part of a broader assessment of social well-being
To assess the effectiveness of existing public programmes in meeting housing needs – especially for the most vulnerable
To identify public policy and programme gaps
Possible research objectives
There is not one housing market but a series of interconnected sub-markets which are defined by tenure, class and location
Many housing statistics are reported in aggregate or in ways which advantage or interest those with power
Housing statistics which may be most useful for gaining a clear understanding of the housing position of the most vulnerable are seldom available
This makes informed and balanced policy debate difficult
Some complications
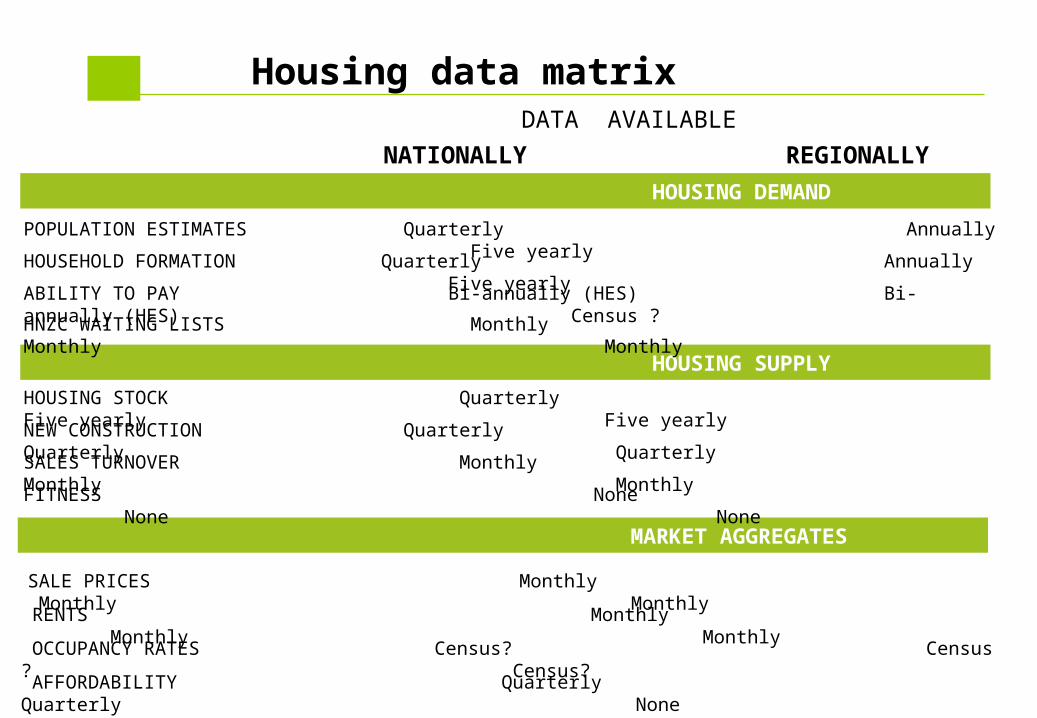
POPULATION ESTIMATES Quarterly Annually Five yearly
Housing data matrix
NATIONALLY REGIONALLY LOCALLY
HOUSING DEMAND
DATA AVAILABLE
NEW CONSTRUCTION Quarterly Quarterly Quarterly
ABILITY TO PAY Bi-annually (HES) Bi-annually (HES) Census ?
HOUSING STOCK Quarterly Five yearly Five yearly
HOUSEHOLD FORMATION Quarterly Annually Five yearly
HOUSING SUPPLY
HOUSING DEMAND
HNZC WAITING LISTS Monthly Monthly Monthly
SALES TURNOVER Monthly Monthly Monthly
MARKET AGGREGATES
SALE PRICES Monthly Monthly Monthly
RENTS Monthly Monthly Monthly
OCCUPANCY RATES Census? Census ? Census?
AFFORDABILITY Quarterly Quarterly None
FITNESS None None None
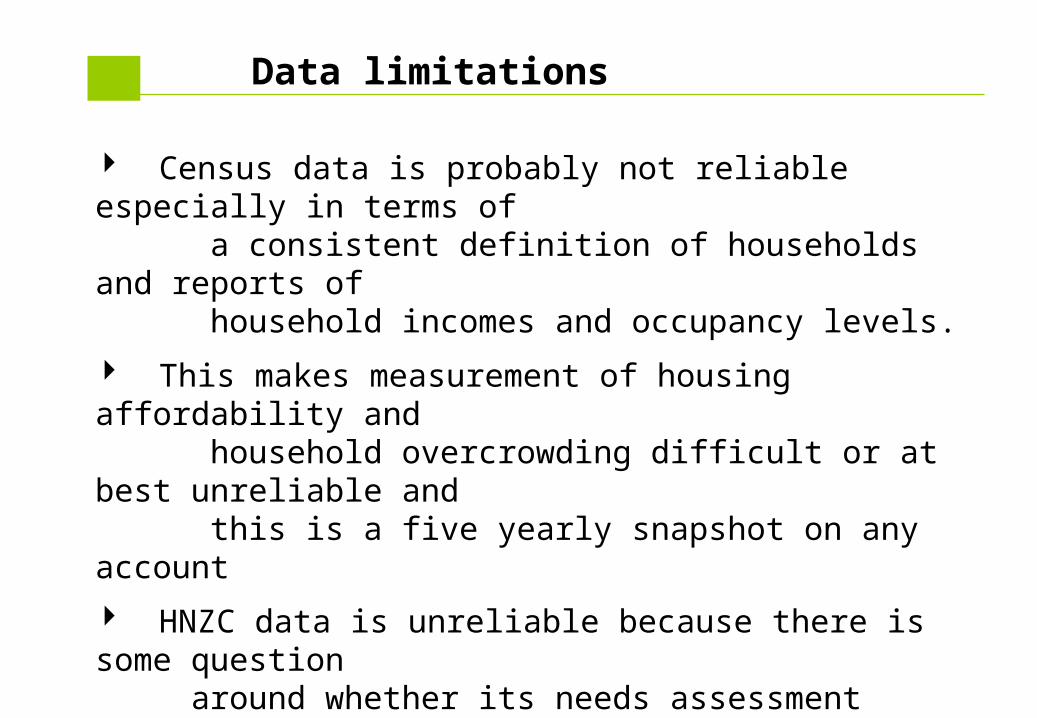
Census data is probably not reliable especially in terms of a consistent definition of households and reports of household incomes and occupancy levels.
This makes measurement of housing affordability and household overcrowding difficult or at best unreliable and this is a five yearly snapshot on any account
HNZC data is unreliable because there is some question around whether its needs assessment process is an assessment or rationing tool
Data limitations
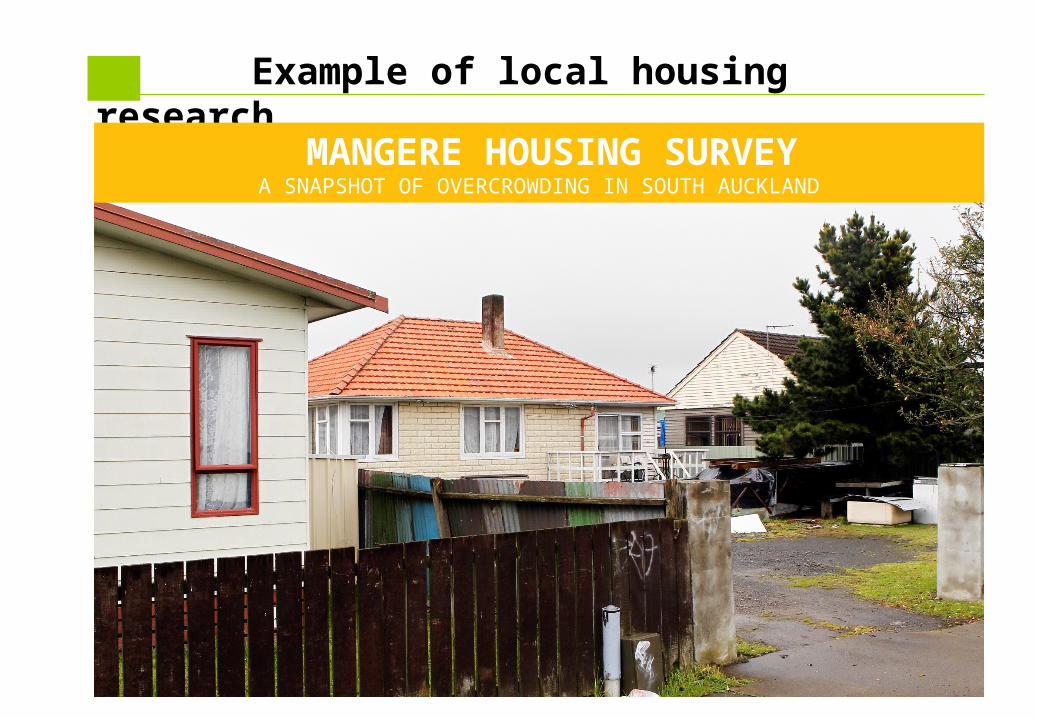
Example of local housing research
MANGERE HOUSING SURVEYA SNAPSHOT OF OVERCROWDING IN SOUTH AUCKLAND
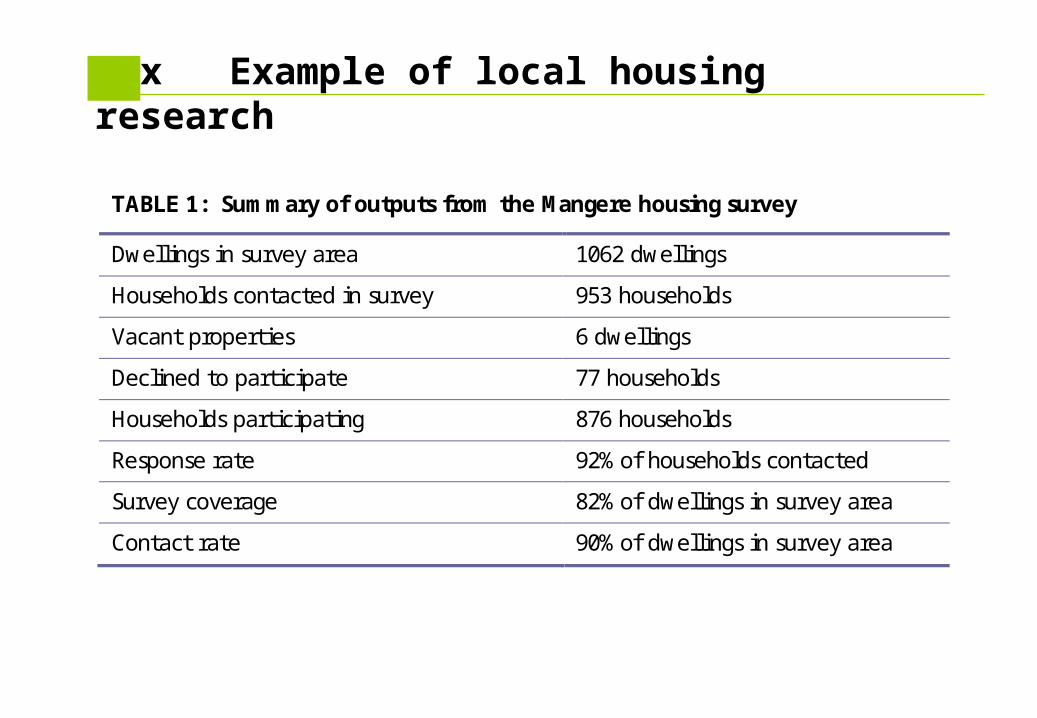
Ex Example of local housing research
TABLE 1: Summary of outputs from the Mangere housing survey
Dwellings in survey area 1062 dwellings
Households contacted in survey 953 households
Vacant properties 6 dwellings
Declined to participate 77 households
Households participating 876 households
Response rate 92% of households contacted
Survey coverage 82% of dwellings in survey area
Contact rate 90% of dwellings in survey area
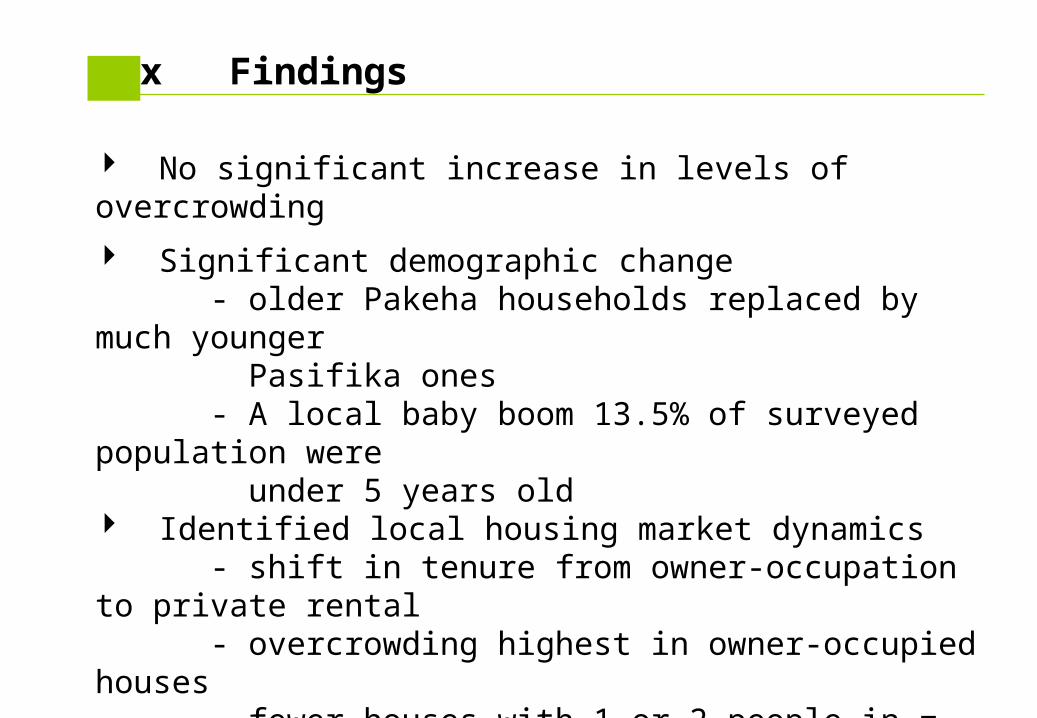
Ex Findings
No significant increase in levels of overcrowding
Significant demographic change - older Pakeha households replaced by much younger Pasifika ones - A local baby boom 13.5% of surveyed population were under 5 years old Identified local housing market dynamics - shift in tenure from owner-occupation to private rental - overcrowding highest in owner-occupied houses - fewer houses with 1 or 2 people in = better stock utilisation perhaps
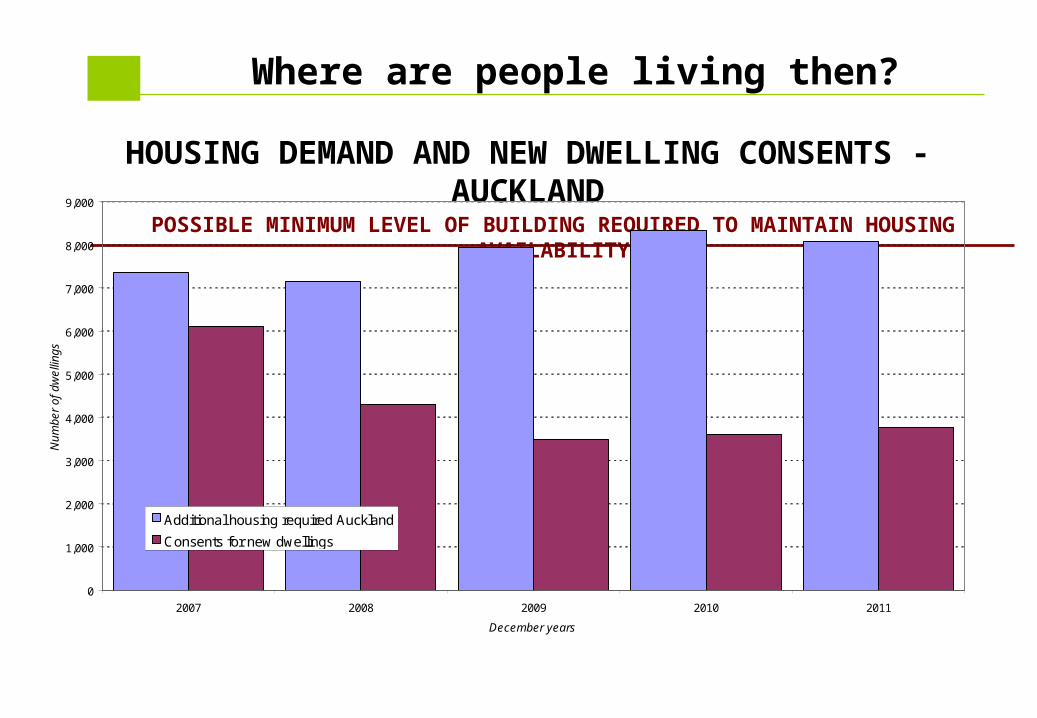
HOUSING DEMAND AND NEW DWELLING CONSENTS - AUCKLAND
Where are people living then?
POSSIBLE MINIMUM LEVEL OF BUILDING REQUIRED TO MAINTAIN HOUSING AVAILABILITY
0
1,000
2,000
3,000
4,000
5,000
6,000
7,000
8,000
9,000
2007 2008 2009 2010 2011
December years
Nu
mb
er
of
dw
elli
ng
s
Additional housing required Auckland
Consents for new dwellings
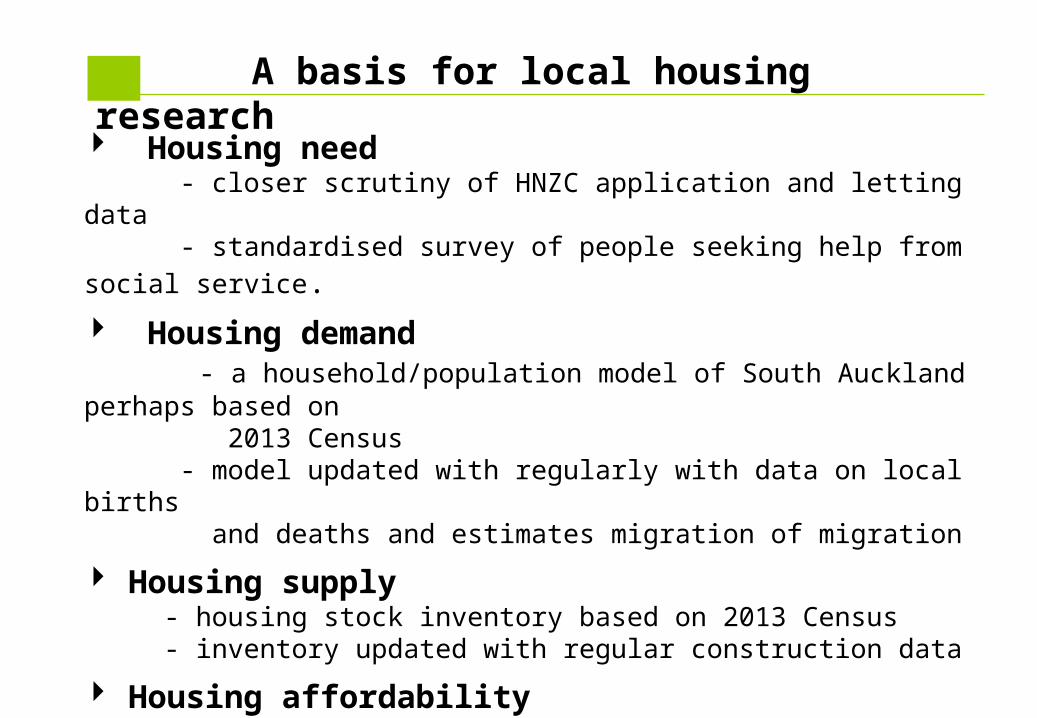
A basis for local housing research
Housing need - closer scrutiny of HNZC application and letting data
- standardised survey of people seeking help from social service.
Housing demand - a household/population model of South Auckland perhaps based on 2013 Census - model updated with regularly with data on local births and deaths and estimates migration of migration
Housing supply - housing stock inventory based on 2013 Census - inventory updated with regular construction data
Housing affordability - household income model based on 2013 Census HES HLFS and QES - rent model updated with Tenancy Bonds data