Embed Size (px)
Citation preview

Presentation by Hilde Wustenberghs
for the Benelux Society for Horticultural Science
symposium “IPM in horticulture: research for practice”
March 7, 2013
1

2 parts in this presentation:
1. What is DICUSS and how was it developed?
2. Some preconditions for bringing the tool into practice.
The indicator development was a joint effort of
• Social Sciences unit of the Institute for Agriculture and Fisheries Research
• Department of Crop Protection of Ghent University
It is currently being tested in collaboration with
• The Research Station for Fruit Growing (PCFruit)
2

Goal
To construct an indicator for sustainable crop protection to be used on farms
• not an instrument for national action plan evaluation or for sector evaluation
• farms in the broad sense: from glasshouse horticulture, over tree fruit to
arable crop production
The indicator we want to develop for sustainable crop protection needs to serve a dual
purpose:
1. Monitor the farms’ crop protection sustainability
and support decision making
2. Be fit for a social learning process
e.g. in discussion groups of fruit growers, facilitated by an advisor,
where the indicator results make up the starting point for the discussion
and farmers learn from each other and the advisor about measures for improvement
3

We set up an interactive methodology that combined a participatory approach with
desk-top research.
Results of each step feeding back to the next
Participatory process � expert driven development process !
While the researchers guaranteed the scientific soundness of the indicators, the other
experts were often more closely related to farming practice and ensured that the
indicators are adapted to the local concerns.
4

What is “sustainable crop protection” anno 2010?
1. Definition
2. What does this mean at the farm level?
What elements should farmers take into account when protecting their crops from
pests, diseases or weeds?
� 7 requirements
�
IPM principles & more!
Sustainability beyond IPM
5
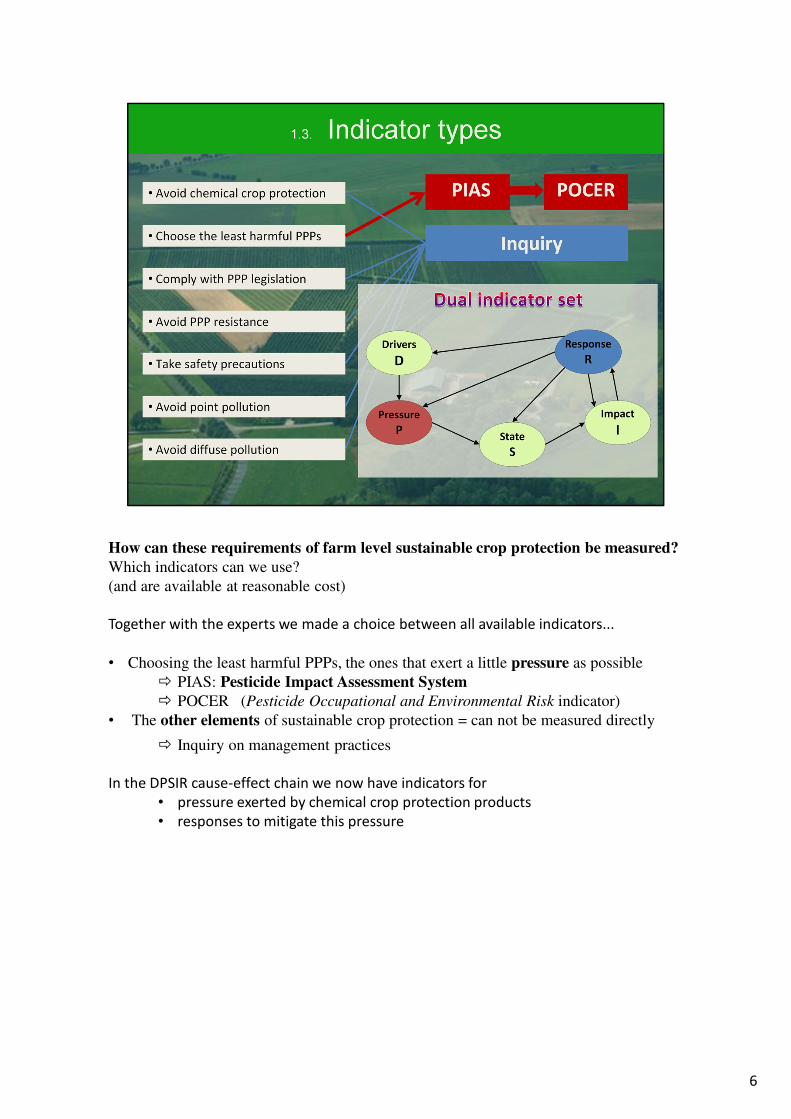
How can these requirements of farm level sustainable crop protection be measured?
Which indicators can we use?
(and are available at reasonable cost)
Together with the experts we made a choice between all available indicators...
• Choosing the least harmful PPPs, the ones that exert a little pressure as possible
� PIAS: Pesticide Impact Assessment System
� POCER (Pesticide Occupational and Environmental Risk indicator)
• The other elements of sustainable crop protection = can not be measured directly
� Inquiry on management practices
In the DPSIR cause-effect chain we now have indicators for
• pressure exerted by chemical crop protection products
• responses to mitigate this pressure
6

We thus came to a dual indicator set with
On the one hand POCER
which assesses the risk for 12 compartments
• 4 human health
• 8 environmental compartments and biota
On the other hand an inquiry
with questions on 12 themes, concerning
• knowledge, awareness and attitude
• integrated pest management
• human safety
• environmental protection
The themes were derived from the individual interviews with experts and later validated
in the focus group.
There the original inquiry was shortened by eliminating non-essential questions.
7

Additional information can be found in our paper in Pest Management Science
8

Second part: preconditions
How do we take DISCUSS off the design table and into practice?
How to take it to the person trying to protect his/her crops from diseases, pests or
weeds.
9

Database needed for the calculation of POCER
1. The Compound database contains the physico-chemical properties and toxicological
properties of the compounds, e.g. dermal absorption, degradation rate, LD50, ...
These need to be compiled from EU admission files, EFSA, literature, …
2. The Usage database contains the regional and farm level use data
• National formulation admission conditions, e.g. risk mitigation parameters
• Farm data, e.g. dose rate
Compiling this database is a time consuming effort !
But once realised, calculation of risk indicators becomes relatively simple.
10

In this stage our most important stakeholders are involved
Cognitive interviews:
Test whether
• Questions and instructions are unambiguous: are they understood/interpreted in
the same way by all test persons? Is any information missing?
• Are questions and statements clear? E.g. Are questions to lengthy? Are technical
terms understood sufficiently? e.g. “surface water”
• Recall problems: the respondent may not remember the information asked for.
He/she might have computation problems.
e.g. Share of fields adjacent to surface water ↔ sensitive to erosion
e.g. Time period = several years (not just last year)
• Sensitive content & socially acceptable response should be avoided
• Response categories: mismatch with the question, missing eligible response
categories, ...
• Technical issues are not strictly the subject of cognitive interviews, but in this case
some did come up!
Willis (2005) Cognitive interviewing. A tool for improving questionnaire design.
11

The initial implementation phase is very important:
Not only do farmers learn about the sustainability of their practices and means for
improvement, the indicator designers also learn about refining the tools and about
appropriately bringing them into practice.
12

The graphs show the answers of 10 random fruit growers on a scale from 1 to 5
Example 1: DRIFT
1. Statement concerning awareness of pollution by drift:
1 = don’t agree at all ↔ 5 = fully agree
2. Questions concerning actions taken for drift mitigation:
1 = never ↔ 5 = always
In this example there clearly is a good correlation between both.
This was probaly caused by PCFruit’s “away with the cloud” campaign.
13

Example 2: POINT POLLUTION
1. Statmentents
1. common statement on tank spillage
2. more provacative
2. Actions taken concerning mitigation
� Relation between both is far less clear!
14

In a 2012 study by ILVO and PCFruit “fruit farm sustainability” was defined by the
themes shown
� Crop protection is only one aspect of farm sustainability !
� DISCUSS / crop protection sustainability is preferably seen as part of an integrated
farm sustainability assessment
15

Group interaction with peers fosters learning about the sustainability of farming
practices and more sustainable alternatives.
In such a group setting knowledge can be acquired, but also changes in attitude, norms,
perceptions and behaviours can take place.
Indicators are believed to have the capacity to support this social learning process.
As opposed to
• INDIVIDUAL ASSESSMENT: the advantages of group discussion are lost, no social learning
can take place and all the burden of knowledge transfer is put on the advisor, as no
peers are present to exchange ideas with.
• LARGE GROUP ASSESSMENT: interpretation of the indicators and learning about
alternatives are likely to suffer, as again the advantages of group discussion and
advisor coaching are lost. After all, contact between the advisor and group members
decreases with increasing group sizes, contact between peers is often insular and
group discussions are often dominated by few.
Advisor also needs moderating skills!
16

17