Embed Size (px)
Citation preview

EJSCREEN EPA’s Environmental Justice Screening Tool
EJSCREENEPA’S ENVIRONMENTAL
SCREENING TOOL
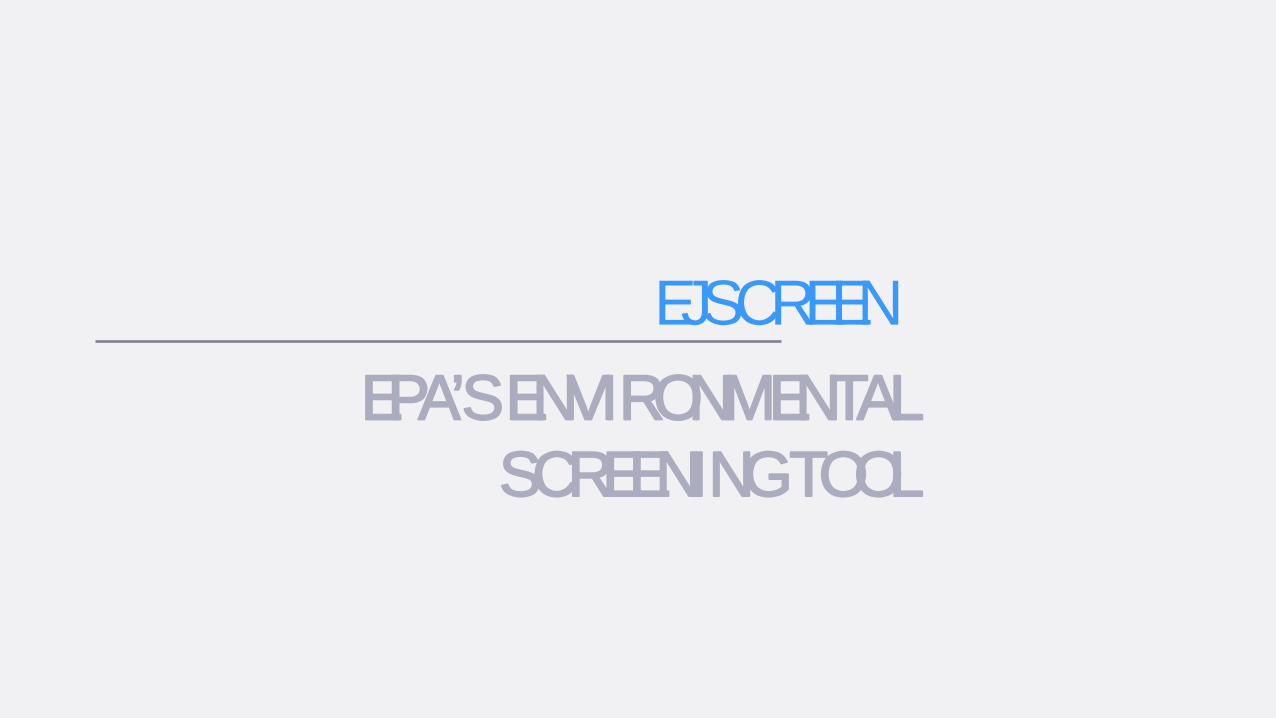
EJSCREENKey Features
page07
Combine demographic and environmental data to highlight vulnerable/susceptible populations
EJ Indexes
from most recent U.S. Census Bureau American Community Survey (ACS).
Annually Updated Data
Standard printable reports, maps, and bar graphs
Accessible and Intuitive
Census block group and tracts for units of analysis
High Resolution Data
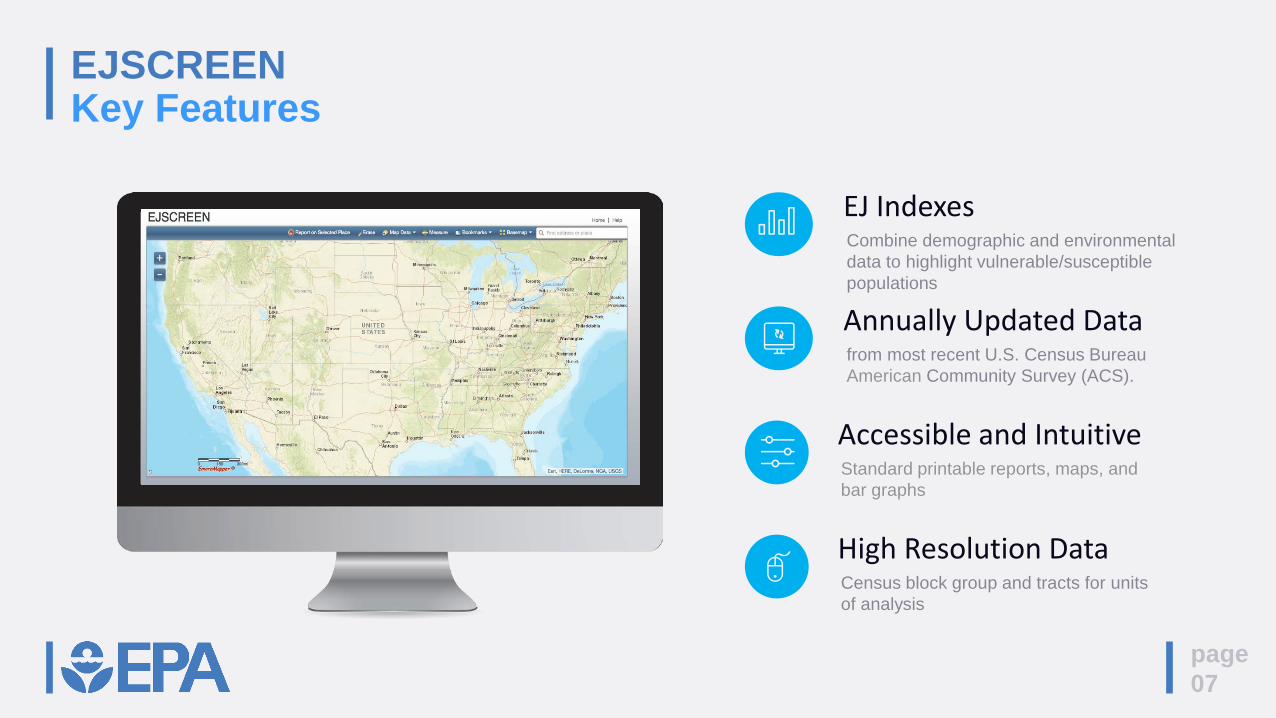
AboutVulnerability
page04
social determinants
How we…are borngrowlivelearnworkplay
distribution factorsRace
Ethnicity
Social Standing
Income
Education
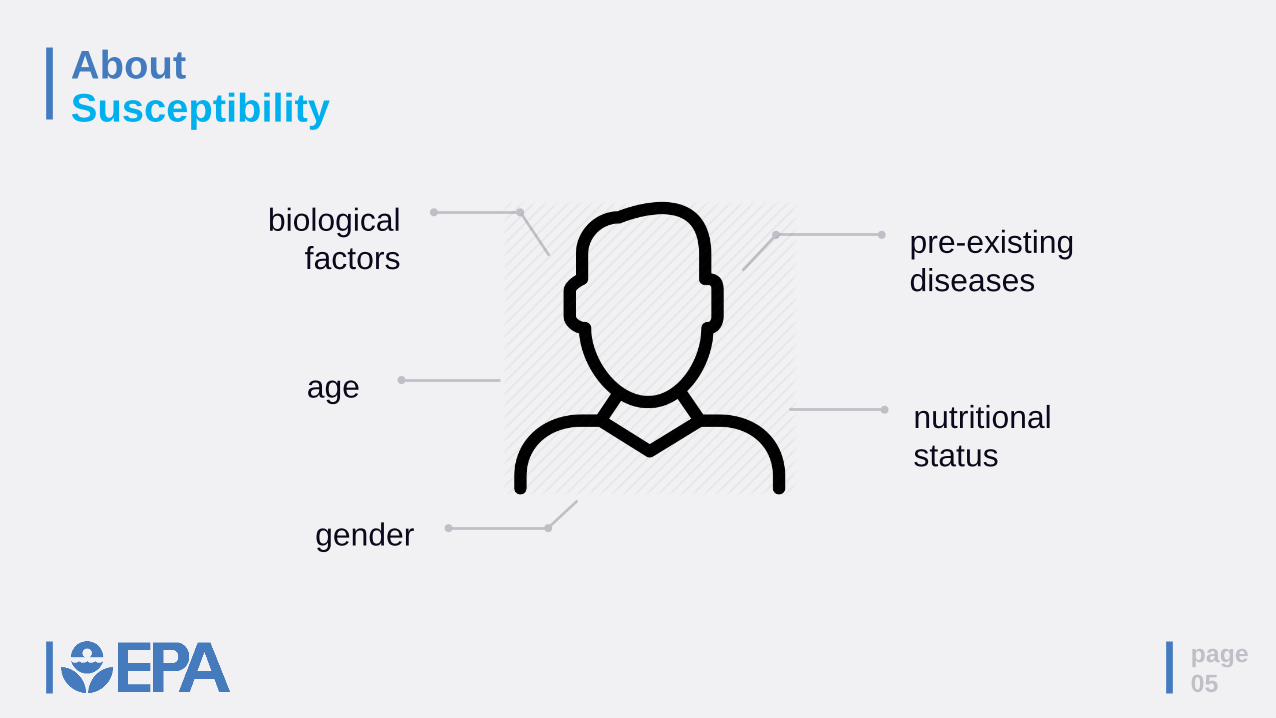
AboutSusceptibility
page05
nutritional status
age
biological factors
gender
pre-existing diseases
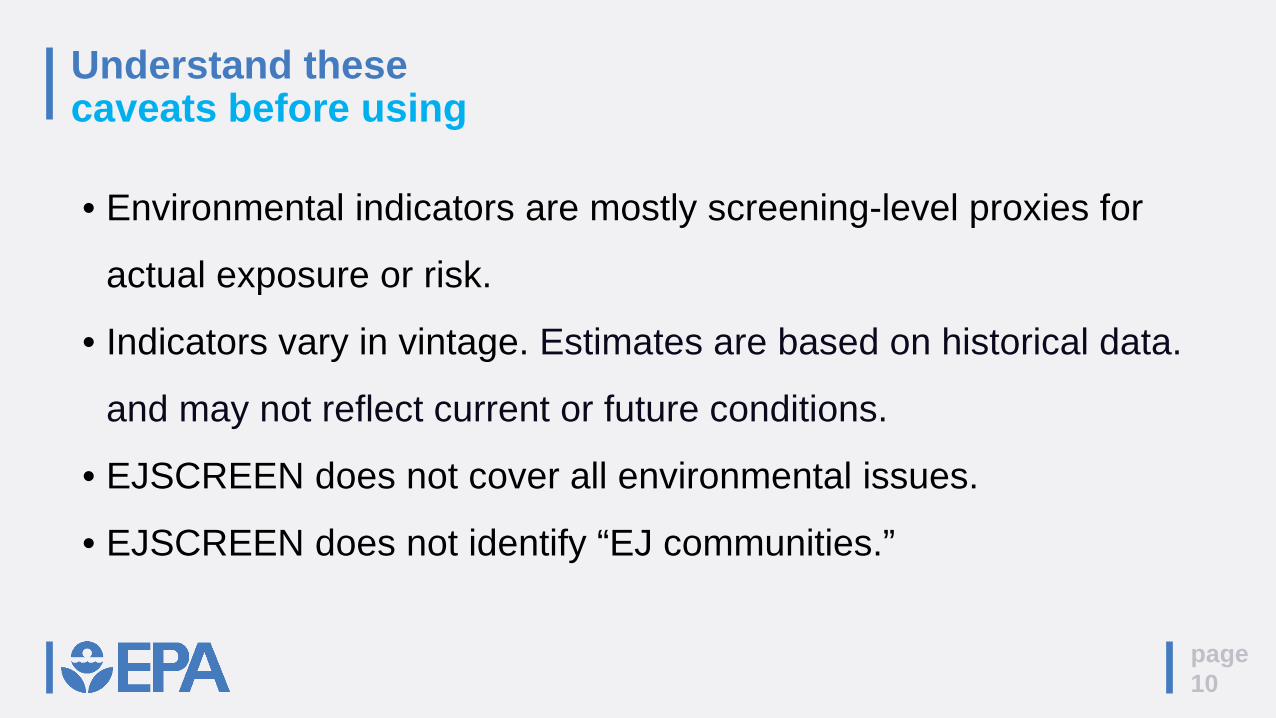
Understand these caveats before using
page10
• Environmental indicators are mostly screening-level proxies for
actual exposure or risk.
• Indicators vary in vintage. Estimates are based on historical data.
and may not reflect current or future conditions.
• EJSCREEN does not cover all environmental issues.
• EJSCREEN does not identify “EJ communities.”
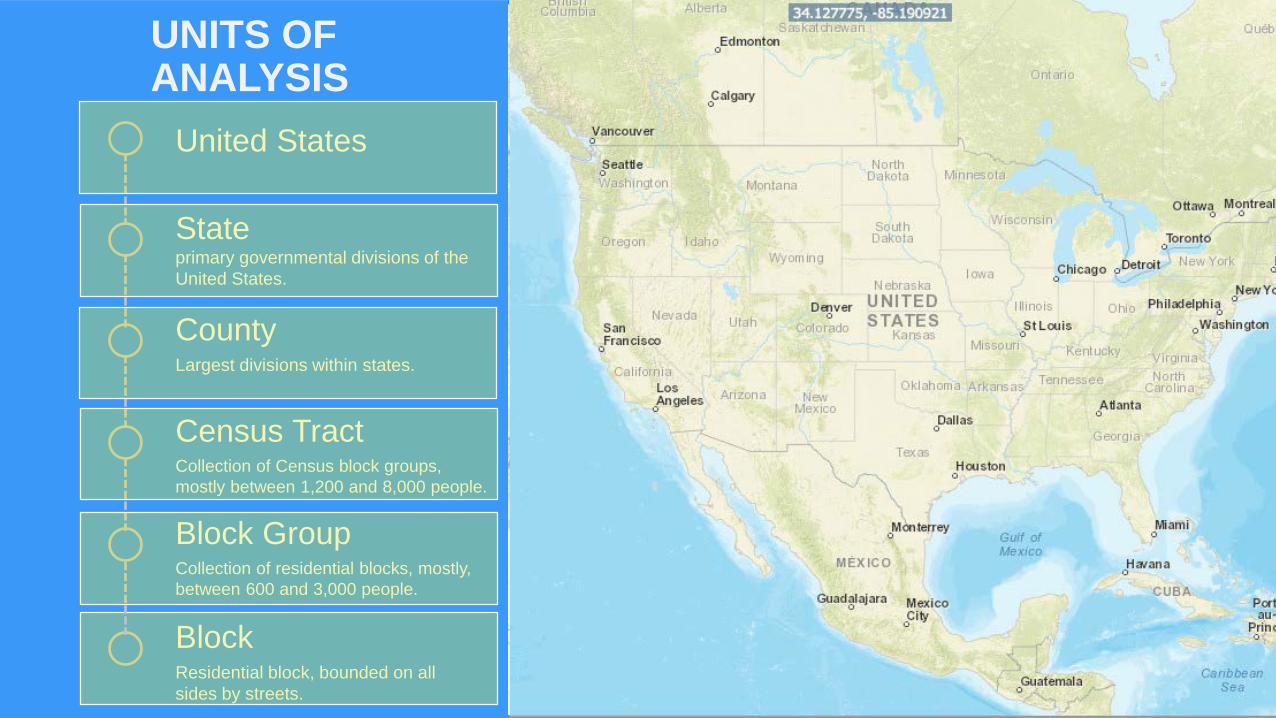
UNITS OF ANALYSIS
United States
Stateprimary governmental divisions of the United States.
CountyLargest divisions within states.
Census TractCollection of Census block groups, mostly between 1,200 and 8,000 people.
Block GroupCollection of residential blocks, mostly, between 600 and 3,000 people.
BlockResidential block, bounded on all sides by streets.
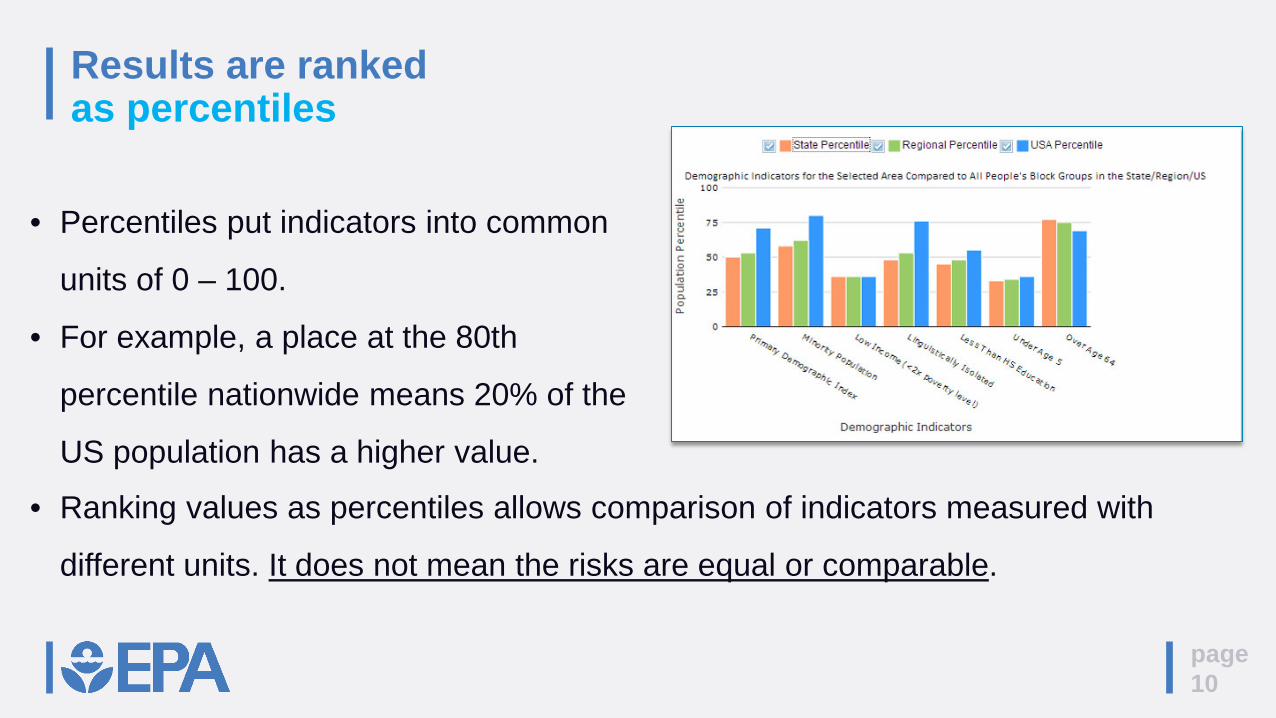
Results are rankedas percentiles
page10
• Percentiles put indicators into common
units of 0 – 100.
• For example, a place at the 80th
percentile nationwide means 20% of the
US population has a higher value.
• Ranking values as percentiles allows comparison of indicators measured with
different units. It does not mean the risks are equal or comparable.