Embed Size (px)
Citation preview

Presentation From NPES
U.S. Association for Printing, Publishing, and Converting Technologies
T H AY E R L O N G
G R E AT E R N O I D A , I N D I A
F E B R U A R Y 5 , 2 0 1 7

THE PLAN FOR SUSTAINED
GLOBAL PRINTING & IMAGING INDUSTRY
GROWTH2020
Priority Focus OneConvene, Lead, and Drive
the Global Printing & Imaging Value Chain
toward Operational Excellence
Priority Focus TwoPosition and Engage the Global Printing & Imaging Industry for Growth throughout the Value Chain

Research & Data• Market Data Programs• PRIMIR Research
Advocacy & Standards• Legislative/Regulatory Affairs Program• Standard Developing Organization (SDO)
• International Color Consortium
Business Development• International Export Assistance• Customer Development Opportunities (Meetings/Exhibitions)
Organizational Core Competencies

2009-2016 Total U.S. Market Shipments($ Millions)
$879
$479
$497
$460
$423
$368
$346
$372
$1,0
41 $1
,335
$1,6
15
$1,4
48 $1
,718
$2,0
18
$2,1
27
$1,7
65
$868
$817
$739
$700
$666
$623
$580
$562
$2,7
88
$2,6
31
$2,8
51
$2,6
08
$2,8
07
$3,0
09
$3,0
52
$2,6
99
$-
$500
$1,000
$1,500
$2,000
$2,500
$3,000
$3,500
2009 2010 2011 2012 2013 2014 2015 2016*
Printing Equipment Digital Presses Graphic Arts Supplies Total Market
*Projected Year-End

Trends & Outlook in U.S. Market
• USIndustrialProduction,abenchmarkfortheUSindustrialeconomy,transitionedtoarecoverytrendinNovemberandisprojectedtoacceleratein2017.Similarly,USGDP’sgrowthin2016willriseatafasterpacein2017,andmoderatein2018.
• Printingequipmentshipmentsposted$279millionthroughQ3in2016,comparedto$259millionthroughQ3in2015.Projectionsforyear-endsignalanincreaseof+7.5%to$372million.Thissector’spositivetrendsareexpectedtocontinuein2017,astraditionalpressmanufacturersformsuccessfulalliancesandpartnershipstointegratedigitalfeaturesintotheirequipment.
• Conversely,graphicartssuppliesshipmentsareprojectedtoposta-3.1%declineforyear-endto$562million,comparedto$580millionat2015year-end.Digitalcolorpressesshipmentsaresimilarlyexperiencingacyclicalcontractionin2016,andareprojectedtopostayear-on-yeardeclineof-17%to$1.765B.
• DespiteweaknessinsomeU.S.keysectors,theconsumersideoftheeconomyisstillfiringstrongly.Privatesectoremploymentisup2.0%year-over-year,wagesareup2.4%leadingtorisingpurchasingpower,asevidentingrowingUSretailsales.SolidconsumertrendsandgrowthfortheUSeconomyareprojectedtocontinuein2017.

Worldwide Market for Print 2.0: Global Opportunities in Packaging (2011-2020)
Thayer LongGreater Noida, IndiaFebruary 5, 2017
An Economist Intelligence Unit studyfor NPES PRIMIR & VDMA

77
Background on the Worldwide Market for Print
In 2012, the Economist Intelligence Unit (EIU) published the first edition of the Worldwide Market for Print (WWMP 1.0), a study that sized the entire printing market for 51 countries from 2007 through 2017. Leveraging on the findings of WWMP 1.0 and focusing the study on one key segment, in 2016, the EIU published the first part of the second edition of the Worldwide Market for Print (WWMP 2.0), which included the print packaging market in 26 countries.
§ 51 countries§ 2007-2011 historical estimates§ 2012-2017 forecasts§ Market sizing of the entire printing
market§ Five categories within printing
market: print products, substrates, inks, equipment, and consumables.
WWMP 1.0§ 26 countries§ 2011-2015 historical estimates§ 2016-2020 forecasts§ Part 1 is focused on the market
sizing of the print packaging market*§ Five categories within print
packaging market: flexible, labels & tags, folding carton, corrugated, and others.
* Part 2 of WWMP 2.0 will size the market of commercial print and publishing (to be completed in 2017).
WWMP 2.0

88
WWMP 2.0 Methodology
To develop the market sizing for the print packaging market segments, the EIUundertook a two-phase approach, first estimating the historical market sizes (2011-2015), then forecasting the market sizes over the next five years (2016-2020)
Phase 1Historical market
sizes (2011-2015)
Phase 2Forecast market
sizes (2016-2020)
EIU estimated historical market sizes using a foundationcountry approach, where detailed bottom-up estimatesare developed for a select set of countries, and theneconometric models, combined with validation checks,are used to extrapolate these results across theremaining countries in the group.
EIU developed forecast market sizes for the 26 countries,using the historical estimates to identify the bestpredictive drivers and indicators. The EIU developedeconometric forecast models based on these drivers, toforecast the market size development by segment overthe period 2016-2020.

99
The print packaging market represents a bright spot of steady, positive growth in the context of uncertainty surrounding the outlook for other segments of the print industry
The print packaging market
§ Demand for print packaging will continue to grow robustly, underpinned by continued economic growth, development, and positive demographic shifts.
§ Print packaging globally will continue to grow at an average annual rate of 5.2% in 2016-20, just below the 5.3% rate over 2011-2015, reaching $286bn by 2020.
§ Emerging markets are catching up to the developed markets.
§ The industry will remain fragmented, in spite of continued consolidation.
§ Advances in technology, intelligent packaging, and the continued rise of sustainability are additional trends that will take shape in the industry in the coming years.
231 236 241 249 242 245 250 260 271 286
4.5%
5.0%
5.5%
6.0%
6.5%
0
50
100
150
200
250
300
2011 2012 2013 2014 2015 2016 2017 2018 2019 2020
Bill
ions
Market size in US$ (left scale)Growth in US$ terms (right scale)
Note: Total growth corresponds to average growth in local currency terms of all 26 countries in this study.Source: EIU.
Forecast
Total print packaging size and growth, 2011-20 in US$

1010
§ Corrugated print packaging has the highest share of the global print packaging market.
§ Flexible (2nd largest) and folding carton (3rd largest) have similar market shares, and often compete in the same consumer packaging market.
§ Labels & tags, primarily used in packaged foods and consumer goods, has a market share of 12%.
§ The two largest print packaging markets in our study, the US and China, together account for 60% of the total print packaging market in our study.
§ The global print packaging market is concentrated, with the top 5 markets accounting for 78% of the total market.
The print packaging market grew from $231.2bn in 2011, to $242.2bn in 2015. Corrugated print packaging has remained the largest print packaging segment
The current market
Flexible25.0%
Labels & tags11.8%
Folding carton20.3%
Corrugated36.2%
Other6.7%
Overall segment share in 2015
Note: Share of the sum for all 26 countries in this study.Source: EIU.
01020304050607080
US China Japan Germany India
Billio
ns
Top 5 print packaging markets in 2015 in US$
Flexible Labels & tags Folding carton Corrugated Other
Source: EIU.
7669
16 15 12

1111
§ Rising incomes and urbanization bolsters print packaging growth, especially for flexible and labels & tags.
§ Despite the recent slump of emerging markets, it will continue to outperform developed markets and become 41% of the global market by 2020, a leap from 33% in 2011.
§ The concentration of the print packaging industry will remain a key trend in the future.
§ China, the largest emerging market, is expected to continue to grow over the coming years gradually closing the gap to the US.
§ The highest growth in 2016-20 will come from countries in Asia-Pacific, owing to India, Indonesia and Vietnam.
§ Growing discontent with free trade has fueled populist politicians, boosting protectionist rhetoric and policies, which could raise prices and dampen consumer expenditures.
The rise of emerging markets remains the driving force behind the print packaging industry outlook, but remain cautious against currency volatility, political instability and the rise of protectionist trade policies.
The outlook
6.0% 6.2%
6.9% 7.4% 7.6%
8.5% 10.1% 10.2% 10.5%
12.4%
TurkeyMexico
PhilippinesColombia
South AfricaIran
VietnamIndonesia
NigeriaIndia
Top ten fastest growing markets in 2016-20
Note: Compound annual growth rate in local currency terms. Overall average for all 26 countries in this study.Source: EIU.
Overall average 5.2%
15.2
10.7
6.8
2.9 2.61.3 1.1 0.8 0.8 0.6
02468
10121416
Bill
ions
Dollar growth in print packaging marketfrom 2015 to 2020
Source: EIU.
1212
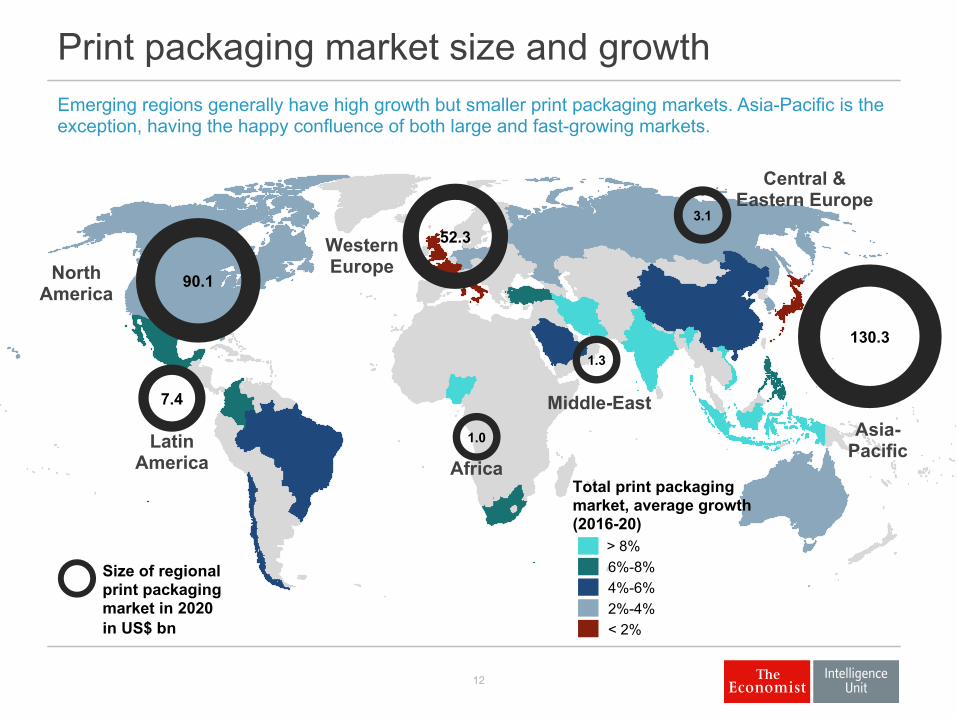
Emerging regions generally have high growth but smaller print packaging markets. Asia-Pacific is the exception, having the happy confluence of both large and fast-growing markets.
Print packaging market size and growth
90.1North America
7.4
52.33.1
1.3
1.0
130.3
Latin America
Western Europe
Central & Eastern Europe
Africa
Middle-EastAsia-
Pacific
> 8%6%-8%4%-6%2%-4%< 2%
Total print packaging market, average growth (2016-20)
Size of regional print packaging market in 2020 in US$ bn

1313
§ Five out of the ten fastest-growing print packaging markets in 2016-20 are in Asia-Pacific, with India leading the way in first position.
§ Manufacturing is shifting as labor costs (and incomes) rise and growth slows down in China.
§ Southeast Asia is gradually taking over the title of the “world’s factory”.
§ Asia-Pacific is generally a trade-oriented region.
§ Weaker global demand from US and EU in 2015-16 dampens trade and shipments.
§ Increasing debt levels of major regional economies (such as China and Japan) and the turning of credit and financial cycles poses high risk to regional growth.
Asia-Pacific is the largest regional market for print packaging, accounting for over 42% of revenues in this study, and will be the second fastest-growing region, expanding 6.7% in 2016-20.
Asia-Pacific
Country profile
3.5%
3.8%
5.9%
6.7%
6.9%
10.1%
10.2%
12.4%
3.3%
4.5%
7.9%
6.9%
7.5%
9.6%
9.5%
12.1%
Aus.
S. Kor.
China
APAC
Phil.
Viet.
Indo.
India
Asia-Pacific growth by country
2011-15 2016-20
Note: Figures presented are cumulative annual growth rates for each country in local currency terms. Region growth is the average cumulative annual growth rates of the countries in the region.Source: EIU.
IndiaDeep dive

1515
§ India is the fastest-growing print packaging market across all segments, growing on average 12.4% per year in local currency terms in 2016-20.
§ Since 2011, India went from being the 8th largest print packaging market to 5th in 2016. It will pass Germany in 2020, and it will be just $557m behind 3rd-placed Japan.
§ The flexible print packaging market in India is much larger than folding carton. However, the folding carton segment in India is still sizable because of exports, in particular luxury goods and cigarettes.
§ According to experts, the fast-moving consumer goods and food goods are the sectors that offer the best opportunities for print packaging.
India is quickly rising in the ranks of the print packaging industry, going from the 8th largest market in 2011 to 5th in 2016. By 2020 it will become the 4th largest market, passing Germany, and at this rate, shortly after the 2020 horizon, India will surpass Japan, becoming the 3rd largest market in this study.
India: Overall and key takeaways
Deep dive: India
12.4%
12.4%
12.3%
12.2%
12.6%
12.5%
12.1%
12.2%
11.9%
12.0%
12.1%
12.4%
Total
Other
Corrugated
Folding carton
Labels & tags
Flexible
2011-15 2016-20
Segment growth in India
Note: Figures presented are compound annual growth rates in local currency terms.Source: EIU.
3.75.6
1.4
2.22.6
3.93.6
5.5
0.9
1.4
0
2
4
6
8
10
12
14
16
18
20
2016 2020
Bill
ions
Flexible Labels & tags Folding carton
Corrugated Other
Print packaging market by segment in India in 2016 and 2020 (US$)
Note: Compound annual growth rate in US dollar terms.Source: EIU.
12.2
18.6
CAGR 11%

1616
India: Current dynamics and trends
Deep dive: India
India macroeconomic indicators 2015 2016 2017 2018 2019 2020Population (m) 1,311.0 1,327.0 1,343.0 1,358.0 1,374.0 1,389.0
GDP (% real change pa) 7.5 7.6 7.4 7.4 7.3 7.3
Consumer prices (% change pa; av) 4.9 5.6 5.7 5.3 4.9 4.9
Private consumption per head (US$) 941 989 1,040 1,140 1,280 1,410
Exchange rate LCU:US$ (av) 64.2 68.4 72.4 73.2 72.3 71.8
Source: EIU.
0% 2% 4% 6% 8% 10% 12% 14% 16%
0
200
400
600
800
1,000
1,200
1,400
2011 2012 2013 2014 2015 2016 2017 2018 2019 2020
Bill
ions
Flexible Labels & tags Folding carton CorrugatedOther India growth (%) Asia-Pacific growth (%)
Print packaging market size by segment in India in 2011-2020 (in Indian rupees)Forecast
Note: Regional and all countries growth is a simple average of growth rates.Source: EIU.

1717
§ The print packaging industry in India will grow strongly over 2016-20, with each component segment growing at similarly fast paces. The fastest will be labels & tags, which will grow at an annual average rate of 12.6% in 2016-20; the slowest segment will be folding carton, which will grow at an annual average rate of 12.2% in the period.
§ India is the 5th largest print packaging market in our study with revenues of $12.2bn in 2016. By 2020, revenues will reach $18.6bn, just below Japan, the 3rd largest market in our study with $19.1bn in print packaging revenues.
§ Numerous international food and consumer brands are targeting the Indian market, such as Unilever, Nestlé and Pepsi. Those international companies will bring with them more demand for more sophisticated print packaging, which will lift revenues for flexible, labels & tags and folding carton.
§ Indian consumers are not yet as eco-conscious or focused on green packaging as are consumers in mature markets. However, there is an expectation that these trends will reach India in the forecast period, which will lift further flexible print packaging revenues.
India is the fastest-growing market for all print packaging segments in this study, and it will continue to grow strongly in 2016-20.
India: Forecast and outlook
Deep dive: India
4%
8%
12%
16%
20%
2012 2013 2014 2015 2016 2017 2018 2019 2020
Flexible Labels & tags Folding carton Corrugated Other
Segment growth in India in 2012-2020
Note: Growth in local currency terms.Source: EIU.
Forecast Other7.4%
Corrugated29.6%
Folding carton21.0%
Labels & tags
11.8%
Flexible30.2%
India print packaging segments market share in 2020
Source: EIU.