Embed Size (px)
Citation preview

Adil LatifGIS AnalystWR DivisionNESPAK
List of Projects Standing Consultancy services for the
office of PCIW. Kishenganga Dam Case Arbitration Storm Water Drainage for 5 Cities of Al-
Baha Region, K.S.A. Water Sector Improvement Project (WSIP) Attabad Landslide Lake 840MW Suki Kinari Hydropower Project
Responsibilities Data Collection, Review & Analysis
Develop GIS maps showing the River catchment area, Drainage Pattern, Contours, Infrastructures and other important features as per requirement.
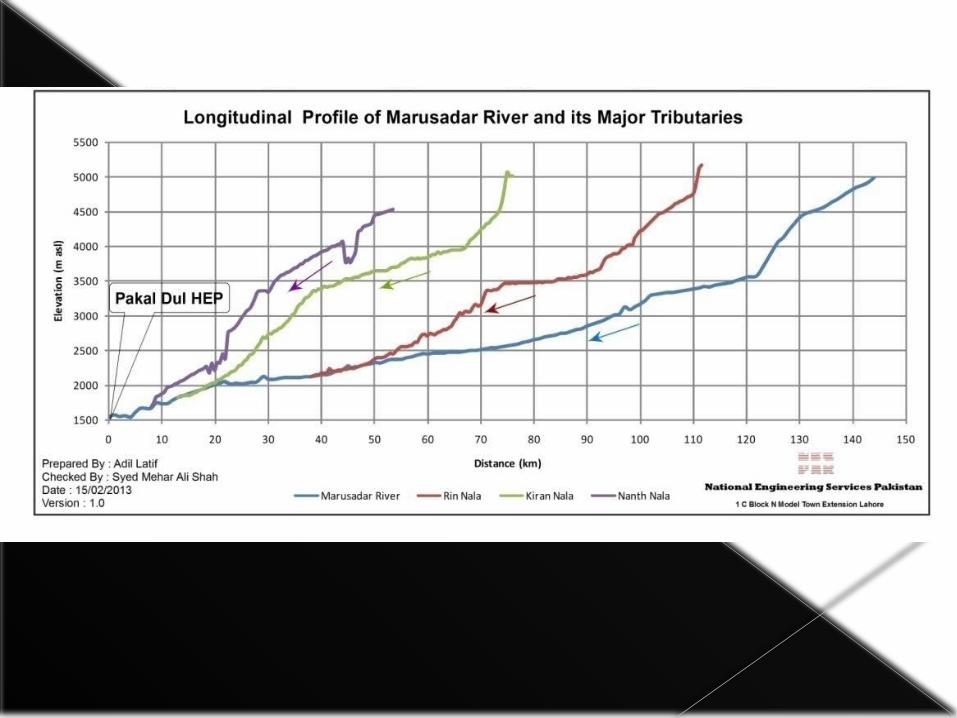
Draw the X-sections, longitudinal Profiles of main River and Major Tributaries.
GeoReferencing of GT Sheets and other relating drawings.
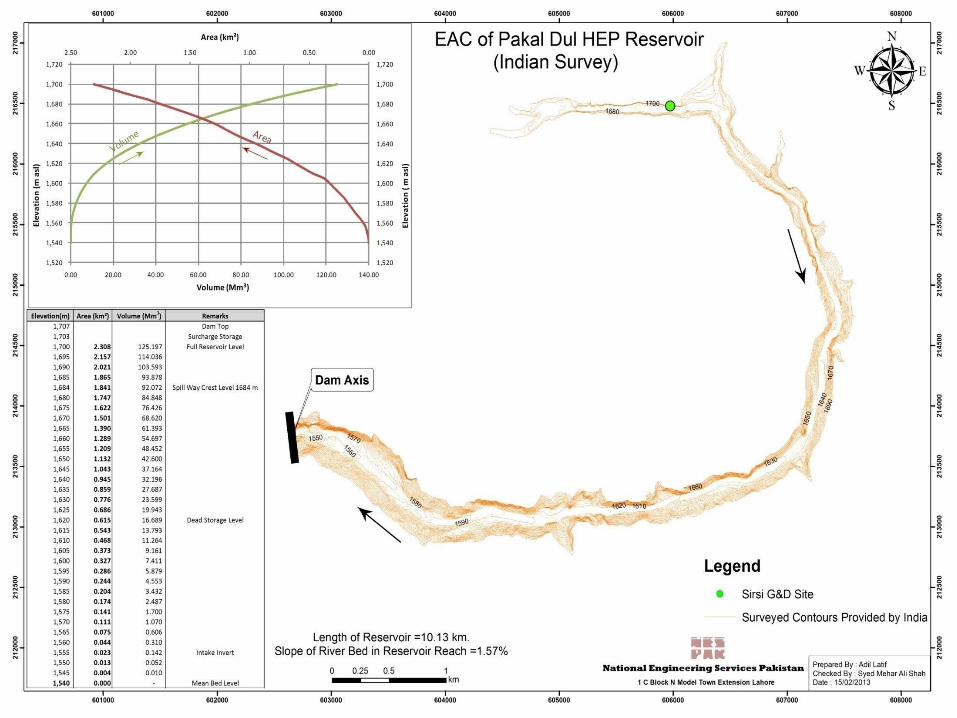
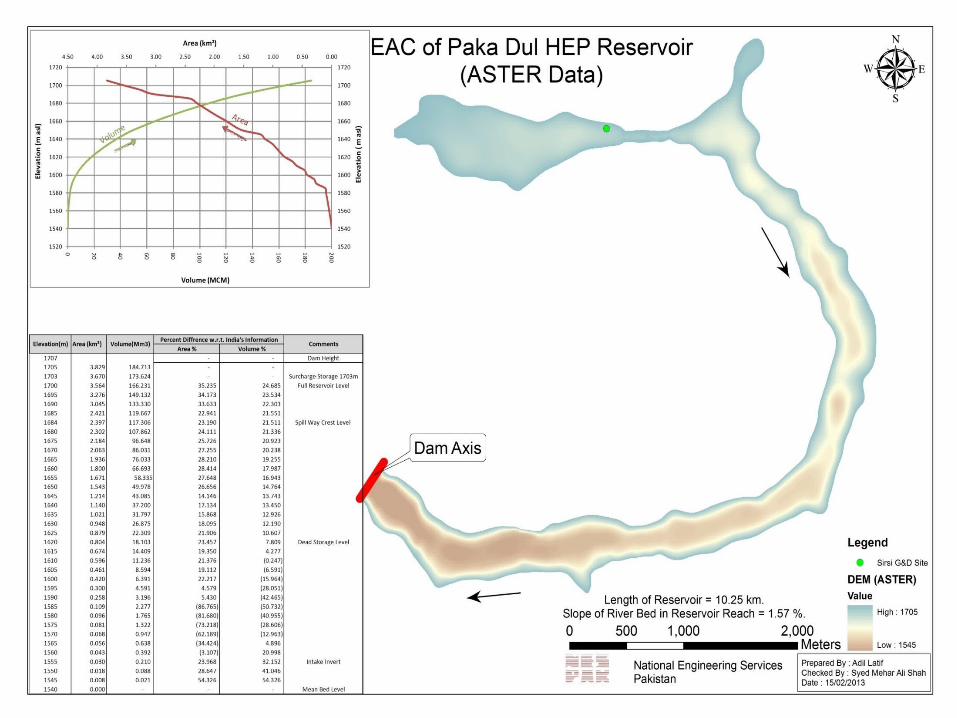
Responsibilities Calibration of DEM.(Aster & SRTM) Digitizing of contours from GT Sheet. Developed Elevation-Area-Capacity
(EAC) curve at the project sites by using digital elevation models.
Developed the Spatial Data base for Western Rivers (Indus , Jhelum & Chenab River)
Responsibilities Satellite Image Prcessing Developed Hypsometric Curves Developed Isohyetal Maps for various
Projects Calibration of DEM by observing correlation
of survey data with different data sets(GT Sheet, SRTM,ASTER).
Geo-Statistical Analysis Supervised bathymetric Survey of Attabad
Lake carried out by ISRIP.
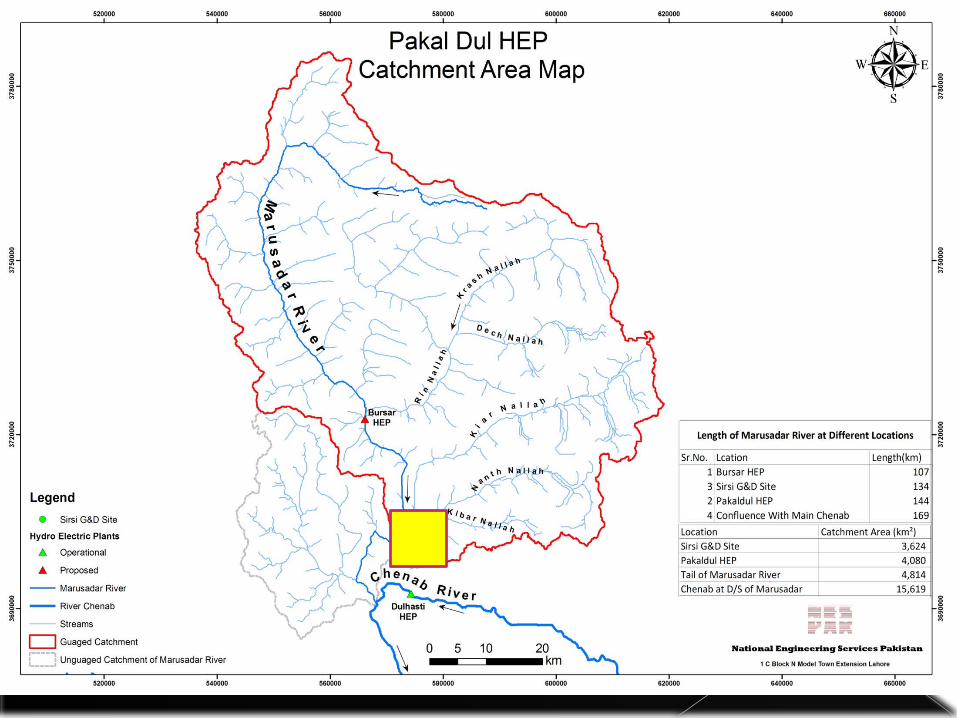
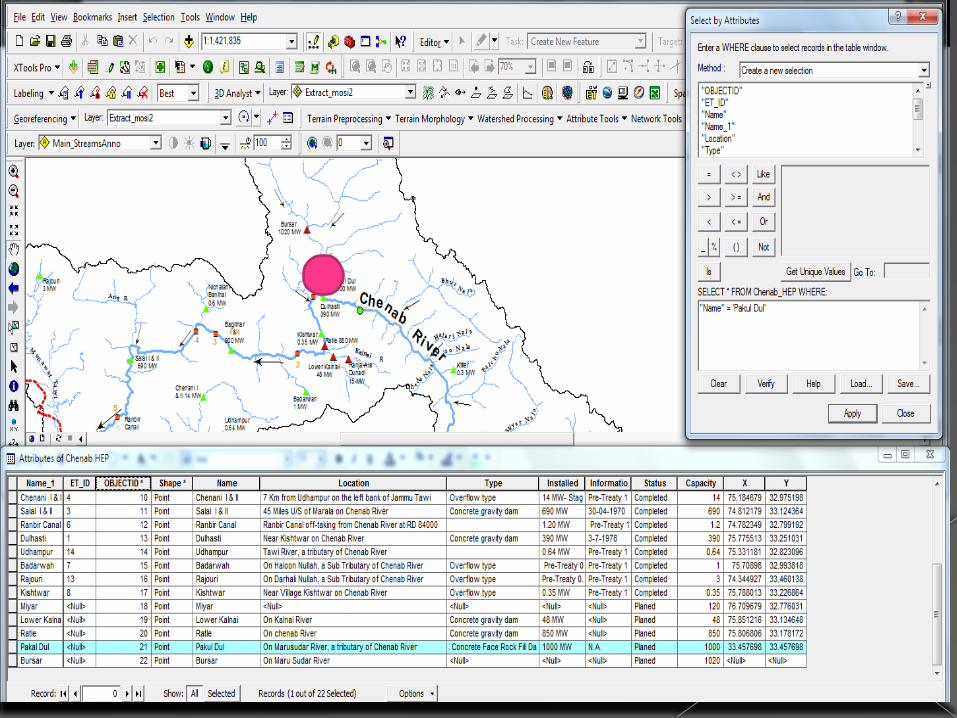
Pakaldul HEP (India)Client: PCIW
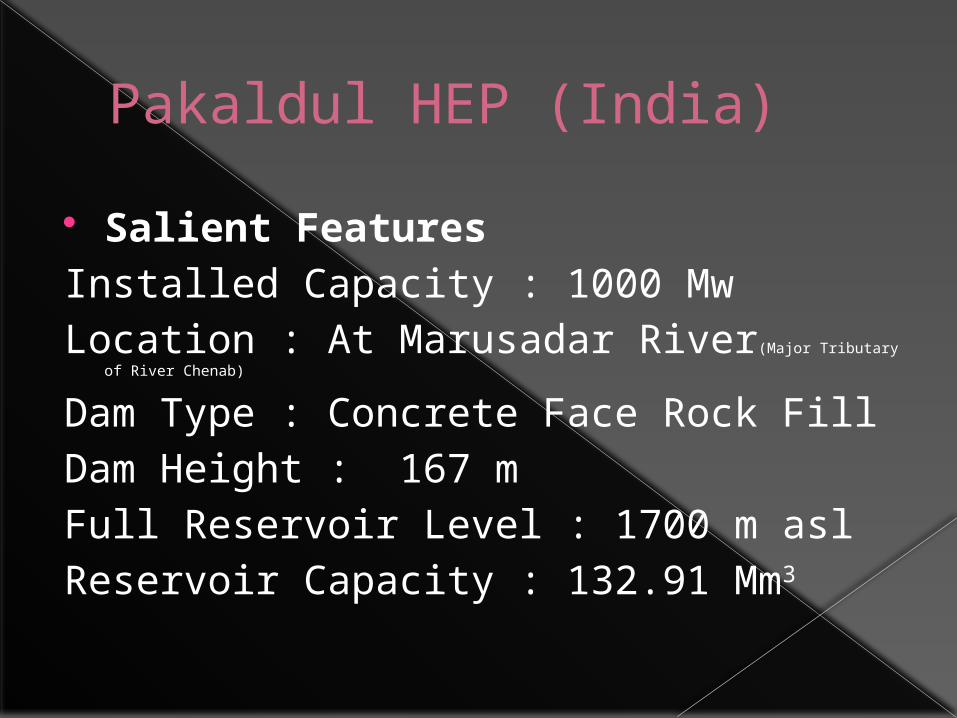
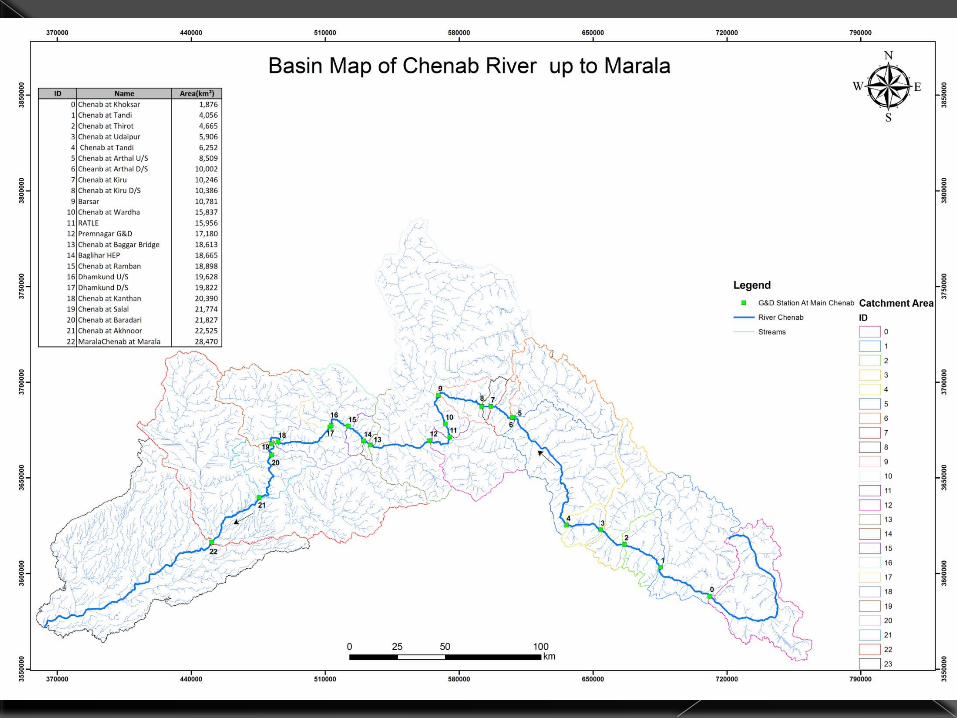
Pakaldul HEP (India) Salient FeaturesInstalled Capacity : 1000 Mw Location : At Marusadar River(Major Tributary of River Chenab)
Dam Type : Concrete Face Rock FillDam Height : 167 mFull Reservoir Level : 1700 m aslReservoir Capacity : 132.91 Mm3
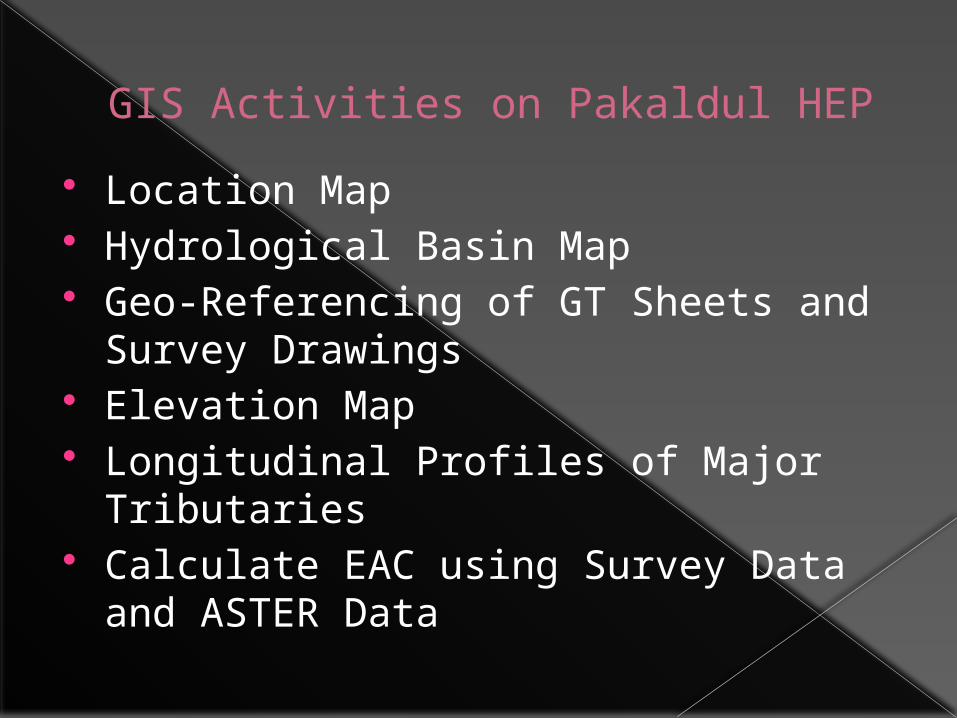
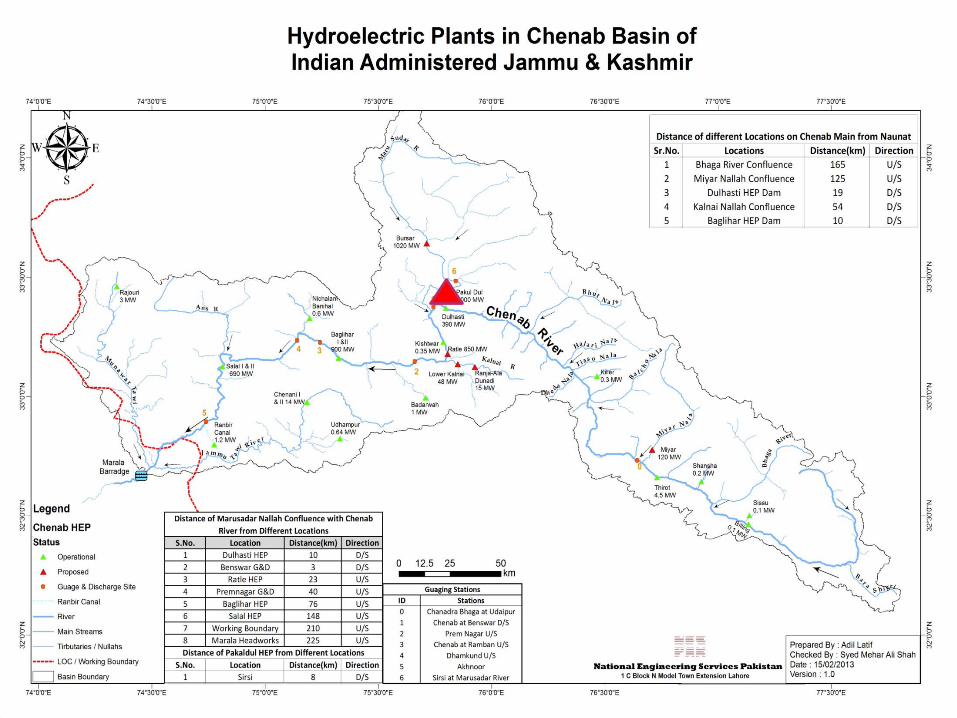
GIS Activities on Pakaldul HEP Location Map Hydrological Basin Map Geo-Referencing of GT Sheets and
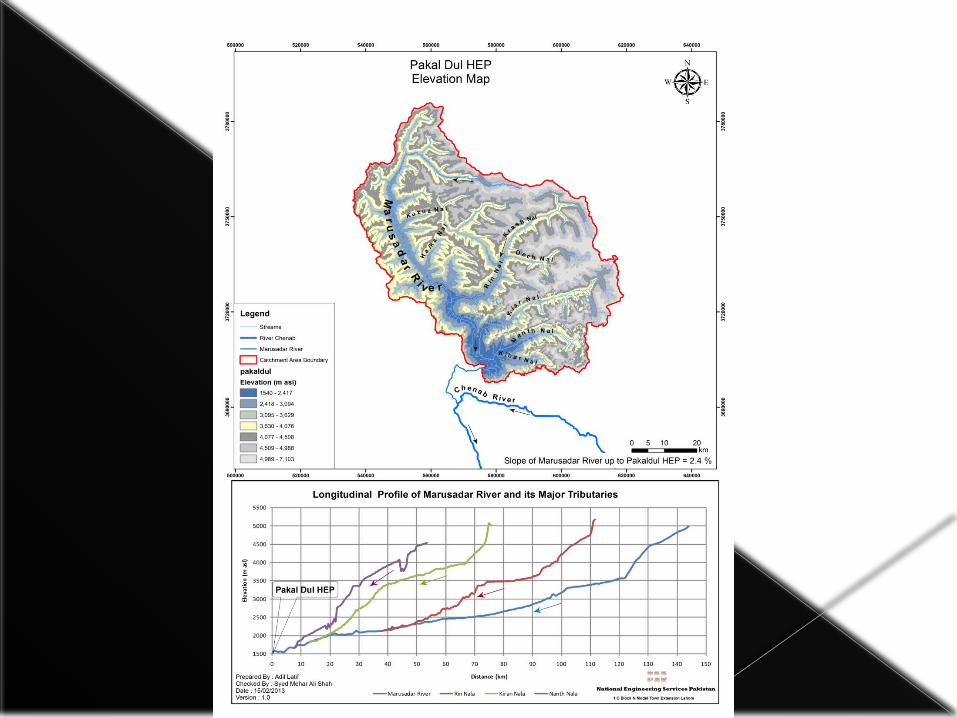
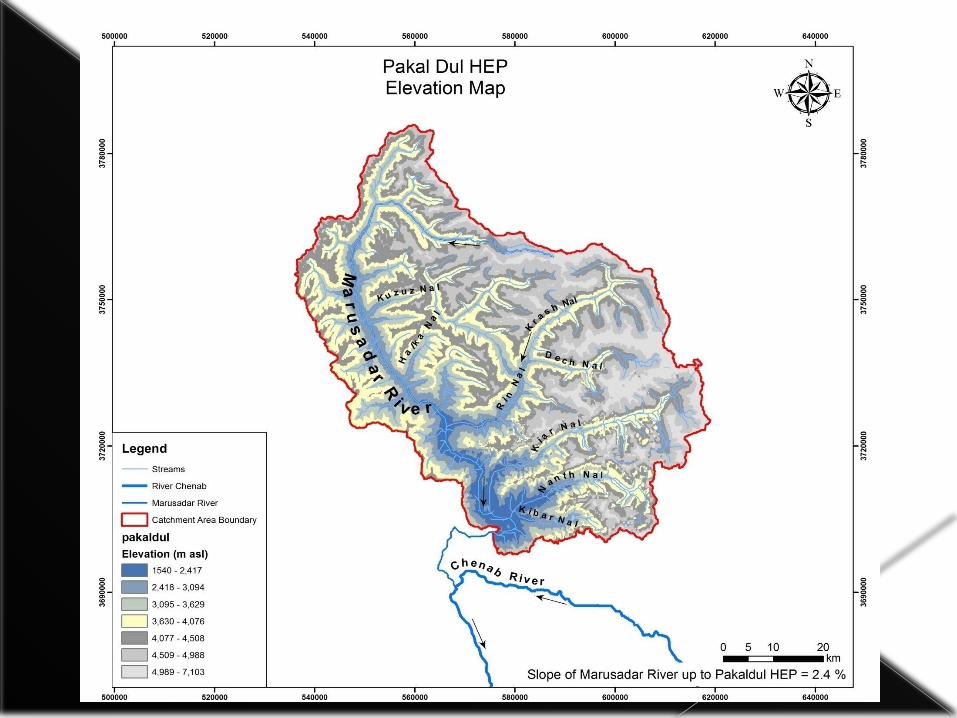
Survey Drawings Elevation Map Longitudinal Profiles of Major
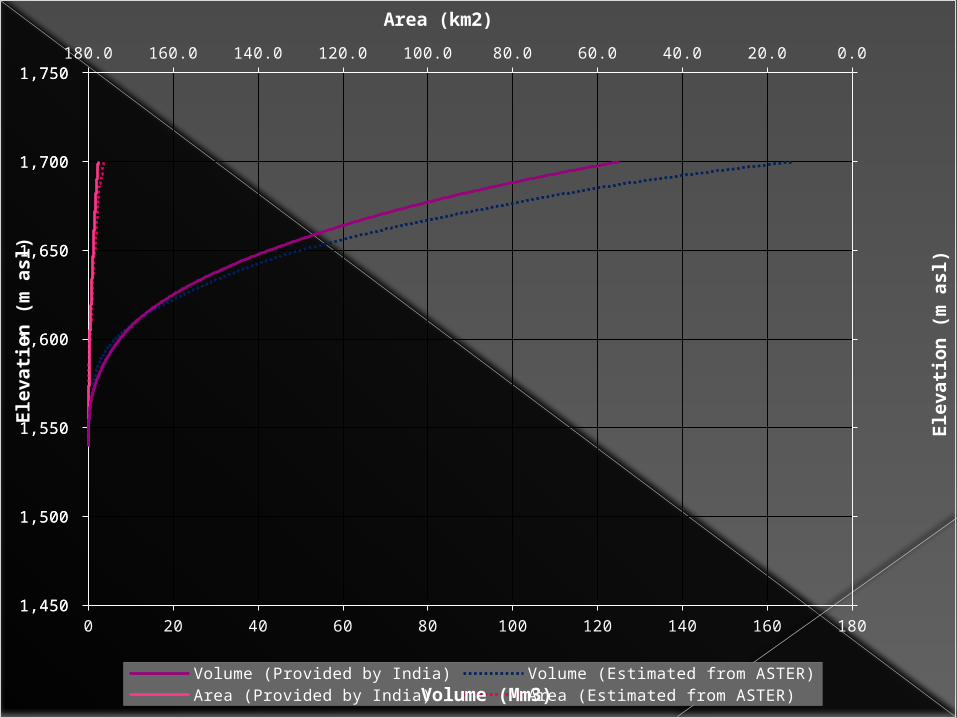
Tributaries Calculate EAC using Survey Data and
ASTER Data
0 20 40 60 80 100 120 140 160 180
0.020.040.060.080.0100.0120.0140.0160.0180.0
1,450
1,500
1,550
1,600
1,650
1,700
1,750
1,450
1,500
1,550
1,600
1,650
1,700
1,750
Volume (Provided by India) Volume (Estimated from ASTER)Area (Provided by India) Area (Estimated from ASTER)Volume (Mm3)
Elev
atio
n (m
asl
)Area (km2)
Elev
atio
n (m
asl
)

Kishenganga HEP Case Arbitration
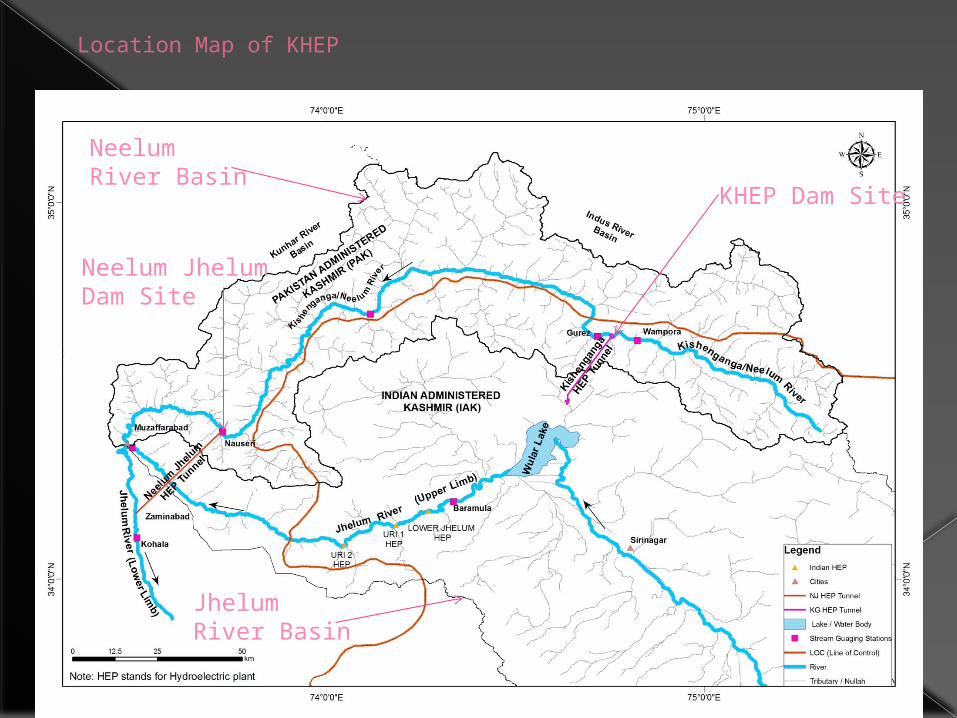
Location Map of KHEP
KHEP Dam SiteNeelum River Basin
Neelum Jhelum Dam Site
Jhelum River Basin
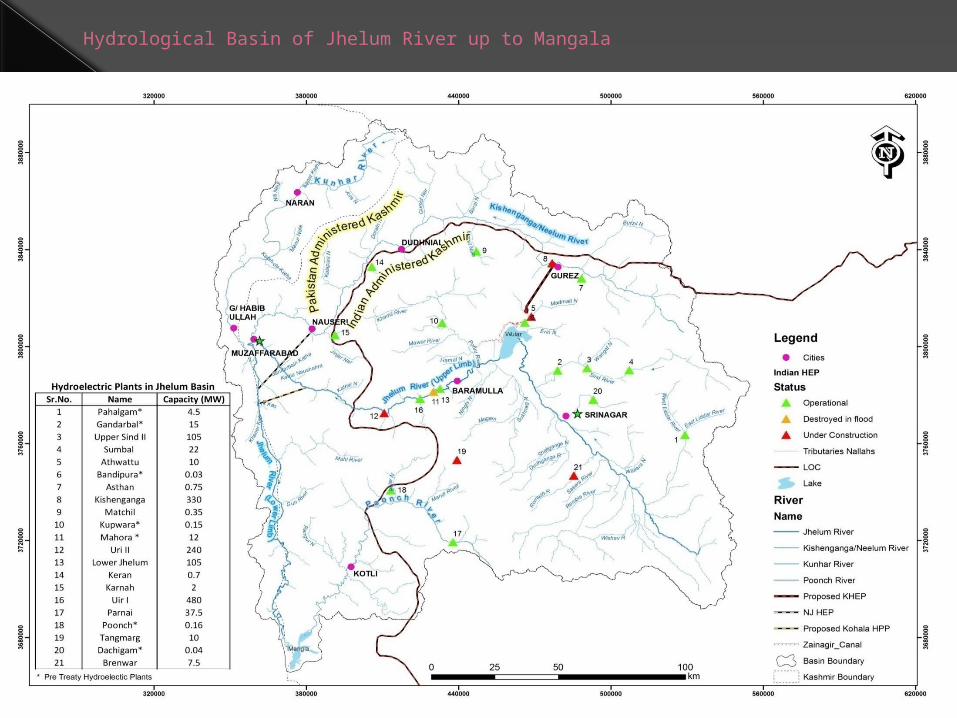
Hydrological Basin of Jhelum River up to Mangala
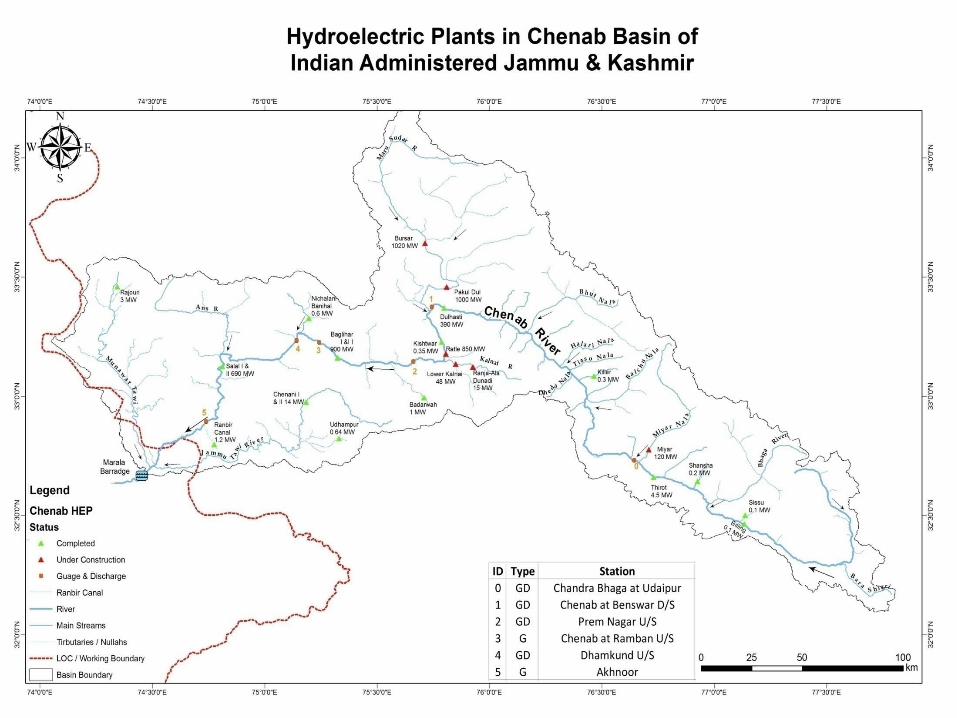
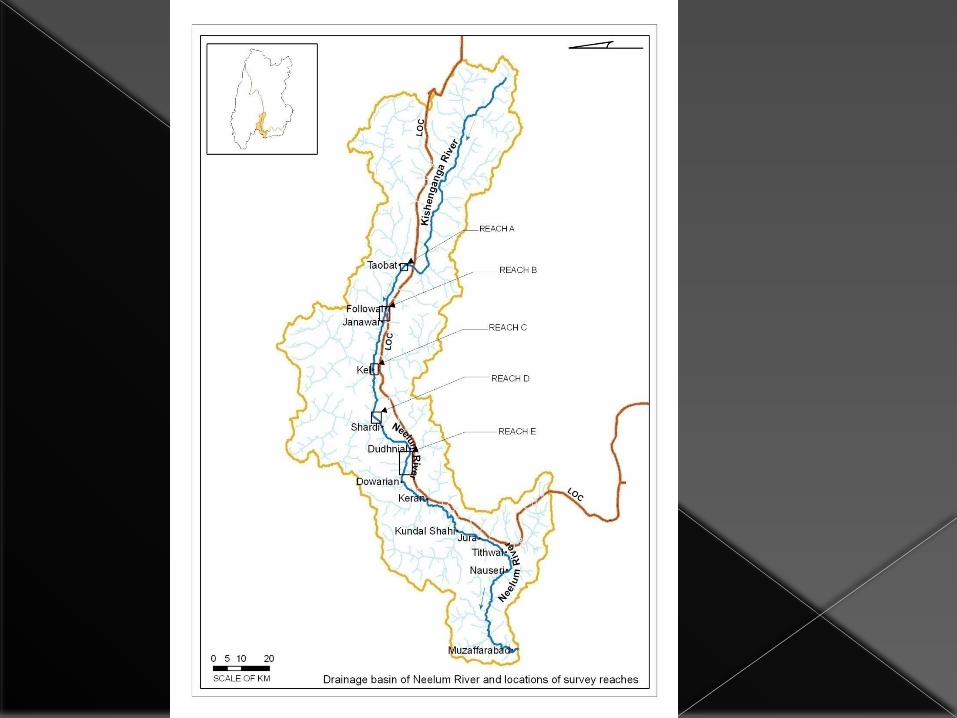
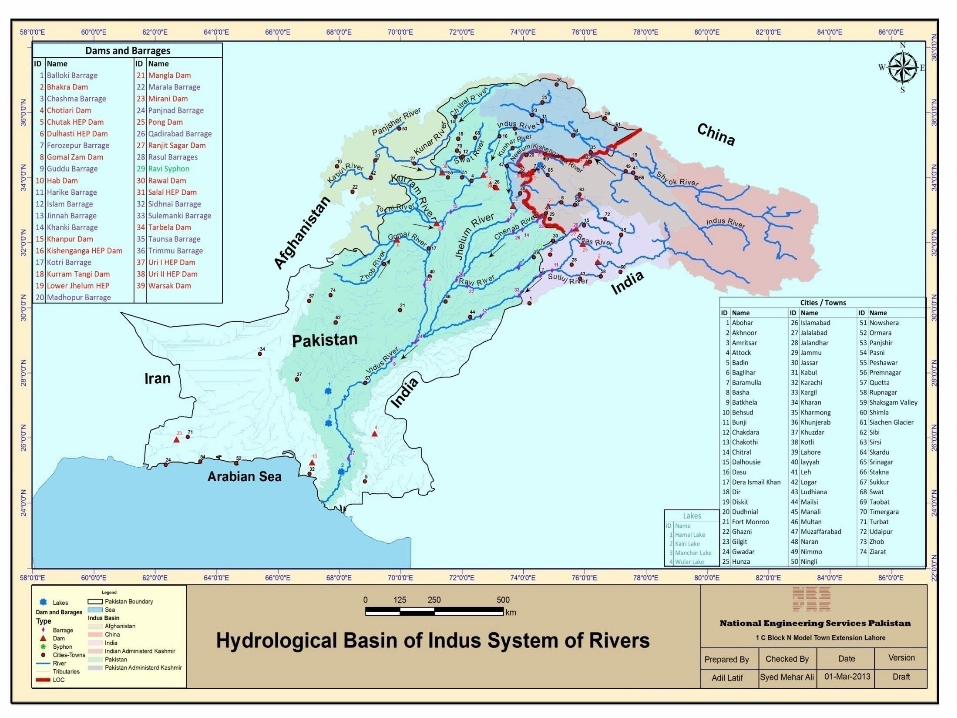
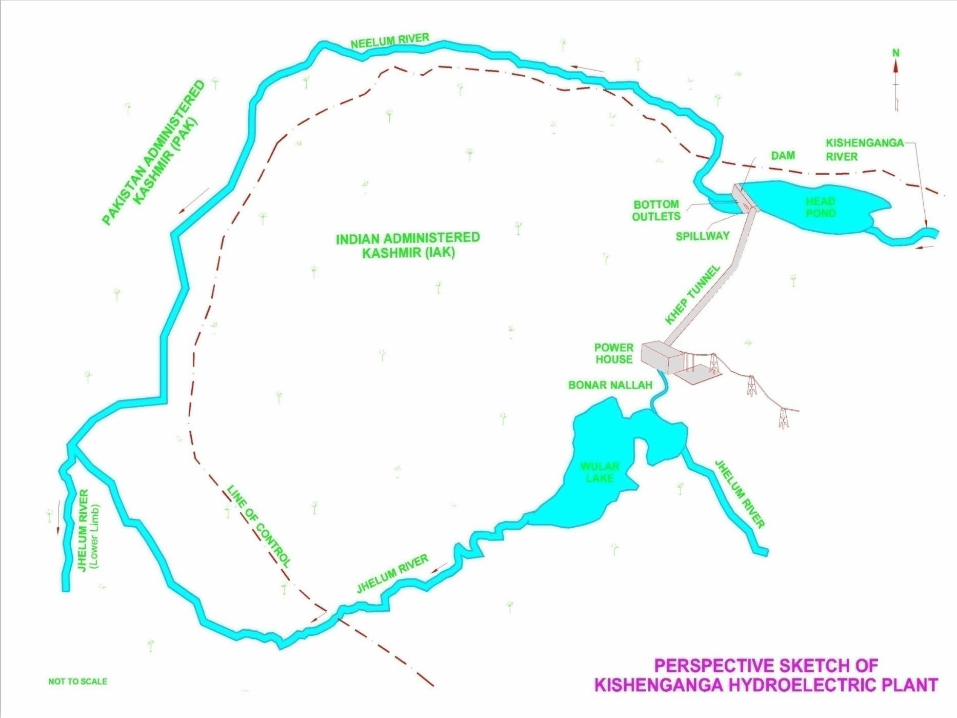
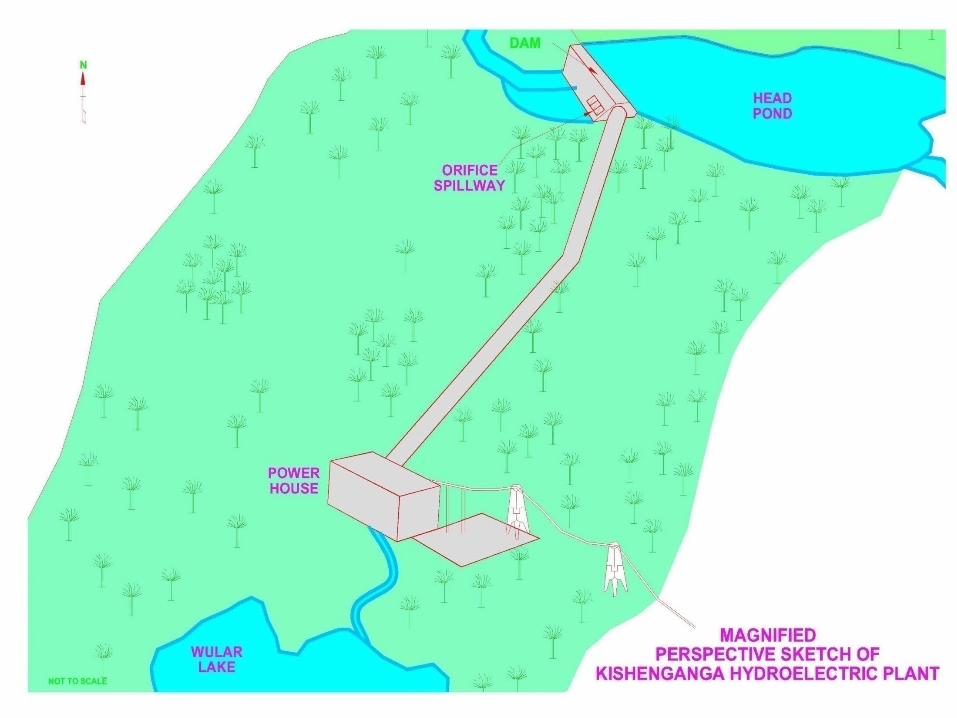
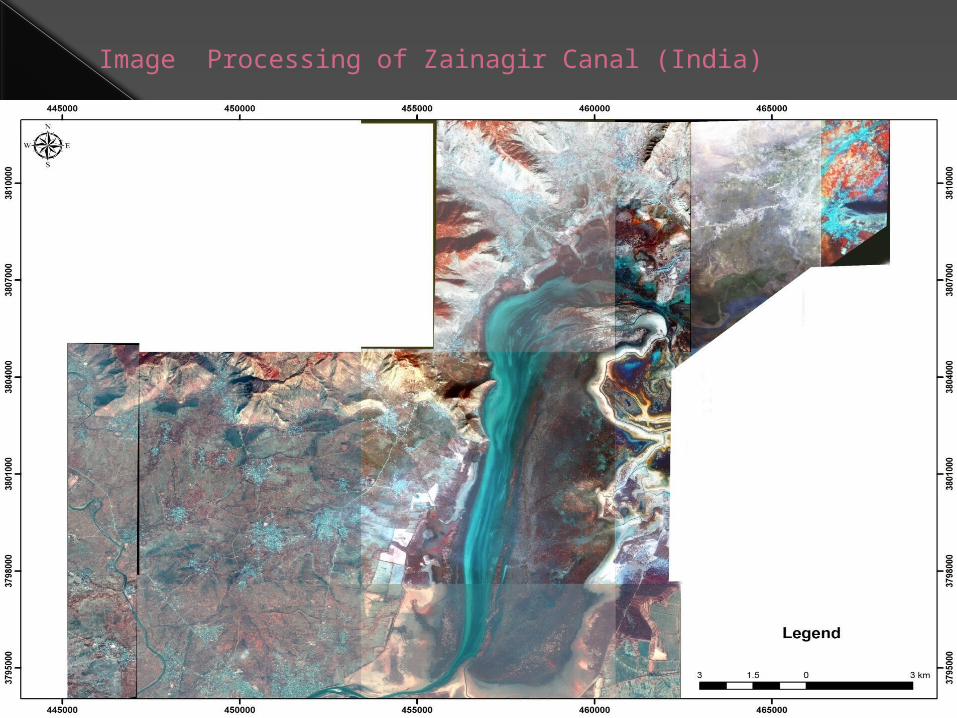
Image Processing of Zainagir Canal (India)
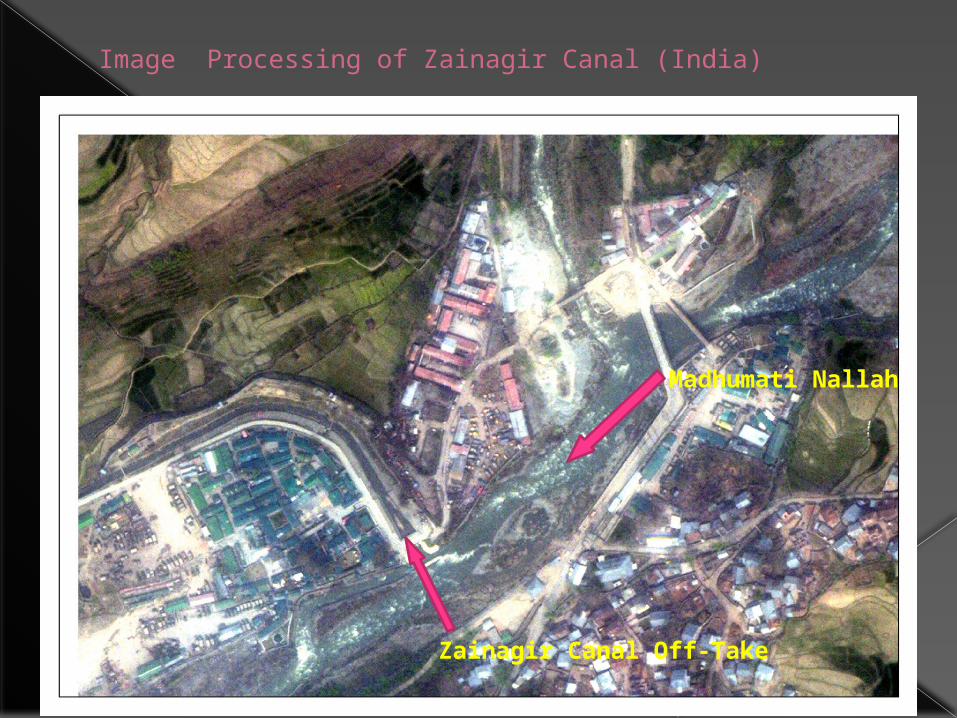
Image Processing of Zainagir Canal (India)
Madhumati Nallah
Zainagir Canal Off-Take
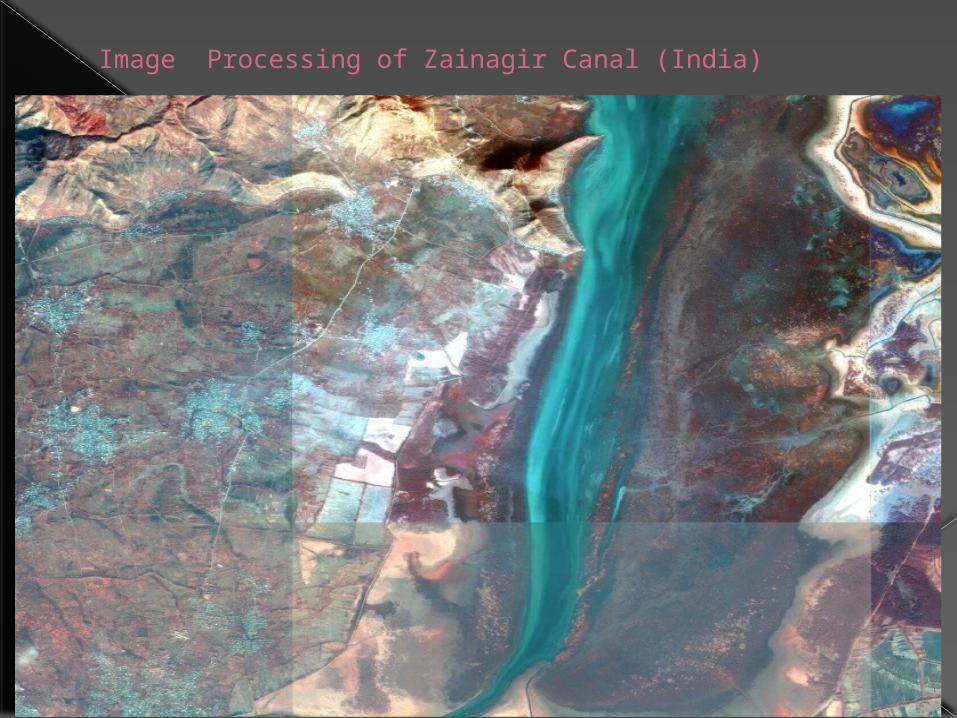
Image Processing of Zainagir Canal (India)
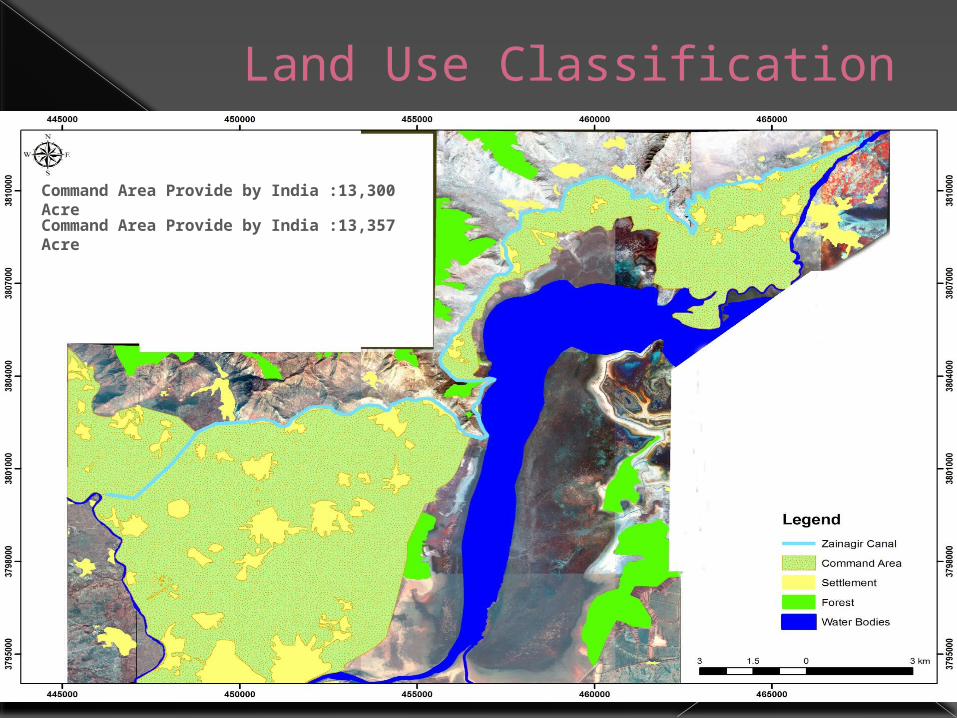
Land Use Classification
Command Area Provide by India :13,300 AcreCommand Area Provide by India :13,357 Acre
Compensation of KHEP impact on NJHEP due to Dudhnial and Kohala Projects
CWC’s has contrived in the end of its report an offsetting mechanism of reduction of energy at NJHEP due to implementation of KHEP by referring to the alleged Dudhnial and Kohala hydroelectric plants.
Compensation of KHEP impact on NJHEP due to Dudhnial and Kohala Projects
Pakistan disagree with such thoughts based on merely some information possibly shared in the past about the planning of the Dudhnial project as storage works. Dudhnial HEP was initially conceived in early 80s as a storage project incorporating a 210m high dam with about 9km long tunnel to tap a total head of more than 300m. The project parameters were based on a desk study carried out in the offices of WAPDA. Till 1980 to date the project has to undergo the pre-feasibility and feasibility studies so that the configuration of the projects may be finalised and it may be decided whether the project would be feasible as a storage or run-of-river scheme.
Compensation of KHEP impact on NJHEP due to Dudhnial and Kohala Projects
It was checked and found, using satellite images and SRTM DEM, that construction of 210m high dam at Dudhnial would inundate about 30km of upstream river reach till Kel which amounts to inundation of the native population and relocation of the road that would become part of the reservoir. The inundation would also submerge Sharda village which is an ancient Buddhist monastery.
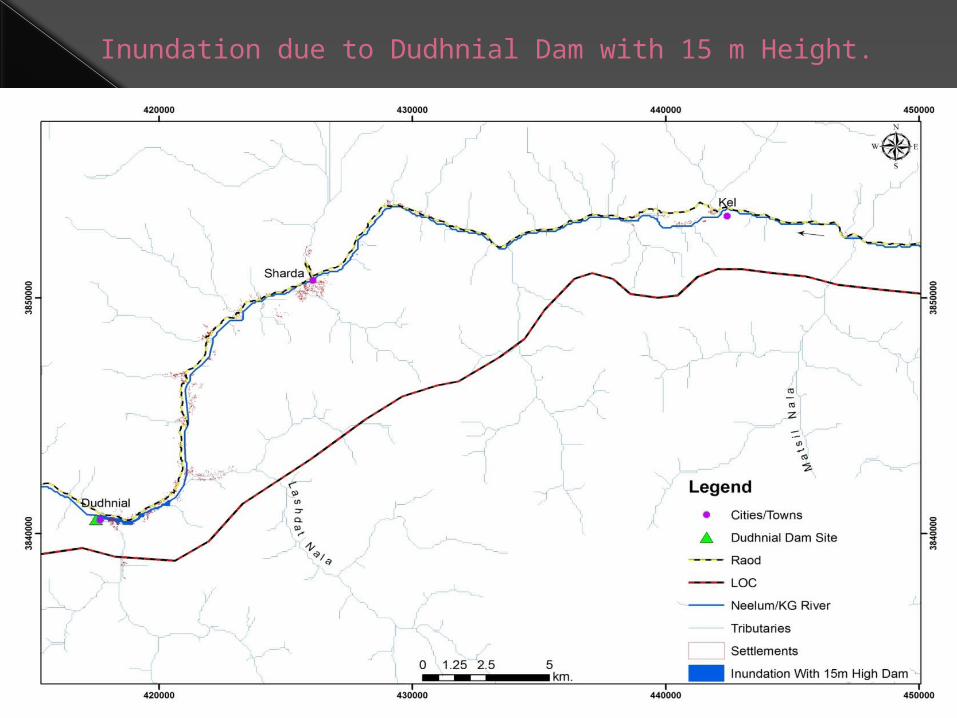
Inundation due to Dudhnial Dam with 15 m Height.

Inundation due to Dudhnial Dam with 20 m Height.

Inundation due to Dudhnial Dam with 25 m Height.

Inundation due to Dudhnial Dam with 30 m Height.
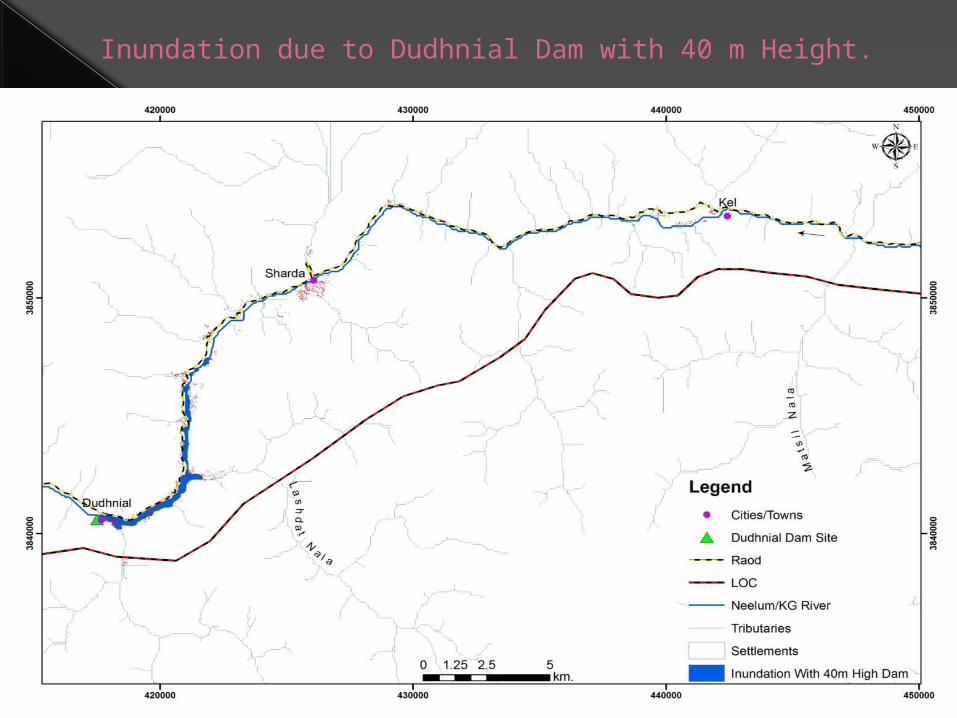
Inundation due to Dudhnial Dam with 40 m Height.
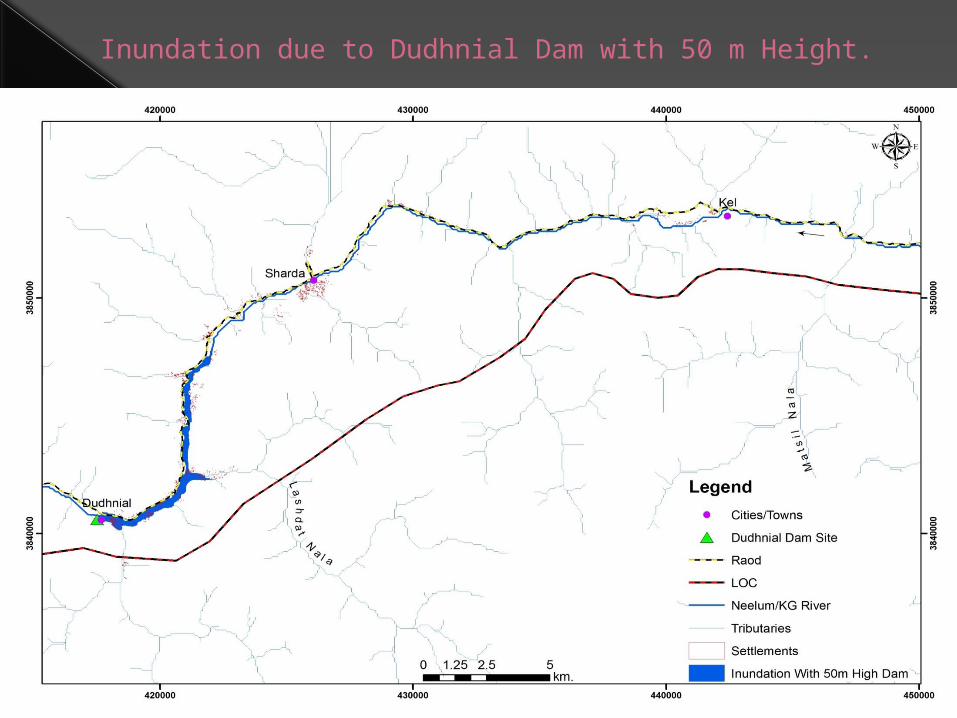
Inundation due to Dudhnial Dam with 50 m Height.
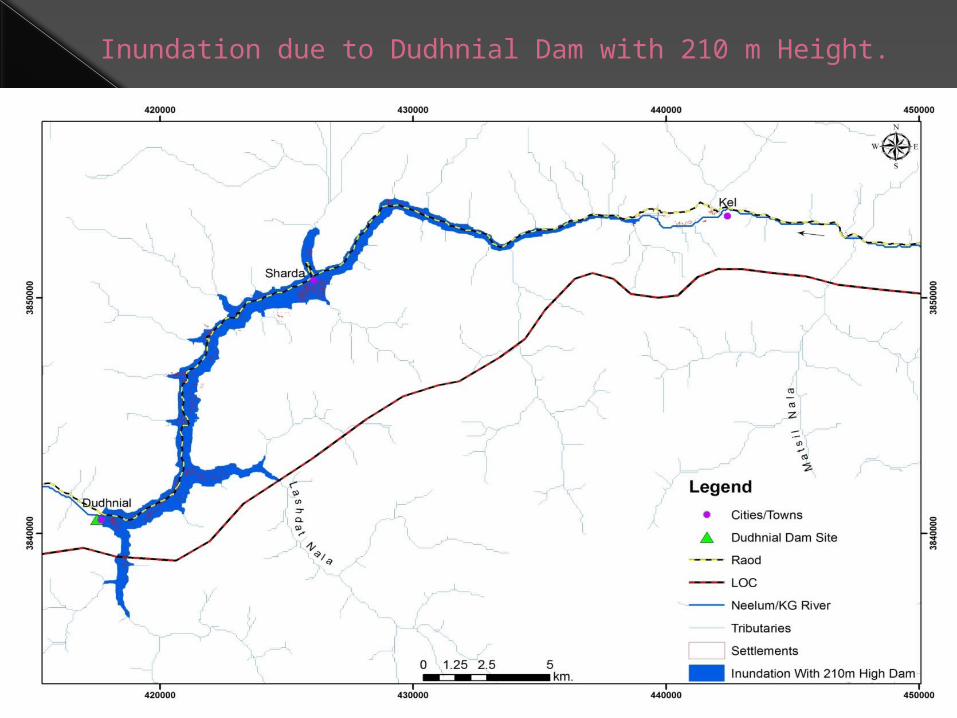
Inundation due to Dudhnial Dam with 210 m Height.
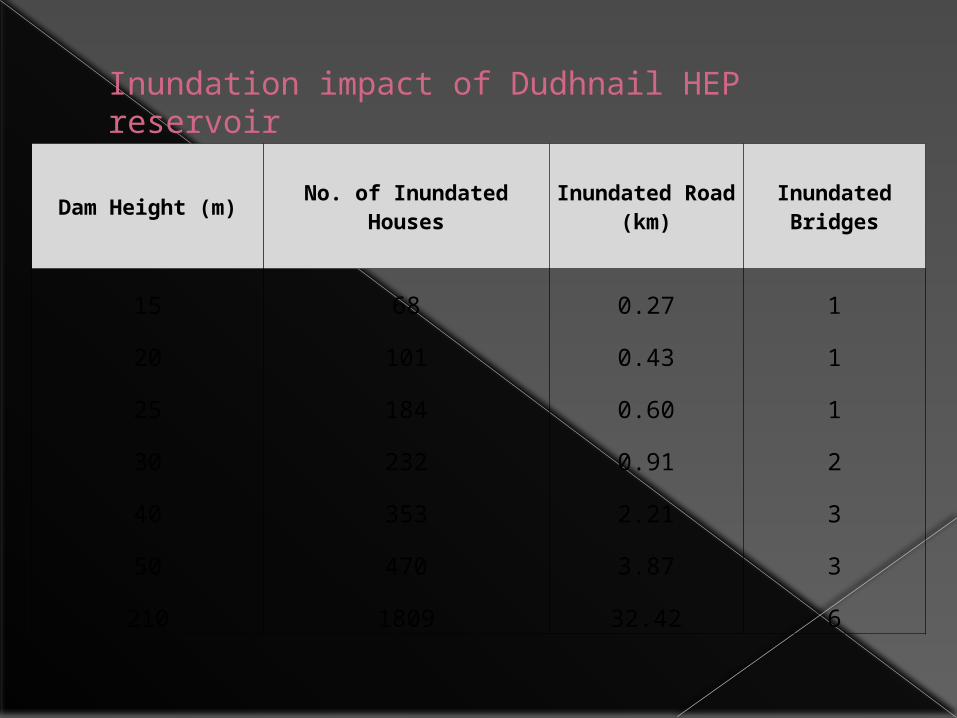
Inundation impact of Dudhnail HEP reservoir
Dam Height (m) No. of Inundated Houses Inundated Road (km) Inundated Bridges
15 68 0.27 1
20 101 0.43 1
25 184 0.60 1
30 232 0.91 2
40 353 2.21 3
50 470 3.87 3
210 1809 32.42 6
0 500 1000 1500 2000 2500 3000 35002000
2500
3000
3500
4000
4500
5000
5500
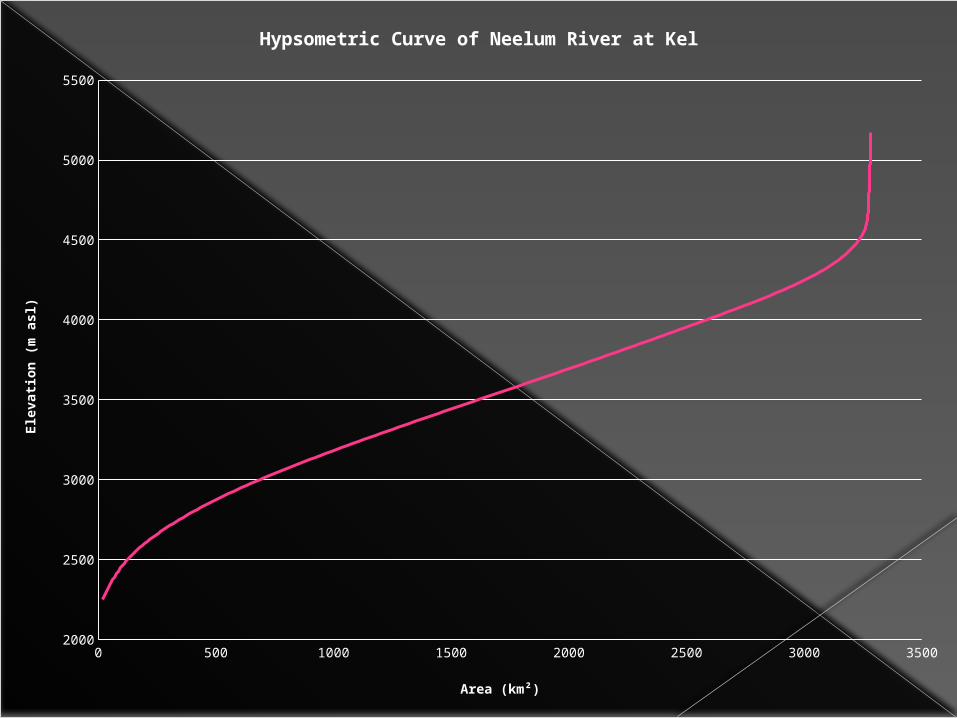
Hypsometric Curve of Neelum River at Kel
Area (km²)
Elev
atio
n (m
asl
)
3280 - 3274
3274 - 3233
3233 - 3007
3007 - 2588
2588 - 2113
2113 - 1618
1618 - 1129
1129 - 688
688 - 346
346 - 125
125 - 17
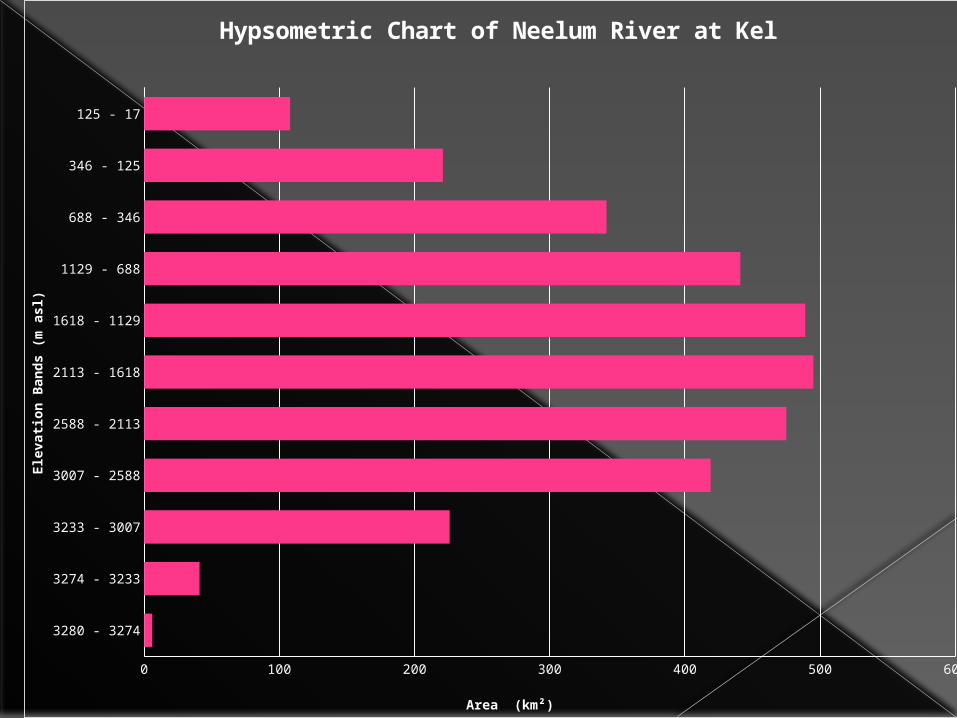
0 100 200 300 400 500 600
Area (km²)
Elev
atio
n Ba
nds
(m a
sl)
Hypsometric Chart of Neelum River at Kel
Study and design of storm water drainage and Flood Management for five cities in Al Baha Region
of KSA
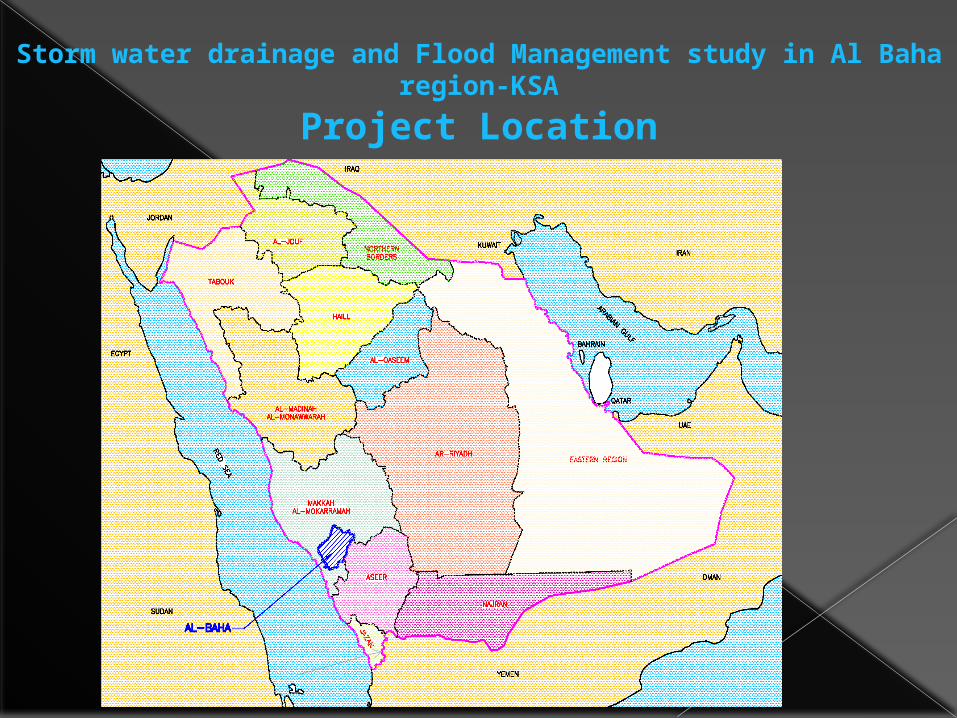
Project Location
Storm water drainage and Flood Management study in Al Baha region-KSA
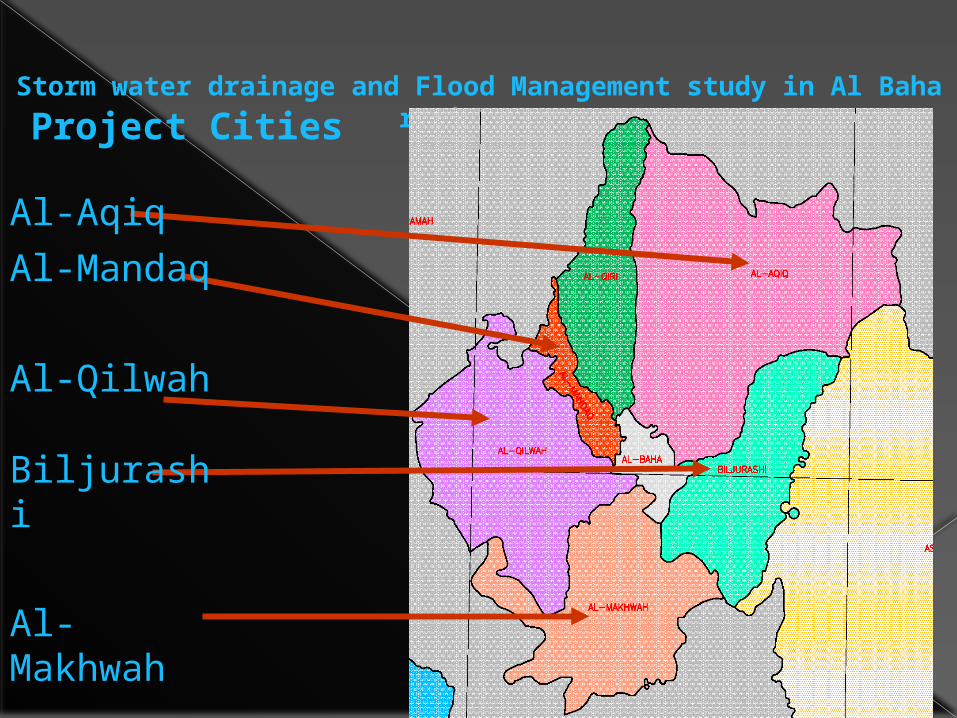
Project CitiesStorm water drainage and Flood Management study in Al Baha region-
KSA
Al-AqiqAl-Mandaq
Al-Qilwah
Biljurashi
Al-Makhwah
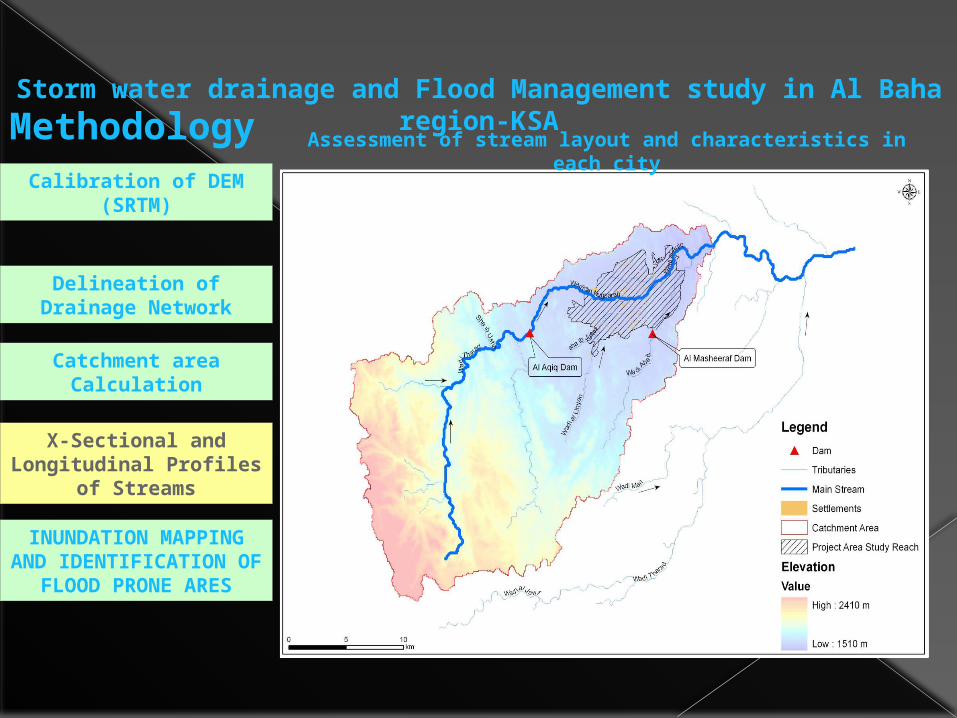
MethodologyStorm water drainage and Flood Management study in Al Baha region-
KSA
Calibration of DEM (SRTM)
Delineation of Drainage Network
Catchment area Calculation
X-Sectional and Longitudinal Profiles
of Streams
INUNDATION MAPPING AND
IDENTIFICATION OF FLOOD PRONE ARES
Assessment of stream layout and characteristics in each city
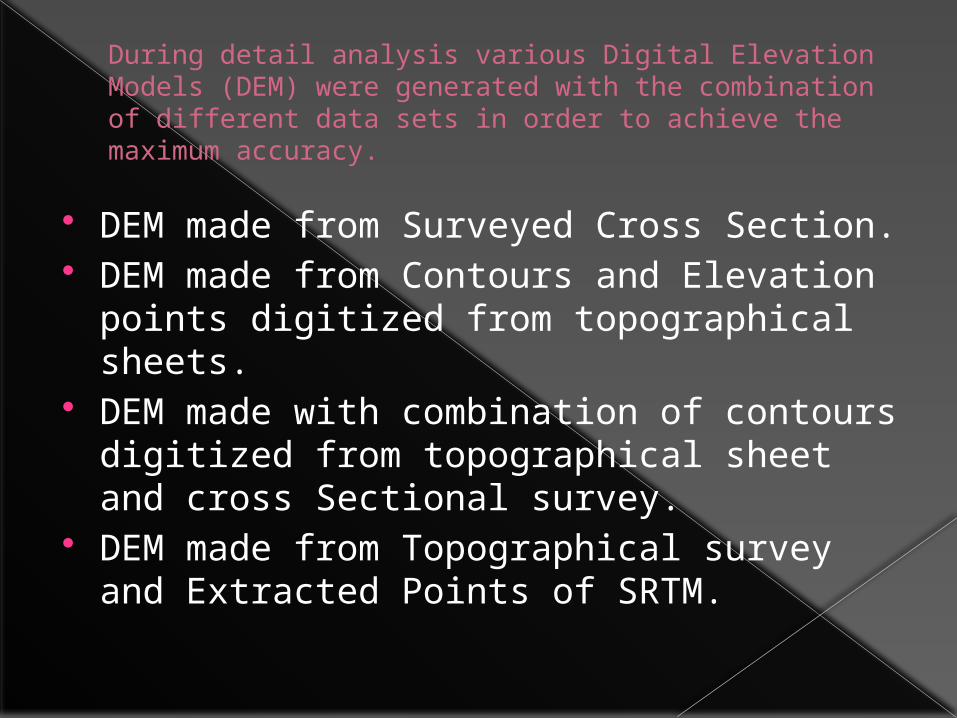
During detail analysis various Digital Elevation Models (DEM) were generated with the combination of different data sets in order to achieve the maximum accuracy.
DEM made from Surveyed Cross Section. DEM made from Contours and Elevation
points digitized from topographical sheets.
DEM made with combination of contours digitized from topographical sheet and cross Sectional survey.
DEM made from Topographical survey and Extracted Points of SRTM.
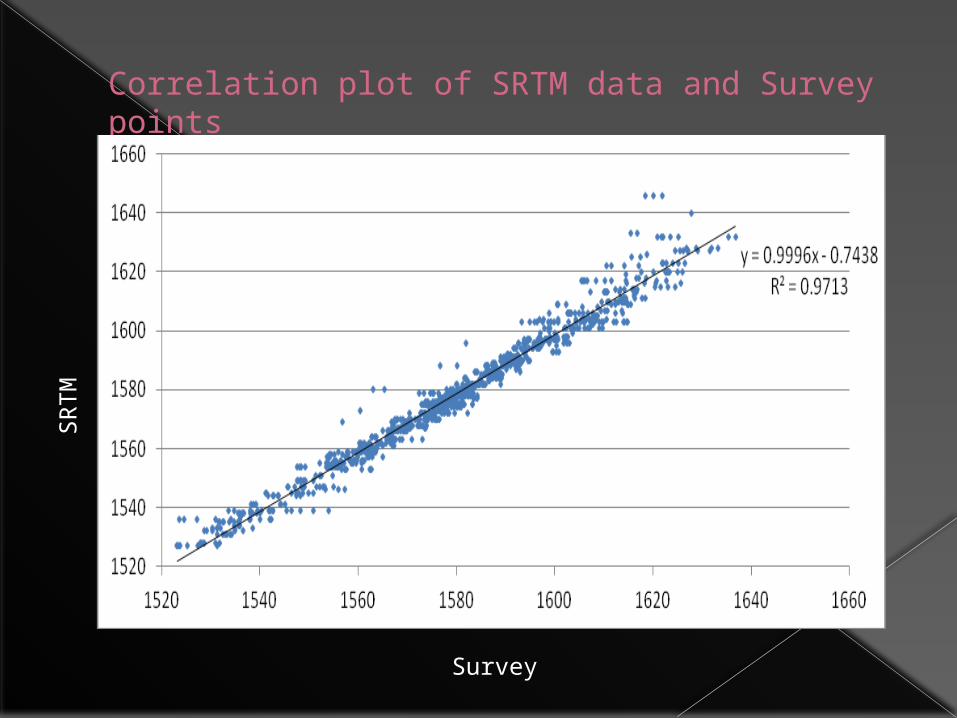
Correlation plot of SRTM data and Survey points
Survey
SRTM
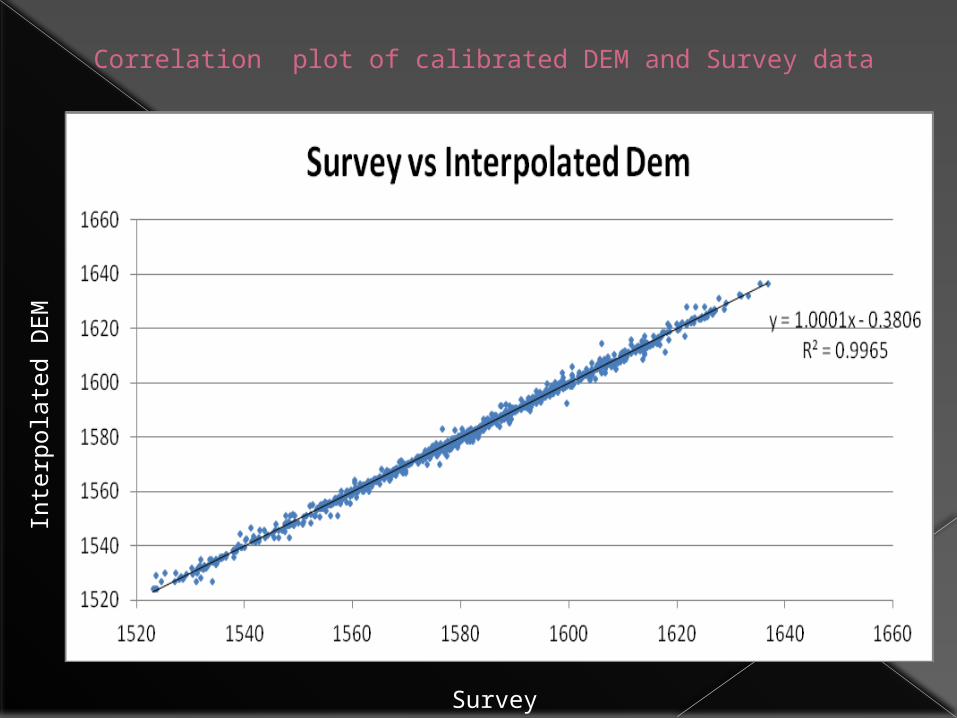
Correlation plot of calibrated DEM and Survey data
Survey
Inte
rpol
ated
DEM
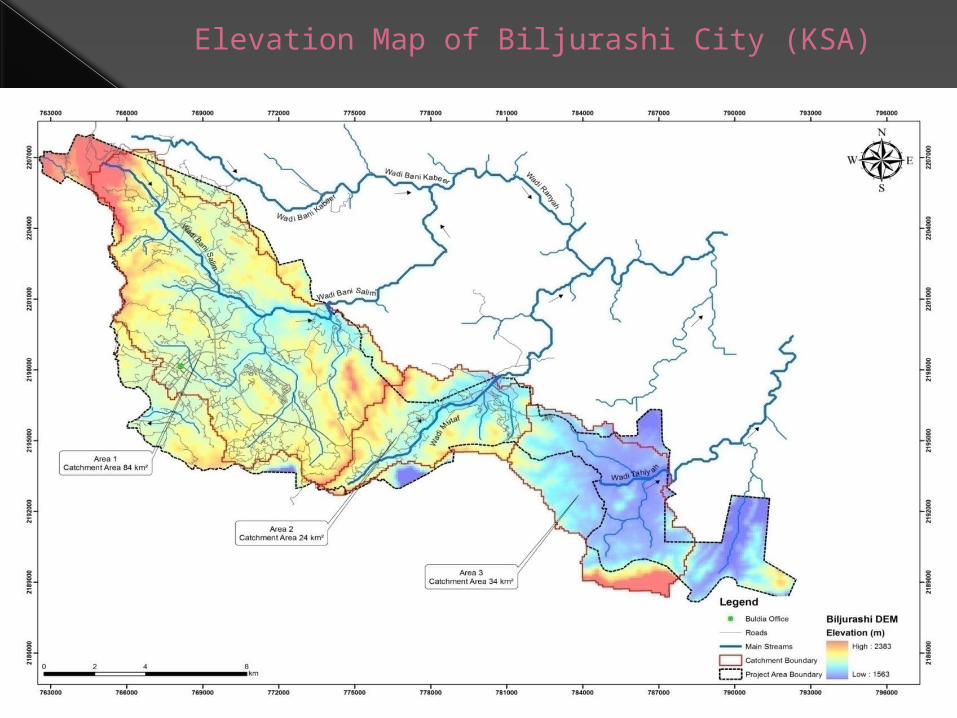
Elevation Map of Biljurashi City (KSA)
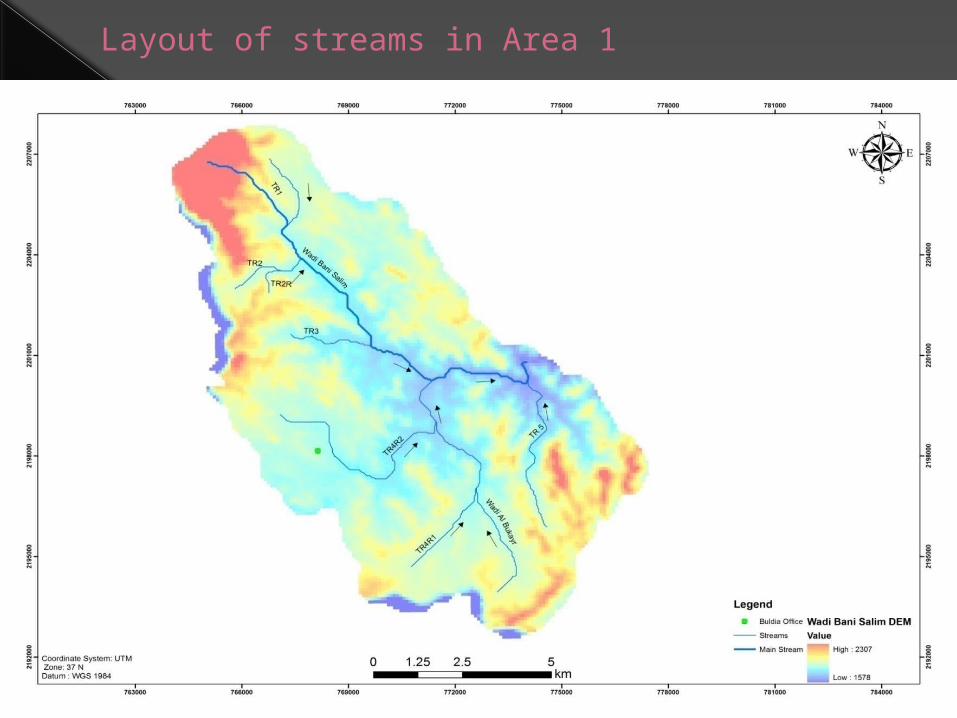
Layout of streams in Area 1
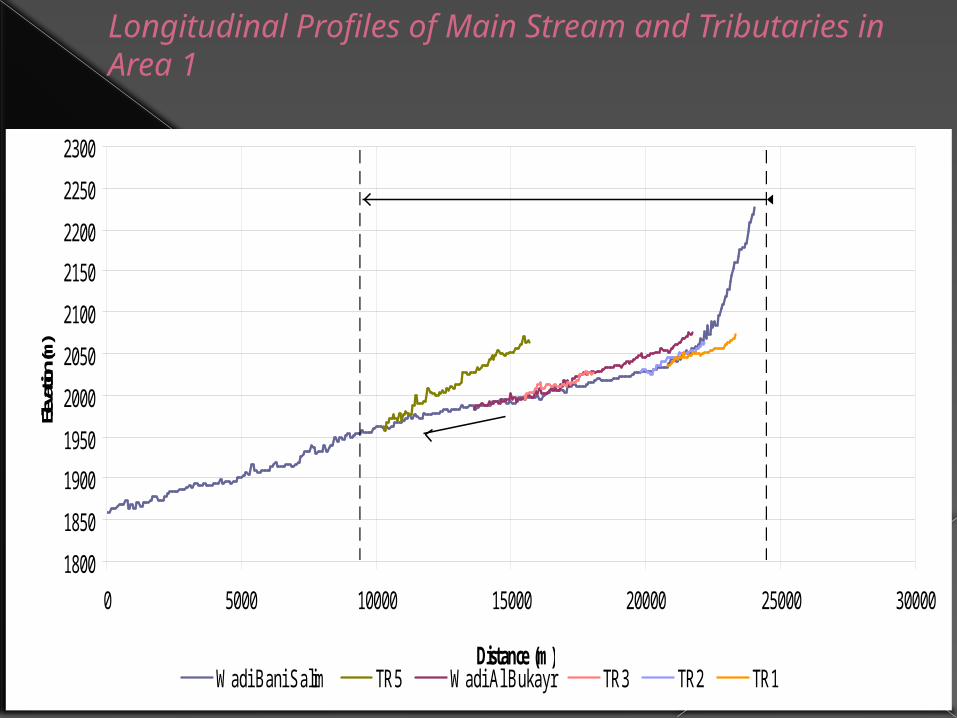
Longitudinal Profiles of Main Stream and Tributaries in Area 1
1800
1850
1900
1950
2000
2050
2100
2150
2200
2250
2300
0 5000 10000 15000 20000 25000 30000
Distance (m)
Elev
ation
(m)
Wadi Bani Salim TR5 Wadi Al Bukayr TR3 TR2 TR1
Slope 1.88%
Project Area Boundary
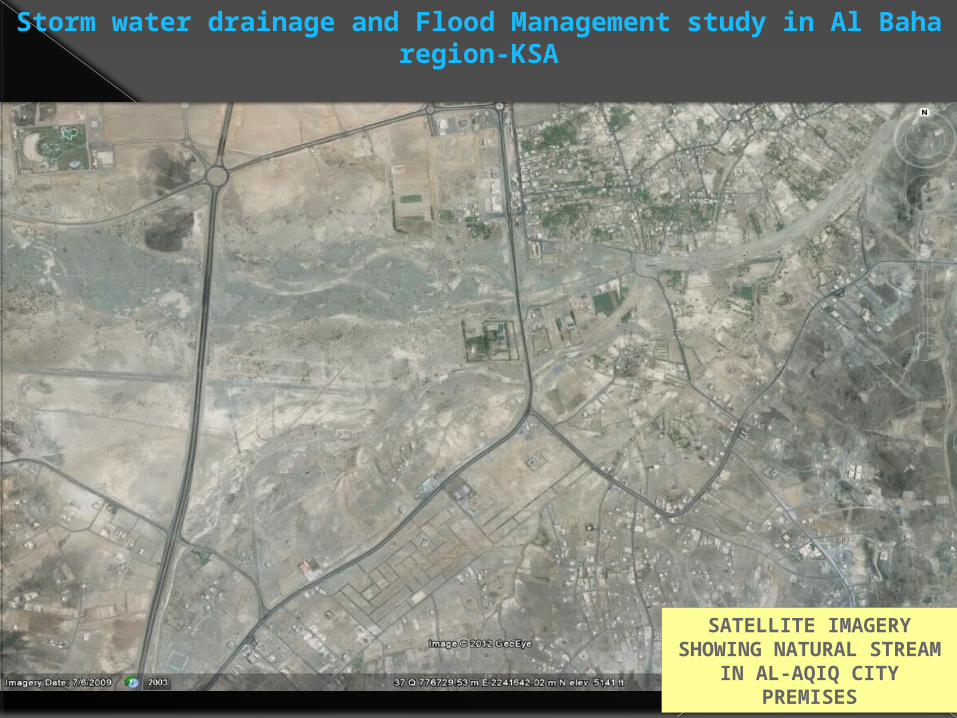
Storm water drainage and Flood Management study in Al Baha region-KSA
SATELLITE IMAGERY SHOWING NATURAL STREAM IN AL-AQIQ
CITY PREMISES
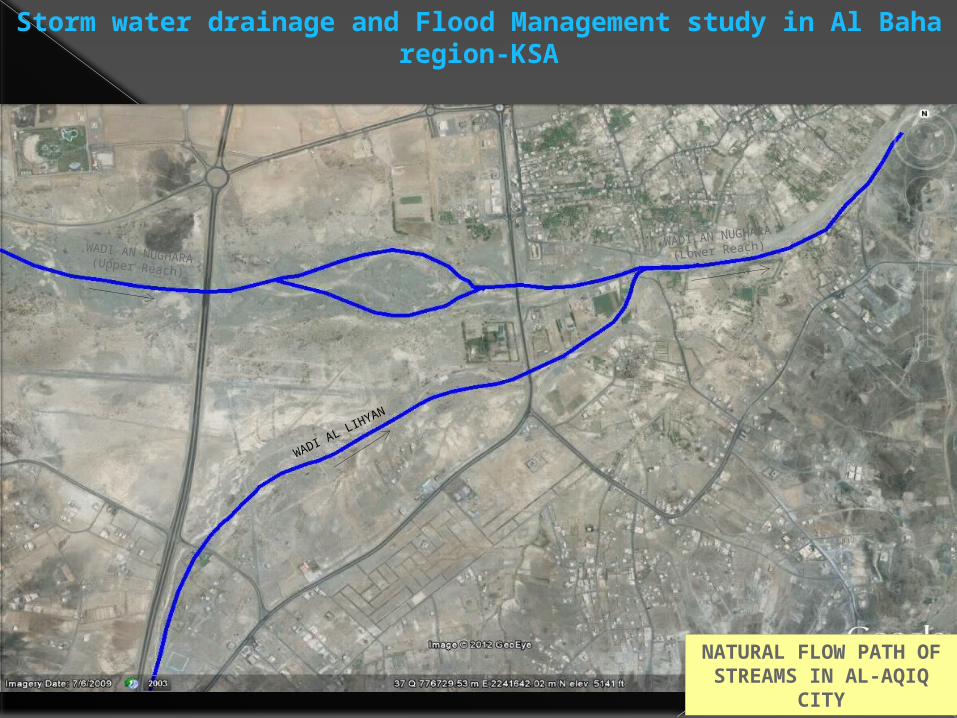
Storm water drainage and Flood Management study in Al Baha region-KSA
NATURAL FLOW PATH OF STREAMS IN AL-
AQIQ CITY
WADI AN NUGHARA(Upper Reach)
WADI AN NUGHARA(Lower Reach)
WADI AL LIHYAN
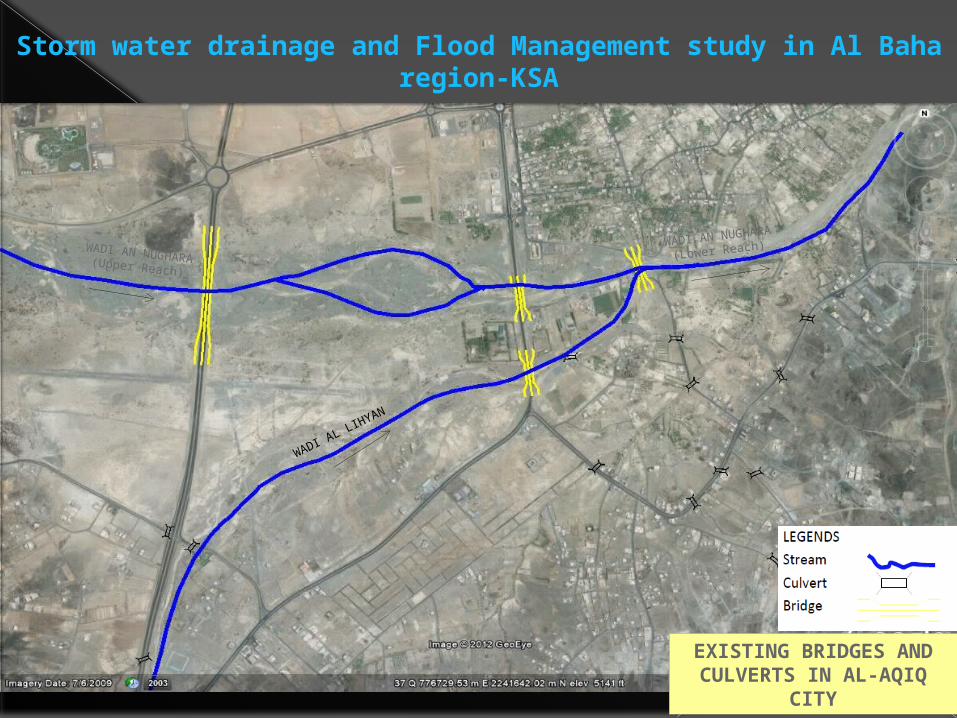
Storm water drainage and Flood Management study in Al Baha region-KSA
EXISTING BRIDGES AND CULVERTS IN AL-AQIQ
CITY
WADI AN NUGHARA(Upper Reach)
WADI AN NUGHARA(Lower Reach)
WADI AL LIHYAN
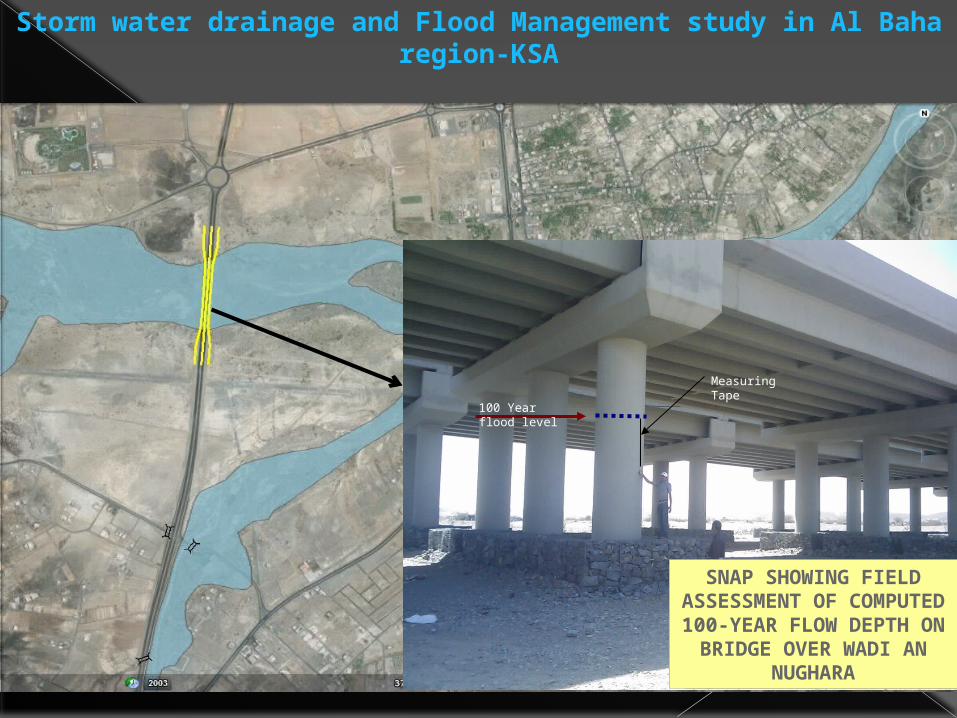
Storm water drainage and Flood Management study in Al Baha region-KSA
Measuring Tape
100 Year flood level
COMPUTED 100-YEAR FLOOD EXTENTS ALONG STREAMS
SNAP SHOWING FIELD ASSESSMENT OF
COMPUTED 100-YEAR FLOW DEPTH ON
BRIDGE OVER WADI AN NUGHARA
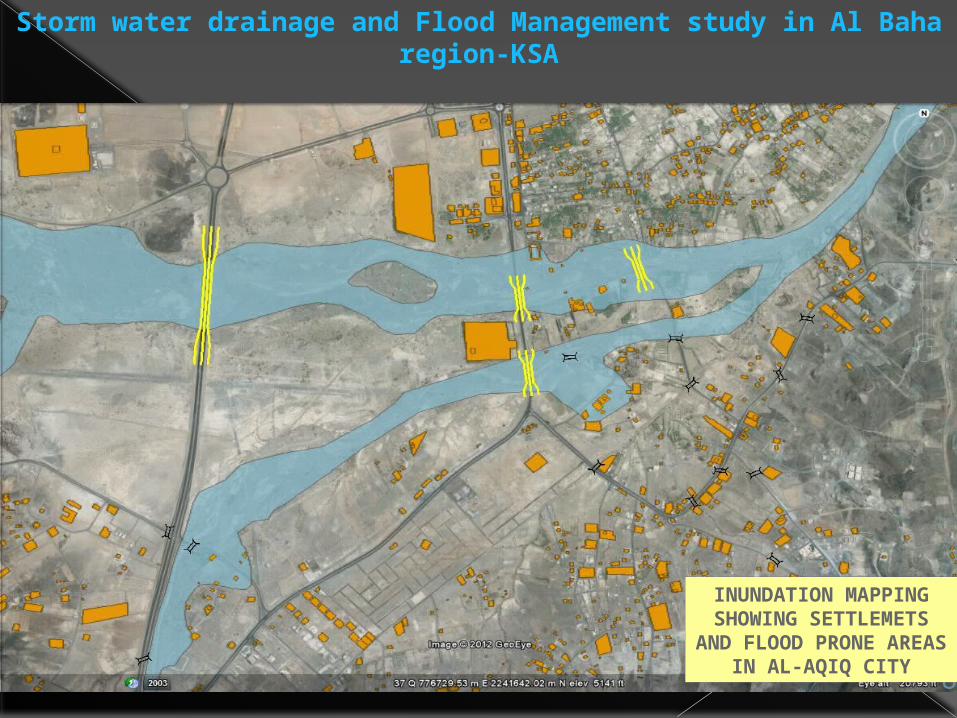
Storm water drainage and Flood Management study in Al Baha region-KSA
INUNDATION MAPPING SHOWING SETTLEMETS AND
FLOOD PRONE AREAS IN AL-AQIQ CITY
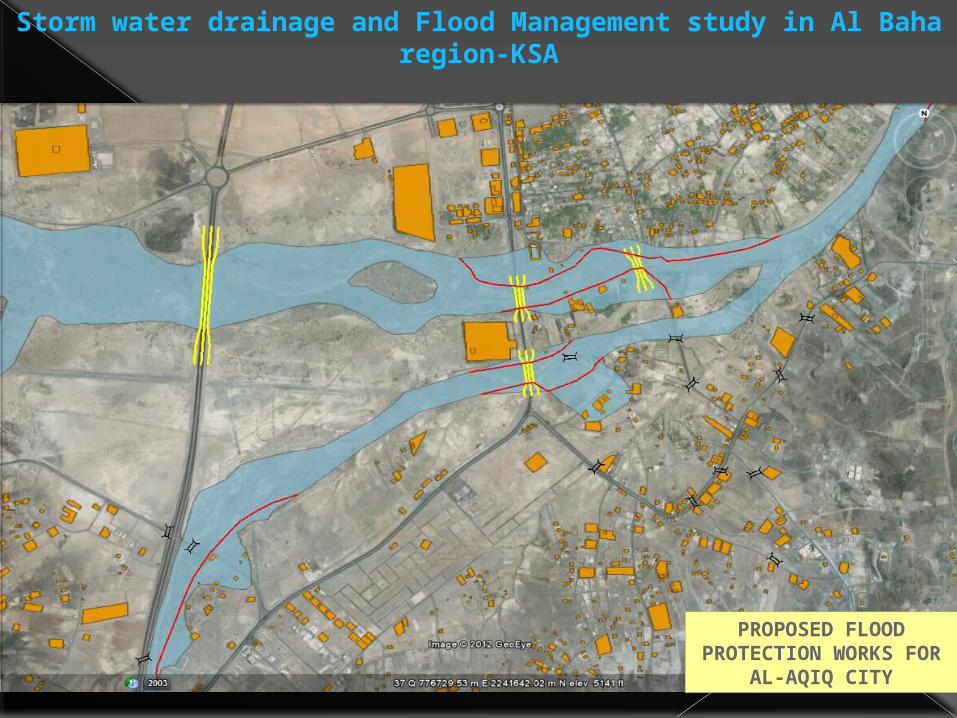
Storm water drainage and Flood Management study in Al Baha region-KSA
PROPOSED FLOOD PROTECTION WORKS
FOR AL-AQIQ CITY
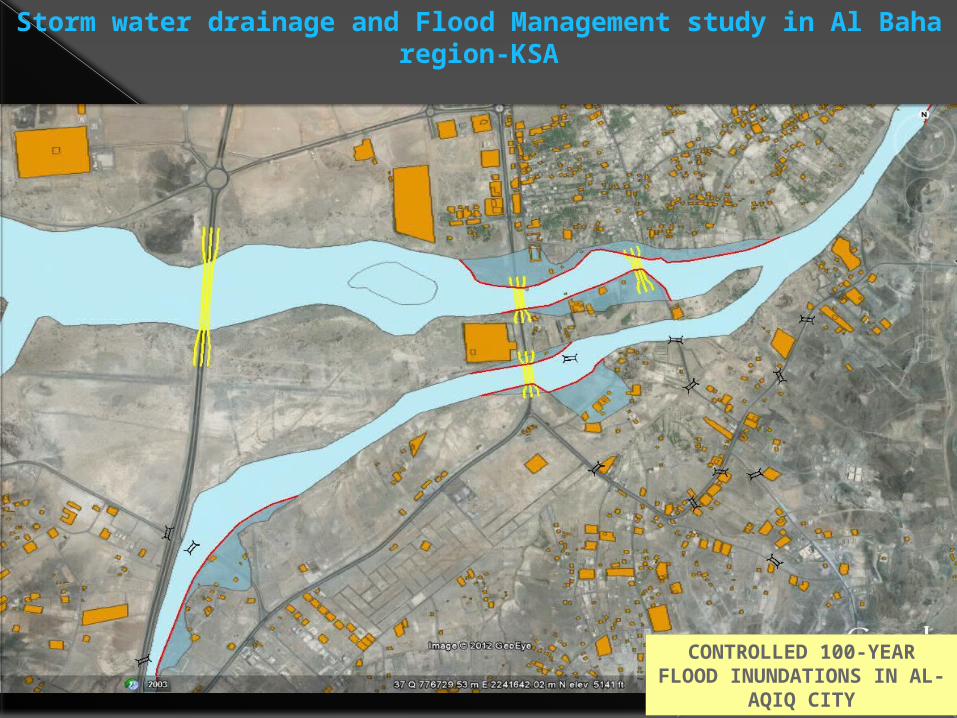
Storm water drainage and Flood Management study in Al Baha region-KSA
CONTROLLED 100-YEAR FLOOD INUNDATIONS IN
AL-AQIQ CITY
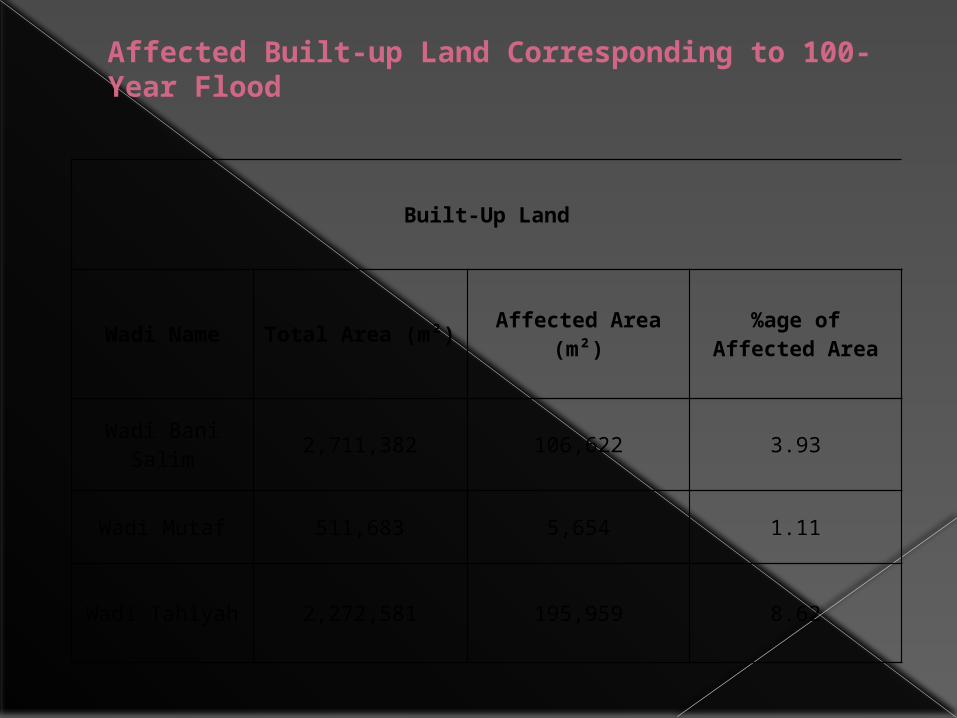
Affected Built-up Land Corresponding to 100-Year Flood
Built-Up Land
Wadi Name Total Area (m²) Affected Area (m²) %age of Affected Area
Wadi Bani Salim 2,711,382 106,622 3.93
Wadi Mutaf 511,683 5,654 1.11
Wadi Tahiyah 2,272,581 195,959 8.62
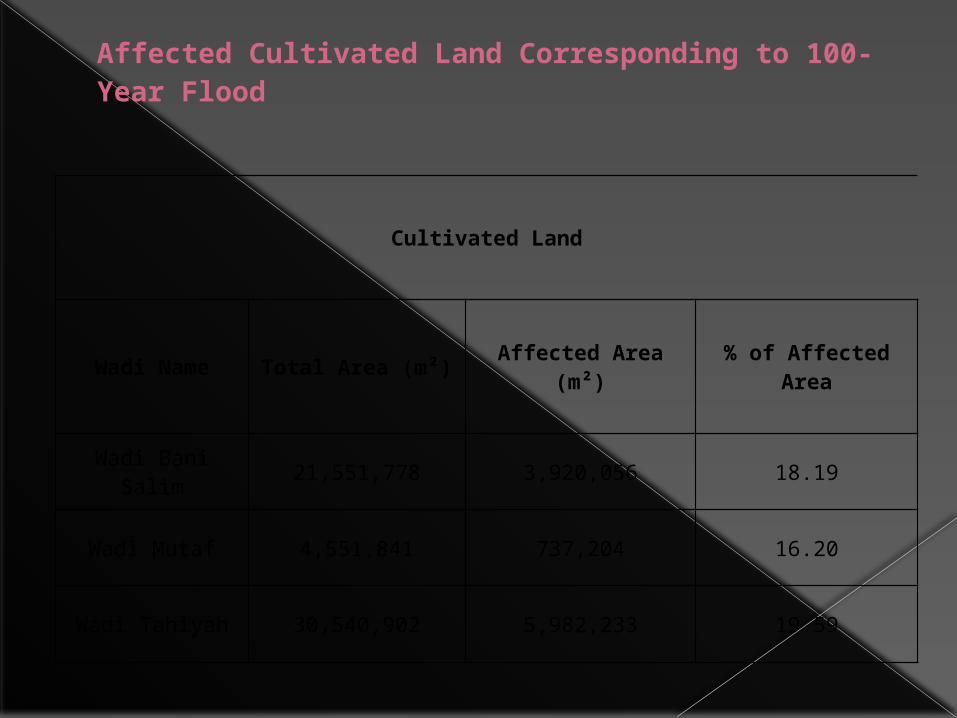
Affected Cultivated Land Corresponding to 100-Year Flood
Cultivated Land
Wadi Name Total Area (m²) Affected Area (m²) % of Affected Area
Wadi Bani Salim 21,551,778 3,920,056 18.19
Wadi Mutaf 4,551,841 737,204 16.20
Wadi Tahiyah 30,540,902 5,982,233 19.59
Sindh Water Sector Improvement Phase1
Selection Based on Soil Texture Seepage losses mainly depend on the soil texture through which
an irrigation channel traverses. Thus soil texture has been taken as the 2nd but prime criteria for the selection of sample channels. In order to identify various soil texture types in project area, soil texture maps developed by Planning Division of WAPDA on 1:250,000 scale have been studied. These maps classify project land with following types of soil textures;
Coarse (Sand, loamy sand) Moderately Coarse (sandy loam, fine sandy loam) Medium ( loam, silt loam, silt) Moderately fine (sandy clay loam, clay loam, silty clay loam) Fine (sandy clay, silty clay, clay)
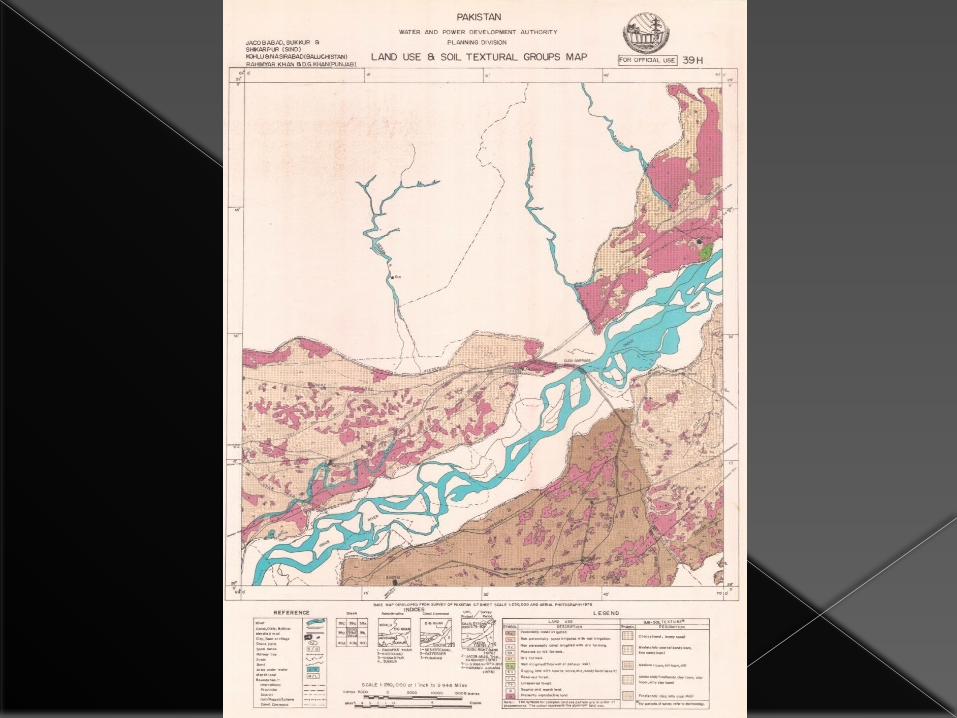
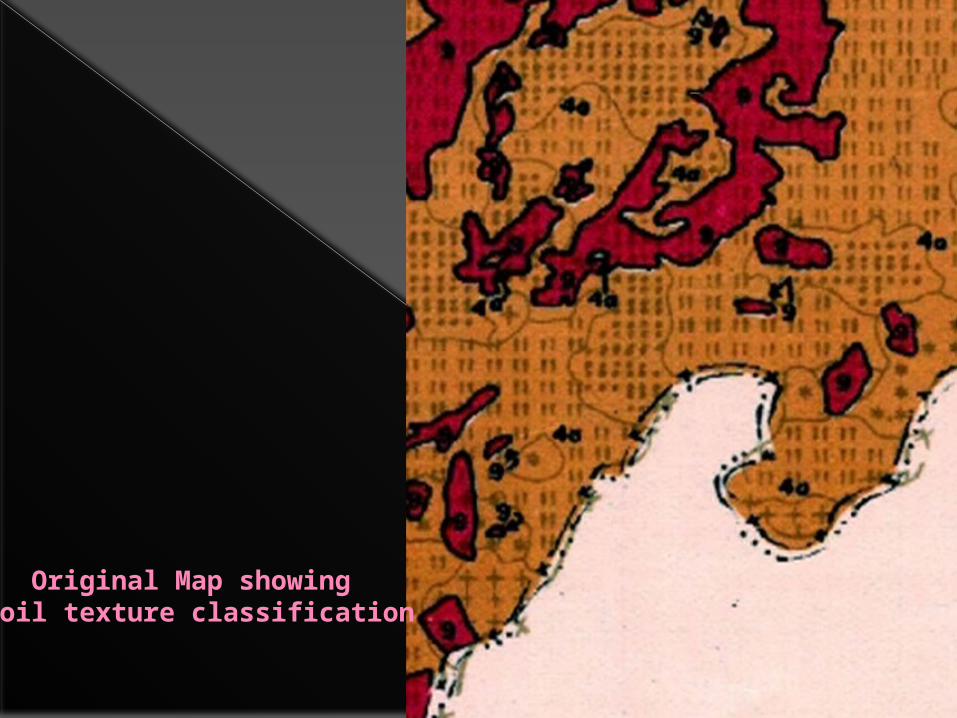
Original Map showing soil texture classification
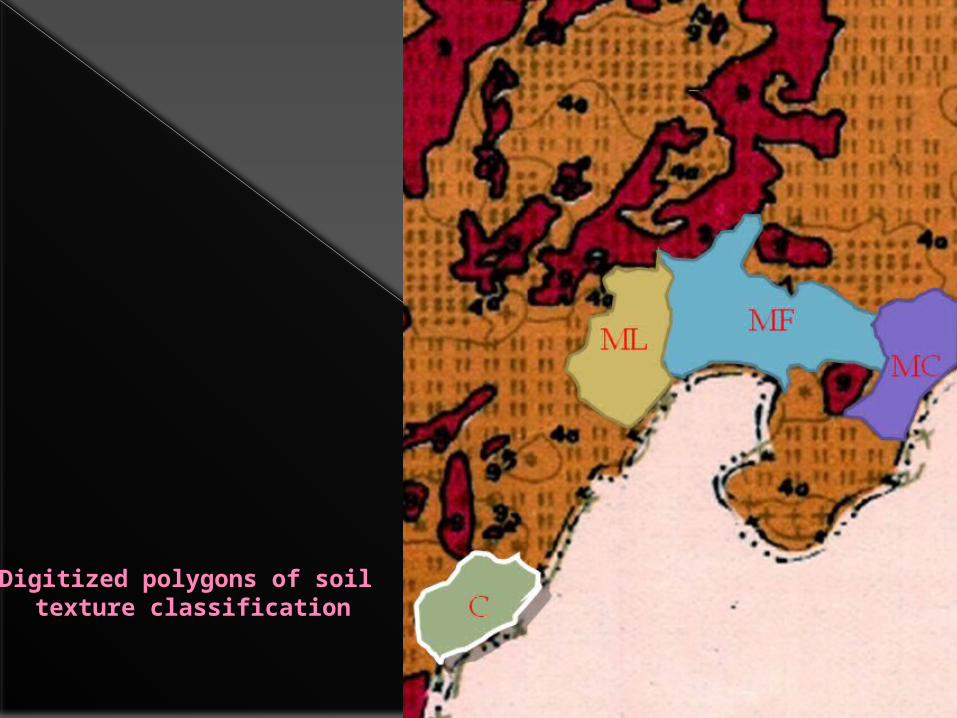
Digitized polygons of soil texture classification
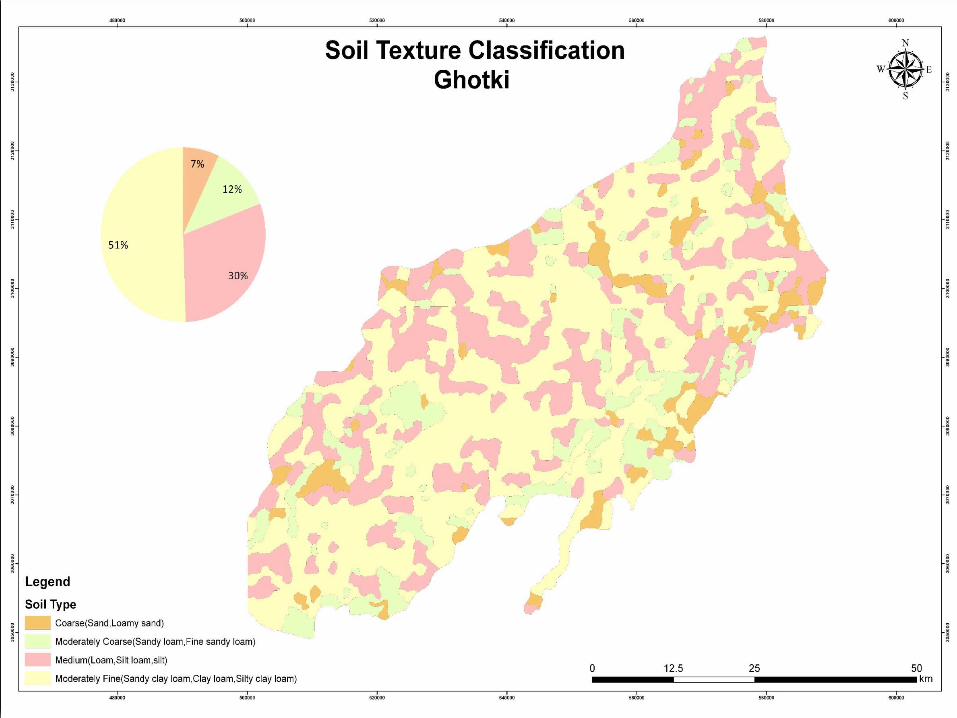
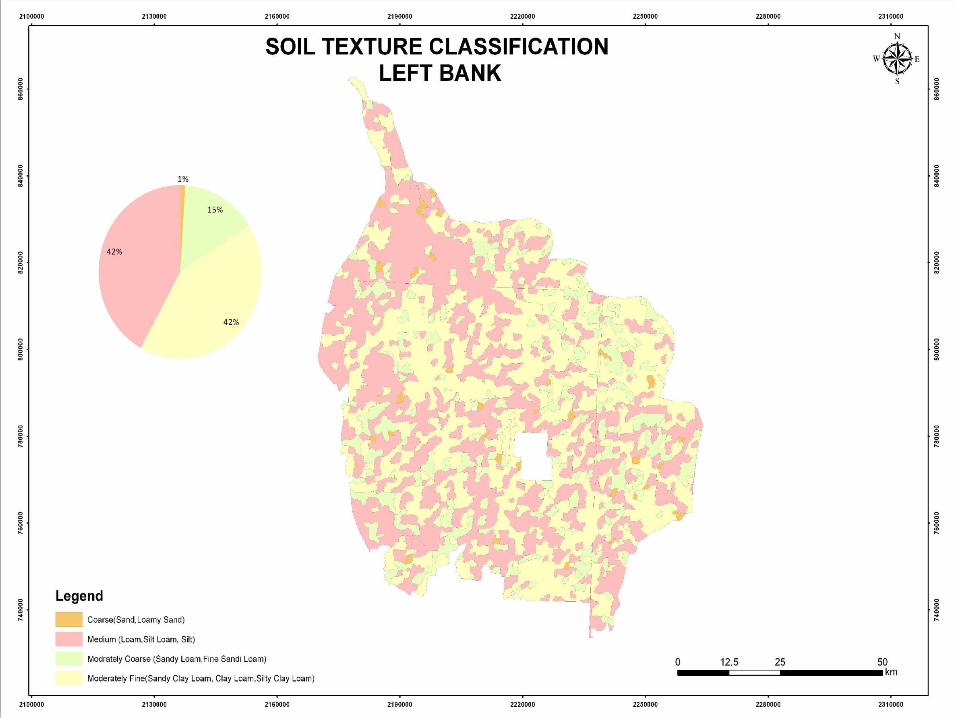
Identification of channel length passing through various textures
Length of Channels passing through various soil textures in each AWB
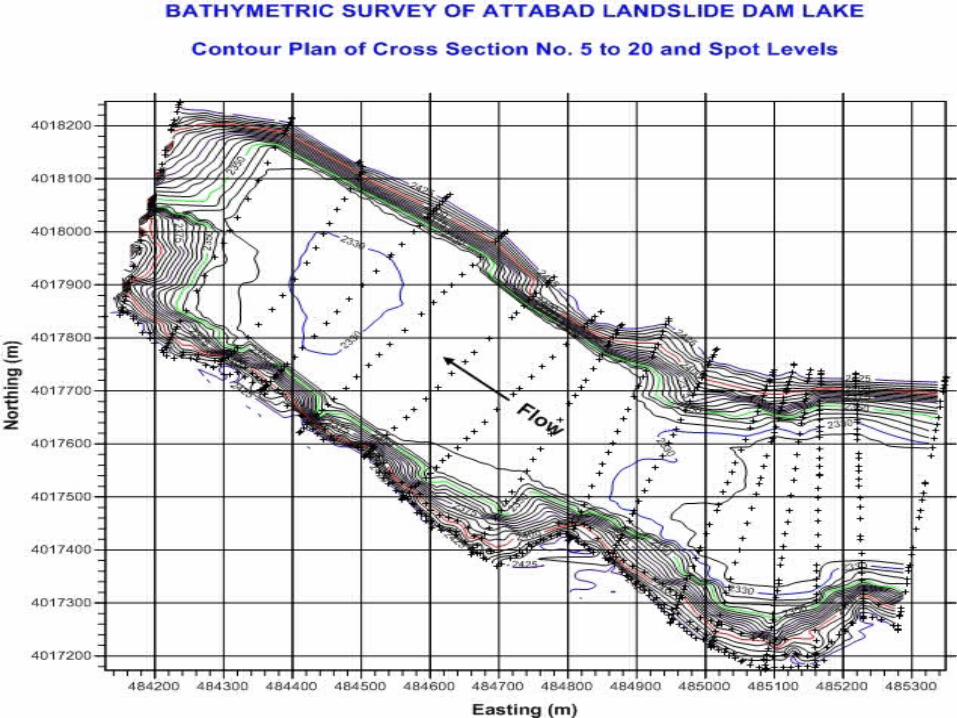
Bathymetric Survey Supervised the Bathymetric Survey of
Attabad Lake conducted by ISRIP for finding the appropriate location of intake for the proposed lake tap tunnel.
Layout and Location of Surveyed Cross Sections
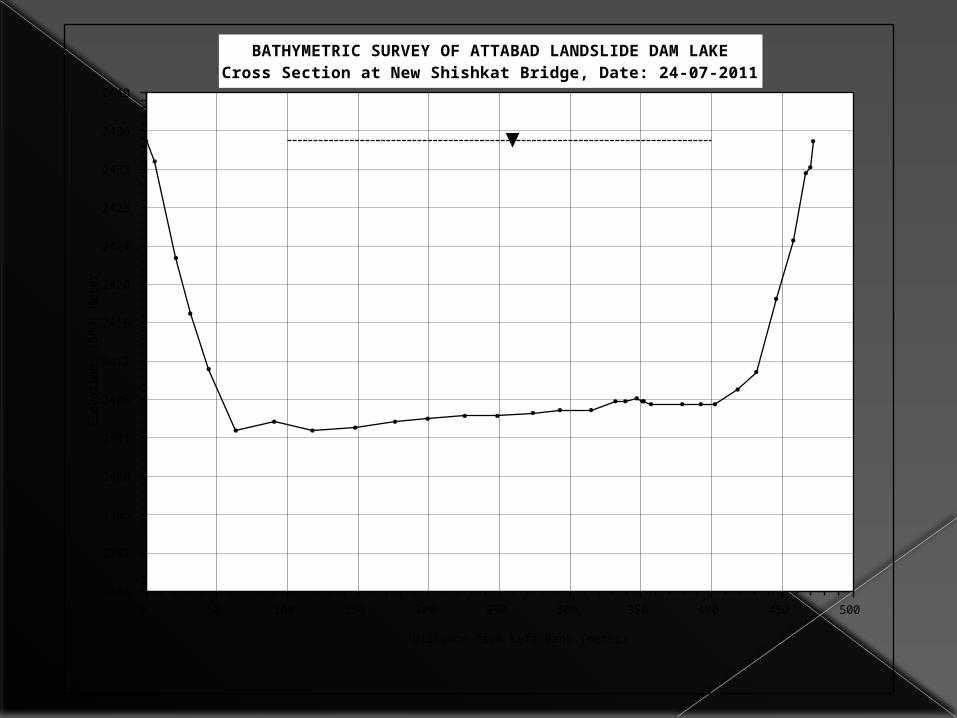
0 50 100 150 200 250 300 350 400 450 500 2388
2392
2396
2400
2404
2408
2412
2416
2420
2424
2428
2432
2436
2440
BATHYMETRIC SURVEY OF ATTABAD LANDSLIDE DAM LAKECross Section at New Shishkat Bridge, Date: 24-07-2011
Distance from Left Bank (meter)
Ele
vatio
n (S
PD
) Met
er
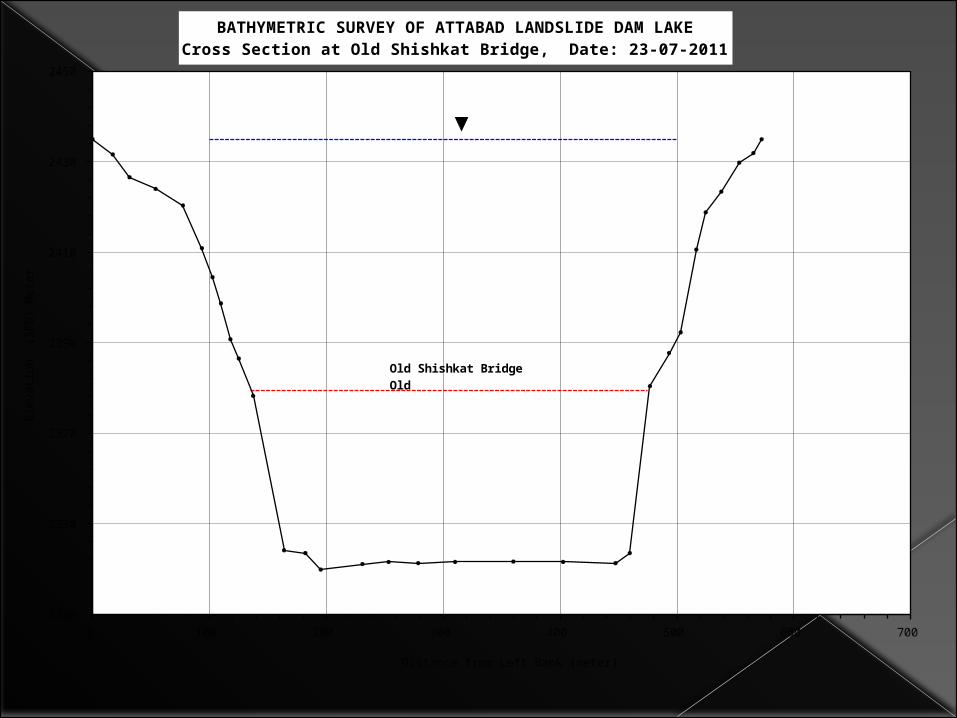
0 100 200 300 400 500 600 700 2330
2350
2370
2390
2410
2430
2450
BATHYMETRIC SURVEY OF ATTABAD LANDSLIDE DAM LAKECross Section at Old Shishkat Bridge, Date: 23-07-2011
Distance from Left Bank (meter)
Ele
vatio
n (S
PD
) Met
er
Old Shishkat Bridge Old


![47_Presentation [Kashif Latif]](https://img.pdfslide.net/doc/110x75/577d23101a28ab4e1e98e195/47presentation-kashif-latif.jpg)