Embed Size (px)
Citation preview

Presentation of H1 2018 results
KRUK Group
September 7th 2018

2
Agenda
Introduction
Debt market
Operating activities
Financial performance
Additional information

3
KRUK in H1 2018: strong cash generation and solid investments in
debt portfoliosNET PROFIT CASH EBITDA* RECOVERIES FROM PURCHASED
DEBT PORTFOLIOSINVESTMENTS
209221
205223
256
101
74
4
91 99
FY 2017: PLN 295m FY 2017: PLN 837m FY 2017: PLN 1,369m FY 2017: PLN 977m
338 347375 362
401
292
261
210
125
282
300
Q2 Q4 Q2 Q4 Q2 Q4 Q3 Q1 Q2 Q3 Q1 Q2 Q3 Q1 Q2 Q2 Q4 Q3 Q1 Q2
MARKET CAPITALISATION
Dec 31 2017: PLN 4.9bn
PORTFOLIO
CARRYING AMOUNT
Dec 31 2017: PLN 3.2bn
Dec 31 2016: PLN 2.7bn
NET DEBT/
EQUITY
Dec 31 2017: 1.2x
Dec 31 2016: 1.1x
NET MARGIN
FY 2017: 28%
*Cash EBITDA = EBITDA + recoveries from purchased debt portfolios - revenue from collection of purchased debt.
**Including PLN 6m from sale of properties as part of the debt management process.
***Data as at September 4th 2018.

4
In H1 2018, KRUK recorded continued growth in recoveries from its debt
portfolio. New investments came mainly from the Polish market
Net profit� Net profit for H1 2018 came in at PLN 189m, down 13% year on year.
� Net profit for Q2 2018 reached PLN 99m, down 3% on Q2 2017.
Record high
recoveries
� In H1 2018, recoveries amounted to PLN 763m*, which represented 56% of the recoveries figure for the
previous year.
� In the second quarter alone, KRUK recorded recoveries of PLN 401m, the best quarterly performance in its
history.
� Total repayments for the last four quarters were PLN 1.5bn.
� In H1 2018, the KRUK Group invested PLN 407m in debt portfolios with a total nominal value of PLN 2.5bn.
The value of investments in Q2 2018 alone reached PLN 282m, and the nominal value of purchased debt
was PLN 1.9bn.
� Most of the investments in the first six months of the year (72% of investments) were made in the Polish
market.
� After the end of the first half of the year, KRUK concluded an agreement to purchase a debt portfolio from
Servicios Financieros Carrefour of Spain, with a total nominal value of EUR 248m, won an auction to
purchase two consumer and SME debt portfolios with a total nominal value of PLN 500m in Poland, and an
auction to purchase a portfolio with a nominal value of over EUR 300m in the Italian market.
Portfolio
investments
Sound balance
sheet and good
access to financing
� With a net interest-bearing debt to equity ratio of 1.1x and flexible access to financing, KRUK is well
positioned to increase its investment activity in Europe.
Foreign expansion
� KRUK focuses on the continuous development of its operations in Italy and Spain. As at the end of June
2018, the number of KRUK employees in the two countries rose to more than 500.
� In April, KRUK acquired Agecredit srl, which employs 68 people. The transaction will fuel the growth of one
of the Group’s key business segments, which is the provision of third party debt collection services.
*Including PLN 6m from sale of properties as part of the debt management process.

5
Strategy for shareholders
Revision of
strategic options
� On July 9th 2018, KRUK announced a review of strategic options supporting further growth of the Group.
� The purpose of the review of strategic options is to choose the best way to achieving the Company’s long-
term objective of creating a leading player on the debt management market in Europe.
� As a result of the review, KRUK will either decide to continue working for its existing shareholders as a
listed company or will obtain the support of a financial investor, who will announce a tender offer for the
Company’s shares.
� The Management Board expects the review of strategic options to be completed by the end of 2018.
Dividend� On April 27th 2018, KRUK paid another dividend of PLN 5.00 per share, i.e. PLN 94.0m in total.
� KRUK started to pay out dividends in 2015. Since then, the Company’s shareholders received dividends
totalling more than PLN 190m.

6
20 years of KRUK’s history and 7 years of KRUK’s presence on the
WSE: Strong value growth based on healthy fundamentals
2011 2012 2013 2014 2015 2016 2017 CAGR
EPS (PLN) 4.03 4.80 5.77 8.95 11.84 14.08 15.74 25.5%
EPS growth rate 72.2% 19.1% 20.2% 55.1% 32.3% 18.9% 11.8% -
ROE rolling 27.9% 25.6% 23.5% 25.9% 26.0% 24.3%* 20.1% -
Net profit 66.4 81.2 97.8 151.8 204.3 248.7 295.2 28.2%
0
50
100
150
200
250
300
350
400
0
5
10
15
20
25
30
2011 2012 2013 2014 2015 2016 2017 2018
KRUK shares on the WSE***
Share price PLN 206.00
Change since IPO / 3M +419% / -9%
1Y Max/MinPLN 337.50 / PLN
170.00
Market capitalisation PLN 3.9bn
KRUK’s position on the WSE in terms of market
capitalisation: 38
Stock trading liquidity
Average daily trading
volumePLN 20.0m
Free float**** 78.7%
KRUK's position on the WSE in terms of liquidity: 9
KRUK share price and P/E ratio ** starting from the Company’s IPO on the WSE
KRUK share price (right axis)
P/E (left axis)
(*) Equity at end of period, excluding the share issue of December 2016.
(**) P/E – price-to-earnings ratio, calculated on the basis of performance in the last four quarters.
(***) Source: Stooq.com, GPWInfostrefa.pl, data as at September 4th 2018, or GPW.pl, data as at July 2018.
(****) Free float - shareholders with a holding of less than 10%.

7
In H1 2018, KRUK generated almost two thirds of its net profit for
the whole year 2017
Purchased debt portfolios Third party DC and other services**
647
722
763
H1 2017
H2 2017
H1 2018
Cash recoveries* (PLNm)
42
41
45
H1 2017
H2 2017
H1 2018
Revenues (PLNm)
506
471
407
H1 2017
H2 2017
H1 2018
Investments (PLNm)
17
13
15
H1 2017
H2 2017
H1 2018
Gross profit (PLNm)
(PLNm) H1 2017 18/17 H1 2018 2017 actual
Revenue 547.5 +10% 604.9 1,055.5 57%
EBIT 260.2 +3% 266.9 420.8 63%
Cash EBITDA 410.5 +17% 479.8 836.6 57%
Net profit 217.0 -13% 189.3 295.2 64%
ROE rolling 25.7% - 16.3% 20.2% -
*Including proceeds from sale of properties as part of the debt management process.
**ERIF Biuro Informacji Gospodarczej, Novum loans.

8
Agenda
Introduction
Debt market
Operating activities
Financial performance
Additional information
9
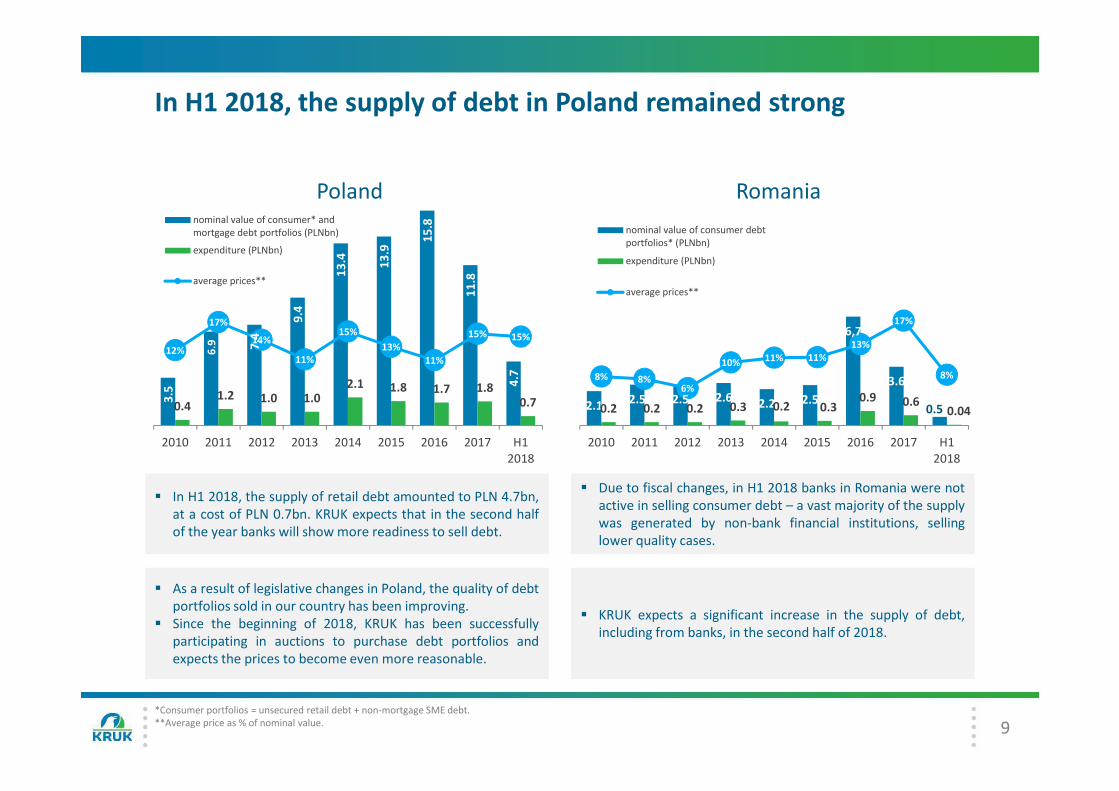
In H1 2018, the supply of debt in Poland remained strong
3.5
6.9 7,4
9.4
13
.4 13
.9
15
.8
11
.8
4.7
0.41.2 1.0 1.0
2.1 1.8 1.7 1.80.7
12%
17%
14%
11%
15%
13%
11%
15% 15%
0%
5%
10%
15%
20%
25%
30%
35%
40%
0
2
4
6
8
10
12
14
16
18
2010 2011 2012 2013 2014 2015 2016 2017 H1
2018
Polandnominal value of consumer* and
mortgage debt portfolios (PLNbn)
expenditure (PLNbn)
average prices**
2.12.5 2.5 2.6
2.2 2.5
6,7
3.6
0.50.2 0.2 0.2 0.3 0.2 0.30.9 0.6
0.04
8% 8%6%
10% 11% 11%
13%
17%
8%
0%
5%
10%
15%
20%
25%
30%
35%
40%
0
2
4
6
8
10
12
14
2010 2011 2012 2013 2014 2015 2016 2017 H1
2018
Romania
nominal value of consumer debt
portfolios* (PLNbn)
expenditure (PLNbn)
average prices**
� In H1 2018, the supply of retail debt amounted to PLN 4.7bn,
at a cost of PLN 0.7bn. KRUK expects that in the second half
of the year banks will show more readiness to sell debt.
� Due to fiscal changes, in H1 2018 banks in Romania were not
active in selling consumer debt – a vast majority of the supply
was generated by non-bank financial institutions, selling
lower quality cases.
� As a result of legislative changes in Poland, the quality of debt
portfolios sold in our country has been improving.
� Since the beginning of 2018, KRUK has been successfully
participating in auctions to purchase debt portfolios and
expects the prices to become even more reasonable.
� KRUK expects a significant increase in the supply of debt,
including from banks, in the second half of 2018.
*Consumer portfolios = unsecured retail debt + non-mortgage SME debt.
**Average price as % of nominal value.

10
Italy and Spain: much larger markets for sale of non-performing
debt portfolios than Poland
2132
81
138
95
0
20
40
60
80
100
120
140
160
180
200
2013 2014 2015 2016 2017
Italy (nominal value, PLNbn)
40
89
70
85 87
0
20
40
60
80
100
120
140
160
2013 2014 2015 2016 2017
Spain(nominal value, PLNbn)
� In recent years, Spanish banks have shown consistent and
significant interest in selling their non-performing debt
portfolios, at around PLN 80bn.
� Mixed portfolios, comprising primarily corporate debt,
represent the largest share of the debt market in Spain.
� The Spanish market, just like Italian, is characterised by a high
supply of debt in the second half of the year.
� In August, KRUK entered into an agreement to purchase a
portfolio of 100 thousand debt claims, with a total nominal
value of EUR 248m, from Servicios Financieros Carrefour.
� The supply of non-performing debts in 2017 amounted to
PLN 95bn, coming close to the PLN 100bn threshold for the
third consecutive time.
� In terms of supply, the Italian market was the most active of
all European markets.
� In the Italian market, the supply of debt reaches high levels in
the second half of the year.
� In September, KRUK won a tender to purchase a portfolio of
nearly 50 thousand cases, with a total nominal value of over
EUR 300m, from an Italian financial institutions.
Source: In-house analysis based on the Company's supply data and publicly available information. Supply of debt means the sum of debt portfolios sold at nominal value.

11
Agenda
Introduction
Debt market
Operating activities
Financial performance
Additional information

12
In H1 2018, KRUK invested PLN 407m, mainly in the Polish market
Nominal value of purchased debts (PLNm)
6,421
10,188
7,356
9,047
2,499
H1 2016
H2 2016
H1 2017
H2 2017
H1 201840,437
4,926
16,609 16,403
2499
2015 2016 2017 H1 2018
34,016
Investments in new debt portfolios (PLNm)% of the
price
727
558
506
471
407
H1 2016
H2 2016
H1 2017
H2 2017
H1 2018 3,15916%
489
1,286
977
407
2015 2016 2017 H1 2018
5%
7% 2,669
5%
11%
� During the first half of 2018, KRUK purchased 90 portfolios with a nominal value of PLN 2.5bn, for a total of PLN 407m. Most of the
investments (72%) was made in the Polish market, where KRUK purchased mainly better quality debt portfolios from non-banking
financial institutions.
� KRUK expects to intensify its purchasing activities in Poland and abroad in the second half of the year.
� After the end of the first half of the year, KRUK concluded an agreement to purchase a debt portfolio from Servicios Financieros
Carrefour of Spain, with a total nominal value of EUR 248m, won an auction to purchase two consumer and SME debt portfolios with
a total nominal value of PLN 500m in Poland, and an auction to purchase a portfolio with a value of over EUR 300m in the Italian
market.

13
Recoveries in H1 2018 reached a record-breaking level of PLN
763m, of which PLN 401m was received in the second quarter
332
95
45
230
292
164
215
135
127
28
222
100
238
49
68
13
142
88
64
19
H1
2016
H2
2016
H1
2017
H2
2017
H1
2018
KRUK's investments in debt
portfolios (PLNm)
Poland
Romania
Italy
Other
446
546
647
722
763
H1
2016
H2
2016
H1
2017
H2
2017
H1
2018
Recoveries from purchased
debt portfolios* (PLNm)
315
410
505
467
416 66
70
8
H1 2016
H2 2016
H1 2017
H2 2017
H1 2018
Portfolio revenue and costs (PLNm and as % of recoveries)
interest income
difference
between actual
and expected
recoveriesrevaluation
other 31%
25%
29%
31%
29%
560
3,125
� In H1 2018, a vast majority of the
investments in debt portfolios were
made in the Polish market.
� The Romanian market was not active
in H1 – KRUK is expecting the trend
to reverse in the second half of the
year.
� In the first half of 2018, recoveries
from purchased portfolios reached
PLN 763m, the highest level in the
Company’s history.
� KRUK benefits from improvement in
its operating efficiency and in the
macroeconomic environment in
Poland and Romania.
� KRUK changed the presentation of its
revenue by breaking it into interest
income, income from the difference
between actual and expected
recoveries, revaluations and other.
� The cost-to-recovery ratio in H1 2018
remained unchanged from the
previous year, due to higher costs of
court proceedings in Italy.
*Including proceeds from sale of properties as part of the debt management process.

14
The KRUK Group operates on seven European markets
Poland Romania Italy Other
275 262 287
152
292
2868
19
2017 H1 2018
3Revenue from purchased portfolios (PLNm)
502427
9 33
279229
35 18
* 1,743
2101
1
609
Portfolio carrying amount as at June 30th 2018 (total: PLN 3.4bn)
278
48%
26%17%
8%PLN 0.27bn
1
227
(*) Germany – employees of the Polish-German organisation included in total for Poland
- number of call centres - workforce
Investments (PLNm)
PLN 1.65bn
PLN 0.96bnPLN 0.59bn

15
Following the acquisition of Agecredit in Italy, KRUK has been
developing third party debt collection services on that market too,
after Poland, Romania and Spain
4.8
4.1
9.8
5.1
6.9
H1
2016
H2
2016
H1
2017
H2
2017
H1
2018
Gross profit on third-party
debt collection(PLNm)
15,6
16.6
30.5
28.6
31.7
H1
2016
H2
2016
H1
2017
H2
2017
H1
2018
Revenue and gross margin on
third-party debt collection(PLNm and as % of revenue)
2,148
2,982
8,921
5,795
9,117
H1
2016
H2
2016
H1
2017
H2
2017
H1
2018
Nominal value of debt under
management (PLNm) and commission
fees (PLNm and as % of nominal value)
31%
25%
32%
18%
22%
0.7%
0.6%
0.3%
0.5%
0.3%
� The increase in the nominal value of third party DC cases as well as rising revenues and margins are attributable to the acquisition of
servicing businesses in Spain (Espand) and Italy (Agecredit) and the effect of accounting for the 33% interest in the portfolio
purchased together with IFC.
� KRUK performs well on the competitive third party DC market by leveraging economies of scale and high operational efficiency.
� The third party DC business offers important synergies in combination with the debt purchasing business line.

16
NOVUM and ERIF BIG businesses are a source of major support to
the principal activities and positive contributors to overall
performance Novum year-on-year performance – financial highlights
(in PLNm and thousands of loans)� The NOVUM service is
dedicated to the KRUK
Group’s debtors in Poland
and Romania who have
repaid their debts or are
repaying them in a timely
manner, but bank loans
are not available to them.
� NOVUM grants consumer
loans of up to PLN 10,000
for periods from 3 to 30
months.
7.0
13.1
4.3
7.0
H1 2018 2017
revenue gross profit
23.2 45.9
3.4
8.0
-
10,0
20,0
30,0
40,0
50,0
-
2,0
4,0
6,0
8,0
10,0
12,0
H1 2018 2017
gross value
number of loans
ERIF Biuro Informacji Gospodarczej – financial highlights
5.7
10.7
3.9
7.3
H1 2018 2017
revenue gross profit
40.2
36.0
41.0
32.0
-
10,0
20,0
30,0
40,0
50,0
-
10,0
20,0
30,0
40,0
50,0
H1 2018 2017
value of cases (PLNbn)
� ERIF BIG's revenue
reached PLN 5.7m, with
gross profit at 68%.
� The base rose
significantly after the
company entered into
cooperation with a large
partner from the telecom
market.

17
Agenda
Introduction
Debt market
Operating activities
Financial performance
Additional information

18
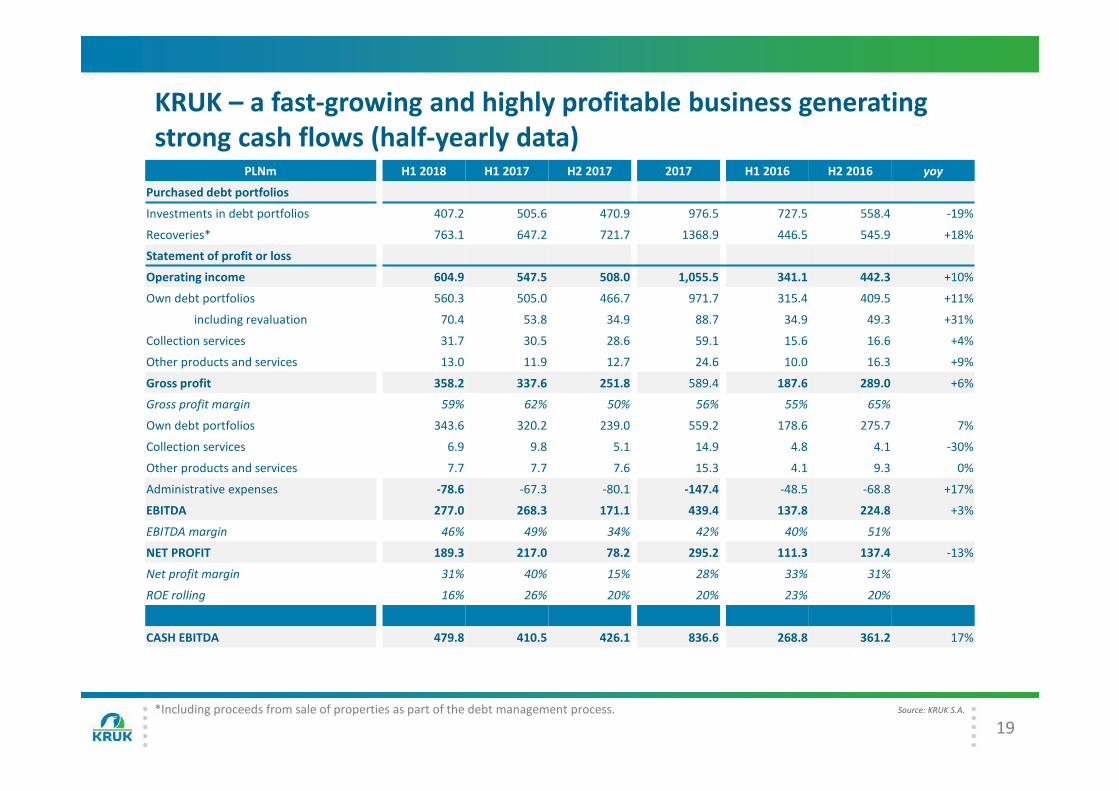
KRUK – a fast-growing and highly profitable business generating
strong cash flows (quarterly data)
PLNm Q1 2018 Q2 2018 H1 2018 Q1 2017 Q2 2017 H1 2017Q2 2018/
Q2 2017
H1 2018/
H1 2017
Purchased debt portfolios
Investments in debt portfolios 125.4 281.8 407.2 213.5 292.1 505.6 -4% -19%
Recoveries* 362.4 400.7 763.1 309.3 337.9 647.2 +19% +18%
Statement of profit or loss
Operating income 285.3 319.6 604.9 264.1 283.4 547.5 +13% +10%
Own debt portfolios 264.4 295.9 560.3 242.6 262.4 505.0 +13% +11%
including revaluation 22.9 47.5 70.4 28.7 25.1 53.8 +89% +31%
Collection services 14.5 17.2 31.7 15.8 14.7 30.5 +17% +4%
Other products and services 6.4 6.6 13.0 5.7 6.2 11.9 +6% +9%
Gross profit 164.3 193.9 358.2 166.6 171.0 337.6 +13% +6%
Gross profit margin 58% 58% 59% 63% 60% 62%
Own debt portfolios 157.3 186.3 343.6 157.4 162.8 320.2 +14% 7%
Collection services 3.1 3.8 6.9 5.6 4.2 9.8 -10% -30%
Other products and services 4.0 3.7 7.7 3.6 4.1 7.7 -10% +0%
Overheads -38.2 -40.4 -78.6 -30.4 -36.9 -67.3 +9% +17%
EBITDA 125.0 152.0 277.0 135.1 133.2 268.3 +14% +3%
EBITDA margin 44% 48% 46% 51% 47% 49%
NET PROFIT 90.7 98.6 189.3 115.5 101.5 217.0 -3% -13%
Net profit margin 32% 31% 31% 44% 36% 40%
ROE rolling 17% 16% 16% 23% 26% 26%
CASH EBITDA 223.0 256.8 479.8 201.8 208.7 410.5 +23% +17%
*Including proceeds from sale of properties as part of the debt management process. Source: KRUK S.A.
19
KRUK – a fast-growing and highly profitable business generating
strong cash flows (half-yearly data) PLNm H1 2018 H1 2017 H2 2017 2017 H1 2016 H2 2016 yoy
Purchased debt portfolios
Investments in debt portfolios 407.2 505.6 470.9 976.5 727.5 558.4 -19%
Recoveries* 763.1 647.2 721.7 1368.9 446.5 545.9 +18%
Statement of profit or loss
Operating income 604.9 547.5 508.0 1,055.5 341.1 442.3 +10%
Own debt portfolios 560.3 505.0 466.7 971.7 315.4 409.5 +11%
including revaluation 70.4 53.8 34.9 88.7 34.9 49.3 +31%
Collection services 31.7 30.5 28.6 59.1 15.6 16.6 +4%
Other products and services 13.0 11.9 12.7 24.6 10.0 16.3 +9%
Gross profit 358.2 337.6 251.8 589.4 187.6 289.0 +6%
Gross profit margin 59% 62% 50% 56% 55% 65%
Own debt portfolios 343.6 320.2 239.0 559.2 178.6 275.7 7%
Collection services 6.9 9.8 5.1 14.9 4.8 4.1 -30%
Other products and services 7.7 7.7 7.6 15.3 4.1 9.3 0%
Administrative expenses -78.6 -67.3 -80.1 -147.4 -48.5 -68.8 +17%
EBITDA 277.0 268.3 171.1 439.4 137.8 224.8 +3%
EBITDA margin 46% 49% 34% 42% 40% 51%
NET PROFIT 189.3 217.0 78.2 295.2 111.3 137.4 -13%
Net profit margin 31% 40% 15% 28% 33% 31%
ROE rolling 16% 26% 20% 20% 23% 20%
CASH EBITDA 479.8 410.5 426.1 836.6 268.8 361.2 17%
*Including proceeds from sale of properties as part of the debt management process. Source: KRUK S.A.

20
The KRUK Group – P&L by geographical segments (presentation
format)
PLNm H1 2018 H1 2017 H2 2017 2017 H1 2016 H2 2016 yoy
Operating income 604.9 547.5 508.0 1,055.5 341.1 442.3 +10%
Poland 304.3 273.0 278.9 551.9 174.0 249.8 +11%
Romania 233.5 202.2 234 436.2 143.0 168.9 +15%
Italy 39.2 33.1 -19.8 13.3 +18%
Other countries 27.9 39.2 14.9 54.1 24.1 14.5 -29%
Gross profit 358.2 337.6 251.8 589.4 187.6 289.0 +6%
Gross profit margin 59% 62% 50% 56% 55% 65%
Overheads -78.6 -67.3 -80.6 -147.9 -48.5 -68.8 +17%
EBITDA 277 268.3 171.1 439.4 137.8 224.8 +3%
EBITDA margin 46% 49% 34% 42% 40% 51%
Finance income/costs -66.5 -37.7 -47.9 -85.6 -20.0 -42.7 +76%
Net profit 189.3 217.0 78.2 295.2 111.3 137.4 -13%
Net profit margin 31% 40% 15% 28% 33% 31%
Source: KRUK S.A.

21
The KRUK Group – strong cash flows supporting high liquidity of
operations
PLNm H1 2018 H1 2017 H2 2017 2017 H1 2016 H2 2016 yoy
Cash flows from operating activities: 427.1 296.2 345.2 641.4 254.2 317.9 44%
Recoveries from debtors − purchased debt porMolios* 763.1 647.2 721.7 1,368.9 446.5 545.9 +18%
OperaNng costs − purchased debt porMolios -219.7 -184.9 -227.6 -412.5 -136.8 -133.4 +19%
OperaNng margin − third party DC 6.9 9.8 5.1 14.9 4.8 4.1 -30%
Administrative expenses -78.6 -67.3 -80.6 -147.9 -48.5 -68.8 +17%
Other operating cash flow -43.9 -108.6 -73.4 -182.0 -11.7 -30.3 -60%
Cash flows from investing activities: -418.6 -511.0 -485.4 -996.4 -738.6 -622.8 -18%
Investments in debt portfolio purchases -407.2 -505.6 -470.9 -976.5 -730.7 -555.2 -19%
Other investing cash flow -11.4 -5.4 -14.5 -19.9 -7.9 -67.6 +110%
Cash flows from financing activities -19.3 67.5 193.5 261.0 481.4 434.5 -129%
Issue of shares 0.0 0.0 0 0.0 0.0 215.0
Increase in borrowings and lease liabilities 716.0 696.8 536.6 1,233.4 761.9 828.5 +3%
Issue of bonds 0.0 168.5 -0.1 168.4 457.9 375.4 -100%
Decrease in borrowings and lease liabilities -603.6 -678.3 -327.6 -1,005.9 -779.7 -777.3 -11
Redemption of bonds -15.0 -120.0 -15 -135.0 -84.0 -70 -88%
Other financing cash flow -116.7 0.5 -0.4 0.1 125.3 -141.8
Net cash flows: -10.8 -147.3 53.2 -94.1 -2.9 129.5 -93%
*Including proceeds from sale of properties as part of the debt management process. Source: KRUK S.A.

22
The KRUK Group – selected items of the statement of financial
position (presentation format)
PLNm Jun 30 2018 Dec 31 2017 Jun 30 2017
ASSETS
Cash and cash equivalents 162.5 173.3 120.1
Investments in debt portfolios and loans 3,486.2 3,169.3 2,985.7
Other assets 200.1 217.5 177.3
Total assets 3,848.8 3,560.1 3,283.1
EQUITY AND LIABILITIES
Equity 1,646.1 1,460.5 1,380.7
of which: Retained earnings 1,235.3 1,112.0 1,033.8
Liabilities 2,202.7 2,099.6 1,902.4
of which: Bank loans and leases 612.0 499.0 297.0
Bonds 1,394.9 1,398.3 1,411.4
Total equity and liabilities 3,848.8 3,560.1 3,283.1
METRICS
Interest-bearing debt 2,006.9 1,897.2 1,708.5
Net interest-bearing debt 1,844.4 1,723.9 1,588.4
Net interest-bearing debt to equity 1.1 1.2 1.1
Interest-bearing debt to 12-month cash EBITDA 2.0 2.1 2.1
Source: KRUK S.A.

23
KRUK has ample room on its balance sheet and enjoys access to
healthy financing sources to fund further investments
3,187
425
2,076
1,589
Assets Equity and liabilities
115208
212
5404501,413 1,298
1,086
997457
2018 2019 2020 2021 2022
Net debt/equity 1.1x
Net debt/cash EBITDA: 2.0x
1,398
603
1,109
Kategoria 1
Bank
loans % 1M/3M WIBOR + 1.0−2.25pp
1M/3M EURIBOR + 2.2−3.25ppPLN 1,712m, including
75% available also in EUROther
assets
Equity
%3M WIBOR + 2.5-4.5 pp
Fixed rate: 3.0-4.5 pp
in PLN: PLN 1,136m
in EUR: PLN 262mBonds
Amount available (undrawn)
under credit facilities
Debt under bank loans (drawn)
Liabilities under bank
loans and bonds*As at Jun 30 2018 (planned for redemption in the given year, balance at end of period)
Investments in debt
portfoliosBonds outstanding* Planned for redemptionLiabilities
* Nominal value.

24
Agenda
Introduction
Debt market
Operating activities
Financial performance
Additional information
25
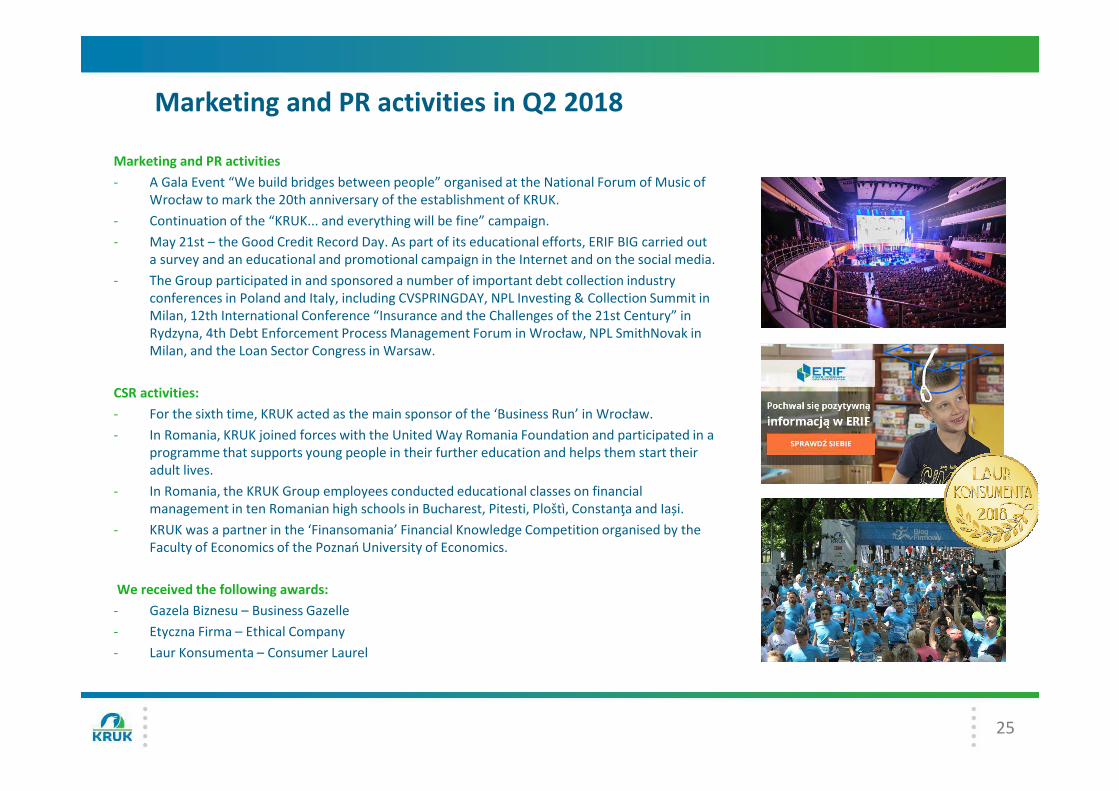
Marketing and PR activities in Q2 2018
Marketing and PR activities
- A Gala Event “We build bridges between people” organised at the National Forum of Music of
Wrocław to mark the 20th anniversary of the establishment of KRUK.
- Continuation of the “KRUK... and everything will be fine” campaign.
- May 21st – the Good Credit Record Day. As part of its educational efforts, ERIF BIG carried out
a survey and an educational and promotional campaign in the Internet and on the social media.
- The Group participated in and sponsored a number of important debt collection industry
conferences in Poland and Italy, including CVSPRINGDAY, NPL Investing & Collection Summit in
Milan, 12th International Conference “Insurance and the Challenges of the 21st Century” in
Rydzyna, 4th Debt Enforcement Process Management Forum in Wrocław, NPL SmithNovak in
Milan, and the Loan Sector Congress in Warsaw.
CSR activities:
- For the sixth time, KRUK acted as the main sponsor of the ‘Business Run’ in Wrocław.
- In Romania, KRUK joined forces with the United Way Romania Foundation and participated in a
programme that supports young people in their further education and helps them start their
adult lives.
- In Romania, the KRUK Group employees conducted educational classes on financial
management in ten Romanian high schools in Bucharest, Pitesti, Ploštì, Constanţa and Iași.
- KRUK was a partner in the ‘Finansomania’ Financial Knowledge Competition organised by the
Faculty of Economics of the Poznań University of Economics.
We received the following awards:
- Gazela Biznesu – Business Gazelle
- Etyczna Firma – Ethical Company
- Laur Konsumenta – Consumer Laurel

26
IR events
Most recent recommendations Financial statements release dates in 2018
Date Financial statements
March 19th 2017 full-year financial statements
April 26th Q1 2018 financial statements
September 7th H1 2018 financial statements
October 28th Q3 2018 financial statements
Date Institution Recommendation Target price
July 2018 DM Trigon hold 220.0
April 2018 DM BDM buy 301.0
March 2018 Vestor buy 286.0
For more details, go to:
pl.kruk.eu/relacje-inwestorskie/raporty/raporty-analityczne
Selected IR events planned for 2018
Sell-side analysts covering KRUKDate Event
Mar 21-22 [London] PKO BP Polish Capital Market Conference
Mar 21-22 [Frankfurt, Vienna] Investor meetings
Mar 26-27 [Boston, NYC] Investor meetings
Apr 10 [Stockholm] Wood Polish Innovation & Growth Conference
May 23-
24
[New York] Wood CEE Investor Days 2018 Conference
May 25-
27
[Karpacz, Poland] Wall Street 2018 Conference
Jun 13-14 [Warsaw] Wood Emerging Europe Financials Conference
Sep 11 [Warsaw] Pekao IB/Emerging Europe Conference
Oct 1 [Bucharest] Raiffeisen Polish Day in Bucharest
Oct 5 [Warsaw] mBank Conference
Oct 11 [Stegersbach] Erste Investor Conference
Oct 29-30 [New York] Auerbach Frontier & Emerging Conference
Dec 6-7 [Prague] Wood Winter 2018 conference
Institution Analyst Email address
DM BDM Maciej Bobrowski [email protected]
DM BZ WBK Dariusz Górski [email protected]
Vestor DM Michał Fidelus [email protected]
Erste Group Mateusz Krupa [email protected]
Pekao IB Kamil Stolarski [email protected]
Ipopema Łukasz Jańczak [email protected]
JP Morgan Michał Kuzawiński [email protected]
DM mBanku Michał Konarski [email protected]
DM PKO BP Jaromir Szortyka [email protected]
DM Trigon Grzegorz Kujawski [email protected]
Wood & Co. Jerzy Kosiński [email protected]

KRUK S.A.ul. Wołowska 8
51-116 Wrocław, Poland
www.kruksa.pl
Investor Relations: [email protected]
For investors: www.kruksa.pl/dla-inwestora


![?dgZYd ÕfYf[aYd k]jna[]k ljYfkY[lagf egfalgj · * ?dgZYd ÔfYf[aYd k]jna[]k ljYfkY[lagf egfalgj C]q Õf\af_k H1 2010 H2 2010 H1 2011 H2 2011 H1 2012 H2 2012 H1 2013 1,181 1,230 1,160](https://img.pdfslide.net/doc/110x75/5e29c583ae2c1865e9329bbf/dgzyd-fyfayd-kjnak-ljyfkylagf-egfalgj-dgzyd-fyfayd-kjnak-ljyfkylagf.jpg)