Embed Size (px)
Citation preview
Presentation of NORDEN | 1 Our business is global tramp shipping
PRESENTATION OF NORDEN
Jyske Bank
Company Day
27 November 2014
CFO Michael Tønnes Jørgensen

Presentation of NORDEN | 2 Our business is global tramp shipping
AGENDA
NORDEN at a glance
Group highlights
Financials
Dry Cargo
Tankers
2014 expectations
Q & A
Presentation of NORDEN | 3 Our business is global tramp shipping
0
25
50
75
100
125
150
175
200
225
250
275
300
1871
1874
1877
1880
1883
1886
1889
1892
1895
1898
1901
1904
1907
1910
1913
1916
1919
1922
1925
1928
1931
1934
1937
1940
1943
1946
1949
1952
1955
1958
1961
1964
1967
1970
1973
1976
1979
1982
1985
1988
1991
1994
1997
2000
2003
2006
2009
2011
2014
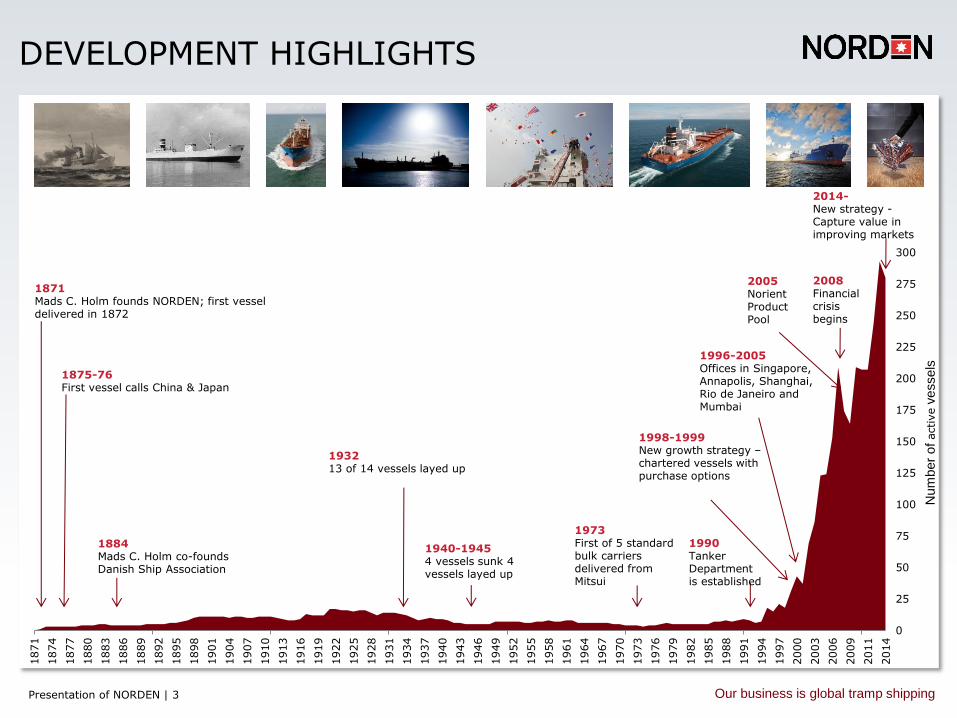
DEVELOPMENT HIGHLIGHTS
Num
ber
of active v
essels
2005 Norient Product Pool
1871 Mads C. Holm founds NORDEN; first vessel delivered in 1872
1875-76 First vessel calls China & Japan
1990 Tanker Department is established
1884 Mads C. Holm co-founds Danish Ship Association
1996-2005 Offices in Singapore, Annapolis, Shanghai, Rio de Janeiro and Mumbai
1973 First of 5 standard bulk carriers delivered from Mitsui
1998-1999 New growth strategy – chartered vessels with purchase options
1932 13 of 14 vessels layed up
1940-1945 4 vessels sunk 4 vessels layed up
2008 Financial crisis begins
2014- New strategy - Capture value in improving markets
Presentation of NORDEN | 4 Our business is global tramp shipping
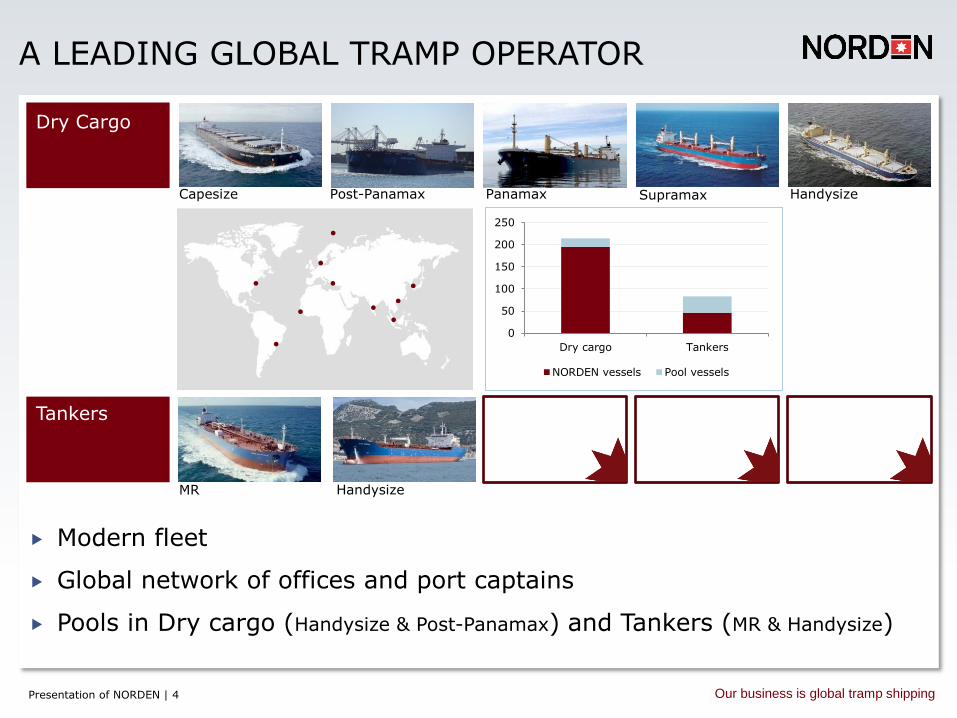
A LEADING GLOBAL TRAMP OPERATOR
Modern fleet
Global network of offices and port captains
Pools in Dry cargo (Handysize & Post-Panamax) and Tankers (MR & Handysize)
Capesize Post-Panamax Panamax Supramax Handysize
Dry Cargo
MR
Tankers
Handysize
0
50
100
150
200
250
Dry cargo Tankers
NORDEN vessels Pool vessels
Presentation of NORDEN | 5 Our business is global tramp shipping
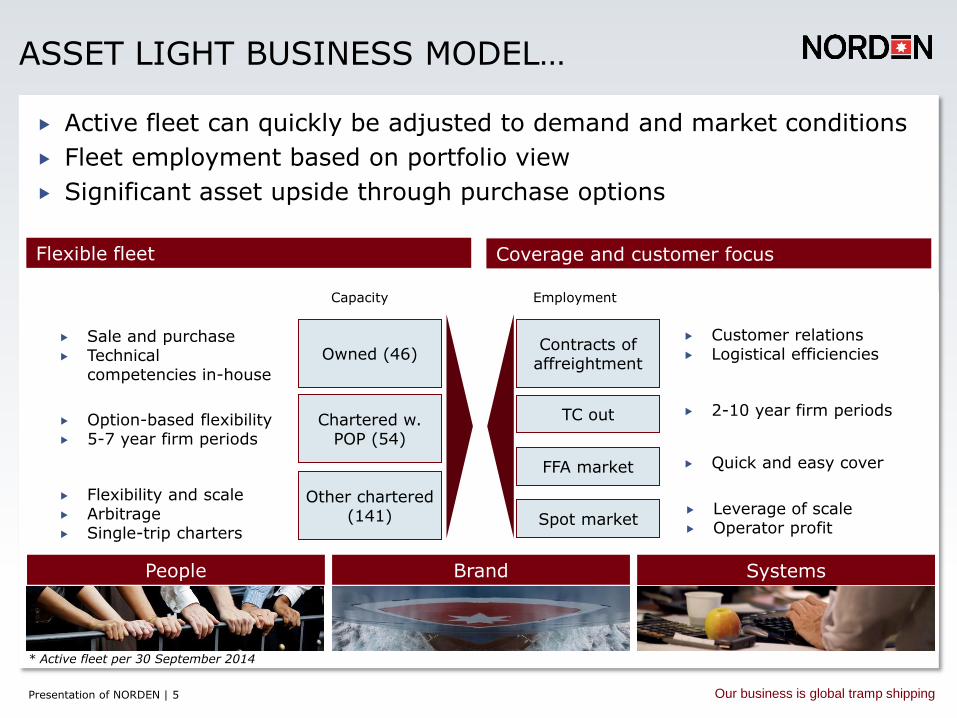
ASSET LIGHT BUSINESS MODEL…
Sale and purchase Technical
competencies in-house
Owned (46)
Chartered w. POP (54)
Other chartered (141)
Capacity
Option-based flexibility 5-7 year firm periods
Flexibility and scale Arbitrage Single-trip charters
Contracts of affreightment
TC out
FFA market
Employment
Spot market
Customer relations Logistical efficiencies
2-10 year firm periods
Quick and easy cover
* Active fleet per 30 June 2011
Active fleet can quickly be adjusted to demand and market conditions
Fleet employment based on portfolio view
Significant asset upside through purchase options
Coverage and customer focus Flexible fleet
Brand People Systems
* Active fleet per 30 September 2014
Leverage of scale Operator profit
Presentation of NORDEN | 6 Our business is global tramp shipping
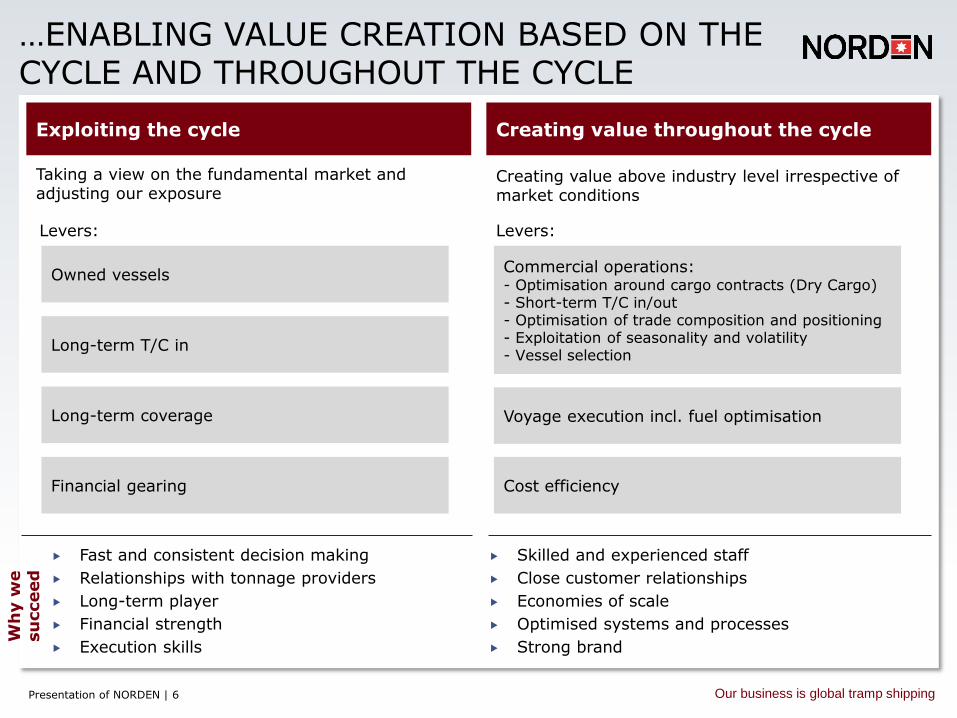
…ENABLING VALUE CREATION BASED ON THE CYCLE AND THROUGHOUT THE CYCLE
Taking a view on the fundamental market and adjusting our exposure
Exploiting the cycle Creating value throughout the cycle
Owned vessels
Long-term T/C in
Long-term coverage
Financial gearing
Levers:
Creating value above industry level irrespective of market conditions
Wh
y w
e
su
cceed
Fast and consistent decision making
Relationships with tonnage providers
Long-term player
Financial strength
Execution skills
Skilled and experienced staff
Close customer relationships
Economies of scale
Optimised systems and processes
Strong brand
Commercial operations: - Optimisation around cargo contracts (Dry Cargo) - Short-term T/C in/out - Optimisation of trade composition and positioning - Exploitation of seasonality and volatility - Vessel selection
Voyage execution incl. fuel optimisation
Cost efficiency
Levers:

Presentation of NORDEN | 7 Our business is global tramp shipping
LAST 5 YEARS PERFORMANCE
Return on equity
Dividend yield
Earnings per share (USD)
Cash flows, operations and investments (USDm)
5,2 5,8
2,1
-6,8
-1,2
2009 2010 2011 2012 2013
12,4% 12,9%
4,4%
-15,1%
-2,9%
2009 2010 2011 2012 2013
160
298
120 122 -9
-80
-380 -355
7
-103
2009 2010 2011 2012 2013
Cash from operations Net cash from investments
3,3%
4,0%
3,0%
1,8% 1,8%
2009 2010 2011 2012 2013
Presentation of NORDEN | 8 Our business is global tramp shipping
Q3 HIGHLIGTS
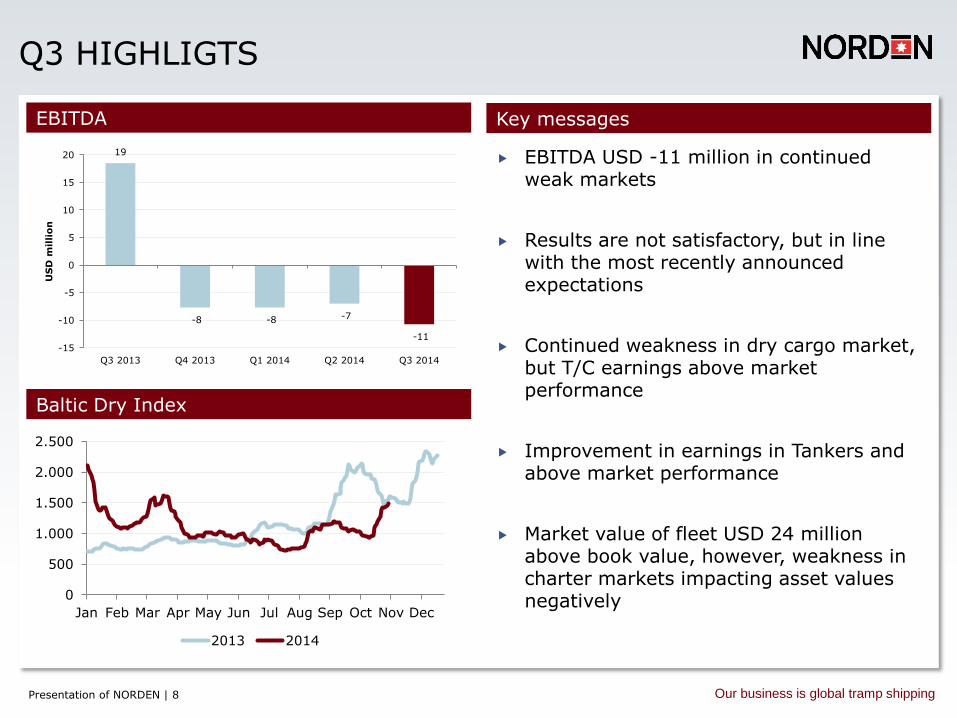
EBITDA USD -11 million in continued weak markets
Results are not satisfactory, but in line with the most recently announced expectations
Continued weakness in dry cargo market, but T/C earnings above market performance
Improvement in earnings in Tankers and above market performance
Market value of fleet USD 24 million above book value, however, weakness in charter markets impacting asset values negatively
Key messages EBITDA
Baltic Dry Index
19
-8 -8 -7
-11
-15
-10
-5
0
5
10
15
20
Q3 2013 Q4 2013 Q1 2014 Q2 2014 Q3 2014
US
D m
illi
on
0
500
1.000
1.500
2.000
2.500
Jan Feb Mar Apr May Jun Jul Aug Sep Oct Nov Dec
2013 2014
Presentation of NORDEN | 9 Our business is global tramp shipping
10
-14 -15
-6
-16 -20
-15
-10
-5
0
5
10
15
Q3 13 Q4 13 Q1 14 Q2 14 Q3 14
US
D m
illi
on
Dry Cargo
FINANCIALS
POOR MARKET BUT STRONG PERFORMANCE IN BOTH DRY CARGO AND PRODUCT TANKERS
EBITDA
NORDEN’s performance vs. 1-year T/C
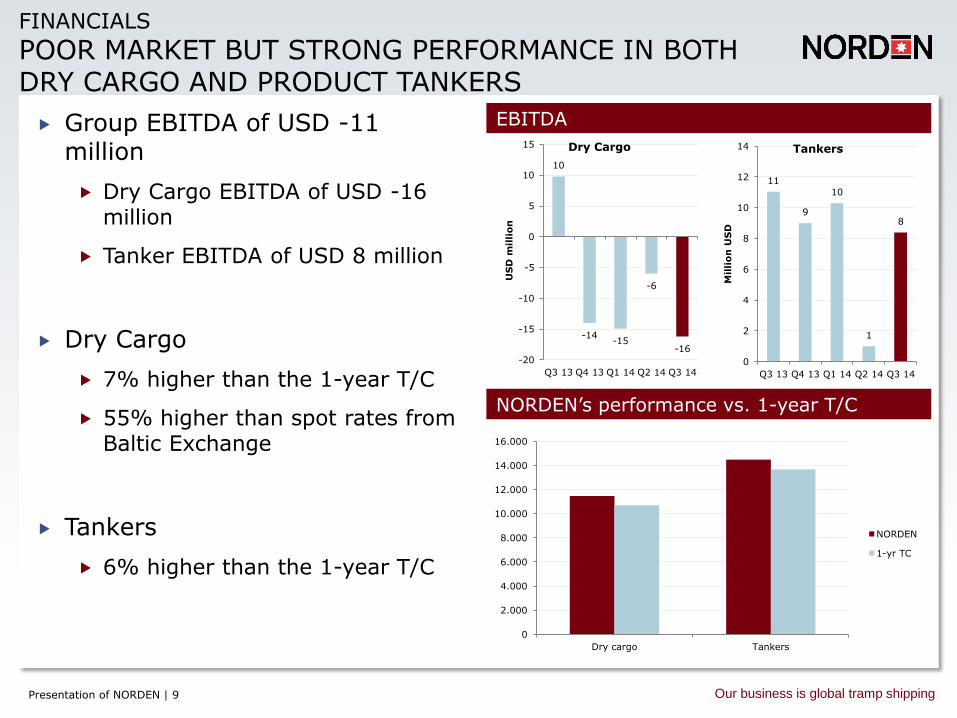
Group EBITDA of USD -11 million
Dry Cargo EBITDA of USD -16 million
Tanker EBITDA of USD 8 million
Dry Cargo
7% higher than the 1-year T/C
55% higher than spot rates from Baltic Exchange
Tankers
6% higher than the 1-year T/C
0
2.000
4.000
6.000
8.000
10.000
12.000
14.000
16.000
Dry cargo Tankers
NORDEN
1-yr TC
11
9
10
1
8
0
2
4
6
8
10
12
14
Q3 13 Q4 13 Q1 14 Q2 14 Q3 14
Mil
lio
n U
SD
Tankers
Presentation of NORDEN | 10 Our business is global tramp shipping
FINANCIALS
IMPROVEMENT IN CASH FLOW FROM OPERATIONS
Gearing
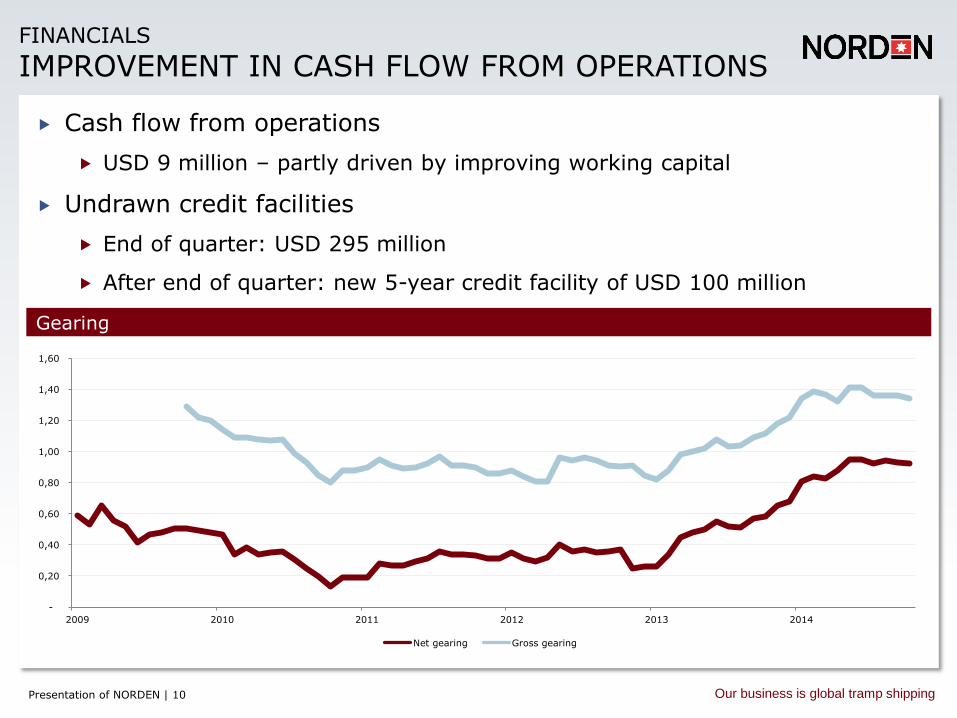
Cash flow from operations
USD 9 million – partly driven by improving working capital
Undrawn credit facilities
End of quarter: USD 295 million
After end of quarter: new 5-year credit facility of USD 100 million
-
0,20
0,40
0,60
0,80
1,00
1,20
1,40
1,60
2009 2010 2011 2012 2013 2014
Net gearing Gross gearing
Presentation of NORDEN | 11 Our business is global tramp shipping
FINANCIALS
MARKET VALUE OF FLEET STILL ABOVE BOOK VALUES
Added value in fleet (incl. joint ventures) 5-year secondhand prices
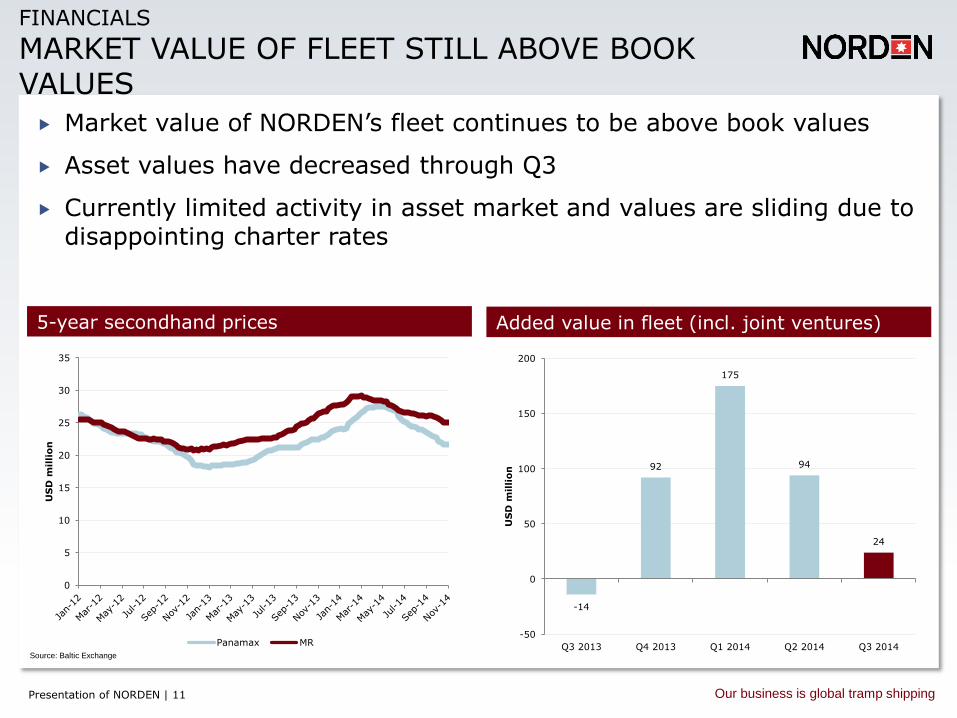
Market value of NORDEN’s fleet continues to be above book values
Asset values have decreased through Q3
Currently limited activity in asset market and values are sliding due to disappointing charter rates
Source: Baltic Exchange
-14
92
175
94
24
-50
0
50
100
150
200
Q3 2013 Q4 2013 Q1 2014 Q2 2014 Q3 2014
US
D m
illi
on
0
5
10
15
20
25
30
35
US
D m
illi
on
Panamax MR
Presentation of NORDEN | 12 Our business is global tramp shipping
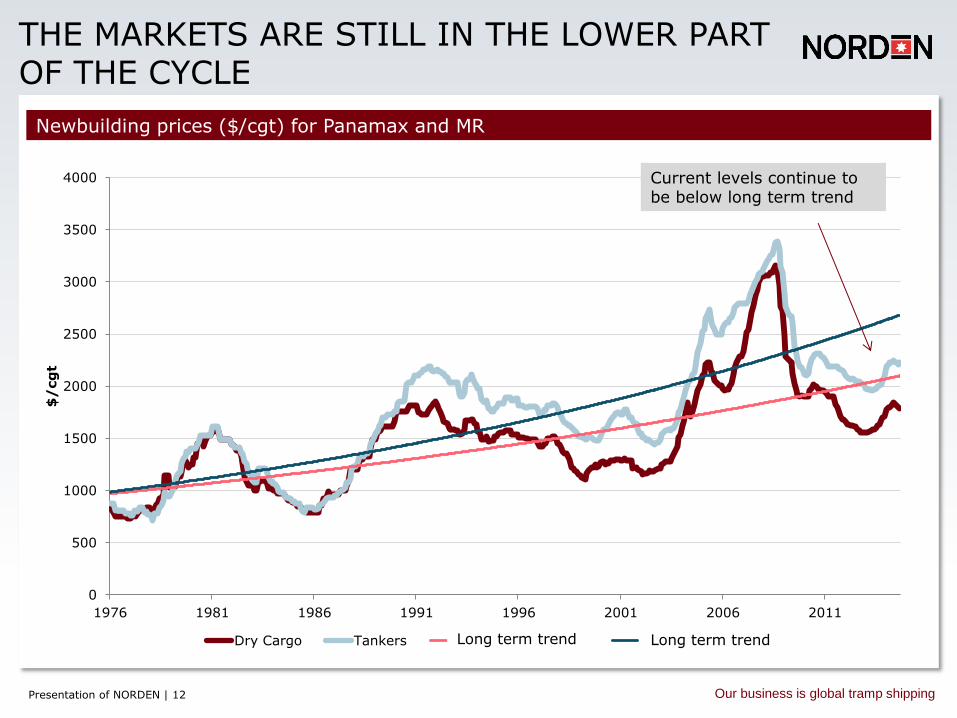
THE MARKETS ARE STILL IN THE LOWER PART OF THE CYCLE
Newbuilding prices ($/cgt) for Panamax and MR
0
500
1000
1500
2000
2500
3000
3500
4000
1976 1981 1986 1991 1996 2001 2006 2011
$/
cg
t
Dry Cargo Tankers Expon. (Dry Cargo) Expon. (Tankers)Long term trend Long term trend
Current levels continue to be below long term trend
Presentation of NORDEN | 13 Our business is global tramp shipping
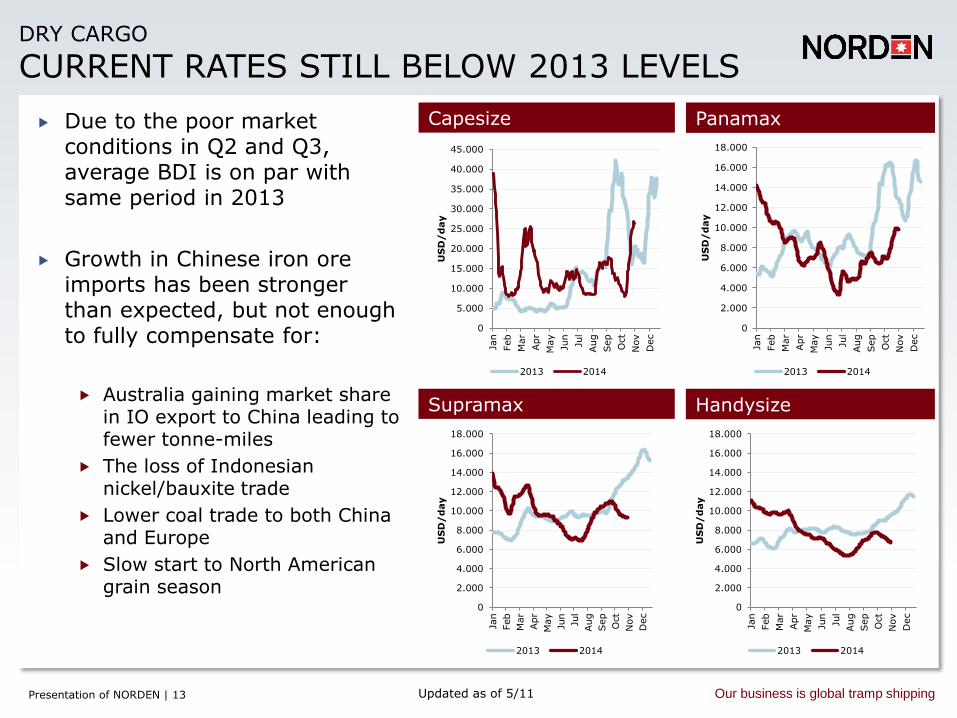
DRY CARGO
CURRENT RATES STILL BELOW 2013 LEVELS
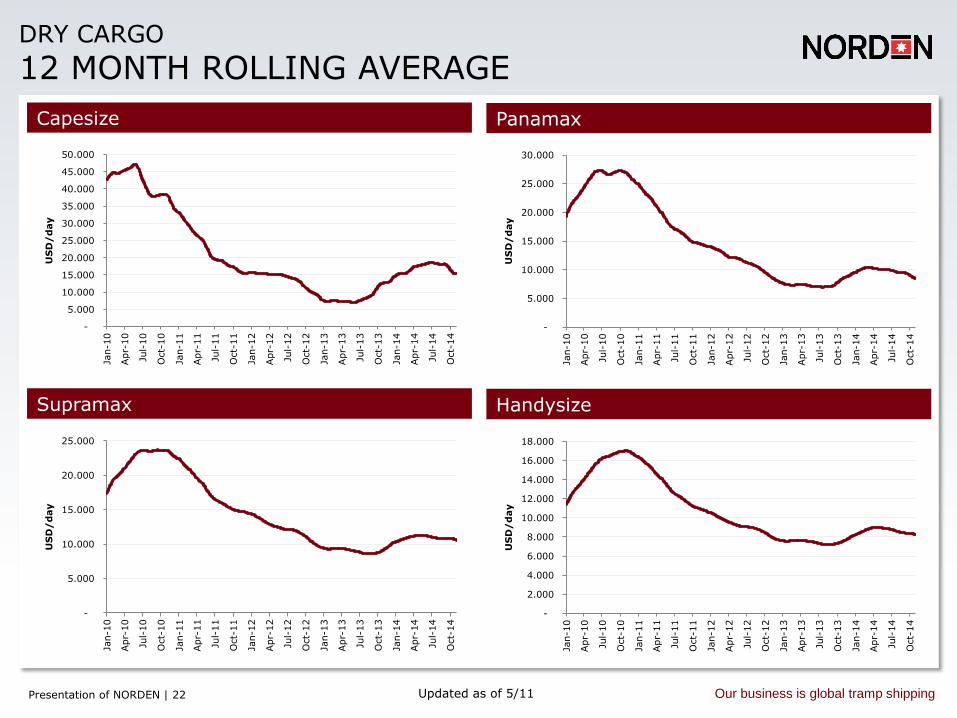
Capesize Panamax Due to the poor market conditions in Q2 and Q3, average BDI is on par with same period in 2013
Growth in Chinese iron ore imports has been stronger than expected, but not enough to fully compensate for:
Australia gaining market share in IO export to China leading to fewer tonne-miles
The loss of Indonesian nickel/bauxite trade
Lower coal trade to both China and Europe
Slow start to North American grain season
Supramax Handysize
0
5.000
10.000
15.000
20.000
25.000
30.000
35.000
40.000
45.000
Jan
Feb
Mar
Apr
May
Jun
Jul
Aug
Sep
Oct
Nov
Dec
US
D/
day
2013 2014
0
2.000
4.000
6.000
8.000
10.000
12.000
14.000
16.000
18.000
Jan
Feb
Mar
Apr
May
Jun
Jul
Aug
Sep
Oct
Nov
Dec
US
D/
day
2013 2014
0
2.000
4.000
6.000
8.000
10.000
12.000
14.000
16.000
18.000
Jan
Feb
Mar
Apr
May
Jun
Jul
Aug
Sep
Oct
Nov
Dec
US
D/
day
2013 2014
0
2.000
4.000
6.000
8.000
10.000
12.000
14.000
16.000
18.000
Jan
Feb
Mar
Apr
May
Jun
Jul
Aug
Sep
Oct
Nov
Dec
US
D/
day
2013 2014
Updated as of 5/11
Presentation of NORDEN | 14 Our business is global tramp shipping
-8%
-6%
-4%
-2%
0%
2%
4%
6%
8%
10%
12%
14%
16%
18%
20%
-40
-20
-
20
40
60
80
100
2011 2012 2013 2014e 2015e
Realised deliveries Expected deliveries
Realised scrapping Expected scrapping
Net fleet growth (RHS)
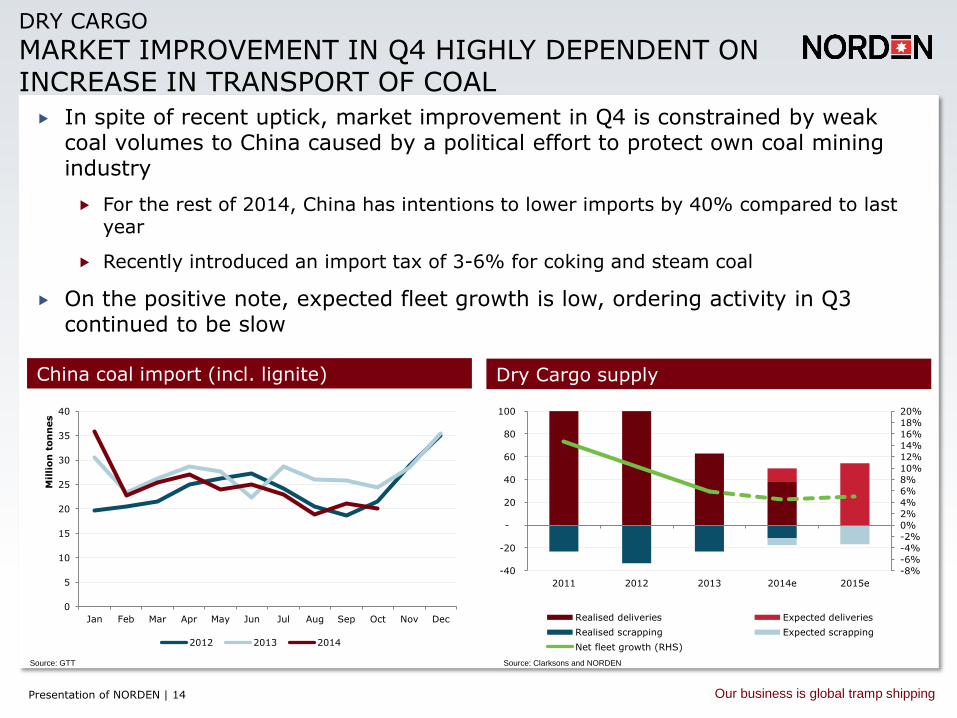
DRY CARGO
MARKET IMPROVEMENT IN Q4 HIGHLY DEPENDENT ON INCREASE IN TRANSPORT OF COAL
Dry Cargo supply China coal import (incl. lignite)
In spite of recent uptick, market improvement in Q4 is constrained by weak coal volumes to China caused by a political effort to protect own coal mining industry
For the rest of 2014, China has intentions to lower imports by 40% compared to last year
Recently introduced an import tax of 3-6% for coking and steam coal
On the positive note, expected fleet growth is low, ordering activity in Q3 continued to be slow
Source: GTT Source: Clarksons and NORDEN
0
5
10
15
20
25
30
35
40
Jan Feb Mar Apr May Jun Jul Aug Sep Oct Nov Dec
Mil
lio
n t
on
nes
2012 2013 2014
Presentation of NORDEN | 15 Our business is global tramp shipping
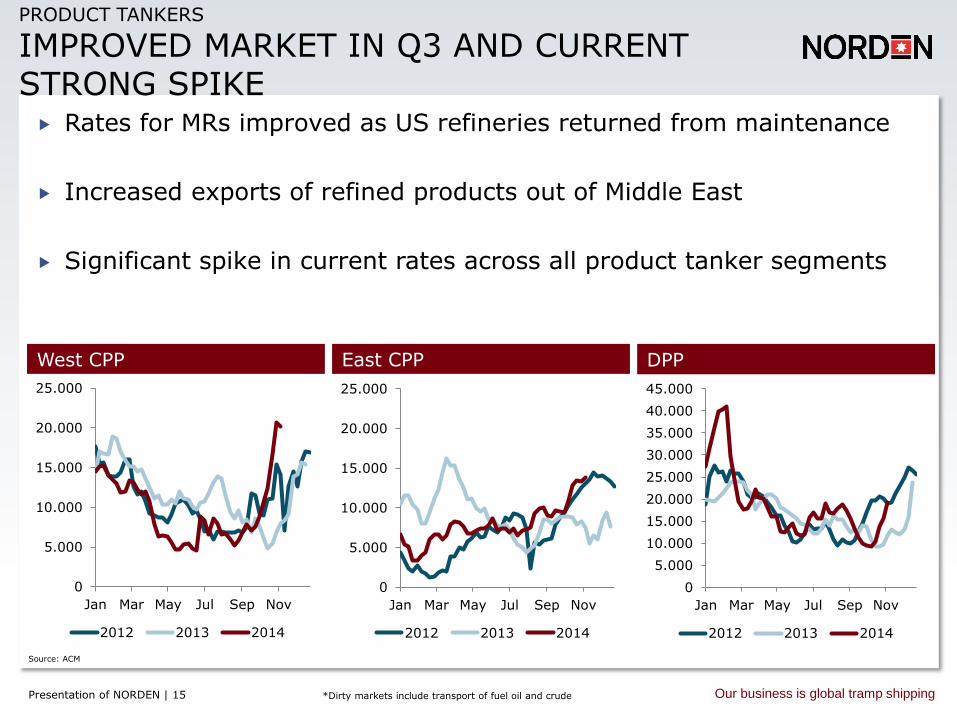
PRODUCT TANKERS
IMPROVED MARKET IN Q3 AND CURRENT STRONG SPIKE
East CPP West CPP DPP
Rates for MRs improved as US refineries returned from maintenance
Increased exports of refined products out of Middle East
Significant spike in current rates across all product tanker segments
Source: ACM
*Dirty markets include transport of fuel oil and crude
0
5.000
10.000
15.000
20.000
25.000
Jan Mar May Jul Sep Nov
2012 2013 2014
0
5.000
10.000
15.000
20.000
25.000
Jan Mar May Jul Sep Nov
2012 2013 2014
0
5.000
10.000
15.000
20.000
25.000
30.000
35.000
40.000
45.000
Jan Mar May Jul Sep Nov
2012 2013 2014
Presentation of NORDEN | 16 Our business is global tramp shipping
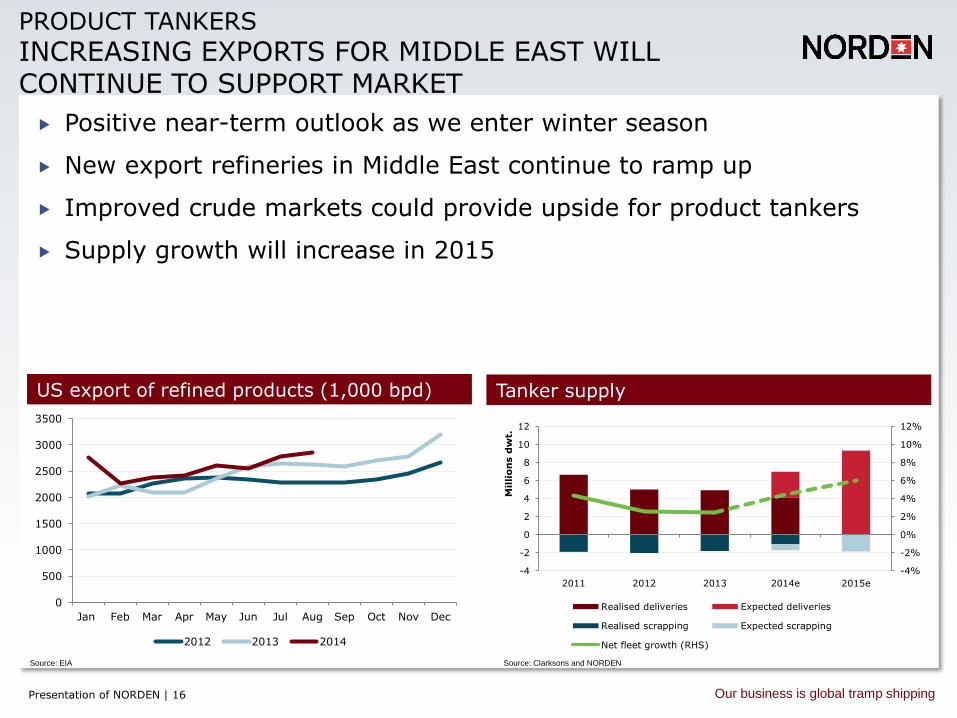
Positive near-term outlook as we enter winter season
New export refineries in Middle East continue to ramp up
Improved crude markets could provide upside for product tankers
Supply growth will increase in 2015
PRODUCT TANKERS
INCREASING EXPORTS FOR MIDDLE EAST WILL CONTINUE TO SUPPORT MARKET
Tanker supply US export of refined products (1,000 bpd)
-4%
-2%
0%
2%
4%
6%
8%
10%
12%
-4
-2
0
2
4
6
8
10
12
2011 2012 2013 2014e 2015e
Mil
lio
ns d
wt.
Realised deliveries Expected deliveries
Realised scrapping Expected scrapping
Net fleet growth (RHS)
Source: EIA Source: Clarksons and NORDEN
0
500
1000
1500
2000
2500
3000
3500
Jan Feb Mar Apr May Jun Jul Aug Sep Oct Nov Dec
2012 2013 2014
Presentation of NORDEN | 17 Our business is global tramp shipping
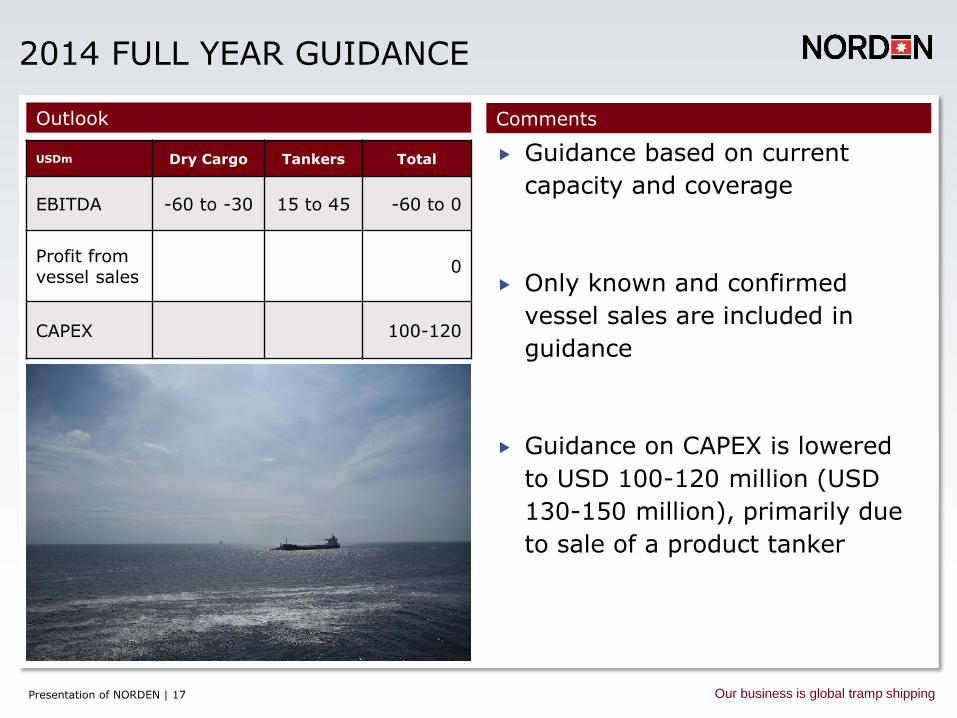
2014 FULL YEAR GUIDANCE
Guidance based on current
capacity and coverage
Only known and confirmed
vessel sales are included in
guidance
Guidance on CAPEX is lowered
to USD 100-120 million (USD
130-150 million), primarily due
to sale of a product tanker
Comments Outlook
USDm Dry Cargo Tankers Total
EBITDA -60 to -30 15 to 45 -60 to 0
Profit from vessel sales
0
CAPEX 100-120

Presentation of NORDEN | 18 Our business is global tramp shipping
FORWARD LOOKING STATEMENTS
This presentation contains certain forward-looking statements reflecting the management’s present judgment of future events and financial
results.
Statements relating to the remainder of 2014 and subsequent years are subject to uncertainty, and NORDEN’s actual results may therefore differ from the projections. Factors that may cause such variance include, but are not limited to, changes in macro-economic and political conditions,
particularly in the Company’s principal markets; changes to the Company’s rate assumptions and operating costs; volatility in rates and
tonnage prices; regulatory changes; any disruptions to traffic and operations as a result of external events, etc.
Presentation of NORDEN | 19 Our business is global tramp shipping
Dampskibsselskabet NORDEN A/S 52, Strandvejen DK-2900 Hellerup Denmark Phone: +45 3315 0451 www.ds-norden.com
Get mobile version of NORDEN’s website. Scan and add to home screen. Or go to m.ds-norden.com
Thank you for your attention
Presentation of NORDEN | 20 Our business is global tramp shipping
BACK UP

Presentation of NORDEN | 21 Our business is global tramp shipping
OVERALL RESULTS
USDm Q3 2013 Q2 2014 Q3 2014
EBITDA - Dry Cargo 10 -6 -16
EBITDA - Tankers 11 1 8
Unallocated -2 -3 -3
EBITDA - Group 19 -7 -11
Depreciation -21 -16 -19
EBIT Group -1 -27 -28
Net profit 1 -42 -46
Cash from operations 4 -29 9
Net Cash flow 29 -110 -31
Cash and securities 529 323 279
Presentation of NORDEN | 22 Our business is global tramp shipping
DRY CARGO
12 MONTH ROLLING AVERAGE
Panamax
Handysize
Capesize
Supramax
Updated as of 5/11
-
5.000
10.000
15.000
20.000
25.000
30.000
35.000
40.000
45.000
50.000
Jan-1
0
Apr-
10
Jul-
10
Oct-
10
Jan-1
1
Apr-
11
Jul-
11
Oct-
11
Jan-1
2
Apr-
12
Jul-
12
Oct-
12
Jan-1
3
Apr-
13
Jul-
13
Oct-
13
Jan-1
4
Apr-
14
Jul-
14
Oct-
14
US
D/
day
-
5.000
10.000
15.000
20.000
25.000
30.000
Jan-1
0
Apr-
10
Jul-
10
Oct-
10
Jan-1
1
Apr-
11
Jul-
11
Oct-
11
Jan-1
2
Apr-
12
Jul-
12
Oct-
12
Jan-1
3
Apr-
13
Jul-
13
Oct-
13
Jan-1
4
Apr-
14
Jul-
14
Oct-
14
US
D/
day
-
5.000
10.000
15.000
20.000
25.000
Jan-1
0
Apr-
10
Jul-
10
Oct-
10
Jan-1
1
Apr-
11
Jul-
11
Oct-
11
Jan-1
2
Apr-
12
Jul-
12
Oct-
12
Jan-1
3
Apr-
13
Jul-
13
Oct-
13
Jan-1
4
Apr-
14
Jul-
14
Oct-
14
US
D/
day
-
2.000
4.000
6.000
8.000
10.000
12.000
14.000
16.000
18.000
Jan-1
0
Apr-
10
Jul-
10
Oct-
10
Jan-1
1
Apr-
11
Jul-
11
Oct-
11
Jan-1
2
Apr-
12
Jul-
12
Oct-
12
Jan-1
3
Apr-
13
Jul-
13
Oct-
13
Jan-1
4
Apr-
14
Jul-
14
Oct-
14
US
D/
day
Presentation of NORDEN | 23 Our business is global tramp shipping
-10.000
-5.000
0
5.000
10.000
15.000
20.000
Jan
Feb
Mar
Apr
May
Jun
Jul
Aug
Sep
Oct
Nov
US
D/
day
Spread Atlantic Actual Pacific Actual
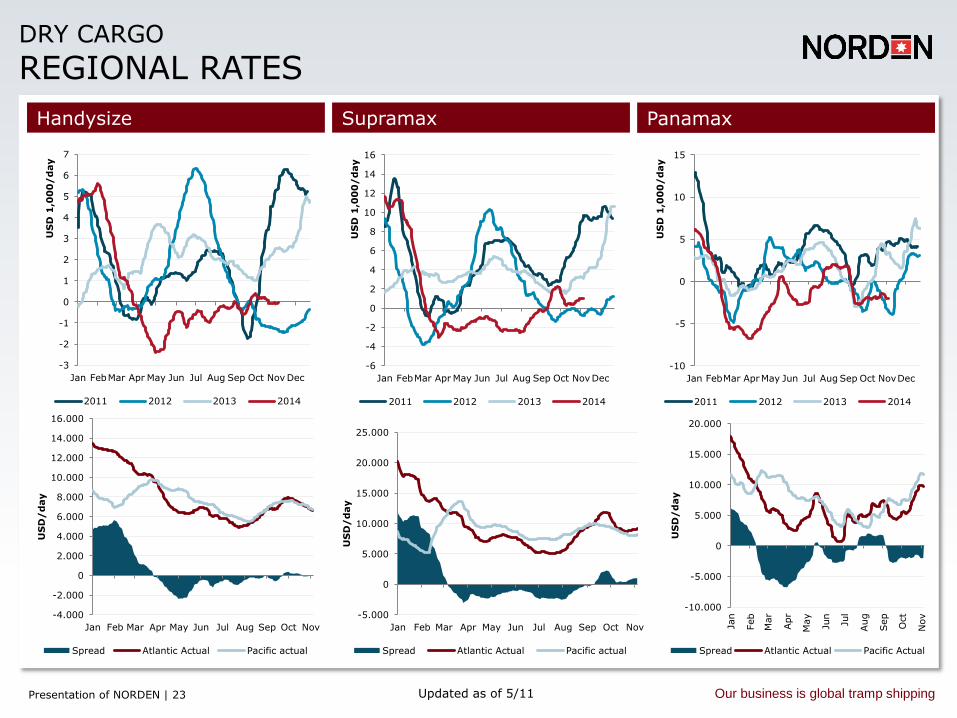
DRY CARGO
REGIONAL RATES
Supramax Handysize Panamax
Updated as of 5/11
-10
-5
0
5
10
15
Jan FebMar AprMay Jun Jul Aug Sep Oct NovDec
US
D 1
,00
0/
day
2011 2012 2013 2014
-6
-4
-2
0
2
4
6
8
10
12
14
16
Jan FebMar Apr May Jun Jul Aug Sep Oct NovDec
US
D 1
,00
0/
day
2011 2012 2013 2014
-5.000
0
5.000
10.000
15.000
20.000
25.000
Jan Feb Mar Apr May Jun Jul Aug Sep Oct Nov
US
D/
day
Spread Atlantic Actual Pacific actual
-3
-2
-1
0
1
2
3
4
5
6
7
Jan FebMar Apr May Jun Jul Aug Sep Oct Nov Dec
US
D 1
,00
0/
day
2011 2012 2013 2014
-4.000
-2.000
0
2.000
4.000
6.000
8.000
10.000
12.000
14.000
16.000
Jan Feb Mar Apr May Jun Jul Aug Sep Oct Nov
US
D/
day
Spread Atlantic Actual Pacific actual
Presentation of NORDEN | 24 Our business is global tramp shipping
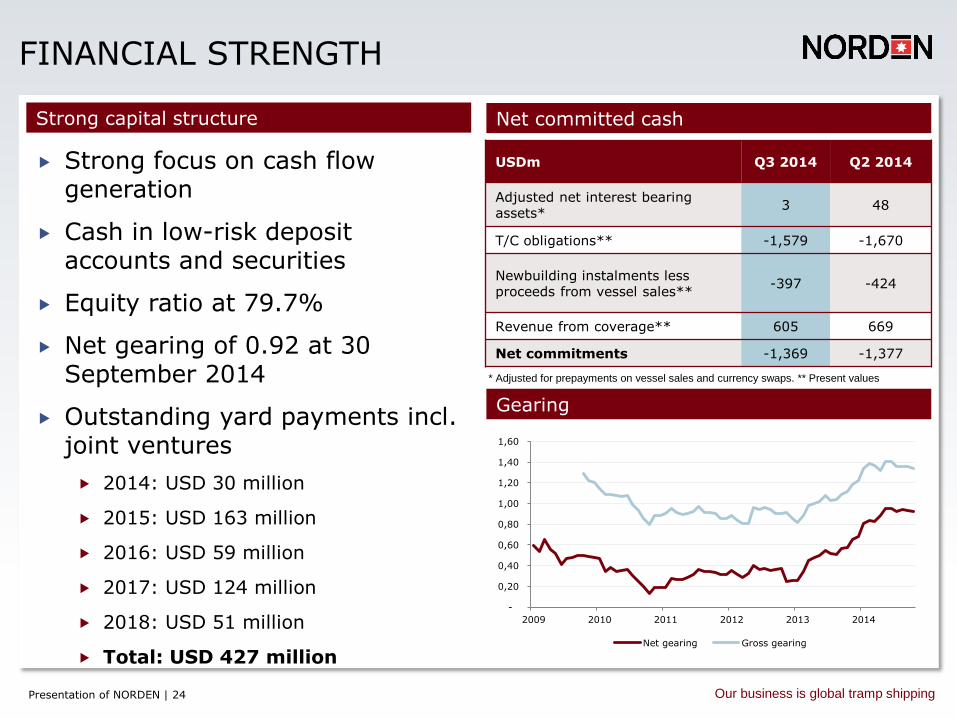
FINANCIAL STRENGTH
Net committed cash
Gearing
Strong focus on cash flow generation
Cash in low-risk deposit accounts and securities
Equity ratio at 79.7%
Net gearing of 0.92 at 30 September 2014
Outstanding yard payments incl. joint ventures
2014: USD 30 million
2015: USD 163 million
2016: USD 59 million
2017: USD 124 million
2018: USD 51 million
Total: USD 427 million
Strong capital structure
USDm Q3 2014 Q2 2014
Adjusted net interest bearing assets*
3 48
T/C obligations** -1,579 -1,670
Newbuilding instalments less proceeds from vessel sales**
-397 -424
Revenue from coverage** 605 669
Net commitments -1,369 -1,377
* Adjusted for prepayments on vessel sales and currency swaps. ** Present values
-
0,20
0,40
0,60
0,80
1,00
1,20
1,40
1,60
2009 2010 2011 2012 2013 2014
Net gearing Gross gearing
Presentation of NORDEN | 25 Our business is global tramp shipping
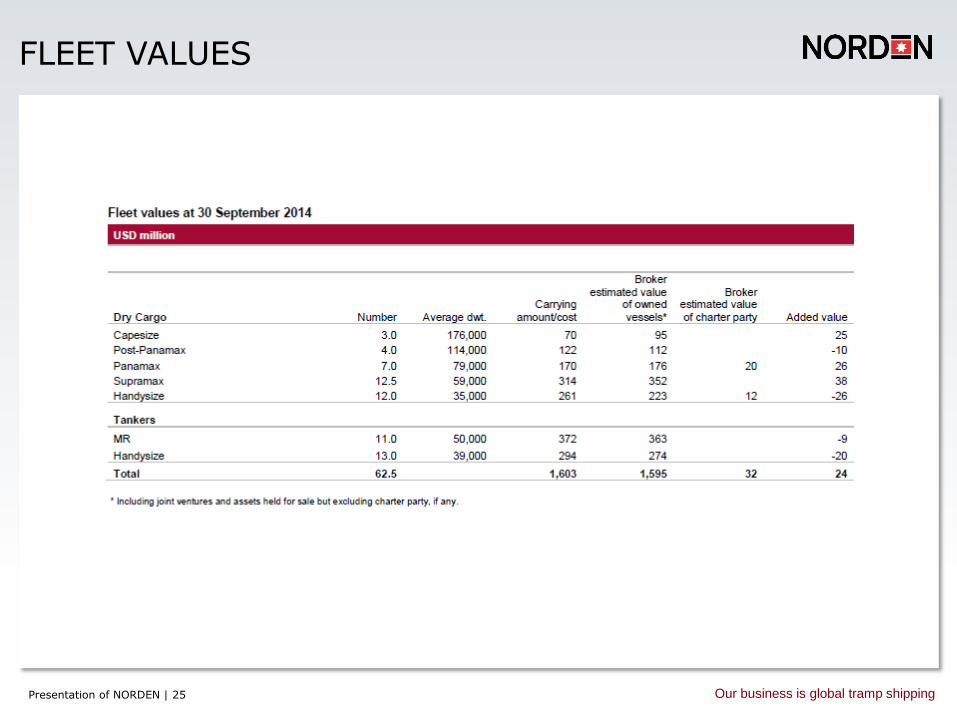
FLEET VALUES
Presentation of NORDEN | 26 Our business is global tramp shipping
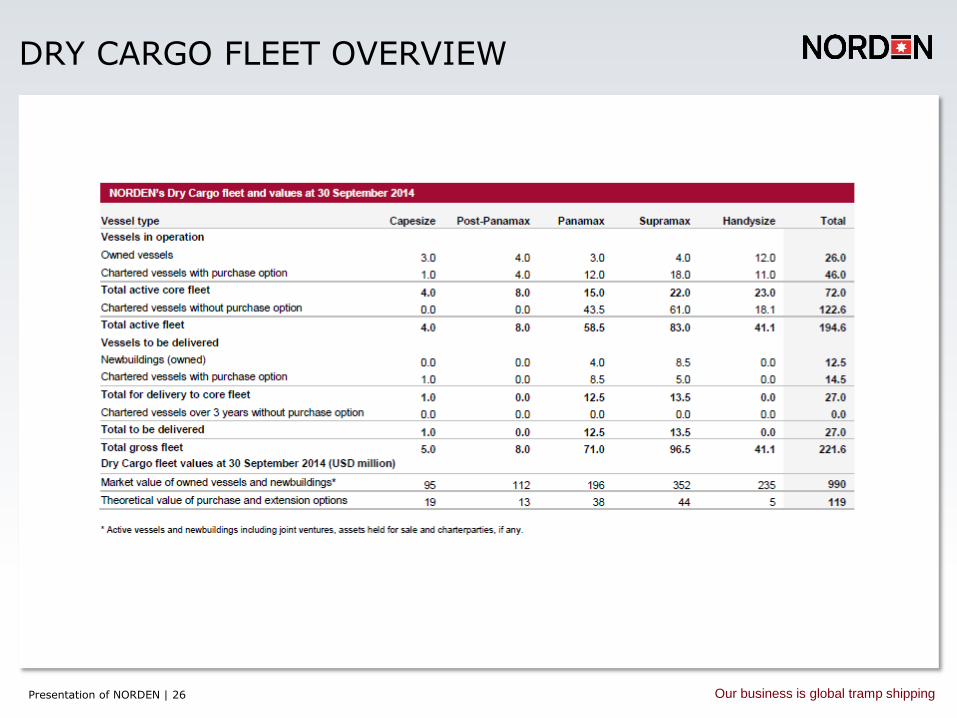
DRY CARGO FLEET OVERVIEW

Presentation of NORDEN | 27 Our business is global tramp shipping
PRODUCT TANKER FLEET OVERVIEW
Presentation of NORDEN | 28 Our business is global tramp shipping
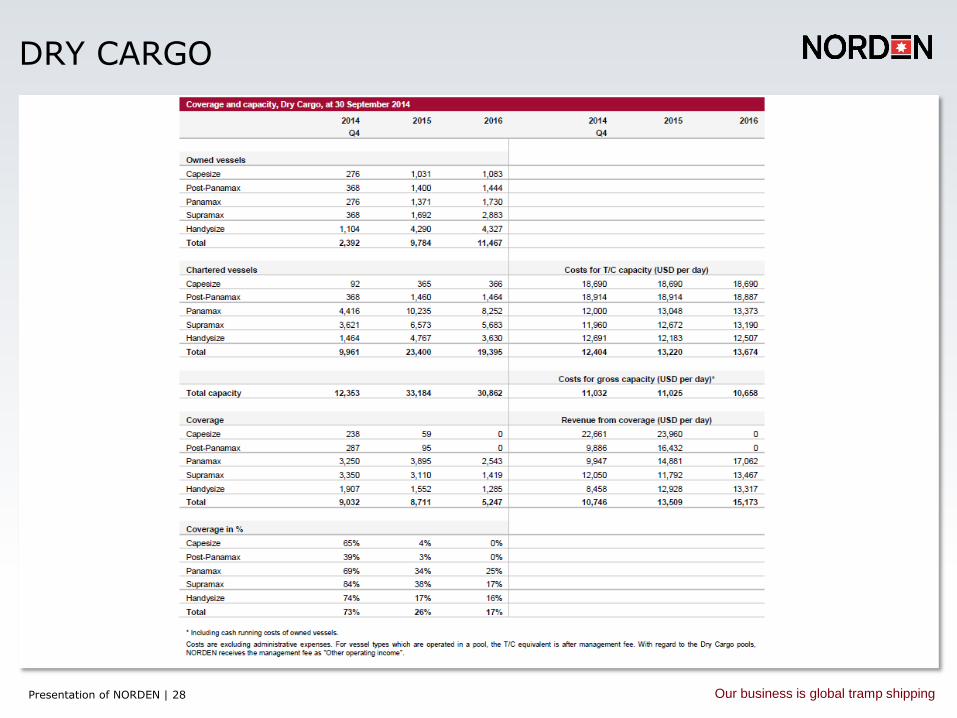
DRY CARGO
Presentation of NORDEN | 29 Our business is global tramp shipping
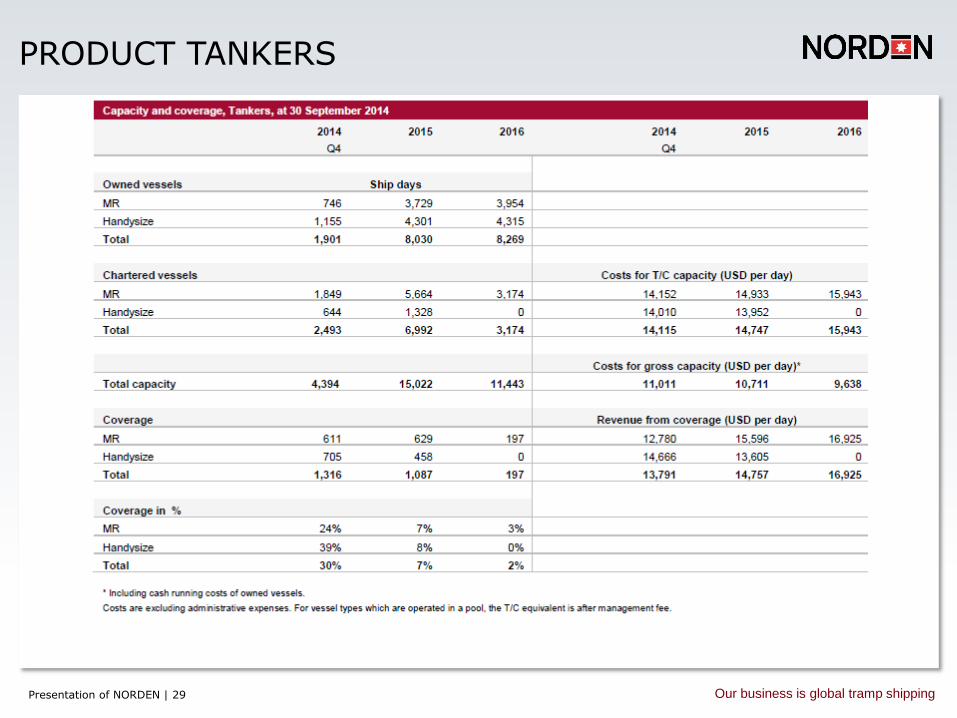
PRODUCT TANKERS
Presentation of NORDEN | 30 Our business is global tramp shipping
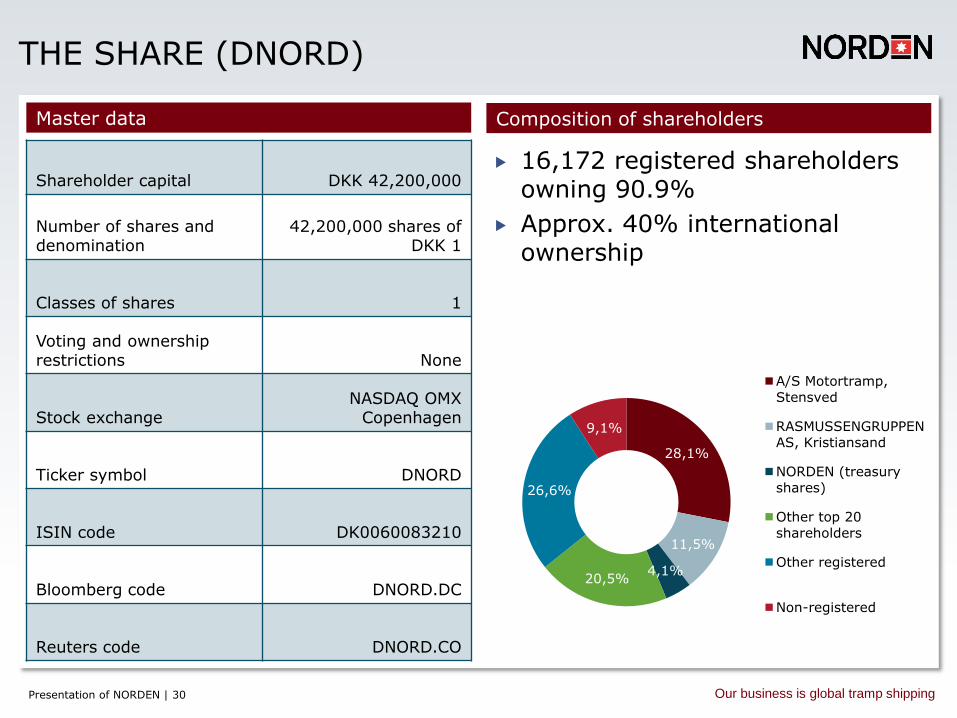
THE SHARE (DNORD)
Composition of shareholders Master data
Shareholder capital DKK 42,200,000
Number of shares and denomination
42,200,000 shares of DKK 1
Classes of shares 1
Voting and ownership restrictions None
Stock exchange NASDAQ OMX
Copenhagen
Ticker symbol DNORD
ISIN code DK0060083210
Bloomberg code DNORD.DC
Reuters code DNORD.CO
16,172 registered shareholders owning 90.9%
Approx. 40% international ownership
28,1%
11,5%
4,1% 20,5%
26,6%
9,1%
A/S Motortramp,
Stensved
RASMUSSENGRUPPEN
AS, Kristiansand
NORDEN (treasury
shares)
Other top 20
shareholders
Other registered
Non-registered