Embed Size (px)
Citation preview
Presentation of Q1 2017 Results Bucharest, 15 May 2017
Highlights
Highlights
Executive Summary
Distribution Overview
Supply Overview
Corporate Governance
2

Main corporate events in Q1 2017 and up to date
3
Main resolutions of the April 27th, 2017 General Meetings of Shareholders:
Approval of the 2017 budgets of Electrica, at standalone and consolidated levels;
Approval of the 2016 financials statements of Electrica at standalone and consolidated levels;
Approval of the 2016 profit distribution; gross dividend – RON 0.7415 per share; payment date – 22 June 2017;
Approval of the proposal for amendment of the Articles of Association of Societatea Energetica Electrica SA by
eliminating two provisions so that the decisions for subsidiaries’ mergers, spin offs and global strategy,
including but not limited to development and restructuring to be transferred to BoD;
Rejection of the empowerment of Electrica BoD to approve changes in the structure of the income and expenses
budget of Electrica for financial year 2017, at standalone and consolidated levels up to a total variation of 10% in
the line of total income and total expenses.
Main corporate governance events in Q1 2017 up to date:
The Board of Directors decided to:
Reappoint Mr. Cristian Busu as BoD chair for a mandate of one year and the BoD’s committees to remain
unchanged and re-elected their chairs for a one-year mandate, starting January 27th;
Revoke Mr. Ramiro Angelescu from the position of Executive Manager of the Sales Coordination Division of
Electrica SA, as of January 27th;
Appoint Ms. Livioara Sujdea, as Chief Distribution Officer, starting with February 1st;
Appoint Mr. Dan Crisfalusi as IT & Telecom Officer, starting with March 6th, for a four-year period;
Approve the Remuneration policy of Electrica’s directors and executive managers drafted based on OGMS
resolutions no.2/09.07.2015 and 01/31.03.2016
Appoint Ms. Anamaria Acristini as Chief Strategy Officer, starting with May 1st, for a four-year period.
Mrs. Corina Georgeta Popescu resigned, on the 31st of March 2017, from her position as member of the Board of
Directors of Electrica SA; following this decision, the BoD appointed Mr. Gicu Iorga as interim member of the
Board of Directors, starting with May 1st 2017, and until April 30th 2018, or until the next Ordinary General Meeting
of Shareholders of the Company, which of the dates comes first.
Relevant
developments in
Corporate
Governance
in Q1 2017 and up
to date
Main business lines’ events in Q1 2017, up to date
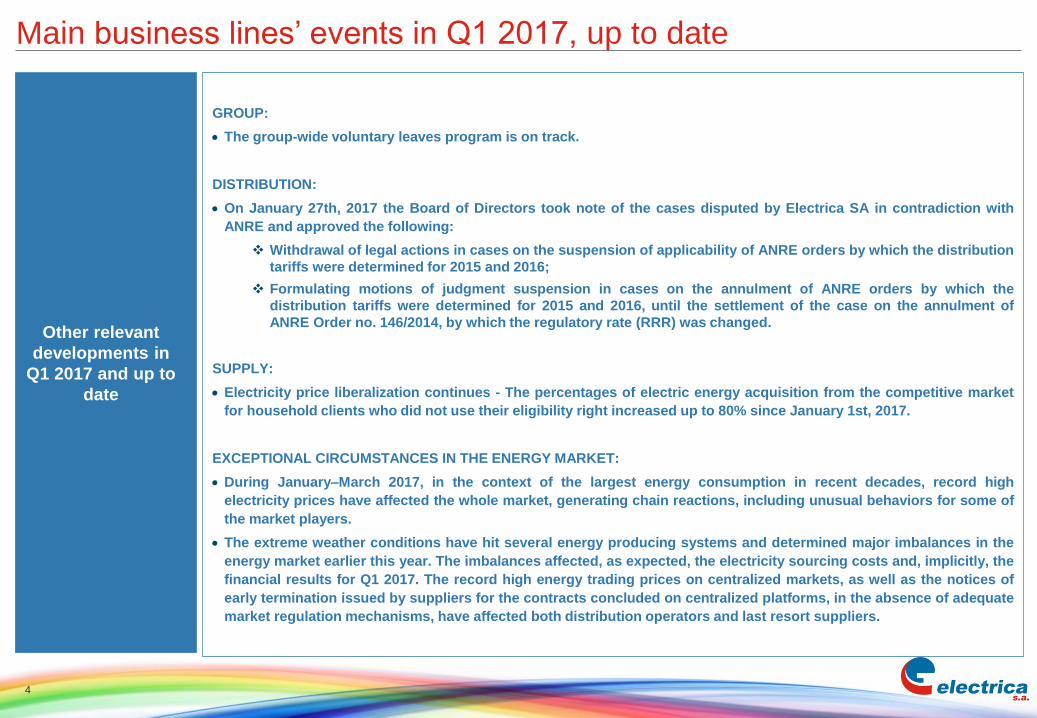
GROUP:
The group-wide voluntary leaves program is on track.
DISTRIBUTION:
On January 27th, 2017 the Board of Directors took note of the cases disputed by Electrica SA in contradiction with
ANRE and approved the following:
Withdrawal of legal actions in cases on the suspension of applicability of ANRE orders by which the distribution
tariffs were determined for 2015 and 2016;
Formulating motions of judgment suspension in cases on the annulment of ANRE orders by which the
distribution tariffs were determined for 2015 and 2016, until the settlement of the case on the annulment of
ANRE Order no. 146/2014, by which the regulatory rate (RRR) was changed.
SUPPLY:
Electricity price liberalization continues - The percentages of electric energy acquisition from the competitive market
for household clients who did not use their eligibility right increased up to 80% since January 1st, 2017.
EXCEPTIONAL CIRCUMSTANCES IN THE ENERGY MARKET:
During January–March 2017, in the context of the largest energy consumption in recent decades, record high
electricity prices have affected the whole market, generating chain reactions, including unusual behaviors for some of
the market players.
The extreme weather conditions have hit several energy producing systems and determined major imbalances in the
energy market earlier this year. The imbalances affected, as expected, the electricity sourcing costs and, implicitly, the
financial results for Q1 2017. The record high energy trading prices on centralized markets, as well as the notices of
early termination issued by suppliers for the contracts concluded on centralized platforms, in the absence of adequate
market regulation mechanisms, have affected both distribution operators and last resort suppliers.
Other relevant
developments in
Q1 2017 and up to
date
4
Energy Market Context
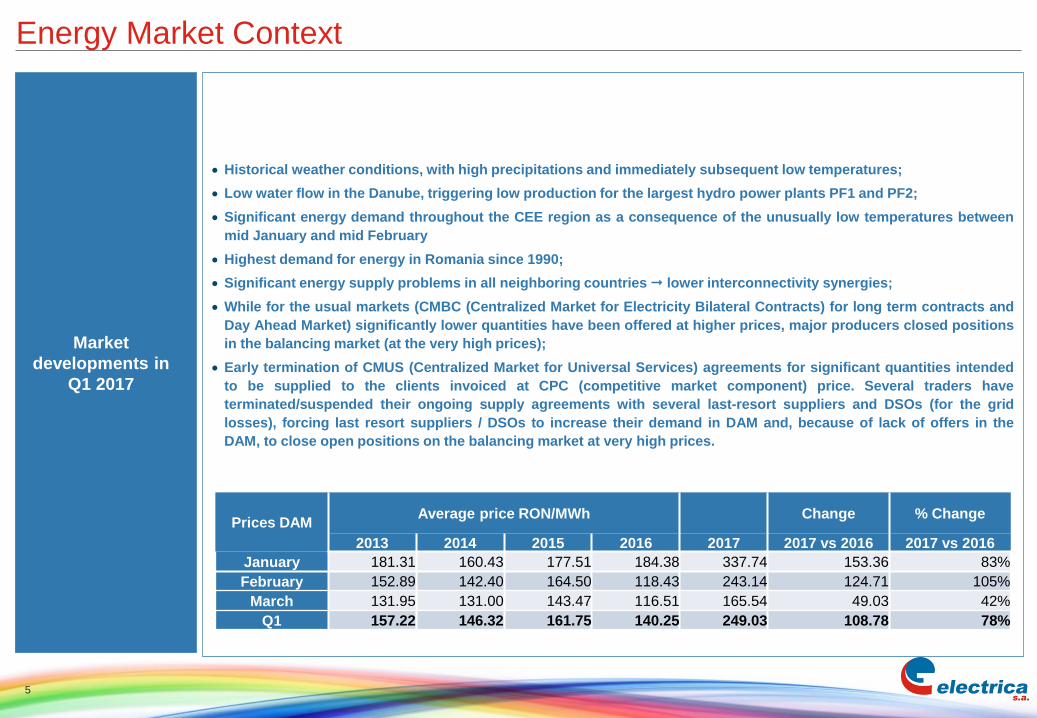
Historical weather conditions, with high precipitations and immediately subsequent low temperatures;
Low water flow in the Danube, triggering low production for the largest hydro power plants PF1 and PF2;
Significant energy demand throughout the CEE region as a consequence of the unusually low temperatures between
mid January and mid February
Highest demand for energy in Romania since 1990;
Significant energy supply problems in all neighboring countries lower interconnectivity synergies;
While for the usual markets (CMBC (Centralized Market for Electricity Bilateral Contracts) for long term contracts and
Day Ahead Market) significantly lower quantities have been offered at higher prices, major producers closed positions
in the balancing market (at the very high prices);
Early termination of CMUS (Centralized Market for Universal Services) agreements for significant quantities intended
to be supplied to the clients invoiced at CPC (competitive market component) price. Several traders have
terminated/suspended their ongoing supply agreements with several last-resort suppliers and DSOs (for the grid
losses), forcing last resort suppliers / DSOs to increase their demand in DAM and, because of lack of offers in the
DAM, to close open positions on the balancing market at very high prices.
Market
developments in
Q1 2017
5
Prices DAMAverage price RON/MWh Change % Change
2013 2014 2015 2016 2017 2017 vs 2016 2017 vs 2016
January 181.31 160.43 177.51 184.38 337.74 153.36 83%
February 152.89 142.40 164.50 118.43 243.14 124.71 105%
March 131.95 131.00 143.47 116.51 165.54 49.03 42%
Q1 157.22 146.32 161.75 140.25 249.03 108.78 78%

Energy Market Context
Aiming to keep the financial performance of 2017 as much as possible on track and meet investors' expectations, the
management continues to implement the optimization program in all Electrica Group entities, while aligning the
measures to the current market conditions. This includes measures aimed mainly at EFSA's portfolio optimization (both
for eligible and captive customers), as well as cost reduction measures for EFSA and DSOs (with effect already in 2017).
While the management is committed to take all the measures, considering the Q1 market challenges and taking into
account the current average energy prices in the centralized markets (higher that last year's), as well as the weather
forecast indicating a dry hot summer, a certain risk remains for the rest of the year in relation to the cost of the
electricity on the wholesale market.
In such case, should the optimization measures already started prove insufficient to ensure achievement of 2017 result,
other measures (including distribution of reserves) might be considered, in order to preserve the dividend distribution
level.
Measures to
overcome the Q1
2017 results
6
Executive Summary
Highlights
Executive Summary
Distribution Overview
Supply Overview
Corporate Governance
7
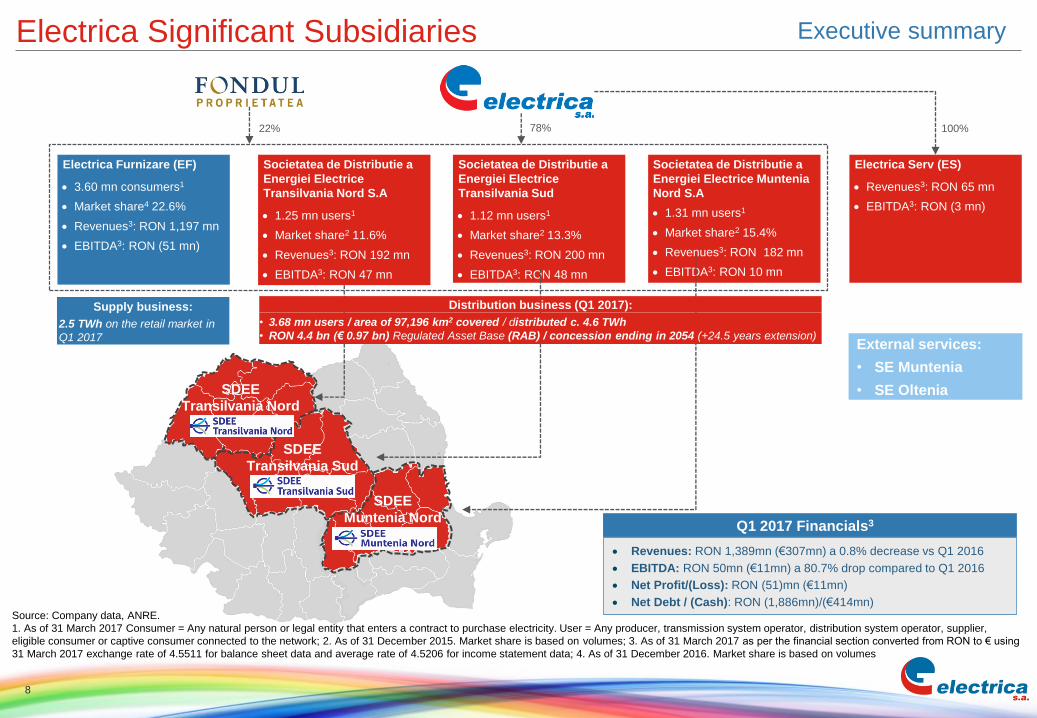
Electrica Significant Subsidiaries Executive summary
8
Source: Company data, ANRE.
1. As of 31 March 2017 Consumer = Any natural person or legal entity that enters a contract to purchase electricity. User = Any producer, transmission system operator, distribution system operator, supplier,
eligible consumer or captive consumer connected to the network; 2. As of 31 December 2015. Market share is based on volumes; 3. As of 31 March 2017 as per the financial section converted from RON to € using
31 March 2017 exchange rate of 4.5511 for balance sheet data and average rate of 4.5206 for income statement data; 4. As of 31 December 2016. Market share is based on volumes
Societatea de Distributie a
Energiei Electrice
Transilvania Nord S.A
1.25 mn users1
Market share2 11.6%
Revenues3: RON 192 mn
EBITDA3: RON 47 mn
Societatea de Distributie a
Energiei Electrice
Transilvania Sud
1.12 mn users1
Market share2 13.3%
Revenues3: RON 200 mn
EBITDA3: RON 48 mn
Electrica Furnizare (EF)
3.60 mn consumers1
Market share4 22.6%
Revenues3: RON 1,197 mn
EBITDA3: RON (51 mn)
Electrica Serv (ES)
Revenues3: RON 65 mn
EBITDA3: RON (3 mn)
78% 100%22%
External services:
• SE Muntenia
• SE Oltenia
Supply business:
2.5 TWh on the retail market in
Q1 2017
Societatea de Distributie a
Energiei Electrice Muntenia
Nord S.A
1.31 mn users1
Market share2 15.4%
Revenues3: RON 182 mn
EBITDA3: RON 10 mn
Q1 2017 Financials3
Revenues: RON 1,389mn (€307mn) a 0.8% decrease vs Q1 2016
EBITDA: RON 50mn (€11mn) a 80.7% drop compared to Q1 2016
Net Profit/(Loss): RON (51)mn (€11mn)
Net Debt / (Cash): RON (1,886mn)/(€414mn)
Distribution business (Q1 2017):
• 3.68 mn users / area of 97,196 km2 covered / distributed c. 4.6 TWh
• RON 4.4 bn (€ 0.97 bn) Regulated Asset Base (RAB) / concession ending in 2054 (+24.5 years extension)
SDEE
Transilvania Nord
SDEE
Transilvania Sud
SDEE
Muntenia Nord
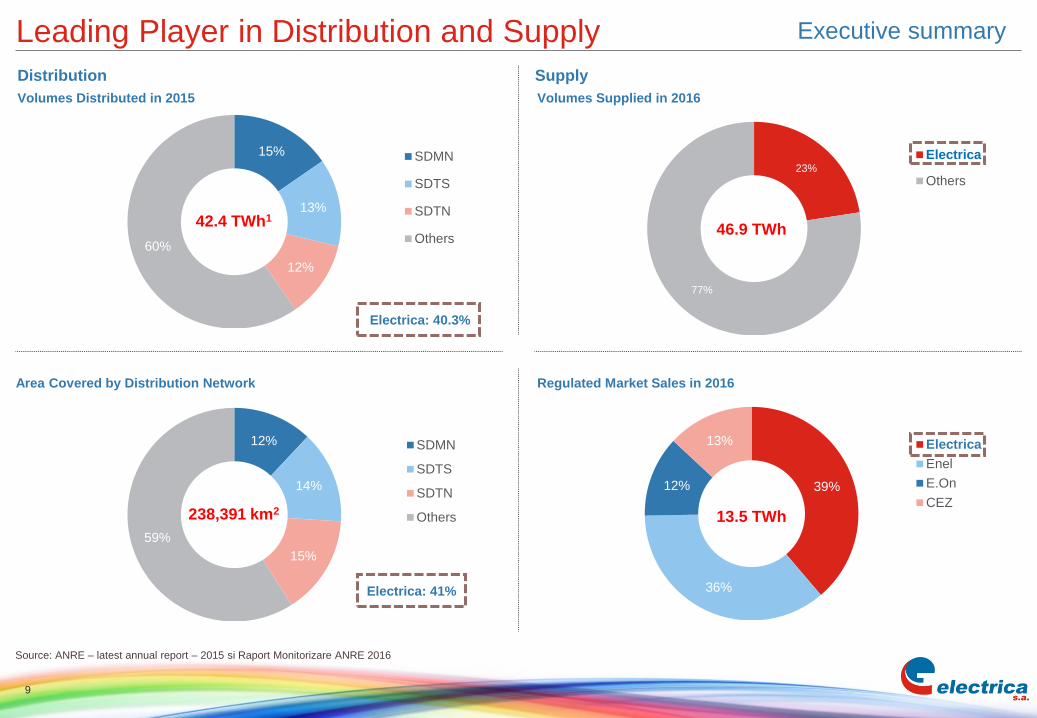
15%
13%
12%
60%
SDMN
SDTS
SDTN
Others
Volumes Distributed in 2015 Volumes Supplied in 2016
Regulated Market Sales in 2016Area Covered by Distribution Network
Distribution Supply
Leading Player in Distribution and Supply
Electrica: 40.3%
42.4 TWh1
Source: ANRE – latest annual report – 2015 si Raport Monitorizare ANRE 2016
23%
77%
Electrica
Others
46.9 TWh
12%
14%
15%
59%
SDMN
SDTS
SDTN
Others238,391 km2
39%
36%
12%
13% Electrica
Enel
E.On
CEZ13.5 TWh
Electrica: 41%
Executive summary
9

Background and Basis of Preparation for the Financials
10
Background
Group structure and
segment reporting
Historical consolidated financial statements prepared in accordance with International Financial
Reporting Standards as endorsed by the European Union (IFRS-EU)
The presentation currency is Romanian New Leu (RON)
Since January 2016, the Electrica Group includes 8 companies, following the deconsolidation of SE
Moldova after its bankruptcy.
The Group is divided into two main segments for the purpose of segmental reporting: distribution (further
split into three DSO’s and the energy services company) and supply
Until April 10th, 2014 Electrica held minority holdings in various entities which were subject to a spin-off in
2014 before the IPO; Electrica produced pro-forma financial statements for the period 2011-2013 which
carved-out the impact of spun-off items
The management reassessed the accounting treatment used for its distribution subsidiaries concession
agreements following the IPO and as a result adopted IFRIC 12 at the end of 2014. The Group has
applied the change in accounting policy retrospectively and restated the comparative periods
Source: Company data.
Executive summary
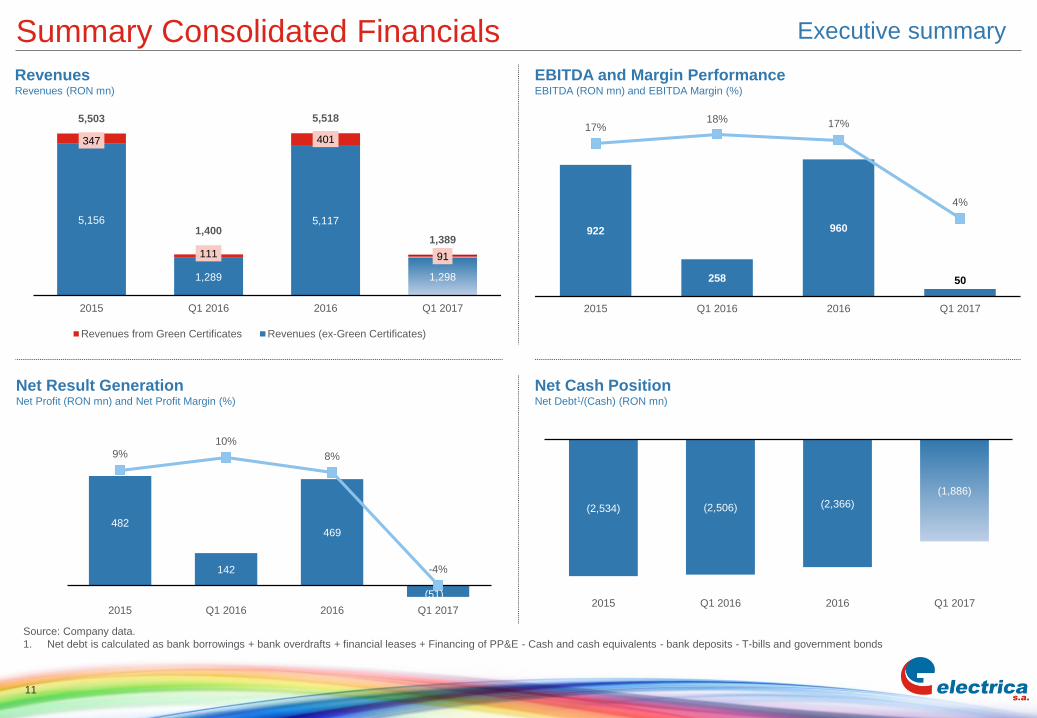
922
258
960
50
17%18% 17%
4%
2015 Q1 2016 2016 Q1 2017
Summary Consolidated Financials
Net Cash PositionNet Debt1/(Cash) (RON mn)
Net Result GenerationNet Profit (RON mn) and Net Profit Margin (%)
RevenuesRevenues (RON mn)
EBITDA and Margin PerformanceEBITDA (RON mn) and EBITDA Margin (%)
Source: Company data.
1. Net debt is calculated as bank borrowings + bank overdrafts + financial leases + Financing of PP&E - Cash and cash equivalents - bank deposits - T-bills and government bonds
5,156
1,289
5,117
1,298
347
111
401
91
5,503
1,400
5,518
1,389
2015 Q1 2016 2016 Q1 2017
Revenues from Green Certificates Revenues (ex-Green Certificates)
Executive summary
11
482
142
469
(51)
9%
10%
8%
-4%
2015 Q1 2016 2016 Q1 2017
(2,534) (2,506) (2,366)
(1,886)
2015 Q1 2016 2016 Q1 2017
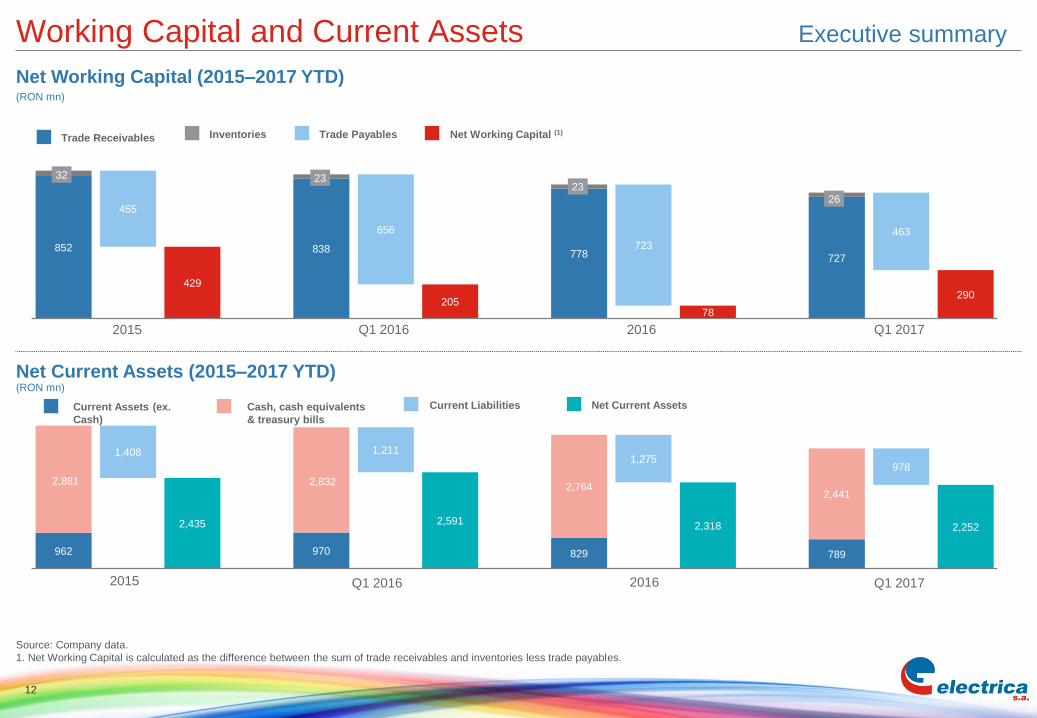
962
2,435
970
2,591
829
2,318
789
2,252
2,881
1,408
2,832
1,211
2,764
1,275
2,441
978
2016
Working Capital and Current Assets
Source: Company data.
1. Net Working Capital is calculated as the difference between the sum of trade receivables and inventories less trade payables.
Trade Receivables Trade PayablesInventories Net Working Capital (1)
2015 Q1 2016 2016
Net Working Capital (2015–2017 YTD)
Net Current Assets (2015–2017 YTD)
Current Assets (ex.
Cash)
Cash, cash equivalents
& treasury bills
Current Liabilities Net Current Assets
2015 Q1 2016 Q1 2017
(RON mn)
(RON mn)
Executive summary
12
852
429
838
205
778
78
727
290
32
455
23
656
23
723
26
463
Q1 2017

Distribution Overview
Highlights
Executive Summary
Distribution Overview
Supply Overview
Corporate Governance
13
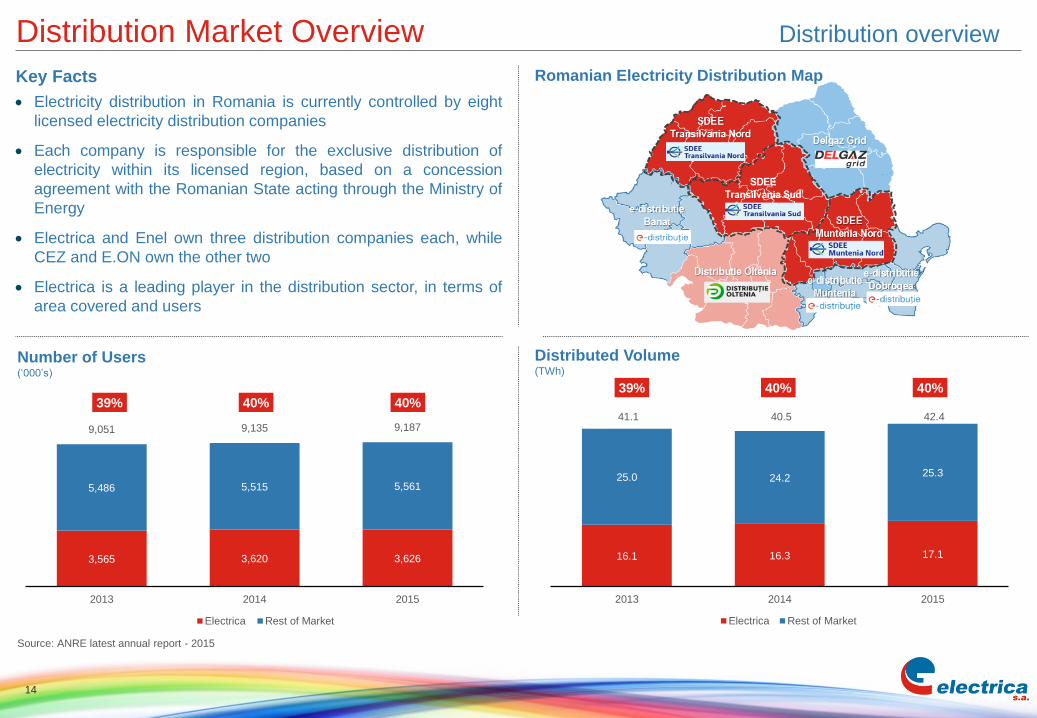
Number of Users(‘000’s)
39% 40% 40%
Distribution Market Overview
Key Facts
Electricity distribution in Romania is currently controlled by eight
licensed electricity distribution companies
Each company is responsible for the exclusive distribution of
electricity within its licensed region, based on a concession
agreement with the Romanian State acting through the Ministry of
Energy
Electrica and Enel own three distribution companies each, while
CEZ and E.ON own the other two
Electrica is a leading player in the distribution sector, in terms of
area covered and users
Romanian Electricity Distribution Map
Distributed Volume(TWh)
Source: ANRE latest annual report - 2015
3,565 3,620 3,626
5,486 5,515 5,561
9,051 9,135 9,187
2013 2014 2015
Electrica Rest of Market
16.1 16.3 17.1
25.0 24.225.3
41.1 40.5 42.4
2013 2014 2015
Electrica Rest of Market
Distribution overview
14
39% 40% 40%

Q1 2017 Regulated Asset Base (RAB) of RON 4.436 bn
195,923 km of voltage lines (7,574 km HV; 45,080 km MV; 143,270 km LV) (Q1 2017)
Area of operation: 97,196 km2, 40.7% of Romania’s territory
3.68 mn users (Q1 2017)
4.6 TWh of electricity distributed in Q1 2017, 4% increase compared to Q1 2016
40.3% market share for electricity distribution to end users in 2015
Financials variances
o 34% lower EBITDA mainly due to significantly network losses higher sourcing cost (price
effect due to the historical highest energy acquisition prices)
o Significant decrease in net profit mainly due to EBITDA impact and higher depreciation
costs
Key Financial Metrics
EBITDA(RON mn)
Net Profit(RON mn)
Net Debt/(Net Cash)1
(RON mn)
Revenues(RON mn)
Source: Company data.
1. Net debt is calculated as bank borrowings + bank overdrafts + Financing for PP&E and financial leases - Cash and cash equivalents - bank deposits - T-bills and government bonds
Distribution Highlights
809
154
760
101
2015 Q1 2016 2016 Q1 2017
377
51
312
(3)
2015 Q1 2016 2016 Q1 2017
(8)(5)
175
335
2015 Q1 2016 2016 Q1 2017
Distribution segment overview
15
2,613
546
2,498
583
2015 Q1 2016 2016 Q1 2017
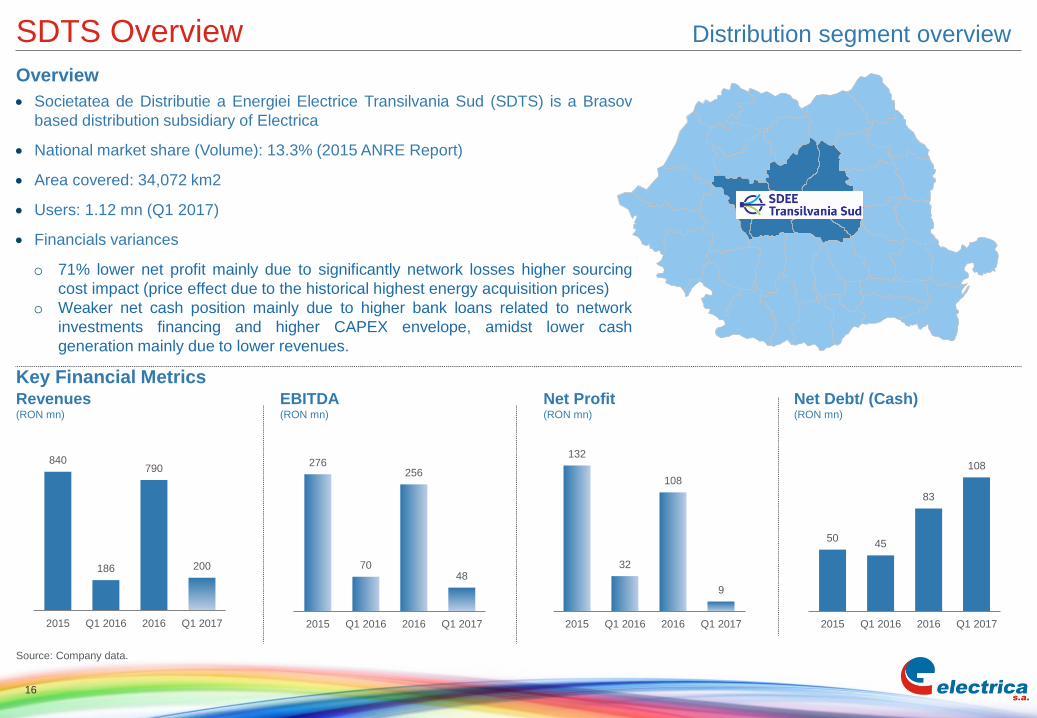
5045
83
108
2015 Q1 2016 2016 Q1 2017
132
32
108
9
2015 Q1 2016 2016 Q1 2017
276
70
256
48
2015 Q1 2016 2016 Q1 2017
840
186
790
200
2015 Q1 2016 2016 Q1 2017
SDTS Overview
Overview
Societatea de Distributie a Energiei Electrice Transilvania Sud (SDTS) is a Brasov
based distribution subsidiary of Electrica
National market share (Volume): 13.3% (2015 ANRE Report)
Area covered: 34,072 km2
Users: 1.12 mn (Q1 2017)
Financials variances
o 71% lower net profit mainly due to significantly network losses higher sourcing
cost impact (price effect due to the historical highest energy acquisition prices)
o Weaker net cash position mainly due to higher bank loans related to network
investments financing and higher CAPEX envelope, amidst lower cash
generation mainly due to lower revenues.
Source: Company data.
Key Financial MetricsEBITDA(RON mn)
Net Profit(RON mn)
Net Debt/ (Cash)(RON mn)
Revenues(RON mn)
Distribution segment overview
16

SDTS Overview (Cont’d)
Network Losses(GWh)
Costs due to Network Losses(RON mn)
Network Losses(%)
Source: Company data.
163
50
163
69
2015 Q1 2016 2016 Q1 2017
785
230
775
252
2015 Q1 2016 2016 Q1 2017
11.40% 11.15% 10.97%
13.45%
10.97% 10.74% 10.55%
12.65%
Reg. Realised Reg. Realised Reg. Realised Reg. Realised
2015 Q1 2016 2016 Q1 2017
Distribution segment overview
17
Capex(RON mn)
2.44
0.68
2.51
0.71
2.31
0.59
2.35
0.62
0.88
0.22
0.96
0.23
5.63
1.49
5.82
1.56
2015 Q1 2016 2016 Q1 2017
Low Voltage Medium Voltage High Voltage
Distributed Volumes (TWh)
157
15
148
32
2015 Q1 2016 2016 Q1 2017
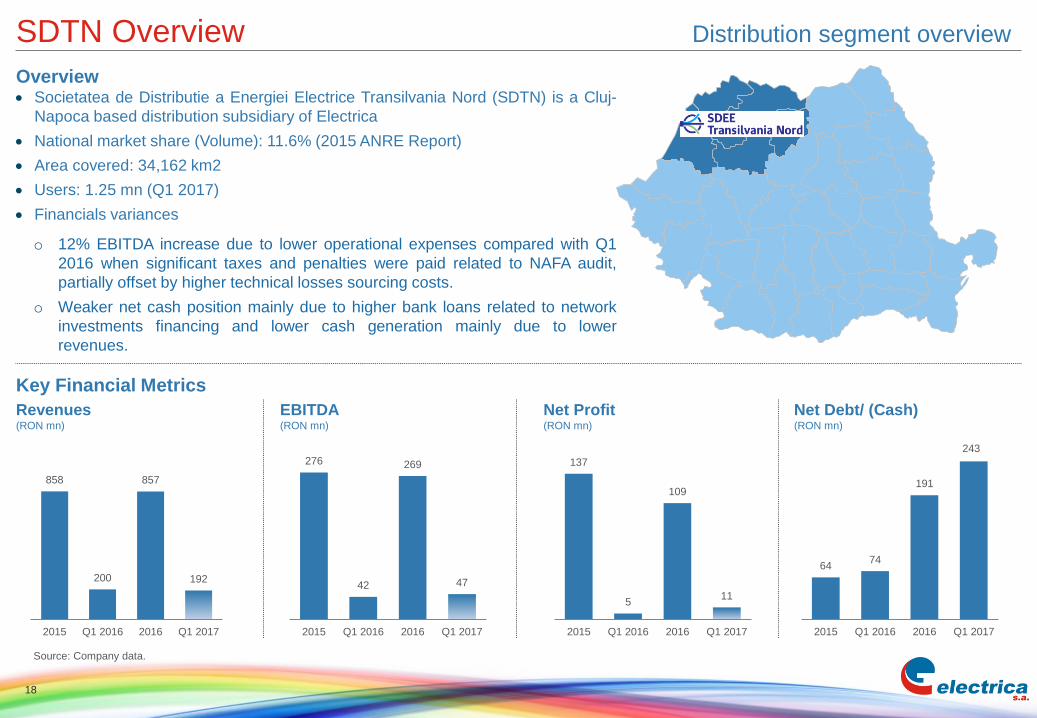
137
5
109
11
2015 Q1 2016 2016 Q1 2017
276
42
269
47
2015 Q1 2016 2016 Q1 2017
858
200
857
192
2015 Q1 2016 2016 Q1 2017
SDTN Overview
Key Financial Metrics
Overview Societatea de Distributie a Energiei Electrice Transilvania Nord (SDTN) is a Cluj-
Napoca based distribution subsidiary of Electrica
National market share (Volume): 11.6% (2015 ANRE Report)
Area covered: 34,162 km2
Users: 1.25 mn (Q1 2017)
Financials variances
o 12% EBITDA increase due to lower operational expenses compared with Q1
2016 when significant taxes and penalties were paid related to NAFA audit,
partially offset by higher technical losses sourcing costs.
o Weaker net cash position mainly due to higher bank loans related to network
investments financing and lower cash generation mainly due to lower
revenues.
Source: Company data.
EBITDA(RON mn)
Net Profit(RON mn)
Net Debt/ (Cash)(RON mn)
Revenues(RON mn)
6474
191
243
2015 Q1 2016 2016 Q1 2017
Distribution segment overview
18

SDTN Overview (Cont’d)
Network Losses(GWh)
Costs due to Network Losses(RON mn)
Network Losses(%)
134
41
136
60
2015 Q1 2016 2016 Q1 2017
632
192
640
200
2015 Q1 2016 2016 Q1 2017
11.48% 11.08% 10.96%
12.34%
10.96% 10.75% 10.43%
12.33%
Reg. Realised Reg. Realised Reg. Realised Reg. Realised
2015 Q1 2016 2016 Q1 2017
Distribution segment overview
19
Source: Company data.
Capex(RON mn)
2.59
0.71
2.67
0.74
1.79
0.48
1.91
0.50
0.55
0.13
0.55
0.13
4.93
1.32
5.13
1.37
2015 Q1 2016 2016 Q1 2017
Low Voltage Medium Voltage High Voltage
Distributed Volumes (TWh)
223
37
234
35
2015 Q1 2016 2016 Q1 2017

135
16
98
-19
2015 Q1 2016 2016 Q1 2017
263
40
227
10
2015 Q1 2016 2016 Q1 2017
Societatea de Distributie a Energiei Electrice Muntenia Nord (SDMN) is a Ploiesti
based distribution subsidiary of Electrica
National market share (Volume): 15.4% (2015 ANRE Report)
Area covered: 28,962 km2
Users: 1.31 mn (Q1 2017)
Financials variances
o 76% lower EBITDA mainly due to significantly network losses higher sourcing cost
(price effect due to the historical highest energy acquisition prices)
o Significant decrease in net profit mainly due to EBITDA impact and higher
depreciation costs
o Weaker net cash position mainly due to higher bank loans related to network
investments financing and lower cash generation mainly due to lower revenues.
Overview
Key Financial Metrics
EBITDA(RON mn)
Net Profit(RON mn)
Net Debt/ (Cash)(RON mn)
Revenues(RON mn)
Source: Company data.
872
189
801
182
2015 Q1 2016 2016 Q1 2017
(121)(128)
(85)
(19)
2015 Q1 2016 2016 Q1 2017
Distribution segment overview
20
SDMN Overview

SDMN Overview (Cont’d)
Network Losses(GWh)
Costs due to Network Losses(RON mn)
Network Losses(%)
194
66
201
88
2015 Q1 2016 2016 Q1 2017
925
304
932
298
2015 Q1 2016 2016 Q1 2017
10.44%11.40%
10.03%
14.34%
10.03%
11.42%
10.05%
13.32%
Reg. Realised Reg. Realised Reg. Realised Reg. Realised
2015 Q1 2016 2016 Q1 2017
Distribution segment overview
21
Source: Company data
Capex(RON mn)
2.63
0.69
2.66
0.74
2.07
0.49
2.09
0.52
1.82
0.47
1.82
0.45
6.51
1.65
6.57
1.71
2015 Q1 2016 2016 Q1 2017
Low Voltage Medium Voltage High Voltage
Distributed Volumes(TWh)
152
28
162
23
2015 Q1 2016 2016 Q1 2017
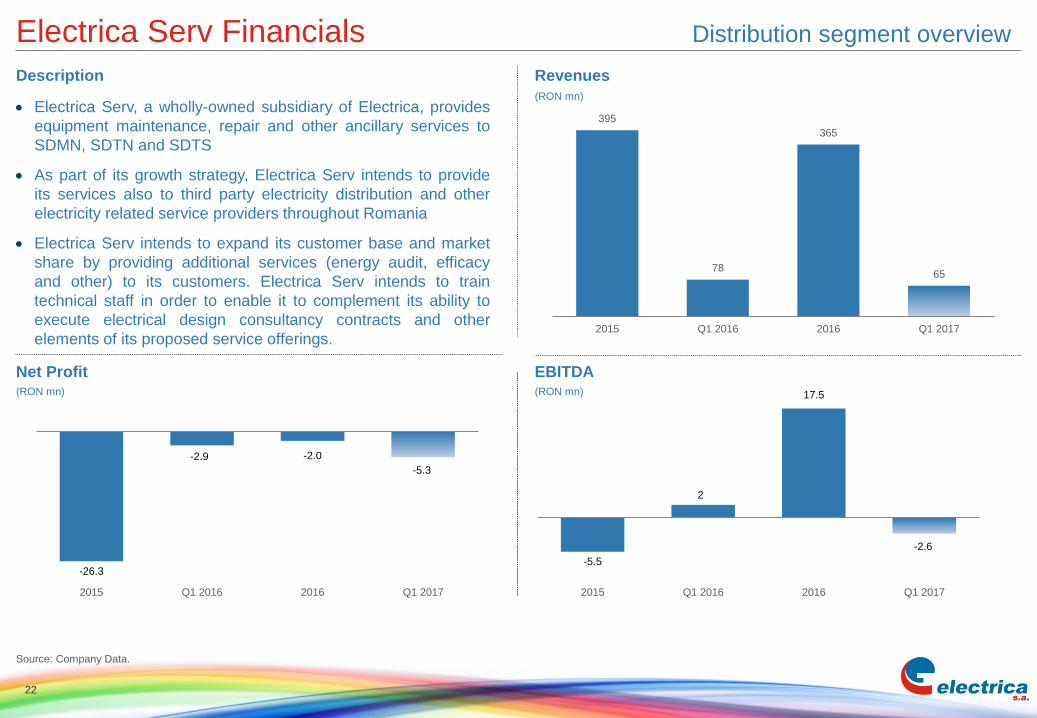
Electrica Serv, a wholly-owned subsidiary of Electrica, provides
equipment maintenance, repair and other ancillary services to
SDMN, SDTN and SDTS
As part of its growth strategy, Electrica Serv intends to provide
its services also to third party electricity distribution and other
electricity related service providers throughout Romania
Electrica Serv intends to expand its customer base and market
share by providing additional services (energy audit, efficacy
and other) to its customers. Electrica Serv intends to train
technical staff in order to enable it to complement its ability to
execute electrical design consultancy contracts and other
elements of its proposed service offerings.
Electrica Serv Financials
Net Profit
Revenues
(RON mn)
(RON mn)
Source: Company Data.
Description
395
78
365
65
2015 Q1 2016 2016 Q1 2017
Distribution segment overview
22
EBITDA(RON mn)
-5.5
2
17.5
-2.6
2015 Q1 2016 2016 Q1 2017
-26.3
-2.9 -2.0
-5.3
2015 Q1 2016 2016 Q1 2017

Supply Overview
Highlights
Executive Summary
Distribution Overview
Supply Overview
Corporate Governance
23
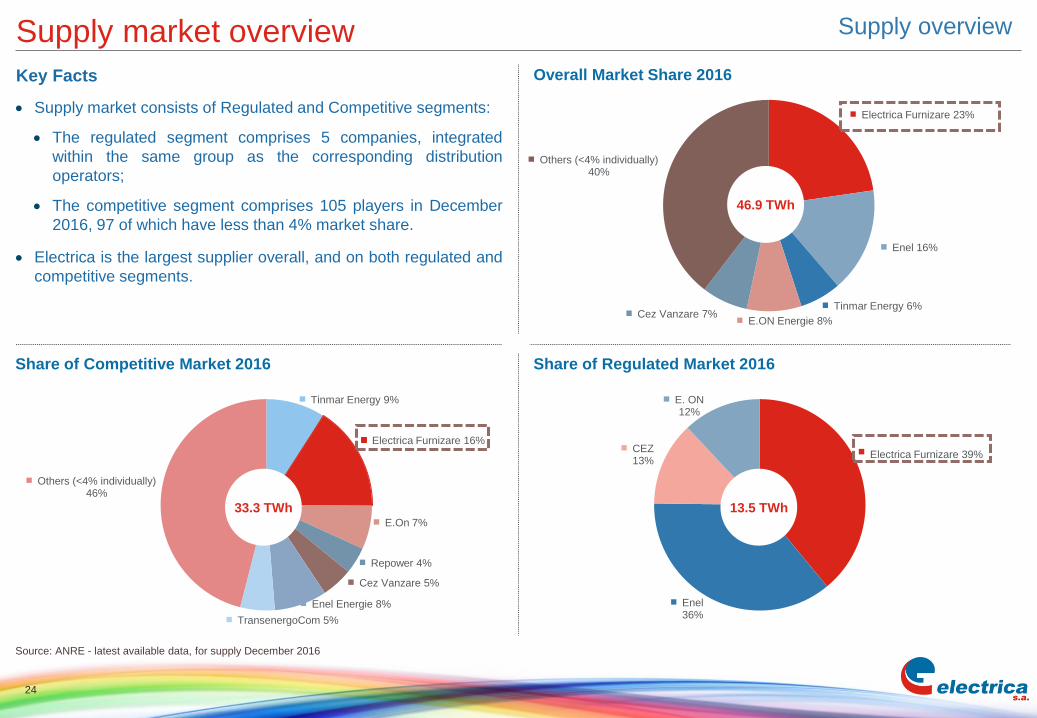
Electrica Furnizare 23%
Enel 16%
Tinmar Energy 6%
E.ON Energie 8%Cez Vanzare 7%
Others (<4% individually)40%
Supply market overview
Key Facts
Supply market consists of Regulated and Competitive segments:
The regulated segment comprises 5 companies, integrated
within the same group as the corresponding distribution
operators;
The competitive segment comprises 105 players in December
2016, 97 of which have less than 4% market share.
Electrica is the largest supplier overall, and on both regulated and
competitive segments.
Overall Market Share 2016
Share of Competitive Market 2016 Share of Regulated Market 2016
Source: ANRE - latest available data, for supply December 2016
46.9 TWh
Electrica Furnizare 39%
Enel36%
CEZ13%
E. ON12%
13.5 TWh
Supply overview
24
Tinmar Energy 9%
Electrica Furnizare 16%
E.On 7%
Repower 4%
Cez Vanzare 5%
Enel Energie 8%
TransenergoCom 5%
Others (<4% individually)46%
33.3 TWh

Regulated, 55%
Competitive, 45%
5.38
1.43
5.30
1.40
4.72
1.36
5.30
1.14
10.10
2.78
10.60
2.54
2015 Q1 2016 2016 Q1 2017
Regulated Competitive
Source: Company data.
Volume of Electricity Supplied on Retail Market(TWh)
Number of ConsumersConsumers (‘000’s)
3,520 3,518 3,469 3,436
90 91 131 162
3,610 3,609 3,600 3,598
2015 Q1 2016 2016 Q1 2017
Competitive Regulated
25
Supply business overview Supply overview
Average energy acquisition priceConsumers by Revenues (Q1 2017)
Regulated, 64%
Competitive, 36%
Consumers by Volume (Q1 2017)
160 160 154
200
2015 Q1 2016 2016 Q1 2017

4,142
1,081
4,031
1,106
347
111
401
91
4,488
1,192
4,432
1,197
2015 Q1 2016 2016 Q1 2017
Net Revenues Green Certificates
Key Financials
EBITDA(RON mn)
Net Profit(RON mn)
Net Debt / (Cash)(RON mn)
Revenues(RON mn)
Supply Segment Overview
Overview
Electrica Furnizare is the supply company of Electrica
Market share: 22.6% (December 2016 ANRE Report)
Consumers: 3.60 mn (Q1 2017)
Financials variances
o Significantly lower EBITDA and net profit mainly due to
significantly higher sourcing costs caused by the energy
market turmoil
o Strong net cash position in line with Q1 2016
Source: Company data.
165
57
185
(51)
2.4%
4.8%4.2%
(4.3)%
2015 Q1 2016 2016 Q1 2017
EBITDA EBITDA Margin
136
44
139
(54)
3.0%
3.7%3.1%
(4.5)%
2015 Q1 2016 2016 Q1 2017
Net Income Net Income Margin
(338)(302)
(465)
(312)
2015 Q1 2016 2016 Q1 2017
Supply overview
26
Regulated Market
Competitive Market
Electrica Furnizare
Coverage
Corporate Governance
Highlights
Executive Summary
Distribution Overview
Supply Overview
Corporate Governance
27
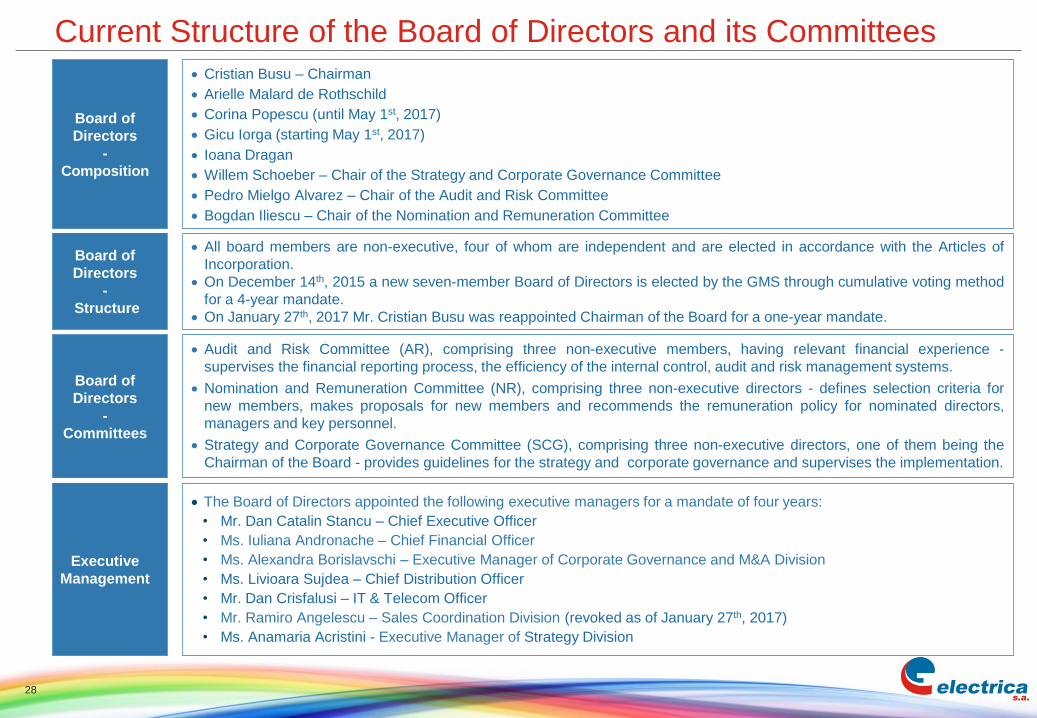
Current Structure of the Board of Directors and its Committees
28
Board of
Directors
-
Structure
Board of
Directors
-
Committees
All board members are non-executive, four of whom are independent and are elected in accordance with the Articles of
Incorporation.
On December 14th, 2015 a new seven-member Board of Directors is elected by the GMS through cumulative voting method
for a 4-year mandate.
On January 27th, 2017 Mr. Cristian Busu was reappointed Chairman of the Board for a one-year mandate.
Audit and Risk Committee (AR), comprising three non-executive members, having relevant financial experience -
supervises the financial reporting process, the efficiency of the internal control, audit and risk management systems.
Nomination and Remuneration Committee (NR), comprising three non-executive directors - defines selection criteria for
new members, makes proposals for new members and recommends the remuneration policy for nominated directors,
managers and key personnel.
Strategy and Corporate Governance Committee (SCG), comprising three non-executive directors, one of them being the
Chairman of the Board - provides guidelines for the strategy and corporate governance and supervises the implementation.
Board of
Directors
-
Composition
Cristian Busu – Chairman
Arielle Malard de Rothschild
Corina Popescu (until May 1st, 2017)
Gicu Iorga (starting May 1st, 2017)
Ioana Dragan
Willem Schoeber – Chair of the Strategy and Corporate Governance Committee
Pedro Mielgo Alvarez – Chair of the Audit and Risk Committee
Bogdan Iliescu – Chair of the Nomination and Remuneration Committee
The Board of Directors appointed the following executive managers for a mandate of four years:
• Mr. Dan Catalin Stancu – Chief Executive Officer
• Ms. Iuliana Andronache – Chief Financial Officer
• Ms. Alexandra Borislavschi – Executive Manager of Corporate Governance and M&A Division
• Ms. Livioara Sujdea – Chief Distribution Officer
• Mr. Dan Crisfalusi – IT & Telecom Officer
• Mr. Ramiro Angelescu – Sales Coordination Division (revoked as of January 27th, 2017)
• Ms. Anamaria Acristini - Executive Manager of Strategy Division
Executive
Management
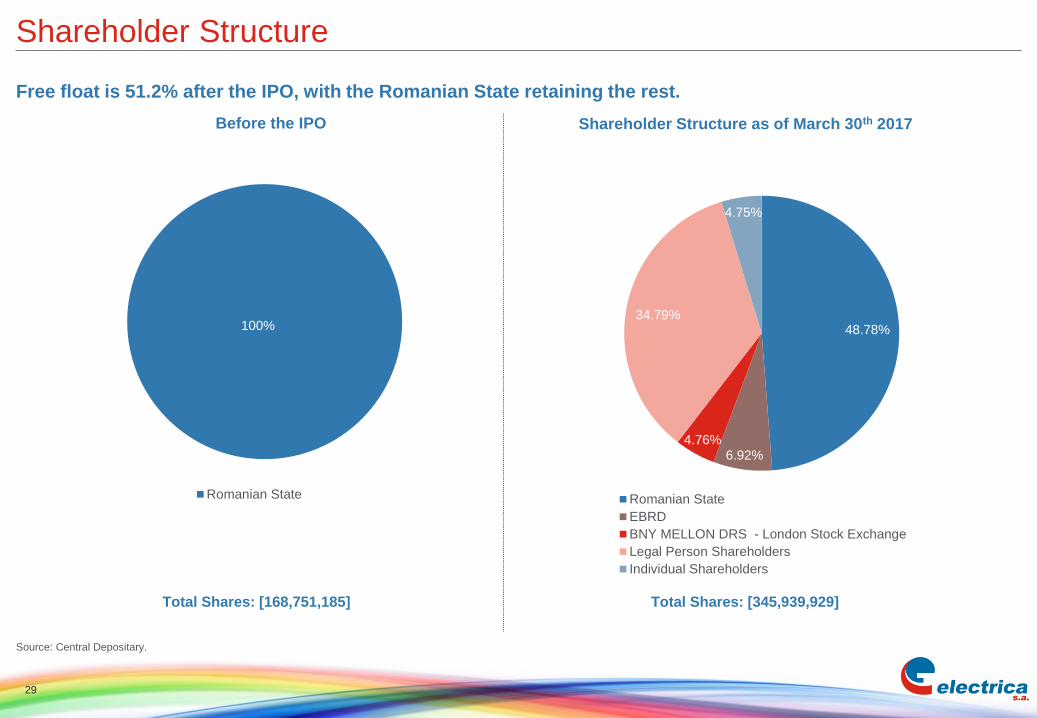
Shareholder Structure
29
Shareholder Structure as of March 30th 2017
100%
Romanian State
Before the IPO
Source: Central Depositary.
Total Shares: [168,751,185] Total Shares: [345,939,929]
Free float is 51.2% after the IPO, with the Romanian State retaining the rest.
48.78%
6.92%4.76%
34.79%
4.75%
Romanian State
EBRD
BNY MELLON DRS - London Stock Exchange
Legal Person Shareholders
Individual Shareholders
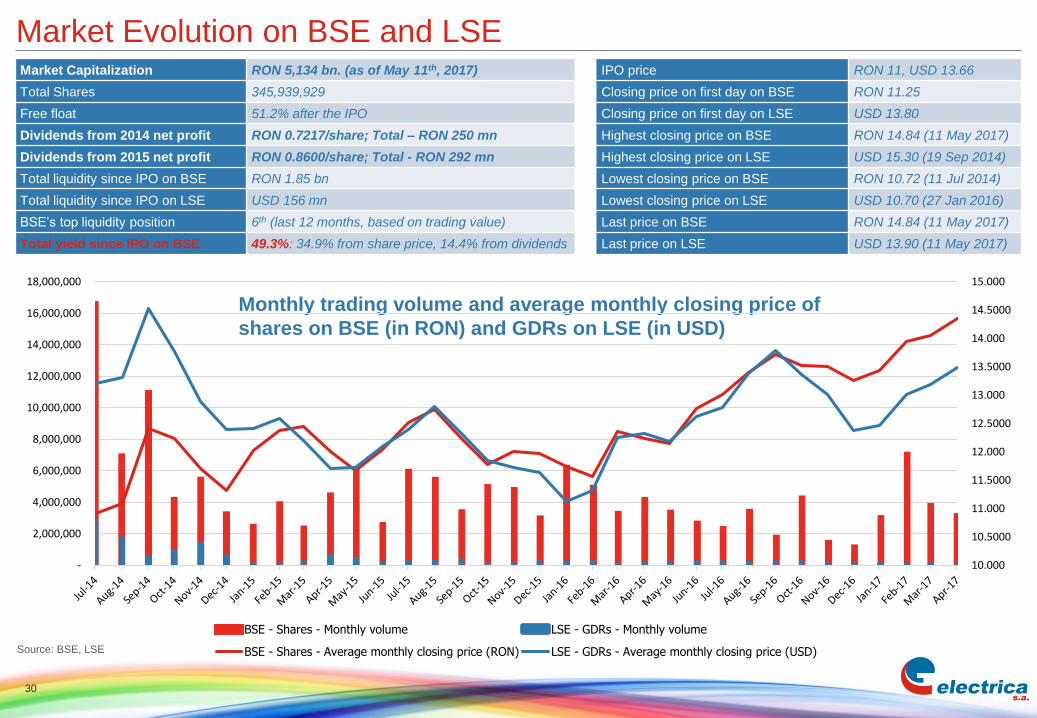
Source: BSE, LSE
Market Evolution on BSE and LSE
30
Monthly trading volume and average monthly closing price of
shares on BSE (in RON) and GDRs on LSE (in USD)
Market Capitalization RON 5,134 bn. (as of May 11th, 2017) IPO price RON 11, USD 13.66
Total Shares 345,939,929 Closing price on first day on BSE RON 11.25
Free float 51.2% after the IPO Closing price on first day on LSE USD 13.80
Dividends from 2014 net profit RON 0.7217/share; Total – RON 250 mn Highest closing price on BSE RON 14.84 (11 May 2017)
Dividends from 2015 net profit RON 0.8600/share; Total - RON 292 mn Highest closing price on LSE USD 15.30 (19 Sep 2014)
Total liquidity since IPO on BSE RON 1.85 bn Lowest closing price on BSE RON 10.72 (11 Jul 2014)
Total liquidity since IPO on LSE USD 156 mn Lowest closing price on LSE USD 10.70 (27 Jan 2016)
BSE’s top liquidity position 6th (last 12 months, based on trading value) Last price on BSE RON 14.84 (11 May 2017)
Total yield since IPO on BSE 49.3%: 34.9% from share price, 14.4% from dividends Last price on LSE USD 13.90 (11 May 2017)
10.000
10.5000
11.000
11.5000
12.000
12.5000
13.000
13.5000
14.000
14.5000
15.000
-
2,000,000
4,000,000
6,000,000
8,000,000
10,000,000
12,000,000
14,000,000
16,000,000
18,000,000
BSE - Shares - Monthly volume LSE - GDRs - Monthly volume
BSE - Shares - Average monthly closing price (RON) LSE - GDRs - Average monthly closing price (USD)
Source: Company data; BSE
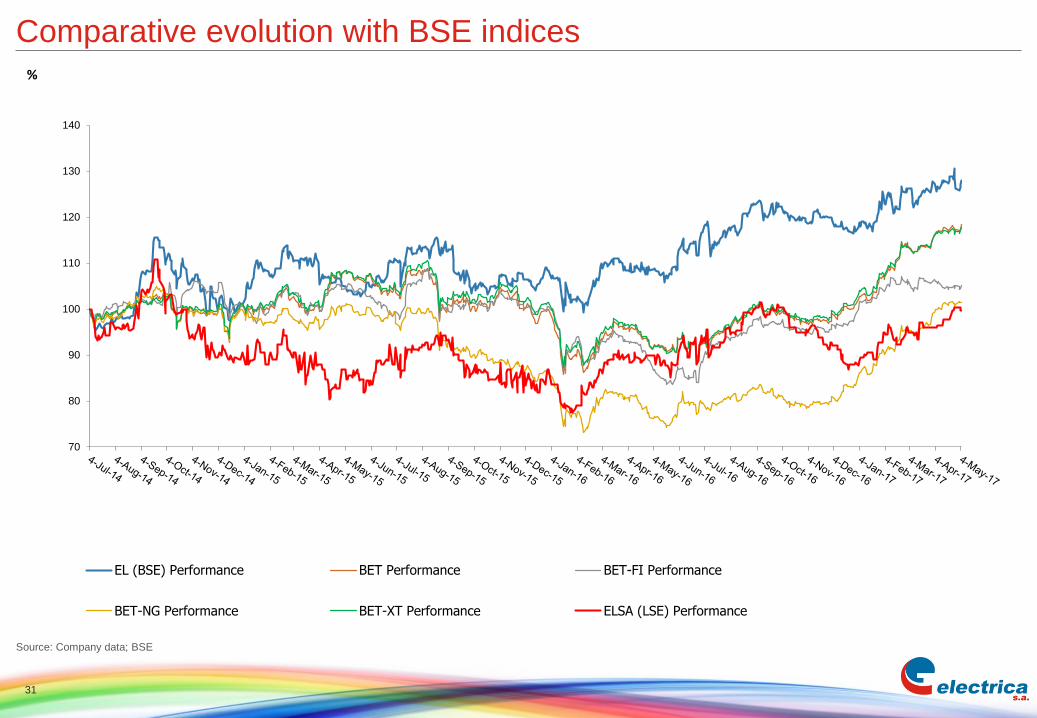
Comparative evolution with BSE indices
31
70
80
90
100
110
120
130
140
EL (BSE) Performance BET Performance BET-FI Performance
BET-NG Performance BET-XT Performance ELSA (LSE) Performance
%
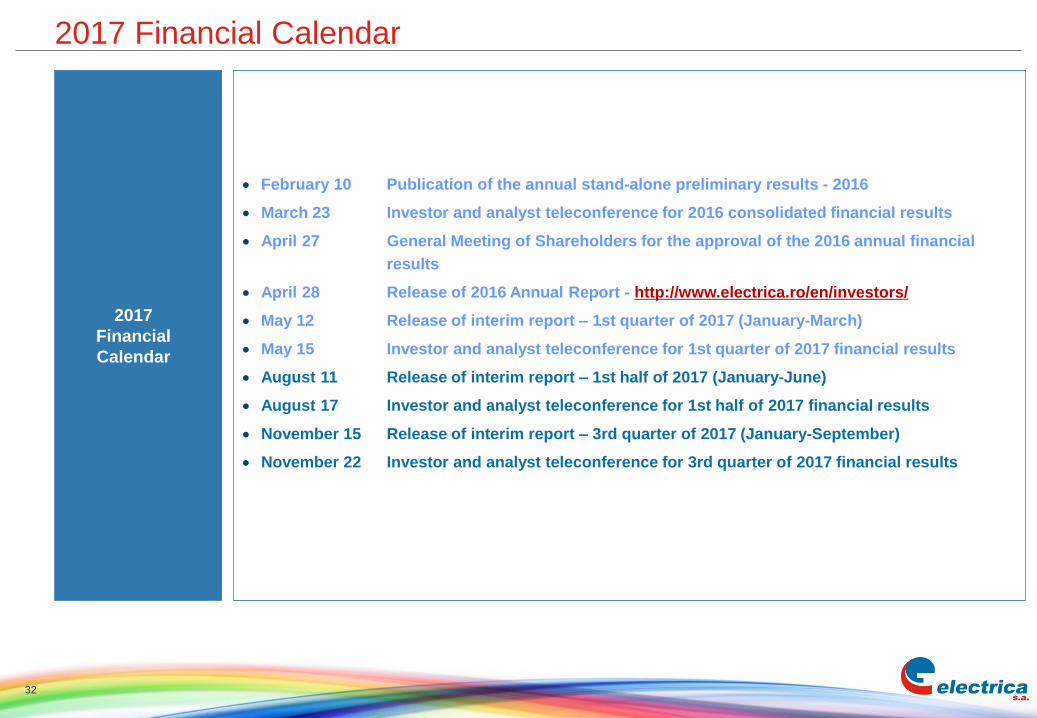
2017 Financial Calendar
February 10 Publication of the annual stand-alone preliminary results - 2016
March 23 Investor and analyst teleconference for 2016 consolidated financial results
April 27 General Meeting of Shareholders for the approval of the 2016 annual financial
results
April 28 Release of 2016 Annual Report - http://www.electrica.ro/en/investors/
May 12 Release of interim report – 1st quarter of 2017 (January-March)
May 15 Investor and analyst teleconference for 1st quarter of 2017 financial results
August 11 Release of interim report – 1st half of 2017 (January-June)
August 17 Investor and analyst teleconference for 1st half of 2017 financial results
November 15 Release of interim report – 3rd quarter of 2017 (January-September)
November 22 Investor and analyst teleconference for 3rd quarter of 2017 financial results
2017
Financial
Calendar
32