Embed Size (px)
Citation preview

1
Presentation on Wake TurbulenceRe-Categorization Phase I
Methodology and Safety Case
June 20, 2011TU Berlin
Berlin, Germany

2
Outline
Background
Methodology
Safety
Summary

3
Problem Statement
Demand for airport capacity increases every year
Current ICAO wake separation standards are widely viewed as being outdated
Many ANSP’s globally have developed their individual variations from the ICAO standard
International cooperation exists for addressing ICAO wake standards for the introduction of new large aircraft into service

4
EUROCONTROL / FAA Cooperation
In November 2006, ICAO requested the FAA and EUROCONTROL to lead an effort to harmonize wake separation standards for all aircraft
Study being performed under a EUROCONTROL / FAA Memorandum of Cooperation
20+ Coordinated Action Plans
Action Plan 14 deals with Wake Turbulence
Agree on strategy and sharing of work
Promote global harmonization
Jointly approach ICAO

5
Program ParticipantsJoint effort led by FAA and EUROCONTROL
Federal Aviation Administration FAA
ATO Air Traffic Operations
AVS Aviation Safety
EUROCONTROL
Airspace Department
Performance and Methods/Safety Assessment
Performance and Methods/Validation
Supporting Organizations
Department of Transportation Volpe Center
Det
Norske Veritas
International Subject Matter Experts

6
Recategorization is a Three Phase Effort
Phase 1 is Static 6 Category Separation
Results to be presented in this talk
Phase 2 is static pair-wise separation
Phase 3 is dynamic pair-wise separation
All three phases are required steps towards NextGen and SESAR
7
Proposed Implementation of RECAT
Not a Big Bang Implementation
RECAT and Today’s ICAO categories are safe
Both categorizations can co-exist
Performance Based Transition
Each ANSP can transition to RECAT when needed
Transition Decision by one ANSP has No Impact on Adjacent ANSP
No Required Changes to ICAO Flight Plan

8
Background (1 of 2)
Current predictions indicate a doubling of air traffic by 2025
Current ICAO, US and European separation standards are different, but all are safe
In the US or Europe there has never been an accident caused by wake vortex under IFR separations and procedures
Wake research and improved sensors provide an opportunity to increase capacity and harmonize separation standards while providing the same or increased safety over existing standards

9
Background (2 of 2)
ICAO effectively has 3+1 categories (Light, Medium, Heavy, A380)
US has 6 categories (Small, Small+, Large, B757, Heavy, A380)
Many European ANSP's use variations from ICAO categories, e.g. NATS UK utilizes 6 categories
NextGen and SESAR will incorporate dynamic pair-wise separation, using individual aircraft pair separations based on current weather and operational parameters
RECAT 6 Categories is the first step to NextGen and SESAR
Static Pair-wise (Phase 2) is the next step
10
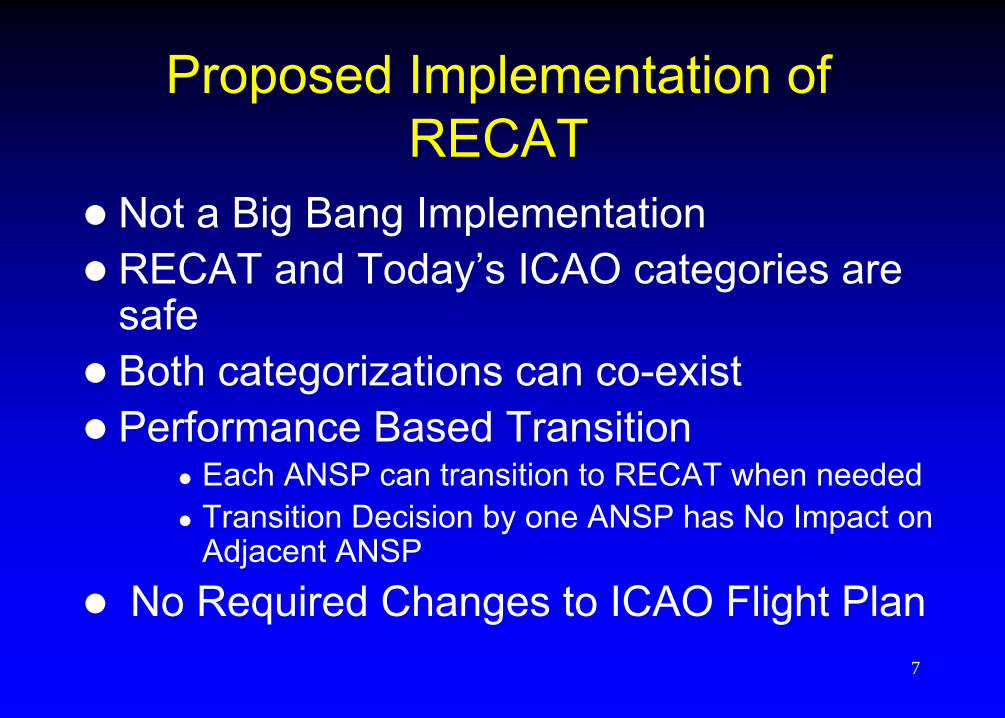
Importance of Phase I
Intense 4+ year effort
Significant Resources Sustained on a Monthly Basis
R&D Funding
World preeminent wake scientists
Operations expertise
Regulatory expertise
Safety expertise
WAKE VORTEX HIGH LEVEL PLANNING2008 2009 2010 2011
Q1 Q2 Q3 Q4 Q1 Q2 Q3 Q4 Q1 Q2 Q3 Q4
RECAT Phase 1
Joint Joint EUROCONTROL / EUROCONTROL / FAA PlanFAA Plan
Agree modelsAgree models
Safety Safety CaseCase
ICAO ICAO SubmitionSubmition
Q3 Q4
Implementation Implementation GuidanceGuidanceHuman Human
FactorsFactors CaseCaseNew New categoriescategories
Business CaseBusiness Case

11
Requirements and Scope of the Effort
Safety: As safe or safer than today
Transparency: Openly available tools and data
Optimization:
Provides new categories and separations optimized to current fleet mixes and evaluated for potential future fleet mixes
Focuses on 61 representative aircraft types
Applies to Arrival and Departure
Distance and time based separation provided for approach and departure
Increase capacity

12
Next Phases
2010 2012 2014 2016 2018 2020
RECAT Phase 1 Delivered to ICAO
RECAT Phase 1 First ANSP Implementation
RECAT Phase 2 Delivered to ICAO
RECAT Phase 3 Dynamic Pairwise Separation Delivered to ICAO

13
Current ICAO Matrix
Follower
A380 Heavy Medium Light
A380 6NM 7NM 8NM
Heavy 4NM 5NM 6NM
Medium 5NM Lea
der
Light

14
RECAT Separation Table

15
RECAT Separation Matrix
Separation was increased for some or all aircraft pairs
Separation was decreased for some or all aircraft pairs
MRS Minimum Radar Separation (3NM, or 2.5 NM when existing requirements are met)
Separation remained the same for some or all aircraft pairs
A B C D E FA MRS 5.0 6.0 7.0 7.0 8.0B MRS 3.0 4.0 5.0 5.0 7.0C MRS MRS MRS 3.5 3.5 6.0D MRS MRS MRS MRS MRS 5.0E MRS MRS MRS MRS MRS 4.0F MRS MRS MRS MRS MRS MRS
Lea
der
FollowerRECAT Separation Matrix
MRS4.05.06.07.08.0

16
Categories: ICAO vs. RECAT (61 aircraft types)
LightSuper
ICAO
RECAT
Heavy Medium
B C D E F
Light
ICAO
RECAT
Medium
B C D E F
ICAO
RECAT
Medium
B C D E F
ICAO
RECAT
Medium
B C D E FA

17
61 Aircraft Types Used in RECATManufacturer Model Equip Manufacturer Model EquipAerospatiale ATR 42-300 AT43Aerospatiale ATR 42-500 AT45 Boeing DC-9-30 DC93Aerospatiale ATR 72 AT72 Boeing DC-9-50 DC95
Airbus A306 A306 Boeing MD-11 MD11Airbus A318 A318 Boeing MD-82 MD82Airbus A319 A319 Boeing MD-83/MD-88 MD83/88Airbus A320 A320 Bombardier CRJ-100 CRJ1Airbus A321 A321 Bombardier CRJ-200 CRJ2Airbus A330-200 A332 Bombardier CRJ-700 CRJ7Airbus A330-300 A333 Bombardier CRJ-900 CRJ9Airbus A340-300 A343 Bombardier DHC8-100 DH8AAirbus A340-600 A346 Bombardier DHC8-200 DH8BAirbus A380 A380 Bombardier DHC8-300 DH8CAvro RJ-85 RJ85 Bombardier DHC8-Q400 DH8DAvro RJ-100 RJ1H British Aerospace Bae 146-200 B462
Beechcraft 1900D B190 British Aerospace Bae 146-300 B463Boeing B717-200 B712 Cessna Citation CJ1 C525Boeing B727-200 B722 Cessna 650 C-III/VI/VII C650Boeing B737-300 B733 Embraer EMB-120 E120Boeing B737-400 B734 Embraer EMB-135 E135Boeing B737-500 B735 Embraer EMB-145 E145Boeing B737-600 B736 Embraer EMB-170 E170Boeing B737-700 B737 Embraer EMB-190 E190Boeing B737-800 B738 Embraer EMB-145XR E45XBoeing B737-900 B739 Fokker F-50 F50Boeing B747-400 B744 Fokker F-70 F70Boeing B757-200 B752 Fokker F-100 F100Boeing B757-300 B753 Gulfstream G-4 GLF4Boeing B767-300 B763 Gulfstream G-5 GLF5Boeing B777-200 B772 Saab 340 SF34Boeing B777-300 B773 Raytheon 125-700 H25B

18
Selected Aircraft by CategoryA B C D E F
A380 B744 MD11 B753 DH8C E120AN-225 A346 B763 B752 AT72 B190
B773 A306 B739 RJ100 C650B772 B738 RJ85 H25BA343 B737 B463 C525A333 B736 B462A332 A319 E170
A318 DH8BA321 DH8AA320 CRJ9B722 AT45MD83 AT43MD82 GLF4
F50 CRJ7B734 SF34B733 CRJ2B735 CRJ1E190 E45XB717 E145GLF5 E135DC95DC93DH8DF100
• Selected aircraft listed here, plus all 9000+ ICAO registered aircraft were successfully assigned to these 6 categories

19
Project Assumptions (1/2)
All Current ICAO Separations are Acceptably Safe
Results to be Applicable for Approach and Departure and under all weather conditions
No required changes on the flight deck
Minimum modifications on the ground (if any)
Minimum changes in procedures
Multiple aircraft parameters considered, in addition to weight (wingspan, speed, lift force distribution)
20
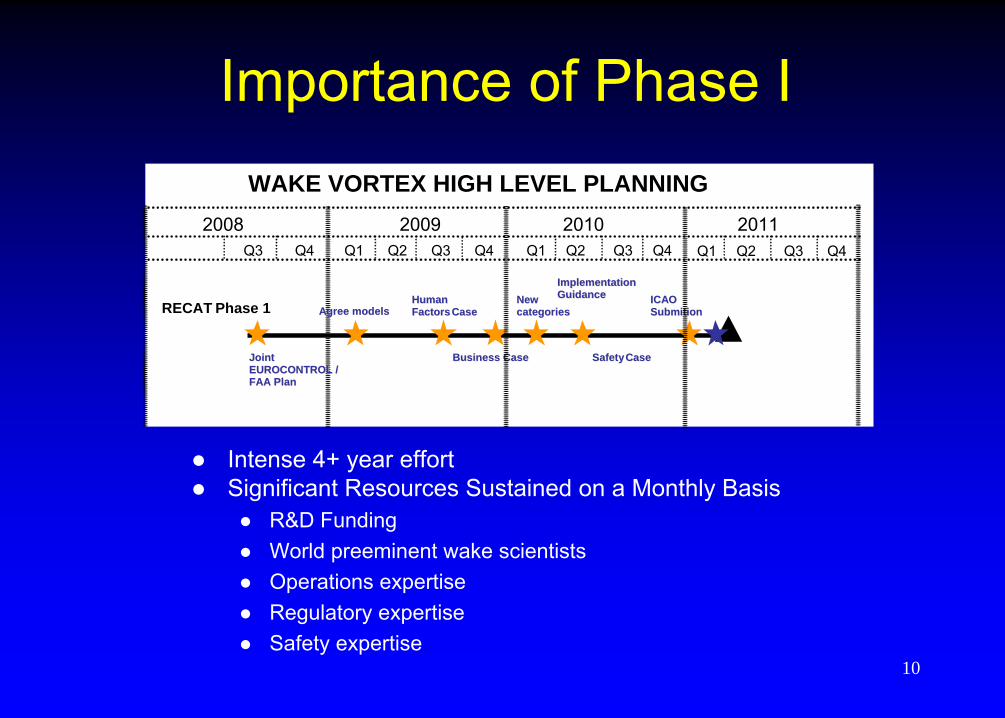
Project Assumptions (2/2)
Methodology developed to categorize future aircraft types
Reasonable worst case wake strength from airport operational data
Analysis performed at threshold, where wake encounters are most critical
Optimization based on traffic mixes from 4 European and 5 US congested airports
Capacity gain will
Provide benefit at constrained airports as well as other airports world wide
More than justify minimum changes to procedures and on the ground
Used airport operational measurements and presently available knowledge

21
Traffic Samples
4 European airports:
Heathrow (EGLL)
Amsterdam (EHAM)
Frankfurt (EDDF)
Paris “Charles de Gaulle”(LFPG)
5 U.S. airports:
Atlanta (KATL)
Newark (KEWR)
John F. Kennedy (KJFK)
Chicago O’Hare (KORD)
San Francisco (KSFO)
Representative traffic mix of 61 aircraft types (85% of the traffic)

22
Operational Percentage in US and Europe
A306 0.69% A306 2.53% CRJ9 1.51% CRJ9 0.17%A318 0.06% A318 0.79% DC93 0.14% DC93 0.00%A319 2.87% A319 6.18% DC95 0.26% DC95 0.00%A320 7.17% A320 9.86% DH8A 0.00% DH8A 0.00%A321 0.25% A321 5.96% DH8B 0.06% DH8B 0.00%A332 0.39% A332 0.21% DH8C 0.00% DH8C 1.10%A333 0.18% A333 1.55% DH8D 0.97% DH8D 0.87%A343 0.31% A343 0.80% E120 1.46% E120 0.00%A346 0.43% A346 0.28% E135 2.14% E135 0.29%AT43 0.00% AT43 0.11% E145 8.48% E145 0.65%AT72 0.80% AT72 0.06% E170 2.37% E170 1.26%B190 0.00% B190 0.04% E190 1.33% E190 0.00%B712 4.28% B712 0.00% E45X 0.88% E45X 0.00%B722 0.18% B722 0.00% GLF4 0.08% GLF4 0.06%B733 3.00% B733 11.76% GLF5 0.05% GLF5 0.04%B734 0.38% B734 4.52% MD11 0.38% MD11 1.30%B735 2.36% B735 5.21% MD82 3.29% MD82 0.58%B736 0.00% B736 0.77% MD83/88 8.07% MD83 0.02%B737 2.85% B737 1.71% SF34 0.00% SF34 0.01%B738 4.53% B738 7.12%B739 0.23% B739 1.58%B744 2.74% B744 2.84% H25B 0.12%B752 10.30% B752 0.46%B753 0.39% B753 0.14% AT45 0.05%B763 3.25% B763 1.60% A380 0.00%B772 1.81% B772 0.90% RJ85 1.13%B773 0.15% B773 0.17% RJ1H 0.08%C525 0.02% C525 0.11% B462 0.58%C650 0.02% C650 0.04% B463 2.75%CRJ1 0.82% CRJ1 0.00% F50 2.91%CRJ2 11.21% CRJ2 1.58% F70 7.81%CRJ7 6.74% CRJ7 0.89% F100 6.38%
US Only Aircraft
European Only
US Avg Peak European Peak US Avg Peak European Peak

23
Methodology
Focused on representative aircraft for process efficiency
Wake strength used as the primary hazard metric
Data driven wake decay used to derive the hazard metric
Wake decay data from both
US and Europe used joint FAA and EUROCONTROL measurements from both continents
Historically, 5-15m circulation gives good agreement with flight test encounter data
Also used rolling moment coefficient as a metric
Categories optimized for capacity increase
Simple Relative Safety argument: Same or better than today

24
7. Establish the Allowed Severity at Potential
Encounter for Each Follower
1. Aircraft Characteristics
2. Wake Vortex Measurements (US and EU)
9. Optimize Aircraft Categories for Capacity Increase
11. Expert Review and Adjustments
10. Traffic Mix
3. Data Driven Circulation Decay Fit
5. Determine Vortex Strength Under ICAO
Standards for Each Aircraft Pair
6. Safety Considerations4. Severity Metric: Vortex Strength
and Rolling Moment Coefficient
8. Determine New Separations for Each Aircraft Pair
13. Calculate Capacity Increase
12. Additional Safety Considerations
14. Proceed to Safety Assessment

25
#1 Aircraft Characteristics
Focused on 61 aircraft types comprising 85% of traffic at busiest European and US airports
Extended to include 9000+ aircraft types globally
Publicly available data
26
#2 Wake Vortex Measurements
Wake data collected in low wind conditions at both US and European sites (16,112 tracks from 15 different aircraft types obtained at 2 European and 3 US airports )
Used data from three different sensors: continuous- wave Lidar, pulsed Lidar and a line of propeller
anemometers (windline)
Reasonable worst case: Nearly all data collected with winds of 5 kt or less
Data collected near threshold, since this is considered to be the most dangerous phase of flight

27
Results From the Aviation Safety Reporting System (ASRS)

28
#3 Data Driven Circulation Decay Fit
Long lasting wakes used in wake strength (circulation) decay fit
For Safety, reasonable worst case used
Decay fit derived through European and US collaboration
16,112 aircraft tracks
15 aircraft types
5 different airports
3 different wake sensors

29
Median Data, Fit (Thin Line), and 95% Confidence Interval (Thick Line)

30
Median Data

31
Median Data with Bounds

32
Median Data with Bounds and Fit

33
Median Data with Fit

34
Median Data, Fit (Thin Line), and 95% Confidence Interval (Thick Line)

35
#4 Severity Metrics
Wake strength used as the primary hazard metric
Rolling Moment Coefficient was also used as a hazard metric
Aircraft size and resistance to vortex encounter considered for aircraft in the top end of the ICAO Heavy category
Other considerations in support of safety assessment used to add additional conservativeness and confidence
Roll Control Authority
Bank Angle

36
#5 Determine Vortex Strength Under ICAO Standards For Each Aircraft Pair
For each aircraft pair:
Used generator aircraft characteristics to determine initial wake strength
Used follower speed to determine time interval between wake generated and potentially encountered by follower at ICAO separation
Used wake strength decay fit to operational data to determine wake strength at current ICAO separation standard

37
Initial Wake Strength From a Generator
Гo
= g W / ( U bo
)
where bo = (/4)
wing span,g is the acceleration due to gravity, is the air density, and W and U are the weight and speed of the aircraft. (In this analysis, 85% of the maximum landing weight and the final approach speed for each aircraft are used to calculate circulation)

38
Validity of the Assumption of 85% of MLW (from NASA)
0
50,000
100,000
150,000
200,000
250,000
300,000
0 50,000 100,000 150,000 200,000 250,000 300,000Maximum Landing Weight (kg)
Ave
rage
Rep
orte
d L
andi
ng W
eigh
t (kg
)
85% of MLW
Aircraft weight data

39
Time Interval Between Wake Generator and Follower Aircraft
Under ICAO Separations
All aircraft are assumed to follow a certain speed profile (next slide)
Time interval found using ICAO distance separations
Circulation decay fit used to determine median circulations (or longest lasting wakes) under current ICAO separations

40
Speed Profile for All Aircraft
Distance from Threshold (nm)0 5
170 kt
-15 kt/nm(or -19 kt/nm)
6
Air
craf
t spe
ed
Final Approach Speed
Needed for DHC8-100, DHC8- 200, DHC8-300, and ATR-42-300 only, to achieve final approach speeds above 500 feet glide slope altitude

41
#6 Safety Considerations
Current ICAO separation standards are acceptably safe
Safety of smaller aircraft enhanced by increasing separations
Wake strength exposure under RECAT limited to 75% of that allowed under ICAO today

42
#7 Establish the Allowed Wake Strength at Potential Encounter for Each Follower
Not to exceed wake strength values potentially encountered today under ICAO standards
Except for category B, where rolling moment coefficient was used
Additional conservativeness added for lightest, most vulnerable aircraft

43
Found Maximum Median Allowed Circulations Under ICAO Today
Approach speed profile and circulation decay fit used for each 61 by 61 aircraft pairs
Found the maximum median circulation allowed today for any follower following all 61 generators
Used this circulation
Allowable since all ICAO separation standards are acceptably safe today

44
Maximum Median Allowable Circulations Under ICAO Today
0
50
100
150
200
250
300
350
400
450
500A
380
B74
4A
346
B77
3B
772
A34
3A
333
A33
2M
D11
B76
3A
306
B75
3B
752
B73
9B
738
B73
7B
736
A31
9A
318
A32
1A
320
B72
2M
D83
MD
82 F50
B73
4B
733
B73
5E
190
B71
7G
LF5
DC
95D
C93
DH
8DF1
00 F70
DH
8CA
T72
RJ1
00R
J85
B46
3B
462
E17
0D
H8B
DH
8AC
RJ9
AT
45A
T43
GL
F4C
RJ7
SB34
CR
J2C
RJ1
E45
XE
145
E13
5E
120
B19
0C
650
H25
BC
525
Aircraft
Cir
cula
tion,
m2 /s
ec
ICAO Baseline Max Median Circulations

45
#8 Determine New Separations for Each Aircraft Pair
Computed RECAT separation matrix for each 61 by 61 aircraft pair using the allowed wake strength values on last slide

46
#9 Optimize Aircraft Categories for Capacity Increase
Aircraft grouped into categories and total separation distance computed
Separation for each aircraft pair changed to maximum within a category
All possible groupings computed
Initial sorted list maintained for groupings
Optimized set of categories found for maximum capacity
47
Example With 5 Aircraft and 3 Categories
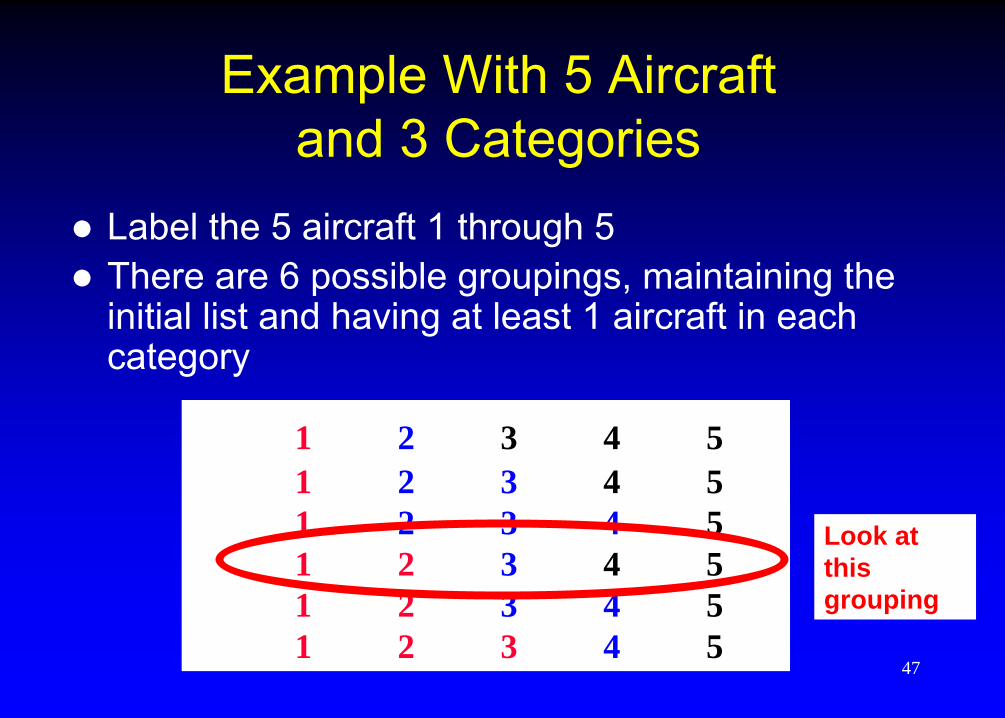
Label the 5 aircraft 1 through 5
There are 6 possible groupings, maintaining the initial list and having at least 1 aircraft in each category
1 2 3 4 51 2 3 4 51 2 3 4 51 2 3 4 51 2 3 4 51 2 3 4 5
Look at this grouping

48
Example Separations From 1 Grouping
Follower=> 1 2 3 4 5Leader 1: 4.0 5.0 5.0 6.0 6.5Leader 2: 4.0 4.5 4.5 5.0 5.5Leader 3: 3.5 4.0 4.0 4.5 5.0Leader 4: 3.0 3.5 3.5 4.0 4.5Leader 5: 2.5 2.5 3.0 3.0 3.5
Separations for the first category leading the first category

49
Example Separations From 1 Grouping
Follower=> 1 2 3 4 5Leader 1: 4.0 5.0 5.0 6.0 6.5Leader 2: 4.0 4.5 4.5 5.0 5.5Leader 3: 3.5 4.0 4.0 4.5 5.0Leader 4: 3.0 3.5 3.5 4.0 4.5Leader 5: 2.5 2.5 3.0 3.0 3.5
Separations for the second category leading the first category

50
Example Separations From 1 Grouping
Follower=> 1 2 3 4 5Leader 1: 4.0 5.0 5.0 6.0 6.5Leader 2: 4.0 4.5 4.5 5.0 5.5Leader 3: 3.5 4.0 4.0 4.5 5.0Leader 4: 3.0 3.5 3.5 4.0 4.5Leader 5: 2.5 2.5 3.0 3.0 3.5
Separations for the first category leading the first category
For safety, all these separations need to be changed to the largest in the grouping

51
Example Separations From 1 Grouping
Follower=> 1 2 3 4 5Leader 1: 4.0 5.0 5.0 6.0 6.5Leader 2: 4.0 4.5 4.5 5.0 5.5Leader 3: 3.5 4.0 4.0 4.5 5.0Leader 4: 3.0 3.5 3.5 4.0 4.5Leader 5: 2.5 2.5 3.0 3.0 3.5
Follower=> 1 2 3 4 5Leader 1: 5.0 5.0 5.0 6.5 6.5Leader 2: 5.0 5.0 5.0 6.5 6.5Leader 3: 4.0 4.0 4.0 5.0 5.0Leader 4: 3.5 3.5 3.5 4.5 4.5Leader 5: 3.5 3.5 3.5 4.5 4.5

52
Example Separations From 1 Grouping
Follower=> 1 2 3 4 5Leader 1: 4.0 5.0 5.0 6.0 6.5Leader 2: 4.0 4.5 4.5 5.0 5.5Leader 3: 3.5 4.0 4.0 4.5 5.0Leader 4: 3.0 3.5 3.5 4.0 4.5Leader 5: 2.5 2.5 3.0 3.0 3.5
Separations for the second category leading the first category

53
Example Separations From 1 Grouping
Follower=> 1 2 3 4 5Leader 1: 4.0 5.0 5.0 6.0 6.5Leader 2: 4.0 4.5 4.5 5.0 5.5Leader 3: 3.5 4.0 4.0 4.5 5.0Leader 4: 3.0 3.5 3.5 4.0 4.5Leader 5: 2.5 2.5 3.0 3.0 3.5
Follower=> 1 2 3 4 5Leader 1: 5.0 5.0 5.0 6.5 6.5Leader 2: 5.0 5.0 5.0 6.5 6.5Leader 3: 4.0 4.0 4.0 5.0 5.0Leader 4: 3.5 3.5 3.5 4.5 4.5Leader 5: 3.5 3.5 3.5 4.5 4.5

54
Example Separations From 1 Grouping
Follower=> 1 2 3 4 5Leader 1: 4.0 5.0 5.0 6.0 6.5Leader 2: 4.0 4.5 4.5 5.0 5.5Leader 3: 3.5 4.0 4.0 4.5 5.0Leader 4: 3.0 3.5 3.5 4.0 4.5Leader 5: 2.5 2.5 3.0 3.0 3.5
Follower=> 1 2 3 4 5Leader 1: 5.0 5.0 5.0 6.5 6.5Leader 2: 5.0 5.0 5.0 6.5 6.5Leader 3: 4.0 4.0 4.0 5.0 5.0Leader 4: 3.5 3.5 3.5 4.5 4.5Leader 5: 3.5 3.5 3.5 4.5 4.5
Initial Separation
Matrix
Final Separation
Matrix
Sum of all the separations is the capacity metric for each grouping ( 117 nm here)

55
Extension to 61 Aircraft
Example above is for one possible grouping of 5 aircraft into 3 categories
RECAT problem is to optimize 61 aircraft into 6 categories
Above example had 6 possible groupings
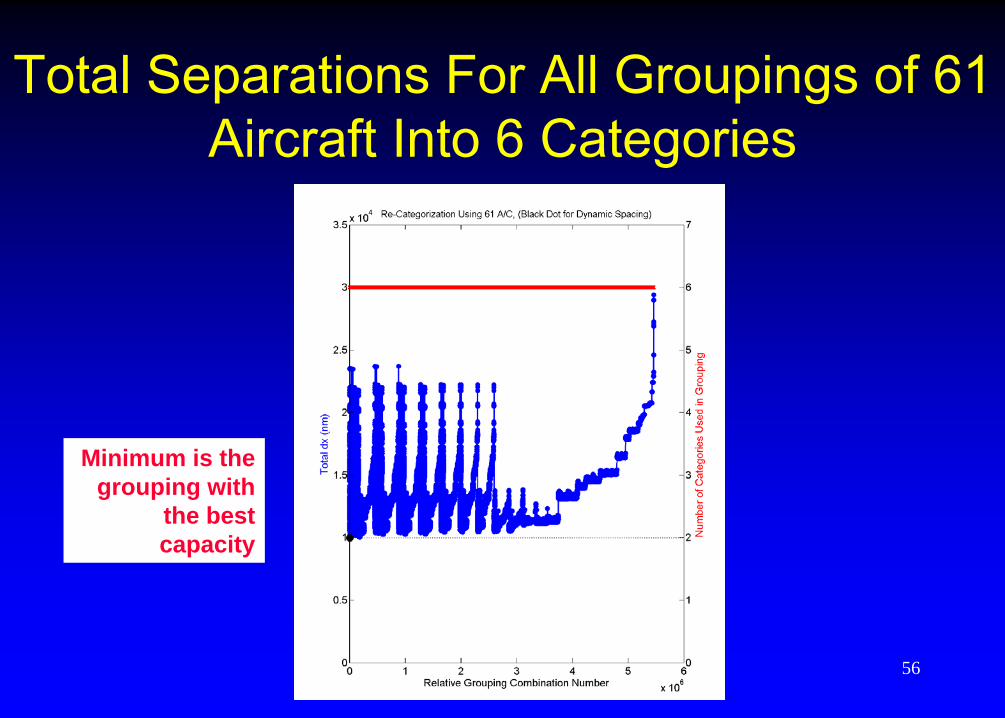
RECAT problem has 5,461,512 possible groupings
56
Total Separations For All Groupings of 61 Aircraft Into 6 Categories
Minimum is the grouping with
the best capacity

57
7. Establish the Allowed Severity at Potential
Encounter for Each Follower
1. Aircraft Characteristics
2. Wake Vortex Measurements (US and EU)
9. Optimize Aircraft Categories for Capacity Increase
11. Expert Review and Adjustments
10. Traffic Mix
3. Data Driven Circulation Decay Fit
5. Determine Vortex Strength Under ICAO
Standards for Each Aircraft Pair
6. Safety Considerations4. Severity Metric: Vortex Strength
and Rolling Moment Coefficient
8. Determine New Separations for Each Aircraft Pair
13. Calculate Capacity Increase
12. Additional Safety Considerations
14. Proceed to Safety Assessment

58
#10 Traffic Mix
Traffic mix was used in the optimization
Traffic mixes for the U.S. determined from five U.S. airports and for Europe determined from four European airports
US: Atlanta (ATL), Chicago (ORD), Newark (EWR), New York JFK (JFK), and San Francisco (SFO)
Europe: Amsterdam (AMS), Frankfurt (FRA), London Heathrow (LHR), and Paris Charles de Gaulle (CDG)
These traffic mixes are assumed to be representative of the larger fleet mix
Confirmed analyzing traffic mixes at world wide capacity constrained airports
Pair-wise statistics derived by assuming probability of occurrence of each aircraft is independent

59
Aircraft Traffic Mix
If the probabilities of occurrence of each aircraft and each aircraft pair are uniformly distributed, there is no need to modify the separation matrix
If there is a non-uniform traffic mix, the separation between the i-jth
pair is modified by
where N is the number of aircraft and Pij
is the probability of occurrence of the i-jth
aircraft pair
2ij ij ijt N t P

60
Aircraft Traffic Mix (cont.)
If the probabilities of occurrence of aircraft pairs are not available:
Can assume probabilities of occurrence for each aircraft are independent
Modify the separation matrix by
where Pi
and Pj
are the probability of occurrence of the ith
and jth
aircraft, respectively
2ij ij i jt N t P P

61
Average US Peak Traffic Mix

62
Average EU Peak Traffic Mix

63
Optimizations
Optimization performed for average US peak traffic and average EU peak traffic
Blending of US optimization and EU optimization performed
Looked at optimizing based on maximum take off weight, wingspan, rolling moment of inertia, and pair-wise separation

64
Capacity Gains for Different Sorting
Capacity Gains Using Different Sort Order
6.0
6.2
6.4
6.6
6.8
7.0
7.2
1 2 3 4
Parameter Used in Sorting
Cap
acity
Gai
n %
MTOW Pair wise SeparationRoll Moment of InertiaWing Span
For ease, we used wing span sorting

65
Additional Airports Checked
Additional airports were checked world- wide to ensure that the blended
optimization worked beyond Europe and the US

66
Airport Traffic Analyzed in RECAT To Provide Worldwide Coverage
Airports selected for detailed analysis (Green)
Additional airports analyzed to confirm benefits (Black)66
CYYZCYYZ CYULCYUL
MMMXMMMXSKBOSKBO
SBGRSBGR
SAEZSAEZ
FAJSFAJS
DNMMDNMM
HECAHECA
UUDDUUEEUUDDUUEE
OMDBOMDB
OERKOERK VIDPVIDP
WSSSWSSS
VTBSVTBS
YMMLYMML
YSSYYSSY
RJAARJTT
RJAARJTT
RKSIRKSIZBAAZBAA
ZGGGZGGG
VHHHVHHH
EHAMEHAMEGLLEGLL
EDDFEDDFLFPGLFPG
KATLKATL KEWRKEWR
KORDKORDKSFOKSFO
KJFKKJFK
67
#11 Expert Review and Adjustments
Adjusted the categories by blending the US and EU optimized categories
Added further conservatism by
Manually moved one selected aircraft
Reduced separations for Heaviest aircraft behind Heaviest aircraft

68
Current ICAO Wake Turbulence Separations
Heavy>136 t
B747B747
Leading aircraft Followed by Heavy Large Small
A320
A320
Large7 -
136 t
Small< 7t
0 3 4 5 6Separation, miles
A320

69
Current ICAO Wake Turbulence Separations
B747
Leading aircraft
Separation
A306
Trailing aircraft
4 NM
B747
This is Safe
This is Overly Conservative.
A result of the Breadth of the Heavy Category
A306
Heavy to Heavy

70
Safety Example Wake Turbulence Separations
B747
Leading aircraft
Separation
A306
Trailing aircraft4 NM
B747
This Is Safe (Current ICAO)
This Is Also Safe (RECAT)A306
Upper Heavy to Lower Heavy
Lower Heavy to Upper Heavy
Separation
2.5 NM

71
Used Rolling Moment Coefficient
We used rolling moment coefficient to reduce the separation of Category B (the Heaviest of the Heavy category) behind Category B
Rolling moment coefficient is a way to effectively compare the roll vulnerability characteristics of different aircraft

72
Rolling Moment Coefficient
Proportional to / U b
is the circulation of the vortex from the
leading aircraft
U and b are the aircraft speed and wingspan of the follower aircraft

73
#12 Additional Safety Considerations
Added additional separation for smallest category of aircraft in trail for additional conservatism

74
Max Median Circulations
0
50
100
150
200
250
300
350
400
450
500A
380
B74
4A
346
B77
3B
772
A34
3A
333
A33
2M
D11
B76
3A
306
B75
3B
752
B73
9B
738
B73
7B
736
A31
9A
318
A32
1A
320
B72
2M
D83
MD
82 F50
B73
4B
733
B73
5E
190
B71
7G
LF5
DC
95D
C93
DH
8DF1
00 F70
DH
8CA
T72
RJ1
00R
J85
B46
3B
462
E17
0D
H8B
DH
8AC
RJ9
AT
45A
T43
GL
F4C
RJ7
SB34
CR
J2C
RJ1
E45
XE
145
E13
5E
120
B19
0C
650
H25
BC
525
Aircraft
Cir
cula
tion,
m2 /s
ec
ICAO Baseline Max Median Circulations
Max Median Circulation Allowed in FinalRECAT Configuration

75
#13 Calculate Capacity Increase
Percentage of capacity increase computed relative to baseline
Baseline computed using current separations
Capacity increase computed using RECAT categories and separations

76
7. Establish the Allowed Severity at Potential
Encounter for Each Follower
1. Aircraft Characteristics
2. Wake Vortex Measurements (US and EU)
9. Optimize Aircraft Categories for Capacity Increase
11. Expert Review and Adjustments
10. Traffic Mix
3. Data Driven Circulation Decay Fit
5. Determine Vortex Strength Under ICAO
Standards for Each Aircraft Pair
6. Safety Considerations4. Severity Metric: Vortex Strength
and Rolling Moment Coefficient
8. Determine New Separations for Each Aircraft Pair
13. Calculate Capacity Increase
12. Additional Safety Considerations
14. Proceed to Safety Assessment

77
#14 Proceed to Safety Assessment
Develop Safety Case and Safety Analysis Report for the recommendation to ICAO

78
Risk Due to Wake Turbulence
We define Wake Turbulence (WT) risk for an aircraft pair as:
Probability of encounter x Severity of WT encounter
(Severity can be wake strength or rolling moment coefficient)

79
Probability of Encounter
We would like the Probability of Encounter to be in a box around the aircraft, centered on the extended runway

80
Probability of Encounter
We do not have this kind of data for all 61 aircraft, so we use a more general approach, where we use an infinite volume

81
Probability of Encounter
We will show an example
of how to assess the Wake Survival Probability at a non-dimensional circulation, *, of zero
Probability of Encounter is Wake Survival Probability
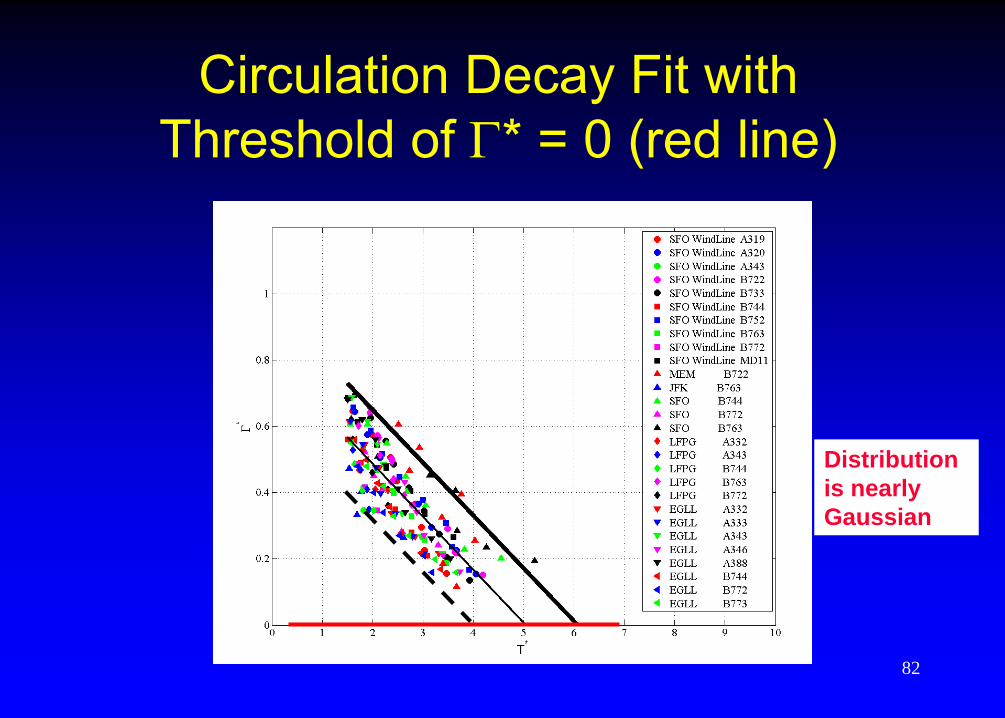
82
Circulation Decay Fit with Threshold of * = 0 (red line)
Distribution is nearly Gaussian

83
Gaussian Distribution of the Non-Dimensional Life Times of the Median Wakes
Distribution of median wake life time
0
0.05
0.1
0.15
0.2
0.25
0.3
0.35
0.0 1.0 2.0 3.0 4.0 5.0 6.0 7.0 8.0
T*
Prob
abili
ty

84
Integration of the Gaussian Distribution Along the Red Line
Cumulative Probability Distribution
0
0.2
0.4
0.6
0.8
1
1.2
0.0 1.0 2.0 3.0 4.0 5.0 6.0 7.0 8.0
T*
Prob
abili
ty

85
One Minus the Distribution Shown in Last Slide
Wake survival probability over 0m2/s
0
0.2
0.4
0.6
0.8
1
1.2
0.0 1.0 2.0 3.0 4.0 5.0 6.0 7.0 8.0
T*
wak
e su
rviv
al p
roba
bilit

86
Sample Heat Map (ICAO Shown)

87
Median Wake Survival Probability Ratio
(RECAT divided by Maximum ICAO)

88
Wake Strength Ratio (RECAT divided by Maximum ICAO)
This is due to reduced separations for Category B behind Category B

89
Risk Index Ratio (RECAT divided by ICAO Maximum)

90
Justification for Reduced Separations for B Behind B
Used rolling moment coefficient
Proportional to / U b
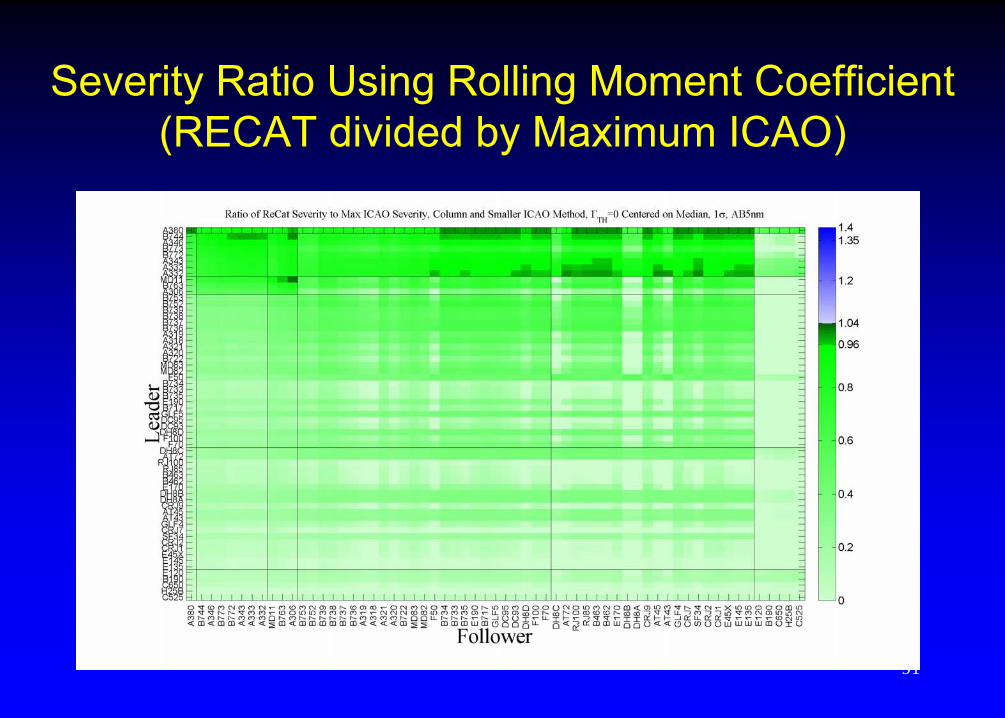
91
Severity Ratio Using Rolling Moment Coefficient (RECAT divided by Maximum ICAO)
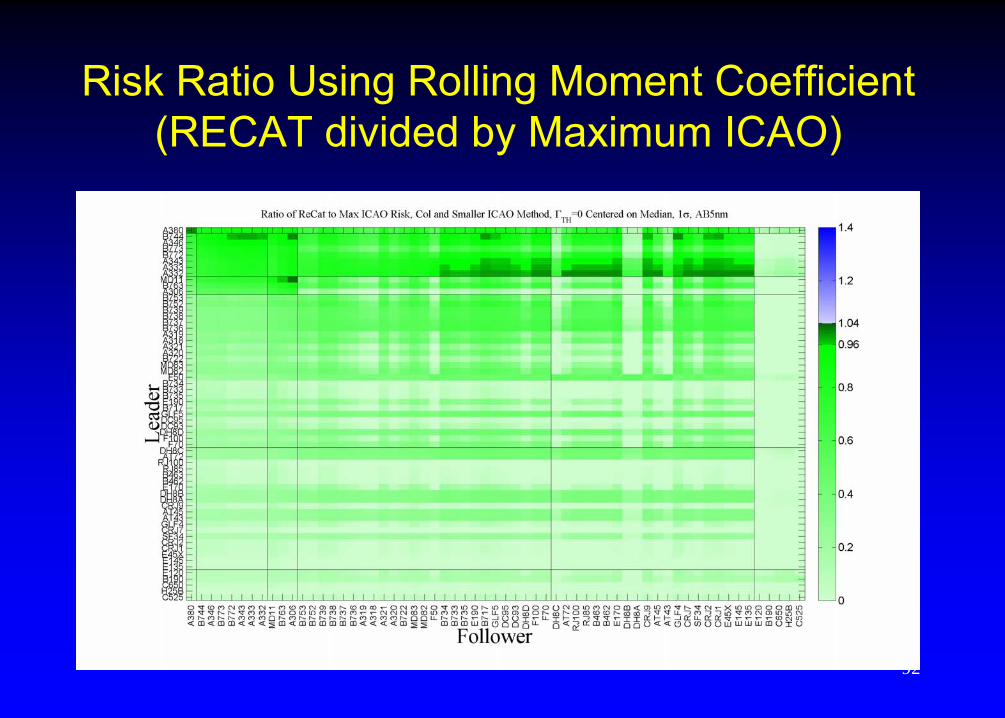
92
Risk Ratio Using Rolling Moment Coefficient (RECAT divided by Maximum ICAO)

93
Other Analyses
Performed sensitivity analyses using aircraft speed uncertainty
Calculated departure times using a departure circulation decay fit to field data
Calculated bank angles for worst case encounters

94
Application of Methodology to All ICAO Aircraft Types
61 representative aircraft types were used in developing the categories and separations
Methodology was then applied to all 9000+ ICAO aircraft types
Methodology flow chart shown in next slide

95
Flow Diagram To Determine the Wake Turbulence Category for New Aircraft
b. Powered Sailplane?
c. b > 245 ft?
d. 175 < b ≤ 245 ft?
e. 125 < b ≤175 ft and MTOW ≥ 300,000 lb?
f. 125 < b ≤ 175 ft and MTOW < 300,000 lb?
g. 90 < b ≤ 125 ft? h. 65 < b ≤ 90 ft
j. b ≤ 65 ft and MTOW > 41,000
lb
i. b ≤ 65 ft and MTOW ≤ 41,000
lb
k. If supersonic, increase by 1 Category
Yes
Yes
Yes
Yes
Yes
Yes
Yes
Yes
Yes
No
No
No
No
No
No
No
No
START: Collect Wingspan (b) and MTOW
a. MTOW < 15,500 lb?Yes
No
Category F
Category E
Category D
Category C
Category B
Category A
l. END

96
Estimated Benefits
Capacity gain
Traffic mix and local procedures influence the benefits
Estimated capacity gain for Europe (constrained airports) is on average 4%
Estimated capacity gain for U.S (constrained airports) is on average 7%
Similar estimated capacity gains for other world wide (capacity constrained) airports

97
Safety Case Breadth
Safety Assessment Report
ICAO Compliant safety methodology
Hazard Identification
Exhaustive list of hazards assessed
Only wake turbulence risk evaluated as relevant and potentially affected by RECAT
Wake Turbulence Risk Assessment (Likelihood and Severity)
Review of Publicly available, World Wide Safety Reporting Systems
Methodology Report
Report on Classification of 9000+ Aircraft Types

98
Safety Case Depth
Data driven from US and European Multiple Data Campaigns
Critiqued by multiple safety oversight organizations in US and EUROCONTROL
Independent Experts Contracted to Develop and Provide Industry Best Practices
Wake Strength and Rolling Moment Coefficient were used in a relative sense
Additional Supporting Analysis that Guided Assessment used Multiple Models for additional confidence

99
RECAT Phases 2 and 3 Effort
Phase 1 is Static 6 Category Separation
Phase 2 is static pair-wise separation
Phase 3 is dynamic pair-wise separation

100
Summary
Joint Effort by FAA/EUROCONTROL as requested by ICAO
Harmonization
Capacity benefit local and network wide (Congested airports have impact worldwide)
Maintain or Improve Today’s Safety
Methodology developed for categorizing current and future aircraft types
Approach and Departure separations, Distance and Time Based
Used Present and future traffic mix
Openly available tools, methods and aircraft data
Solution supported by ICAO compliant safety case
Path to SESAR and NextGen goals require Phase I and Phase II elements of RECAT to achieve maximum benefits