Embed Size (px)
Citation preview


Presentation Outlinea) Introduction
b) Performance in ANA 2012/13
c) Test Development
d) Learner registration
e) Printing, packing and distribution
f) Test administration
g) Marking
h) ANA Verification
i) Support to Learners
j) Conclusion

INTRODUCTION

Introduction• Annual National Assessment (ANA) is in its third year of full
implementation.
• ANA provides credible and reliable information for monitoring progress in learner performance towards achieving the national goals of “improving the quality of basic education”.
• In the last two years, ANA has provided districts, schools, teachers and parents, with useful diagnostic information on the areas of difficulty which has assisted in the structuring of targeted remedial programmes.

Introduction• Intended Outcomes:-
Serve as a diagnostic tool identifying areas of strength and
weakness in teaching and learning.
Expose teachers to better assessment practices.
Provide districts with information to target schools in need of
assistance.
Encourage schools to celebrate outstanding performance.
Empower parents by providing them information about the
education of their children.

Introduction• ANA 2011: administered in February 2011 and tested learners
on the work covered in the previous year. Administered in Grades 1 to 6.
• ANA 2012: administered in September 2012 – tested learners on the work done in that year. Grade 9 learners were tested for the first time. Included learners from Grade 3 or 6 in independent schools.
• ANA 2013: once again administered in September 2013 for learners in Grades 1 -6 and 9.

Introduction• The credibility of ANA is determined by:
- The assessment instrument- The administration of the assessment- The marking and moderation of assessment- The analysis and feedback.
• Parallel to the ANA administered by the school (Universal ANA), is the Verification ANA, administered, marked and processed by an independent agent.

PERFORMANCE IN 2011/2012
Overall results in Mathematics (Average percentage mark)
9
GRADEMATHEMATICS
2012MATHEMATICS
2011DIFFERENCE (% POINTS)
1 68 63 5
2 57 55 2
3 41 28 13
4 37 28 9
5 30 28 2
6 27 30 -3
9 13 * *
* Grade 9 was not part of the 2011 ANA

Overall results in Language: Grades 1-3 (Average percentage mark)
10
GRADE HL 2012 LANG 2011
1 58 59
2 55 52
3 52 35

Overall results in Language: Grades 4-6 and 9 (Average percentage mark)
11
GRADE HL 2012 FAL 2012 LANG 2011
4 43 34 34
5 40 30 28
6 43 36 28
9 43 35*
* Grade 9 was not part of the 2011 ANA

TEST DEVELOPMENT

Test Development• All tests for grades 1 to 6 and 9 in Mathematics and Language
have been set, moderated, edited, externally reviewed and quality assured.
• Educators (subject advisory and classroom based) were used for the development of tests.
• Each grade and subject comprised 2 examiners, a chief examiner, an editor and a moderator.
13

Test Development• Tests were developed in English, based on the test framework
and specifications, and then versioned into other languages.
• The 92 sets of developed tests were piloted in February 2013 in selected schools on samples of learners who were a grade higher than the grade of the test.
• Double the number of required test items were piloted and the best-functioning items were included in the final test, with some refinement where necessary.
14

Test Development• All tests were moderated, quality-assured and edited before the
pilot run and after the pilot study.
• The Advisory Committee comprising local and international expertise in national assessment, scrutinised the tests and provided inputs on the finalisation of the tests.
• In response to the concerns raised in 2012, the Grade 9 Mathematics test was particularly subjected to additional scrutiny and extra attention by the specialist members of the Advisory Committee.
15

Adaptations of Tests• Tests were adapted for:
- learners who are deaf (language simplification), - learners who are partially sighted (a range of large font sizes); and- learners who are blind (Braille versions).
16

LEARNER REGISTRATION

Learner Registration• In most PEDs learner data uploaded from SASAMS.
Mpumalanga and KZN captured afresh. E Cape uploaded 2012 data from GET system. W Cape uploaded from CEMIS.
• Registration schedules printed and distributed to each school for verification.
• Amendments were captured on the GET system.• Triangulation of GET data with SNAP 2013, workbook data
and separate printing statistics collected from individual schools.

ORDINARY SCHOOLS
19
ORDINARY SCHOOL TYPE
Prov INDEPENDENT PUBLIC Grand Total
EC 120 4771 4891FS 55 1175 1230GP 278 1692 1970KZN 96 5430 5526LP 99 3851 3950MP 87 1675 1762NC 9 527 536NW 38 1458 1496WC 72 1451 1523
Total 854 22 030 22884
20
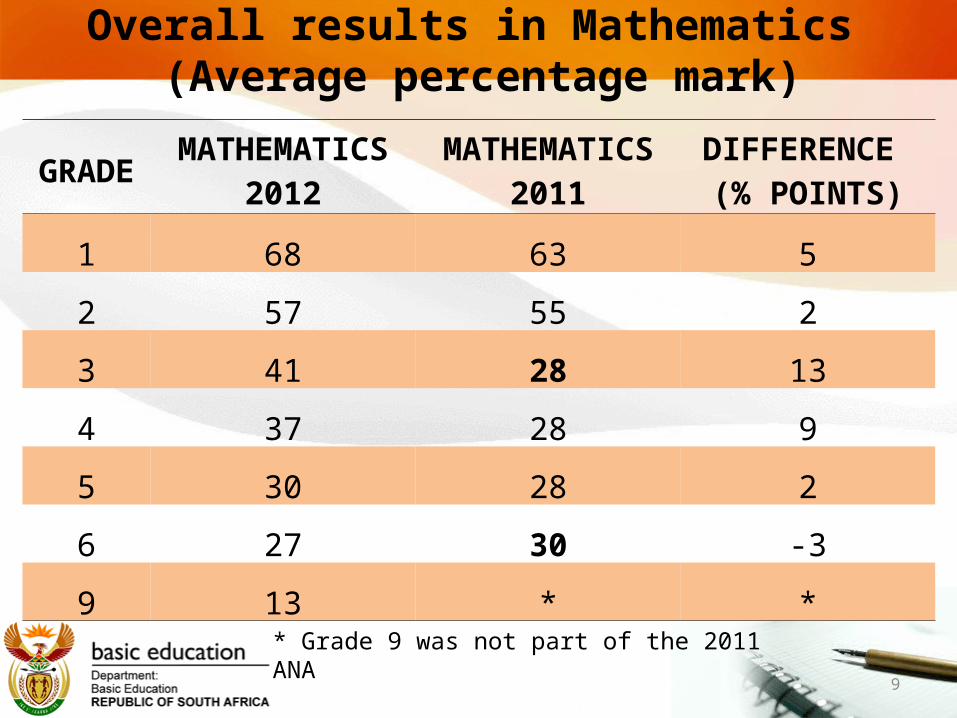
REGISTERED LEARNERSPROV GRADE 1 GRADE 2 GRADE 3 GRADE 4 GRADE 5 GRADE 6 GRADE 9 TOTAL
EC 112821 273346 232910 214142 205997 197045 91917 1328178
FS 67042 62981 55980 52728 51532 50370 67329 407962
GP 204040 186346 171882 157470 147830 147139 159448 1174155
KZN 261950 227587 215016 195020 186144 191596 217422 1494735
LP 151583 138973 127641 117083 115406 115875 185499 952060
MP 107509 97343 88592 81747 79824 79666 86293 620974
NC 28917 26857 24386 25610 23557 22524 22435 174286
NW 79473 74855 70239 66285 61640 59424 66783 478699
WC 104555 93411 85701 85377 79035 79314 84665 612058
TOTAL 1117890 1181699 1072347 995462 950965 942953 981791 7243107

SPECIAL SCHOOLS
21
NUMBER OF SPECIAL NEEDS EDUCATION SCHOOLS
Prov INDEPENDENT PUBLIC Total
EC 24 24
FS 17 17
GA 2 66 68
KZN 27 27
LP 3 3
MP 1 1
NC 2 2
NW 4 4
WC 1 21 22
Total 3 164 168
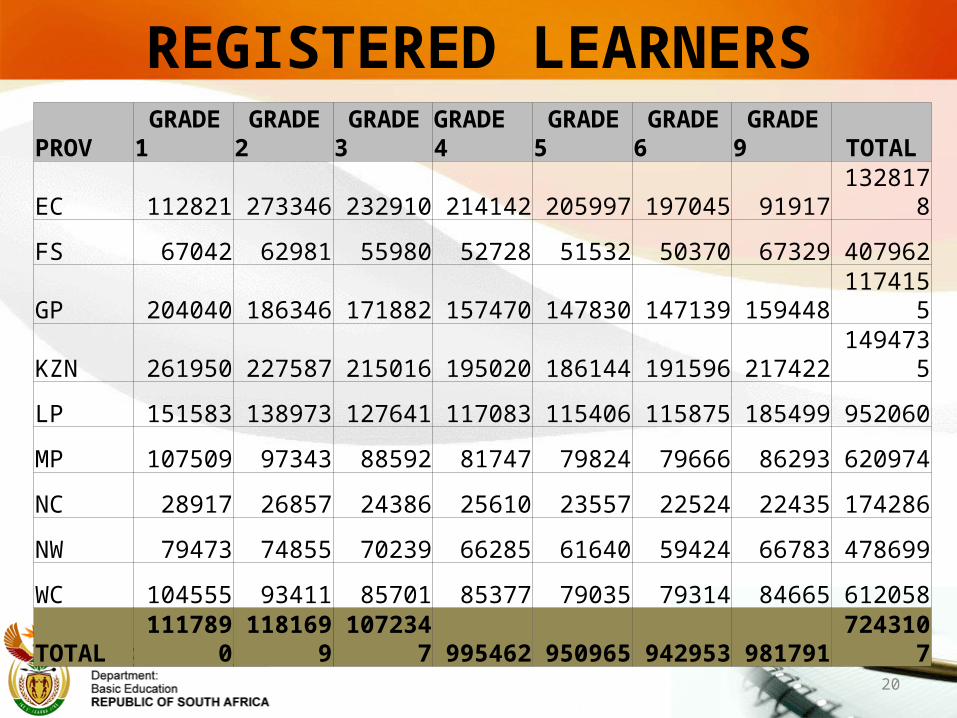
REGISTERED LEARNERS IN SPECIAL SCHOOLS
22
PROV GRADE_1 GRADE_2 GRADE_3 GRADE_4 GRADE_5 GRADE_6 GRADE_9 TOTAL
EC 166 572 389 448 431 409 19 2434
FS 805 495 499 168 170 398 251 2786
GA 8324 7795 7644 5752 5501 5832 4847 45695
KZN 551 533 686 466 393 376 226 3231
LP 65 31 54 59 51 81 97 438
MP 0 0 0 0 15 12 0 27
NC 0 26 52 38 26 42 0 184
NW 42 33 38 49 44 38 80 324
WC 248 257 249 276 324 315 416 2085
Total 10201 9742 9611 7256 6955 7503 5936 57204

PRINTING, PACKING AND DISTRIBUTION

Printing, Packing and Distribution• Printing, packing and distribution for five PEDs has been
outsourced to a service provider appointed by DBE.
• Four PEDs i.e. MP, WC, NC and KZN have opted to take responsibility for the printing, packing and distribution.
• Distribution points have been established in each of the PEDs, from where tests will be collected by school principals.

Printing ,Packing and Distribution
ANA Tests completed30/06/13
ANA Tests printed23/08/13
Packing of ANA Tests30/08/13
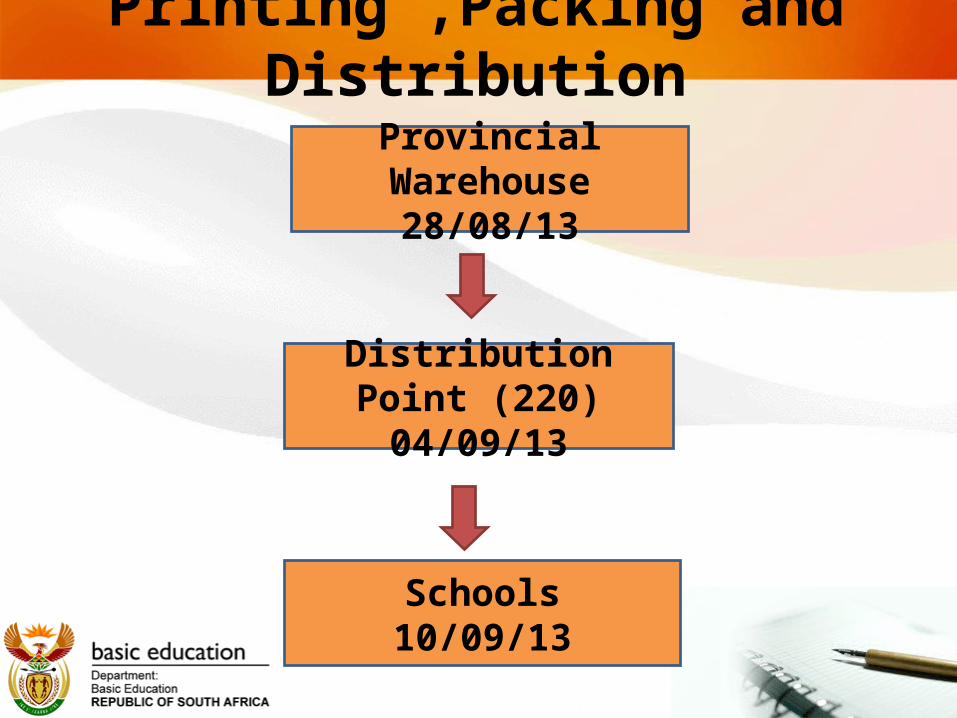
Printing ,Packing and Distribution
Provincial Warehouse28/08/13
Distribution Point (220)04/09/13
Schools10/09/13

TEST ADMINISTRATION

ANA TIME TABLELEARNING AREA/SUBJECT GRADE DATE TIME
LANGUAGE
1
Tuesday 10 September
09h00 – 10h00
2 09h00 – 10h00
4 09h00 – 10h30
5 09h00 – 10h30
LANGUAGE
3
Wednesday 11 September
09h00 – 10h30
6 09h00 – 10h30
9 09h00 – 11h30
MATHEMATICS
1
Thursday 12 September
09h00 – 10h00
2 09h00 – 10h00
4 09h00 – 10h30
5 09h00 – 10h30
MATHEMATICS
3
Friday 13 September
09h00 – 10h00
6 09h00 – 10h30
9 09h00 – 11h30

Test Administration• Administration categories: Universal ANA (U-ANA); Verification
ANA (V-ANA); Independent Schools
• Orientation for test administration conducted in all PEDs in July/August 2013.
• Orientation sessions were cascaded to districts to eventually cover all schools.
• Test Administration Manual developed and distributed to each school.

Monitoring of Test Administration
• DBE Monitors will be deployed to monitor the distribution and test administration of ANA.
• DBE Monitors comprise: DBE Staff and Independent Monitors appointed by the DBE (retired school principals and subject advisors) (80 monitors)
• Each province will also monitor the distribution and test administration.
• Each PED will submit a Daily Report to the DBE.

MARKING

Marking• Marking Guideline discussions were hosted in Pretoria for
Grades 3, 6 and 9 on 13 – 15 August 2013. Each PED will host provincial marking guideline discussions.
• Marking will take place at school level under the supervision of the school principal.
• Senior teacher and HoDs will be responsible for school moderation.
• All marking, moderation and mark sheets must be completed by 18 September 2013.
• School-based marking will also involve the marking of all grades in special schools.

Centralised Moderation)• Grades 3, 6 and 9 scripts will be sampled for centralised moderation.
• Between 3 to 15 scripts per school, per grade , per subject will be sampled.
• DBE has developed a Marking Manual for marking and moderation processes.
• The PED is responsible for selection, appointment and payment of marking personnel, marking centres, and the overall conduct and management of all marking processes.
• Twenty four (24) marking centres and estimated 2400 markers.
• Markers are appointed per school based on seniority.
• Centralised moderation scheduled from 21 – 28 September 13.
• Marks will be captured centrally in the province by a service provider.

VERIFICATION ANA

ANA Verification• ANA Verification will be conducted by an independent Verifying
Agent.
• Sample size:
- Grades 3, 6 and 9: 2163 schools nationally (approximately 200 schools per province).
- Grades 1, 2, 4 and 5: 450 schools nationally (50 schools per province)
• Monitor the test administration in each of the schools.
• Tests collected from schools and marked independently.
• Capture and process data.

ANA Verification
• Test responses will be captured per question – produce an Item Analysis Report.
• Final Independent Report presented to Minister.
• Minister to release report in December 2013

CONCLUSION

Conclusion• The DBE is confident that ANA 2013 will be successfully administered.
• Despite the demands placed on the system, based on the magnitude and size of this assessment, the DBE is convinced that ANA is the main driver for educational improvement.
• Both PEDs and DBE have extensively used the data emanating from ANA 2011 and 2012 to structure their remedial and intervention programmes.
• Progress made in achieving the goals of the Action Plan to 2014 will become evident with the outcome of these tests.