Embed Size (px)
Citation preview

KeyCorp Inves tor Pres entation 2003October

PRIVATE SECURITIES LITIGATION REFORM ACT OF 1995FORWARD-LOOKING STATEMENT DISCLOSURE
1
The presentation and discussion, including related questions and answers, and presentation materials, contain forward-looking statements about issues like anticipated fourth quarter and full-year 2003 earnings, anticipated level of net loan charge-offs and nonperforming assets and anticipated improvement in profitability and competitiveness. Forward-looking statements by their nature are subject to assumptions, risks and uncertainties. Actual results could differ materially from those contained in or implied by such forward-looking statements for a variety of factors including: changes in interest rates; continued weakness in the economy, which could materially impact credit quality trends and the ability to generate loans; failure of the capital markets to function consistent with customary levels; delay in or inability to execute strategic initiatives designed to grow revenues and/or manage expenses; consummation of significant business combinations or divestitures; new legal obligations or restrictions or unfavorable resolution of litigation; further disruption in the economy or the general business climate as a result of terrorist activities or military actions; and changes in accounting, tax or regulatory practices or requirements.

Reshaping Key: A Different Company
Exit Auto LeaseEst. Runoff Portfolio
2001 2002 2003
Henry Meyer Elected Chairman
Built Loan Loss
Reserve
HiredTom Bunn
Corporate Banking
CompletedPEG
$250 mill.savings
Hired New CFO
Jeff Weeden
Union Bankshares Acquisition
Integrated Investment & Commercial
Banking
T.D. Leasing Portfolio
Acquisition
Focused on product
Higher credit risk tolerance
Unfocused expense culture
Inconsistent financial measures
Focused on deepening relationships
Re-established conservative credit culture
PEG expense culture
Economic Profit Added (EPA)
NewBridge Acquisition
ConningAcquisition
2

Strategic Priorities
Profitably grow revenue• Focus on relationship businesses• Increase deposits• Improve cross-sell
Improve credit quality
Maintain expens e dis c ipline
( )Improve s hareholder value EPA
3

Net Income by Line of Business
Corporate & Inves tment Banking
40%Cons umerBanking
50%
Inves tment Management
Services
- 3 03Net Income Q
•Retail Banking•Small Business•Consumer Finance
•Corporate Banking•KeyBank Real Estate Capital•Key Equipment Finance
10%
4

Depos it growth -Increas e cros s s e ll New client acquis ition
• Adding new KeyCenters and RMs : -Cons umer Finance repos ition and improve cros s s e ll : Bus ines s Banking focus on bus ines s deve lopment
Bus ines s Initiatives
Consumer Banking
Bus ines s Scale 900 - 2,200 KeyCenters ATMs - : 722,000 (37% )On line Clients Penetration : 10 Small Bus ines s th larges t in loan balances
•Retail Banking•Small Business•Consumer Finance
5

Revenue Growth• Align commercial & investment banking• “Lead with Leasing”
Depos it Growth• Cross-sell loans and deposits• Focus on client specific segments
Improve as s et quality
- Maximize Key led trans actions
#5 Equipment Leas ing #5 Commercial Real Es tate Lender
Corporate & Inves tment Banking
Bus ines s Initiatives
Bus ines s Scale •Corporate Banking•KeyBank R/E Capital•Key Equipment Finance
6

Inves tment Management Services
Bus ines s Scale
- : 128 .Managed & Non Managed As s e ts $ Bill
Bus ines s Initiatives Victory Capital
• Leverage external distribution• Continue to penetrate the franchise• Fill out product menu - NewBridge
MFG• Rationalize cost structure• Align teams around high net worth clients
•Victory Capital Mgmt•McDonald Financial Group (MFG)
7

Financial Review

Financial Objectives
Achieve long term targets •ROE: 16 - 18%•EPS Growth: 7 – 8%
Continue expens e dis c ipline
Improve as s et quality
Manage s trong capital pos ition•New authorization to repurchase 25 million
shares
9
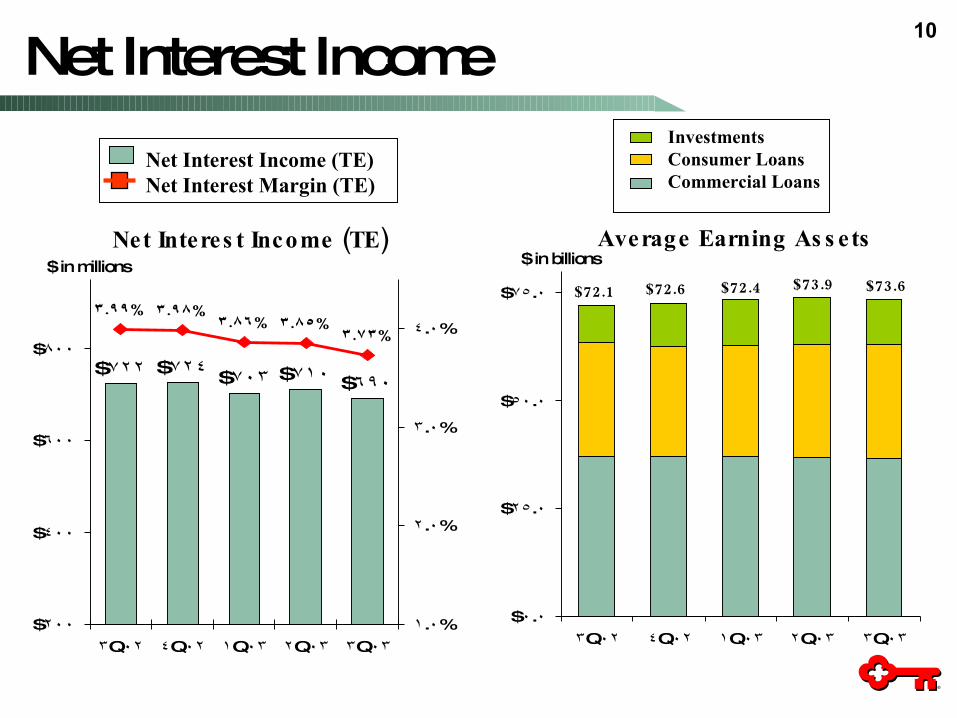
Net Interest Income
$722 $724 $703 $710 $690
. %3 99 . %3 98. %3 86 . %3 85
. %3 73
$200
$400
$600
$800
Q3 02 Q4 02 Q1 03 Q2 03 Q3 03
. %1 0
. %2 0
. %3 0
. %4 0
$ .0 0
$ .25 0
$ .50 0
$ .75 0
Q3 02 Q4 02 Q1 03 Q2 03 Q3 03
Net Interest Income (TE)Net Interest Margin (TE)
( )Net Interes t Income TE Average Earning As s ets
InvestmentsConsumer LoansCommercial Loans
$ in millions
72.1$ 72.6$ 72.4$ 73.9$ 73.6$
10
$ in billions

38.1 37.7 37.1 $ $ $ 37.1 36.5 36.4 36.5 36.5 36.4 $ $ $ $ $ $ (1)%
23.3 22.0 22.9 24.0 24.6 24.3 24.7 25.2 25.7 6
3.5 3.0 2.5 2.0 1.7 1.4 1.1 0.9 0.8 (61) 1.3 1.1 1.0 0.8 0.7 0.6 0.5 0.4 0.2 (166)
.$66 2 .$63 8 .$63 1.$63 0.$62 8.$62 7.$63 5.$63 9.$63 5
3Q01 4Q01 1Q02 2Q02 3Q02 4Q02 1Q03 2Q03 3Q03
in billions
% change *3 03 . 2 03Q vs Q
* Annualized
Commerc ialCons umer
AutoCommerc ial
Exit Portfo lios
Average Loans11

in billions
Average Core Depos its
* Annualized
.$37 3 .$37 0 .$37 2.$39 2 .$40 4 .$41 3 .$42 2
.$37 0 .$37 4
3Q01 4Q01 1Q02 2Q02 3Q02 4Q02 1Q03 2Q03 3Q03 /Now MMDA 13.1$ 13.0$ 13.4$ 13.2$ 13.3$ 15.1$ 16.8$ 17.7$ 18.4 14% Savings 1.9 1.9 1.9 2.0 2.0 2.0 2.0 2.1 2.1 2 ’CD s 13.7 13.7 13.4 13.1 12.7 12.2 11.8 11.4 11.1 (13) DDA 8.3 8.8 8.6 8.7 9.2 9.9 9.8 10.1 10.6 23
TOTAL 37.0 37.4$ $ 37.3$ 37.0$ 37.2$ 39.2$ 40.4$ 41.3$ 42.2$8%
% change *3 03 . 2 03Q vs Q
12

As s et Quality Indicators
$ in millions 3 02Q 4 02Q 1 03Q 2 03Q 3 03Q
Nonperforming Loans $987 $943 $904 $837 $795to EOP Loans 1.57% 1.51% 1.44% 1.32% 1.27%
Nonperforming Assets $1,017 $993 $968 $897 $862to EOP Loans + OREO 1.61% 1.59% 1.54% 1.42% 1.37%
Net C/O $185 $186 $161 $141 $123to Average Loans 1.16% 1.18% 1.04% .90% .77%
Allowance $1,489 $1,452 $1,421 $1,405 $1,405to Total Loans 2.37% 2.32% 2.27% 2.22% 2.24%to Nonperforming Loans 151% 154% 157% 168% 177%
13

Tangible Equity to Tangible As s ets
. %6 94
. %6 16 . %6 12. %6 29
. %6 51
. %6 29
. %6 57. %6 73
. %6 10
. %6 69 . %6 71. %6 71
. %6 25. %6 12
. %6 90
2.00%
3.00%
4.00%
5.00%
6.00%
7.00%
8.00%
1Q00 2Q00 3Q00 4Q00 1Q01 2Q01 3Q01 4Q01 1Q02 2Q02 3Q02 4Q02 1Q03 2Q03 3Q03
KEY Pe er Median S&P Regional & Diversified Bank Indice s
3 03: 20 24 Q of banks reporting
6.78%
14

Dividend Record
.56.56.64.64
.72.72.76.76
.84.84.94.94
1.041.041.121.12
1.201.201.181.18
1993 1994 1995 1996 1997 1998 1999 2000 2001 2002 2003T
1.221.22
15

Thinking Like An Owner
: 7%Total ins ider owners hip• 77% of employees own Key shares• 69% of employees have stock options
Stock owners hip guide lines• CEO: 6 x salary• CEO direct reports: 4 x salary• Executive Council: 2 x salary
16

Summary
New management team focus ed on :improving performance
• Profitably grow revenue• Focus on relationship businesses• Increase deposits• Improve asset quality• Manage expenses
Alignment of management and s hareholder interes ts
Strong dividend record
17

Appendix

Retail Banking Markets
900 KeyCenters2,200 ATMs1-800-KEY-2-YOUKey.com
12 State Footprint2.2 Million Clients6,100+ Employees$1.3+ Billion Revenues
A-1

Market Share by District
District
* Deposit Market Position
* KeyBank Deposits
(in billions)
* KeyBank Deposit
Market Share# of
KeyCentersCLEVELAND OH 1 $16.2 36% 68CENTRAL NEW YORK 1 $1.8 12% 59MAINE 2 $1.9 13% 62TOLEDO OH 2 $1.4 10% 38WESTERN NEW YORK 3 $2.3 9% 42SOUTH PUGET SOUND WA 3 $2.0 12% 62ALBANY NY 3 $1.8 12% 46HUDSON VALLEY NY 3 $1.6 7% 36NORTHERN INDIANA 3 $0.9 12% 33IDAHO 3 $0.6 7% 30SEATTLE WA 4 $1.6 6% 42DAYTON OH 4 $0.8 8% 24VERMONT 4 $0.4 8% 12TOTAL (KEY POSITION 1-4) $33.3 15% 554% OF KEYBANK'S TOTAL 78% 62%
OREGON 5 $2.0 7% 66TRANS MOUNTAIN WA 5 $0.8 5% 32ALASKA 5 $0.4 6% 17AKRON/CANTON OH 6 $1.2 7% 38CENTRAL INDIANA 6 $0.8 5% 32COLUMBUS OH 6 $0.8 6% 25CINCINNATI OH 6 $0.6 2% 23ROCHESTER NY 8 $0.3 3% 14COLORADO 9 $1.0 2% 41MICHIGAN 9 $0.5 4% 21UTAH 10 $0.6 1% 37TOTAL (KEY POSITION 5-10) $9.3 3% 346% OF KEYBANK'S TOTAL 22% 38%KEYBANK TOTALS $42.5 900
A-2

Commercial Portfolio - Geography
Northeas t23%
Rocky Mountain
9%
Northwes t22%
Great Lakes
46%
A-3
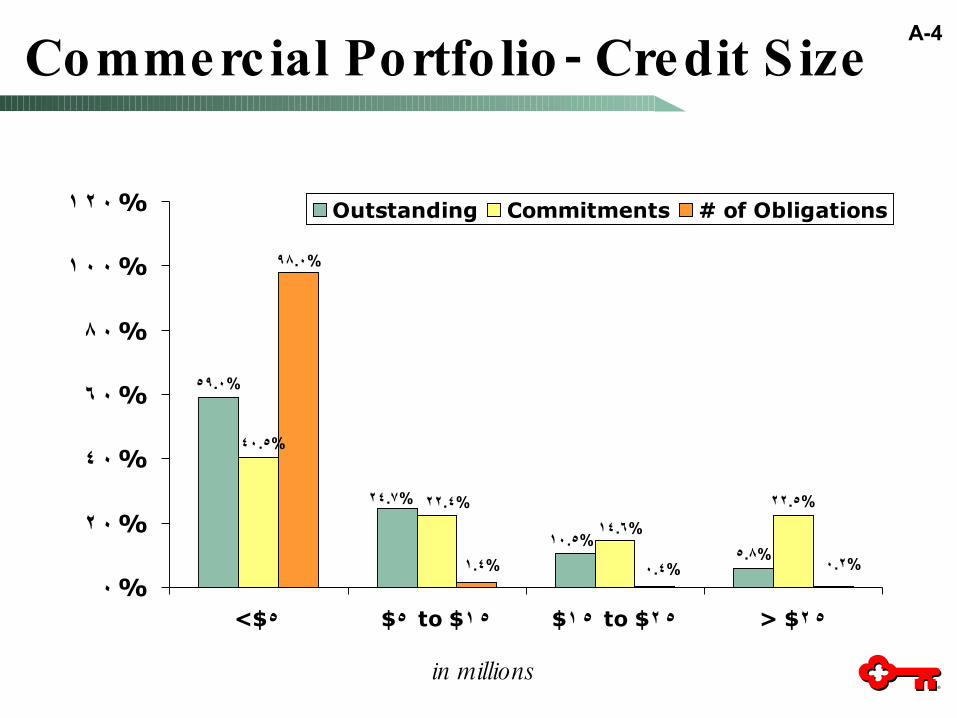
- Commercial Portfo lio Credit S ize
59.0%
24.7%
10.5%5.8%
14.6%
22.5%
40.5%
22.4%
98.0%
1.4% 0.4% 0.2%
%0
%2 0
%4 0
%6 0
%8 0
%1 0 0
%1 2 0
<$5 $ to $5 1 5 $ to $1 5 2 5 > $2 5
Outstanding Commitments # of Obligations
in millions
A-4

- Commercial Portfo lio Utilization Rate
* Excludes Real Estate, Leasing and Commercial Run-off portfolios
. %40 2 . %39 7. %38 8
. %41 1
. %44 0
. %45 2
. %42 5. %42 0
. %44 0. %44 3
. %45 9
. %47 3
. %45 9. %46 5 . %46 1
%30
%35
%40
%45
%50
1Q00 2Q00 3Q00 4Q00 1Q01 2Q01 3Q01 4Q01 1Q02 2Q02 3Q02 4Q02 1Q03 2Q03 3Q03
A-5

Net Charge-Offs to Average Loans
. %0 84
. %0 42
. %0 63 . %0 64 . %0 66
. %1 02 . %1 04
. %1 37. %1 32
. %1 27
. %1 16 . %1 18
. %1 04
. %0 90
. %0 77
. %0 44
0.00%
0.30%
0.60%
0.90%
1.20%
1.50%
1Q00 2Q00 3Q00 4Q00 1Q01 2Q01 3Q01 4Q01 1Q02 2Q02 3Q02 4Q02 1Q03 2Q03 3Q03
KEY Pe e r Me dian S&P Re gional & Dive rsifie d Bank Indice s3 03: 20 24 Q of banks reporting
A-6

- Net Charge Offs to Average Loans by Loan Type
. %0 73
. %0 84
. %1 51
. %0 93
. %0 77
. %1 43
. %1 32
. %0 97
. %1 08
. %0 97. %1 00
. %0 75
2 02 3 02 4 02 1 03 2 03 3 03Q Q Q Q Q Q
Cons umerCommercial
2 02 3 02 4 02 1 03 2 03 3 03Q Q Q Q Q Q
A-7

NPAs to Loans and OREO
1.41%
1.56%
1.42%1.37%
1.10%
1.61%1.59%
1.54%
1.58%
1.49%
0.88%0.93%
1.00%
0.78%
1.23%
0.00%
0.40%
0.80%
1.20%
1.60%
2.00%
1Q00 2Q00 3Q00 4Q00 1Q01 2Q01 3Q01 4Q01 1Q02 2Q02 3Q02 4Q02 1Q03 2Q03 3Q03
KEY Pe e r Me dian S&P Re gional & Dive rsifie d Bank Indice s3 03: 20 24 Q of banks reporting
0.74%
A-8

Allowance to Total Loans
1.49%
2.22% 2.24%
1.82%
2.27%2.32%2.37%
1.53% 1.51% 1.50% 1.49%
1.85%
2.41%2.51%
2.65%
0.00%
0.50%
1.00%
1.50%
2.00%
2.50%
3.00%
1Q00 2Q00 3Q00 4Q00 1Q01 2Q01 3Q01 4Q01 1Q02 2Q02 3Q02 4Q02 1Q03 2Q03 3Q03
KEY Pe er Median S&P Regional & Dive rsifie d Bank Indice s3 03: 20 24 Q of banks reporting
1.45%
A-9

( )Net Interes t Margin TE
3.73%
3.85%3.85%
3.68%
3.86%
3.98%3.99%
3.68% 3.68%3.71%
3.63%
3.77%
3.98%3.93%
3.98%
3.00%
3.25%
3.50%
3.75%
4.00%
4.25%
4.50%
1Q00 2Q00 3Q00 4Q00 1Q01 2Q01 3Q01 4Q01 1Q02 2Q02 3Q02 4Q02 1Q03 2Q03 3Q03
KEY Pe er Median S&P Regional & Dive rsified Bank Indice s
3.73%
3.85%3.85%
3.68%
3.86%
3.98%3.99%
3.68% 3.68%3.71%
3.63%
3.77%
3.98%3.93%
3.98%
3.00%
3.25%
3.50%
3.75%
4.00%
4.25%
4.50%
1Q00 2Q00 3Q00 4Q00 1Q01 2Q01 3Q01 4Q01 1Q02 2Q02 3Q02 4Q02 1Q03 2Q03 3Q03
KEY Pe er Median S&P Regional & Dive rsified Bank Indice s
3.57%
3 03: 20 24 Q of banks reporting
A-10

. 18.3M Mkt 19.7 21.8 22.2 23.3 21.3 20.0 19.5 20.7 19.3 18.3 19.1 19.3 18.9 .Fixed Inc 14.3 13.1 13.2 13.0 13.7 15.3 15.7 17.3 17.5 16.3 16.1 16.3 17.1 17.3 37.9 39.6Equity 37.7 35.5 36.6 32.8 35.6 36.1 32.4 26.8 27.2 25.4 26.9 28.8
As s ets Under Management$ in billions
.$65 0.$63 3
.$72 8 .$70 7 .$73 6.$69 4
.$71 2 .$72 9 .$70 7
.$62 5 .$61 7 .$60 8
.$70 5.$72 4
-Dec98
-Dec99
-Dec00
1Q01 2Q01 3Q01 4Q01 1Q02 2Q02 3Q02 4Q02 1Q03 2Q03 3Q03
A-11

Relative ly s table net interes t margin
Stable to modes t loan growth
- Improving c limate for fee bas edbus ines s es
Continued focus on expens es
– As s et Quality s table to improving
4 03 : 0.52 0.55Q EPS $ to $
2003 Fourth Quarter OutlookA-12