Embed Size (px)
Citation preview
ASX Release / 15 May 2018
Investor Relations Mr Rowan Cole Company Secretary +61 3 8660 1900 Media Relations Mr Tim Duncan Hinton & Associates +61 3 9600 1979 St Barbara Limited Level 10, 432 St Kilda Road, Melbourne VIC 3004 T +61 3 8660 1900 F +61 3 8660 1999 ACN 009 165 066 Locked Bag 9, Collins Street East, Melbourne VIC 8003 W www.stbarbara.com.au
Presentation to analysts and investors at Leonora Operations
Attached is a presentation to analysts and investors attending a site visit this week at Leonora Operations, Western Australia.
Gwalia site visit presentation
Kous Kirsten, General Manager Leonora Operations / 15 May 2018
Disclaimer
This presentation has been prepared by St Barbara Limited (“Company”). The material contained in this presentation is for information purposes only. This
presentation is not an offer or invitation for subscription or purchase of, or a recommendation in relation to, securities in the Company and neither this presentation
nor anything contained in it shall form the basis of any contract or commitment.
This presentation may contain forward-looking statements that are subject to risk factors associated with exploring for, developing, mining, processing and sale of
gold. Forward-looking statements include those containing such words as anticipate, estimates, forecasts, should, will, expects, plans or similar expressions. Such
forward-looking statements are not guarantees of future performance and involve known and unknown risks, uncertainties, assumptions and other important factors,
many of which are beyond the control of the Company, and which could cause actual results or trends to differ materially from those expressed in this presentation.
Actual results may vary from the information in this presentation. The Company does not make, and this presentation should not be relied upon as, any representation
or warranty as to the accuracy, or reasonableness, of such statements or assumptions. Investors are cautioned not to place undue reliance on such statements.
This presentation has been prepared by the Company based on information available to it, including information from third parties, and has not been independently
verified. No representation or warranty, express or implied, is made as to the fairness, accuracy or completeness of the information or opinions contained in this
presentation.
The Company estimates its reserves and resources in accordance with the Australasian Code for Reporting of Identified Mineral Resources and Ore Reserves 2012
Edition (“JORC Code”), which governs such disclosures by companies listed on the Australian Securities Exchange.
Financial figures are in Australian dollars unless otherwise noted.Financial year is 1 July to 30 June, e.g. FY18 = 1 July 2017 to 30 June 2018.Q1 Sep FY18 = quarter to 30 Sep 2017 Q3 Mar FY18 = quarter to 31 Mar 2018Q2 Dec FY18 = quarter to 31 Dec 2017 Q4 Jun FY18 = quarter to 30 June 2018
Australian Securities Exchange (ASX) Listing code “SBM”
American Depositary Receipts (ADR OTC code “STBMY”) through BNY Mellon, www.adrbnymellon.com/dr_profile.jsp?cusip=852278100
Published 14 May 2018.
2 / Gwalia Site Visit Presentation / May 2018
Contents
3 /
Overview of St Barbara• Operations• Safety
Gwalia Mine, Leonora, WA• History• Production• Innovation• Growth
Exploration
Appendices
Gwalia Site Visit Presentation / May 2018
Adrian Diaz –Senior Resource Geologist (SBM) and Alexander Phillps (DDH1) at 2600 mbs deep drilling site, Jan 2018
4 /
Overview of operations
Gwalia Site Visit Presentation / May 2018
1. As at 11 May 2018. 2. 1 month to 30 April 2018, source IRESS. 3. Basic EPS. 4. 31 Mar 2018. 5. No interestbearing liabilities, except equipment leases totalling approx. A$0.2 million. 6. Refer ASX announcement titled ‘OreReserves and Mineral Resources Statement 30 June 2017’. Mineral Resources are reported inclusive of OreReserves. 7. Non IFRS measure, refer Appendix. 8. FY18 guidance in Q3 March FY18 Quarterly Report.
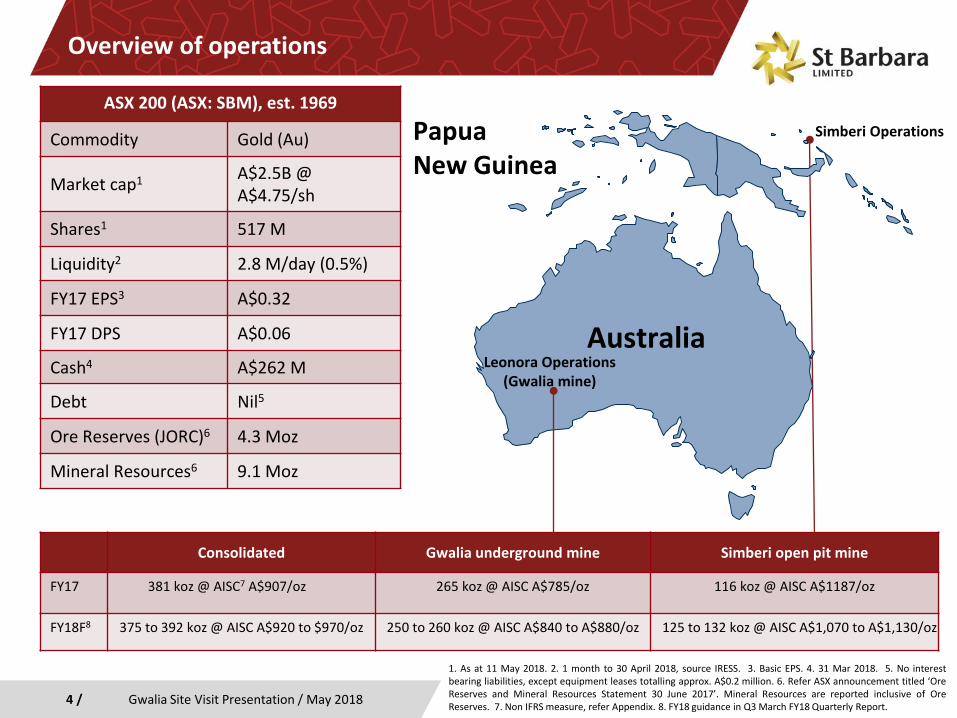
Consolidated Gwalia underground mine Simberi open pit mine
FY17 381 koz @ AISC7 A$907/oz 265 koz @ AISC A$785/oz 116 koz @ AISC A$1187/oz
FY18F8 375 to 392 koz @ AISC A$920 to $970/oz 250 to 260 koz @ AISC A$840 to A$880/oz 125 to 132 koz @ AISC A$1,070 to A$1,130/oz
ASX 200 (ASX: SBM), est. 1969
Commodity Gold (Au)
Market cap1 A$2.5B @ A$4.75/sh
Shares1 517 M
Liquidity2 2.8 M/day (0.5%)
FY17 EPS3 A$0.32
FY17 DPS A$0.06
Cash4 A$262 M
Debt Nil5
Ore Reserves (JORC)6 4.3 Moz
Mineral Resources6 9.1 Moz
Australia
PapuaNew Guinea
Simberi Operations
Leonora Operations (Gwalia mine)
Start safe, stay safe
Gwalia Site Visit Presentation / May 20185 /
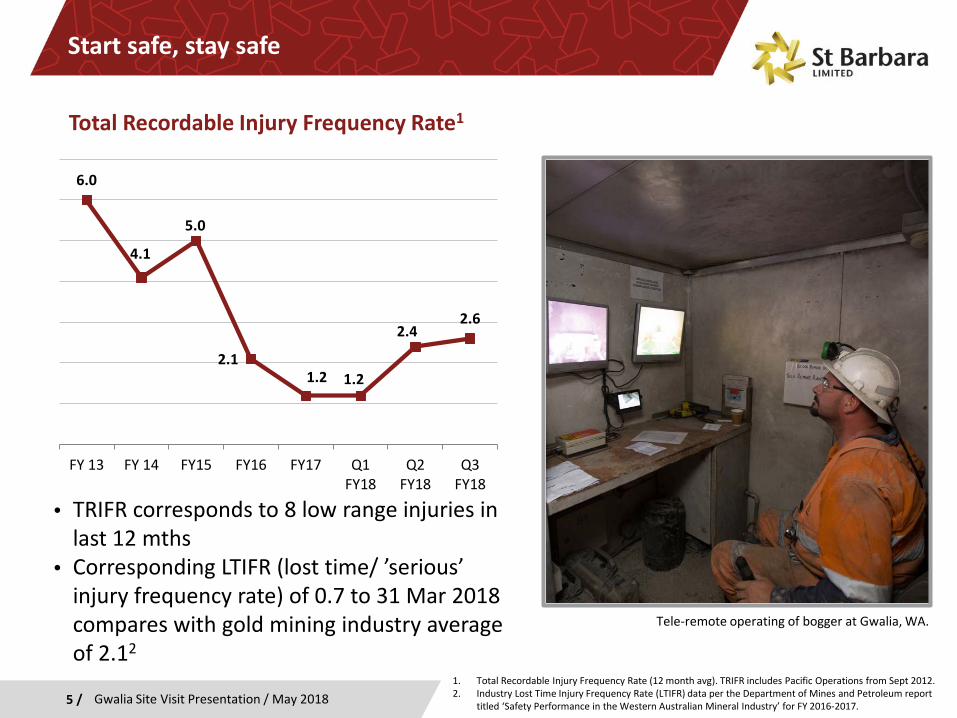
Total Recordable Injury Frequency Rate1
1. Total Recordable Injury Frequency Rate (12 month avg). TRIFR includes Pacific Operations from Sept 2012.2. Industry Lost Time Injury Frequency Rate (LTIFR) data per the Department of Mines and Petroleum report
titled ‘Safety Performance in the Western Australian Mineral Industry’ for FY 2016-2017.
Tele-remote operating of bogger at Gwalia, WA.
6.0
4.1
5.0
2.11.2 1.2
2.42.6
FY 13 FY 14 FY15 FY16 FY17 Q1FY18
Q2FY18
Q3FY18
• TRIFR corresponds to 8 low range injuries in last 12 mths
• Corresponding LTIFR (lost time/ ’serious’ injury frequency rate) of 0.7 to 31 Mar 2018 compares with gold mining industry average of 2.12
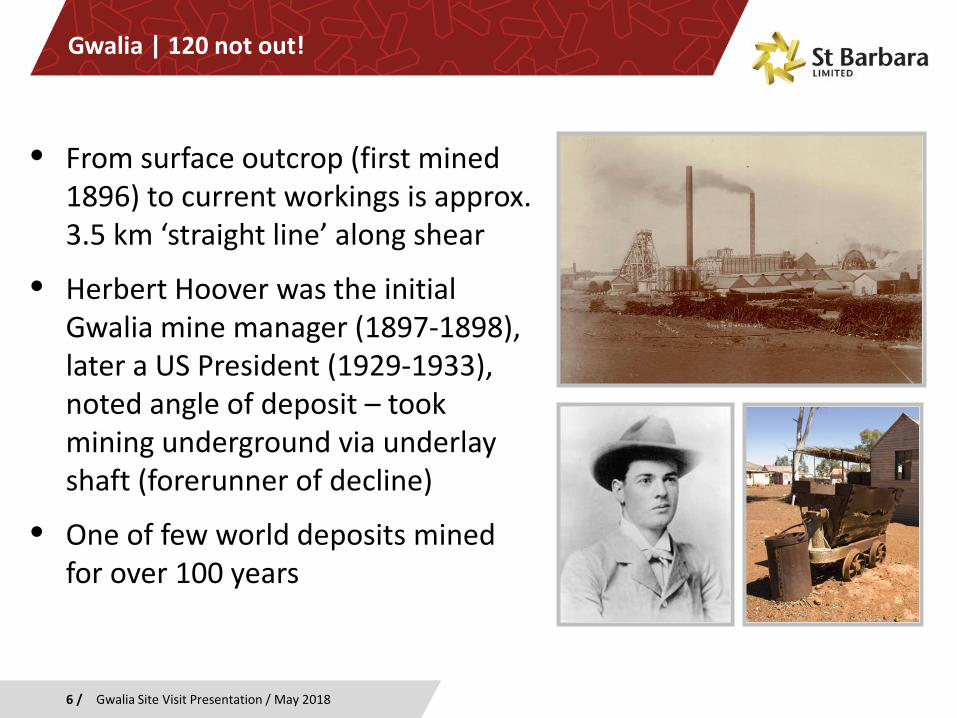
Gwalia | 120 not out!
• From surface outcrop (first mined 1896) to current workings is approx. 3.5 km ‘straight line’ along shear
• Herbert Hoover was the initial Gwalia mine manager (1897-1898), later a US President (1929-1933), noted angle of deposit – took mining underground via underlay shaft (forerunner of decline)
• One of few world deposits mined for over 100 years
6 / Gwalia Site Visit Presentation / May 2018
Gwalia Site Visit Presentation / May 20187 /
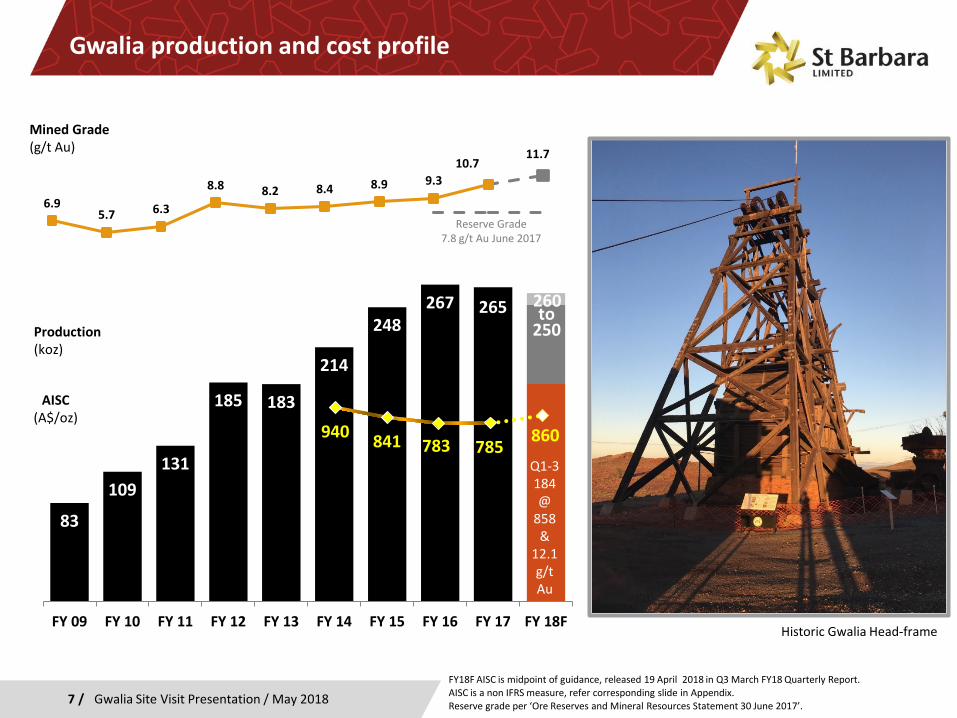
Gwalia production and cost profile
83
109131
185 183
214
248267 265 260
FY 09 FY 10 FY 11 FY 12 FY 13 FY 14 FY 15 FY 16 FY 17 FY 18F
to250
940 841 783 785 860
6.95.7 6.3
8.8 8.2 8.4 8.9 9.310.7
11.7
Mined Grade(g/t Au)
Reserve Grade7.8 g/t Au June 2017
FY18F AISC is midpoint of guidance, released 19 April 2018 in Q3 March FY18 Quarterly Report. AISC is a non IFRS measure, refer corresponding slide in Appendix. Reserve grade per ‘Ore Reserves and Mineral Resources Statement 30 June 2017’.
Production(koz)
AISC(A$/oz)
Historic Gwalia Head-frame
Q1-3184 @
858 &
12.1 g/t Au
8 /
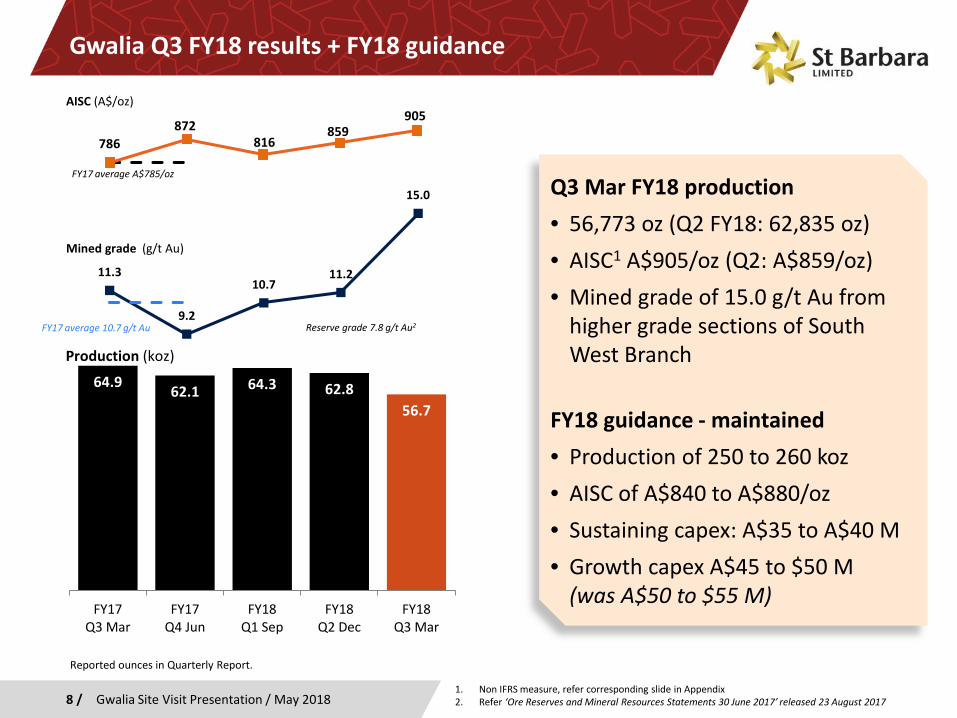
Gwalia Q3 FY18 results + FY18 guidance
Gwalia Site Visit Presentation / May 2018
Q3 Mar FY18 production • 56,773 oz (Q2 FY18: 62,835 oz)• AISC1 A$905/oz (Q2: A$859/oz)• Mined grade of 15.0 g/t Au from
higher grade sections of South West Branch
FY18 guidance - maintained• Production of 250 to 260 koz• AISC of A$840 to A$880/oz• Sustaining capex: A$35 to A$40 M• Growth capex A$45 to $50 M
(was A$50 to $55 M)
11.3
9.2
10.711.2
15.0
Mined grade (g/t Au)
64.9 62.1 64.3 62.856.7
FY17Q3 Mar
FY17Q4 Jun
FY18Q1 Sep
FY18Q2 Dec
FY18Q3 Mar
Production (koz)
Reported ounces in Quarterly Report.
1. Non IFRS measure, refer corresponding slide in Appendix2. Refer ‘Ore Reserves and Mineral Resources Statements 30 June 2017’ released 23 August 2017
FY17 average 10.7 g/t Au Reserve grade 7.8 g/t Au2
786872
816859
905AISC (A$/oz)
FY17 average A$785/oz
9 / Gwalia Site Visit Presentation / May 2018
GwaliaA rich history with a bright future
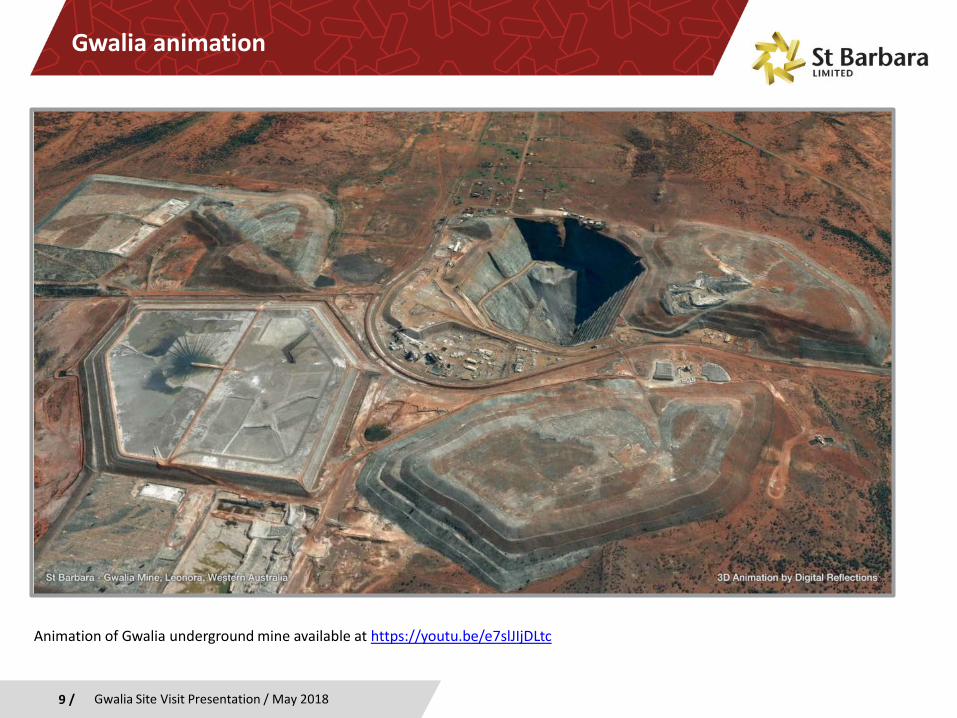
Gwalia animation
Animation of Gwalia underground mine available at https://youtu.be/e7slJIjDLtc
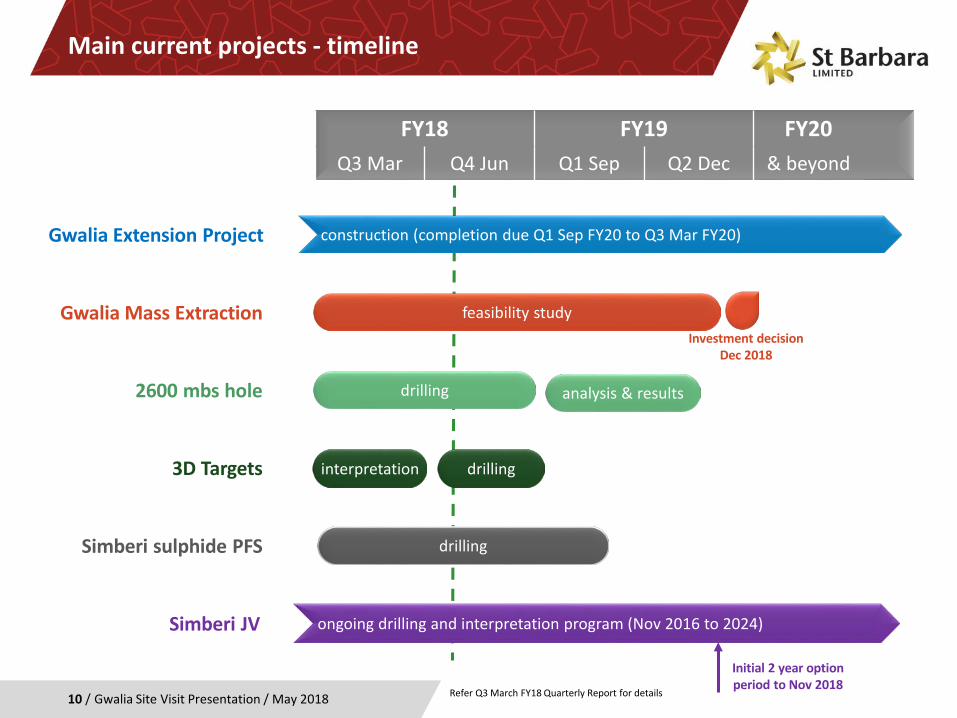
Main current projects - timeline
Gwalia Site Visit Presentation / May 201810 /
construction (completion due Q1 Sep FY20 to Q3 Mar FY20)Gwalia Extension Project
feasibility studyGwalia Mass Extraction
drilling2600 mbs hole
interpretation3D Targets
FY18 FY19 FY20Q3 Mar Q4 Jun Q1 Sep Q2 Dec & beyond
Investment decision Dec 2018
drilling
analysis & results
drillingSimberi sulphide PFS
ongoing drilling and interpretation program (Nov 2016 to 2024)Simberi JV
Refer Q3 March FY18 Quarterly Report for details
Initial 2 year option period to Nov 2018
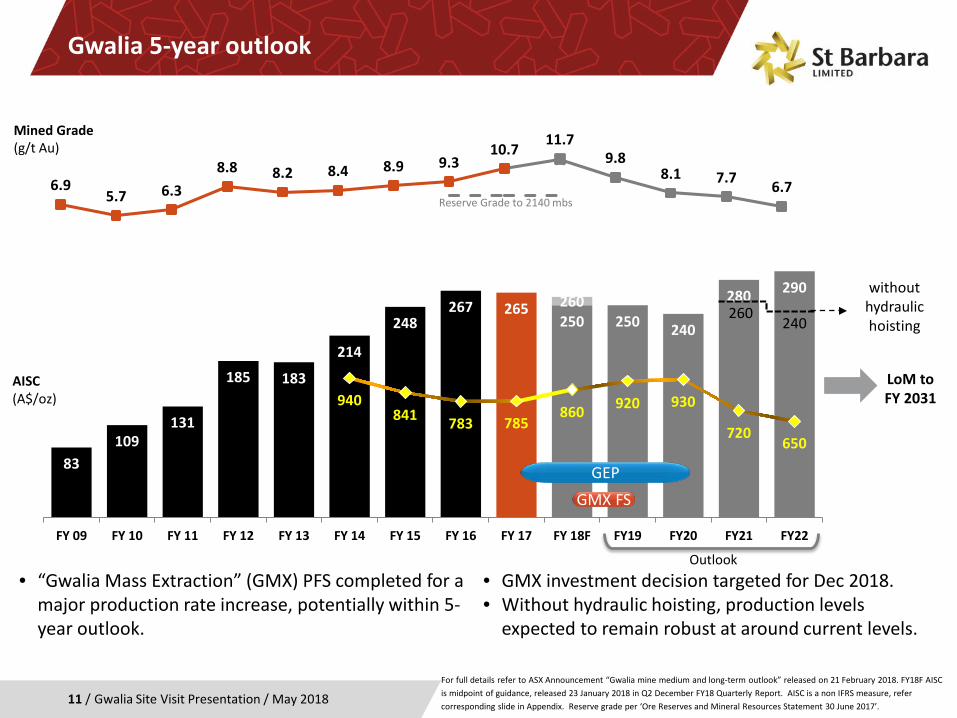
Gwalia 5-year outlook
Gwalia Site Visit Presentation / May 201811 /For full details refer to ASX Announcement “Gwalia mine medium and long-term outlook” released on 21 February 2018. FY18F AISC is midpoint of guidance, released 23 January 2018 in Q2 December FY18 Quarterly Report. AISC is a non IFRS measure, refer corresponding slide in Appendix. Reserve grade per ‘Ore Reserves and Mineral Resources Statement 30 June 2017’.
• “Gwalia Mass Extraction” (GMX) PFS completed for a major production rate increase, potentially within 5-year outlook.
• GMX investment decision targeted for Dec 2018.• Without hydraulic hoisting, production levels
expected to remain robust at around current levels.
83109
131
185 183
214
248267 265
250 250 240
280 290260
940841 783 785
860 920 930
720650
FY 09 FY 10 FY 11 FY 12 FY 13 FY 14 FY 15 FY 16 FY 17 FY 18F FY19 FY20 FY21 FY22
AISC(A$/oz)
Outlook
260240
GEPGMX FS
6.95.7 6.3
8.8 8.2 8.4 8.9 9.310.7 11.7
9.88.1 7.7 6.7
Mined Grade(g/t Au)
Reserve Grade to 2140 mbs
without hydraulic hoisting
LoM to FY 2031
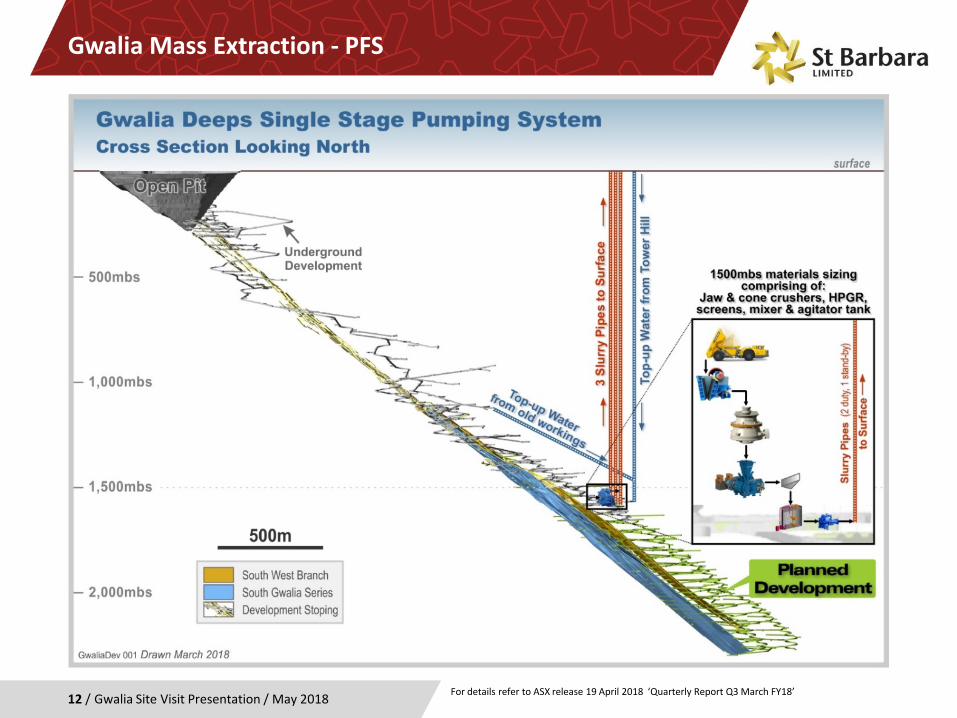
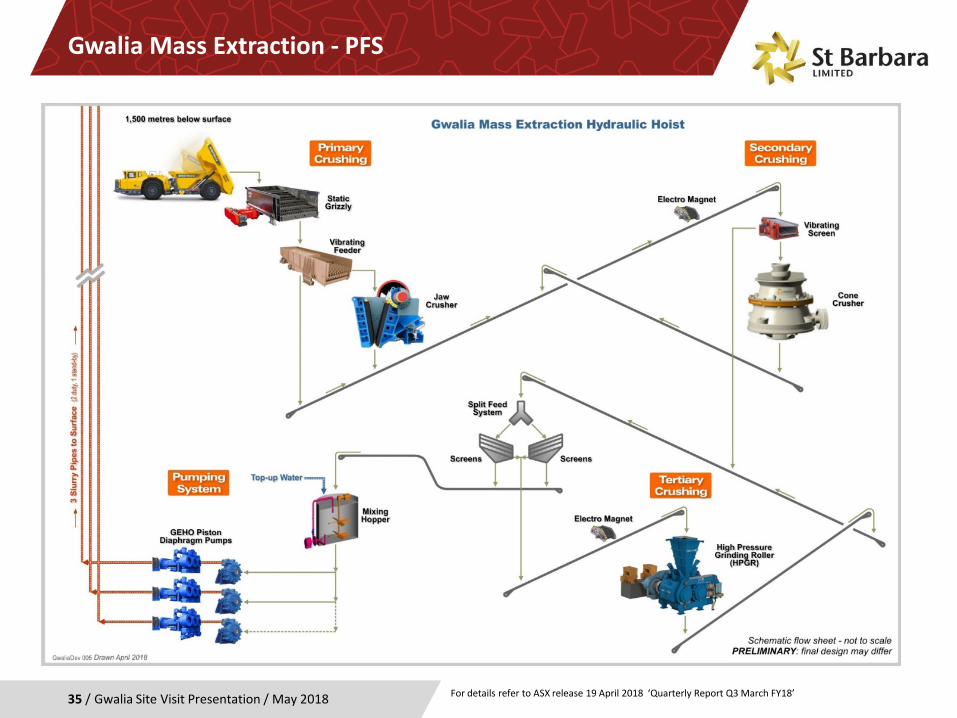
Gwalia Mass Extraction - PFS
Gwalia Site Visit Presentation / May 201812 / For details refer to ASX release 19 April 2018 ‘Quarterly Report Q3 March FY18’

Gwalia Mass Extraction - PFS
Gwalia Site Visit Presentation / May 201813 / For details refer to ASX release 19 April 2018 ‘Quarterly Report Q3 March FY18’
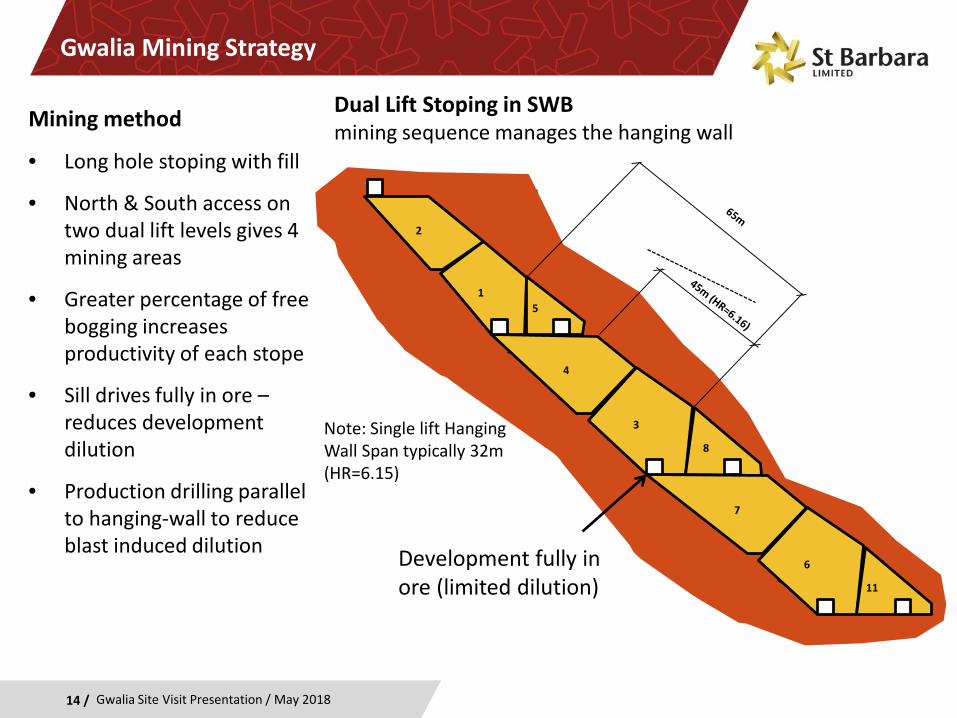
Dual Lift Stoping in SWB mining sequence manages the hanging wall
Gwalia Mining Strategy
FY11
15
2
3
8
4
6
11
7
Development fully in ore (limited dilution)
Note: Single lift Hanging Wall Span typically 32m (HR=6.15)
14 /
Mining method
• Long hole stoping with fill
• North & South access on two dual lift levels gives 4 mining areas
• Greater percentage of free bogging increases productivity of each stope
• Sill drives fully in ore –reduces development dilution
• Production drilling parallel to hanging-wall to reduce blast induced dilution
Gwalia Site Visit Presentation / May 2018
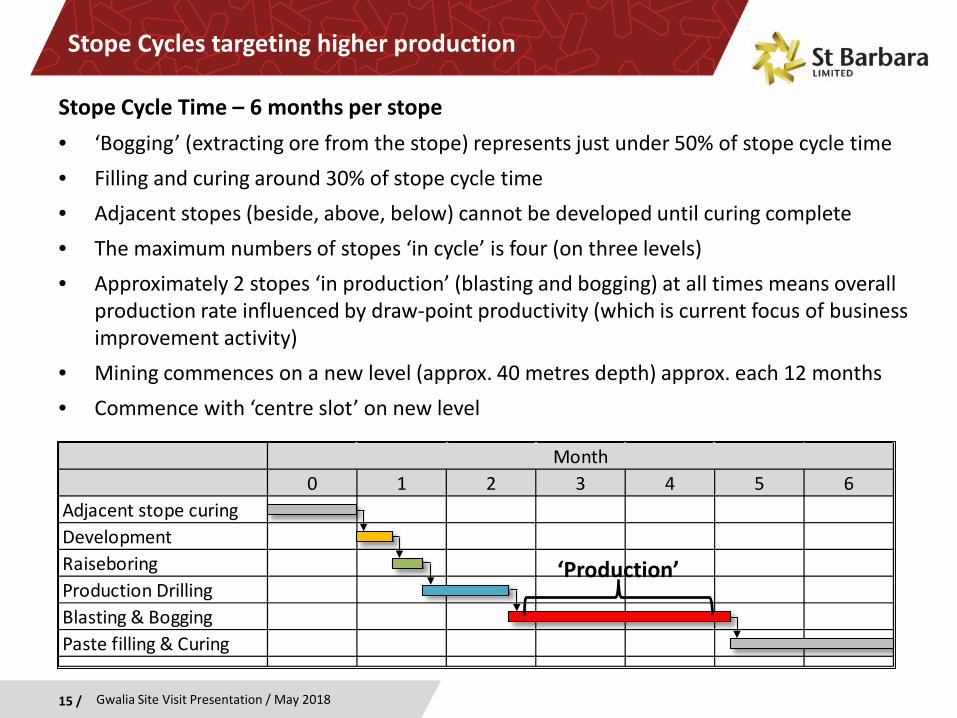
Stope Cycles targeting higher production
Stope Cycle Time – 6 months per stope• ‘Bogging’ (extracting ore from the stope) represents just under 50% of stope cycle time • Filling and curing around 30% of stope cycle time• Adjacent stopes (beside, above, below) cannot be developed until curing complete• The maximum numbers of stopes ‘in cycle’ is four (on three levels)• Approximately 2 stopes ‘in production’ (blasting and bogging) at all times means overall
production rate influenced by draw-point productivity (which is current focus of business improvement activity)
• Mining commences on a new level (approx. 40 metres depth) approx. each 12 months• Commence with ‘centre slot’ on new level
15 /
0 1 2 3 4 5 6Adjacent stope curingDevelopmentRaiseboringProduction DrillingBlasting & BoggingPaste filling & Curing
Month
‘Production’
Gwalia Site Visit Presentation / May 2018
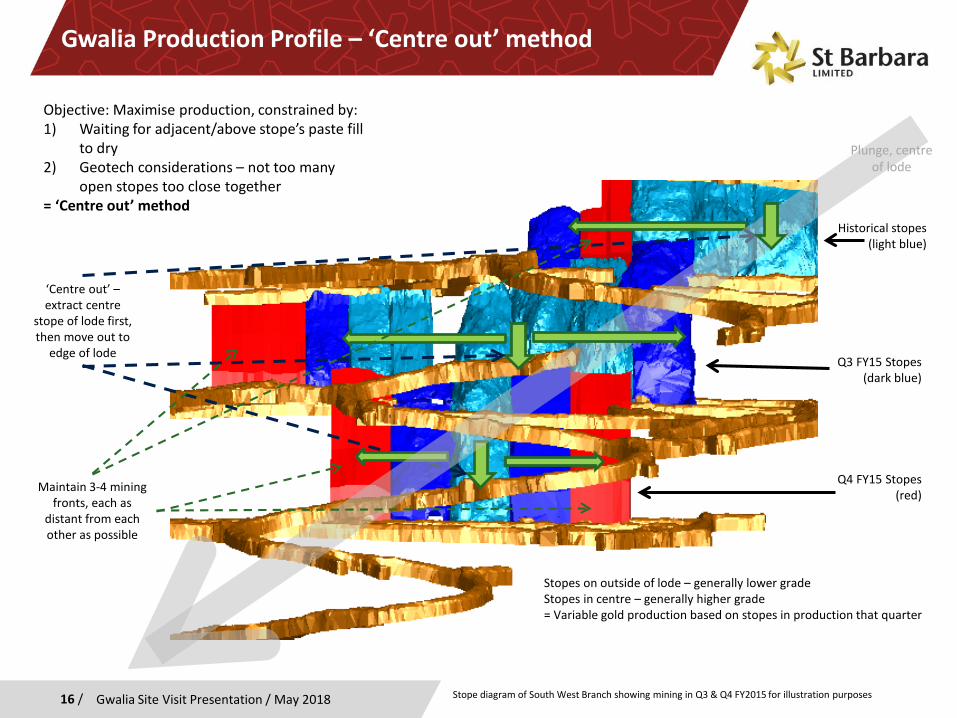
Gwalia Production Profile – ‘Centre out’ method
16 /
Historical stopes (light blue)
Q4 FY15 Stopes (red)
Q3 FY15 Stopes (dark blue)
‘Centre out’ –extract centre
stope of lode first, then move out to
edge of lode
Objective: Maximise production, constrained by:1) Waiting for adjacent/above stope’s paste fill
to dry2) Geotech considerations – not too many
open stopes too close together= ‘Centre out’ method
Stope diagram of South West Branch showing mining in Q3 & Q4 FY2015 for illustration purposes
Stopes on outside of lode – generally lower gradeStopes in centre – generally higher grade= Variable gold production based on stopes in production that quarter
Plunge, centre of lode
Maintain 3-4 mining fronts, each as
distant from each other as possible
Gwalia Site Visit Presentation / May 2018
17 / Gwalia Site Visit Presentation / May 2018
GwaliaA rich history with a bright future
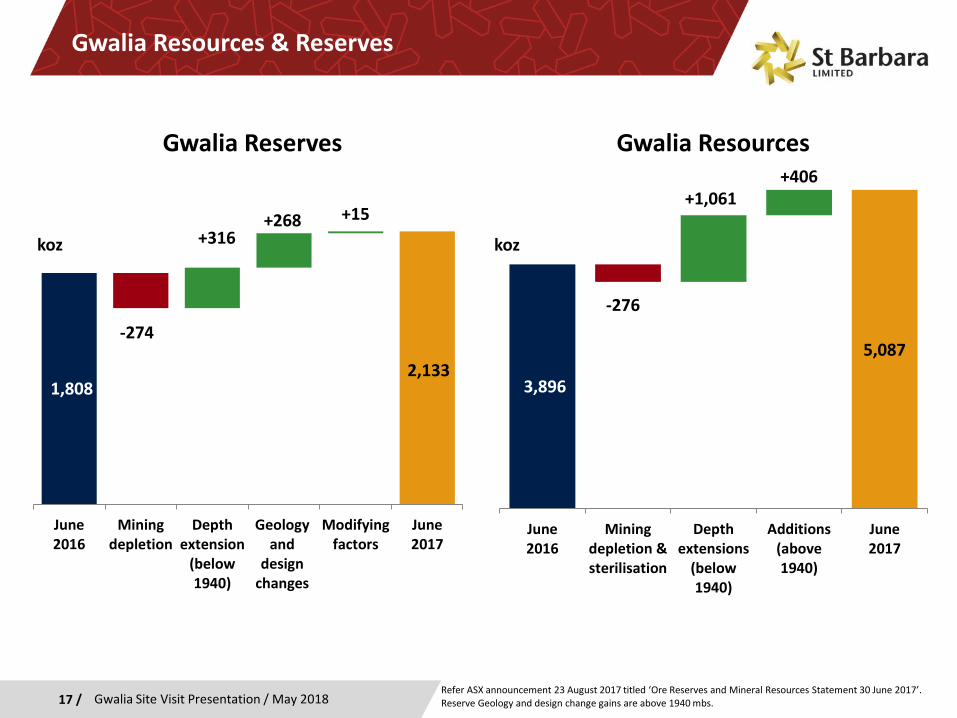
Gwalia Resources & Reserves
Refer ASX announcement 23 August 2017 titled ‘Ore Reserves and Mineral Resources Statement 30 June 2017’. Reserve Geology and design change gains are above 1940 mbs.
2,133
-274
+316+268 +15
1,808
June2016
Miningdepletion
Depthextension
(below1940)
Geologyand
designchanges
Modifyingfactors
June2017
koz
5,087
-276
+1,061+406
3,896
June2016
Miningdepletion &sterilisation
Depthextensions
(below1940)
Additions(above1940)
June2017
koz
Gwalia ResourcesGwalia Reserves
18 / Gwalia Site Visit Presentation / May 2018
GwaliaA rich history with a bright future
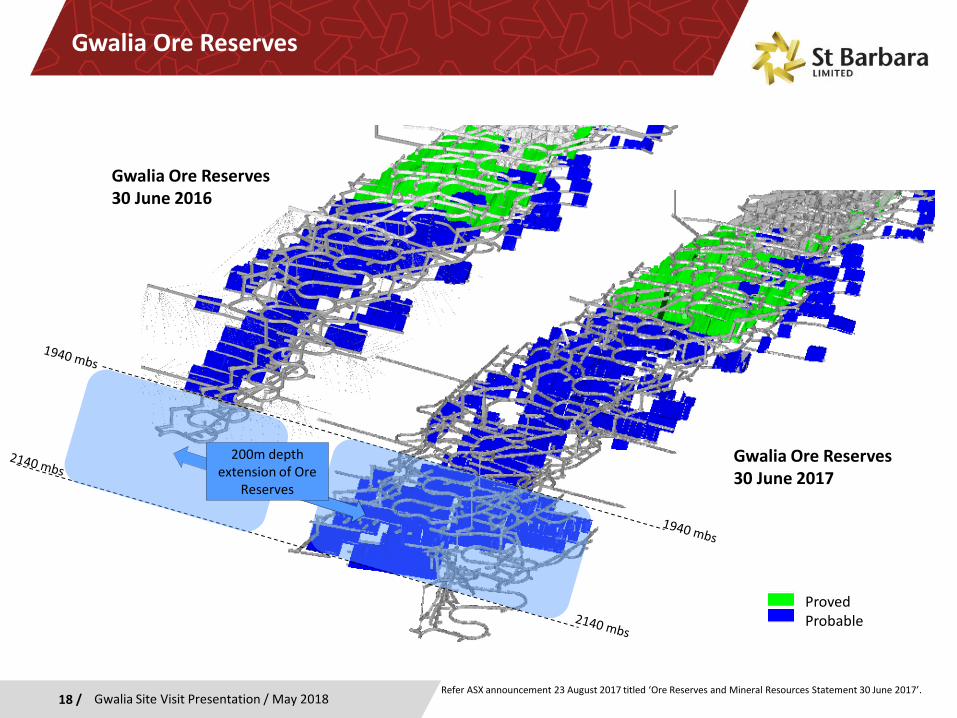
Gwalia Ore Reserves
Refer ASX announcement 23 August 2017 titled ‘Ore Reserves and Mineral Resources Statement 30 June 2017’.
Gwalia Ore Reserves30 June 2016
Gwalia Ore Reserves30 June 2017
ProvedProbable
200m depth extension of Ore
Reserves
19 / Gwalia Site Visit Presentation / May 2018
GwaliaA rich history with a bright future
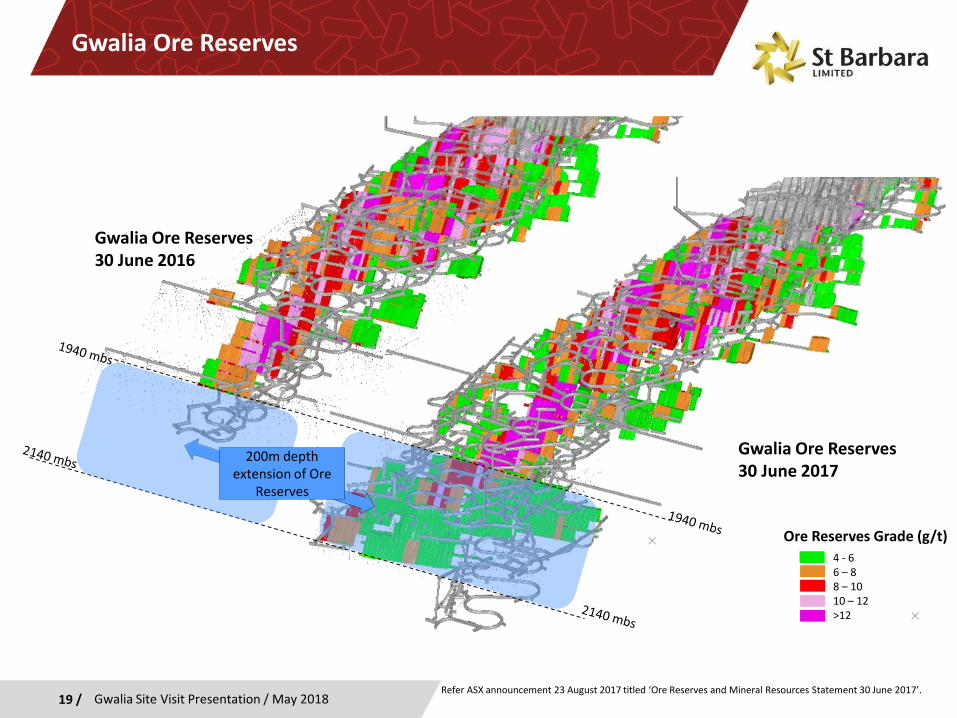
Gwalia Ore Reserves
Refer ASX announcement 23 August 2017 titled ‘Ore Reserves and Mineral Resources Statement 30 June 2017’.
Gwalia Ore Reserves30 June 2016
200m depth extension of Ore
Reserves
4 - 66 – 88 – 1010 – 12>12
Ore Reserves Grade (g/t)
Gwalia Ore Reserves30 June 2017
20 / Gwalia Site Visit Presentation / May 2018
GwaliaA rich history with a bright future
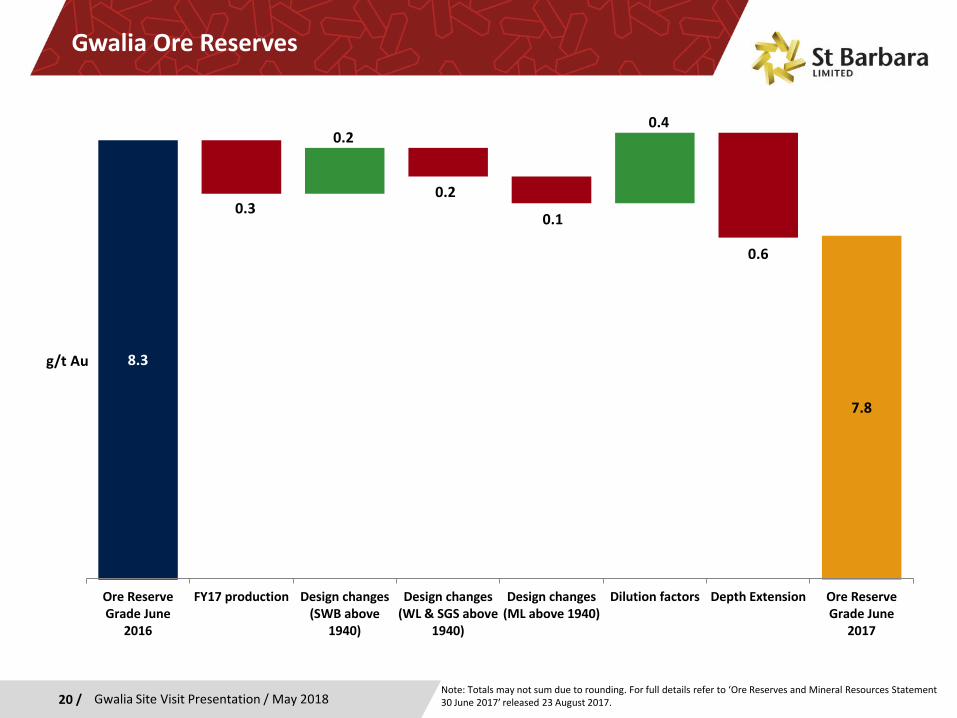
Gwalia Ore Reserves
Note: Totals may not sum due to rounding. For full details refer to ‘Ore Reserves and Mineral Resources Statement 30 June 2017’ released 23 August 2017.
7.8
0.30.2
0.1
0.6
0.20.4
8.3
Ore ReserveGrade June
2016
FY17 production Design changes(SWB above
1940)
Design changes(WL & SGS above
1940)
Design changes(ML above 1940)
Dilution factors Depth Extension Ore ReserveGrade June
2017
g/t Au
21 / Gwalia Site Visit Presentation / May 2018
GwaliaA rich history with a bright future
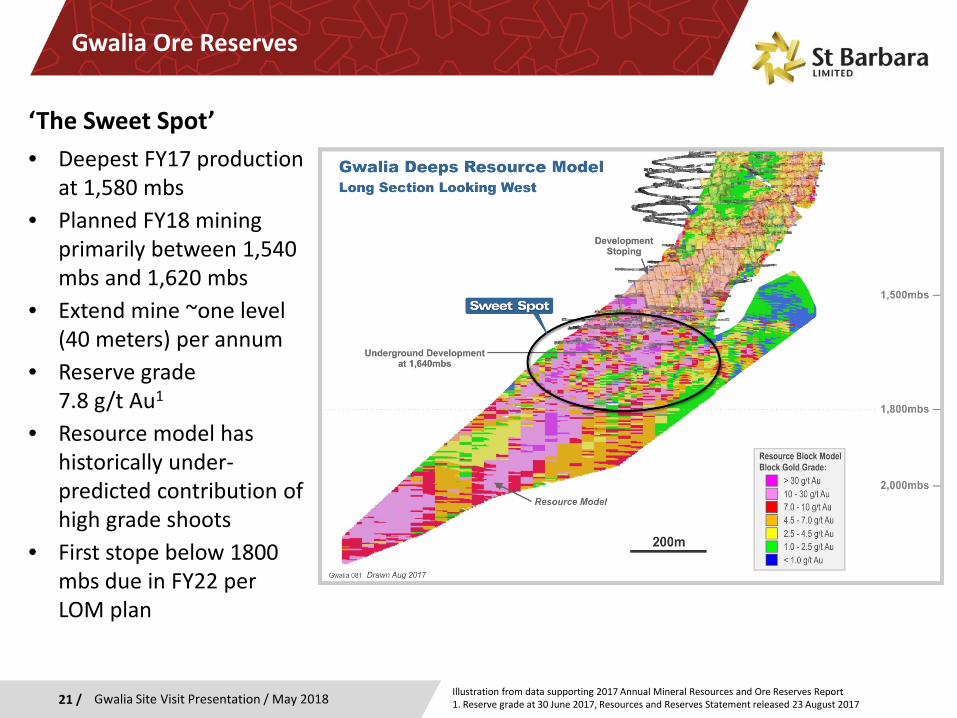
Gwalia Ore Reserves
‘The Sweet Spot’• Deepest FY17 production
at 1,580 mbs• Planned FY18 mining
primarily between 1,540 mbs and 1,620 mbs
• Extend mine ~one level (40 meters) per annum
• Reserve grade 7.8 g/t Au1
• Resource model has historically under-predicted contribution of high grade shoots
• First stope below 1800 mbs due in FY22 per LOM plan
Illustration from data supporting 2017 Annual Mineral Resources and Ore Reserves Report1. Reserve grade at 30 June 2017, Resources and Reserves Statement released 23 August 2017
22 / Gwalia Site Visit Presentation / May 2018
GwaliaA rich history with a bright future
Pinjin, May 2016
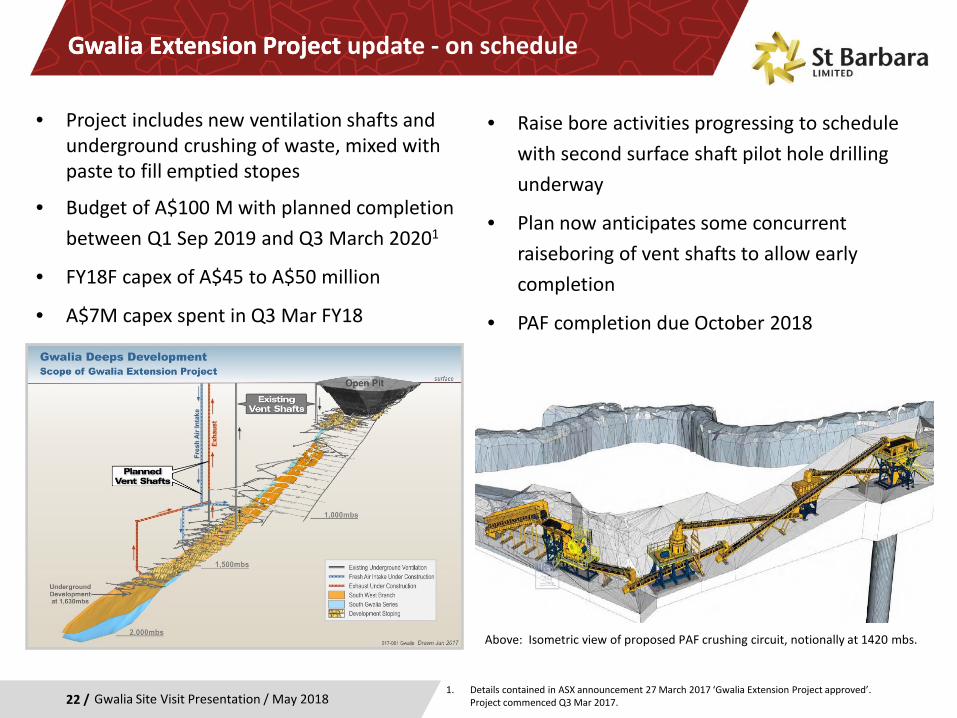
Gwalia Extension Project Gwalia Extension Project update - on schedule
1. Details contained in ASX announcement 27 March 2017 ‘Gwalia Extension Project approved’. Project commenced Q3 Mar 2017.
• Project includes new ventilation shafts and underground crushing of waste, mixed with paste to fill emptied stopes
• Budget of A$100 M with planned completion between Q1 Sep 2019 and Q3 March 20201
• FY18F capex of A$45 to A$50 million
• A$7M capex spent in Q3 Mar FY18
• Raise bore activities progressing to schedule with second surface shaft pilot hole drilling underway
• Plan now anticipates some concurrent raiseboring of vent shafts to allow early completion
• PAF completion due October 2018
Above: Isometric view of proposed PAF crushing circuit, notionally at 1420 mbs.
23 / Gwalia Site Visit Presentation / May 2018
GwaliaA rich history with a bright future
Gwalia - March 2016
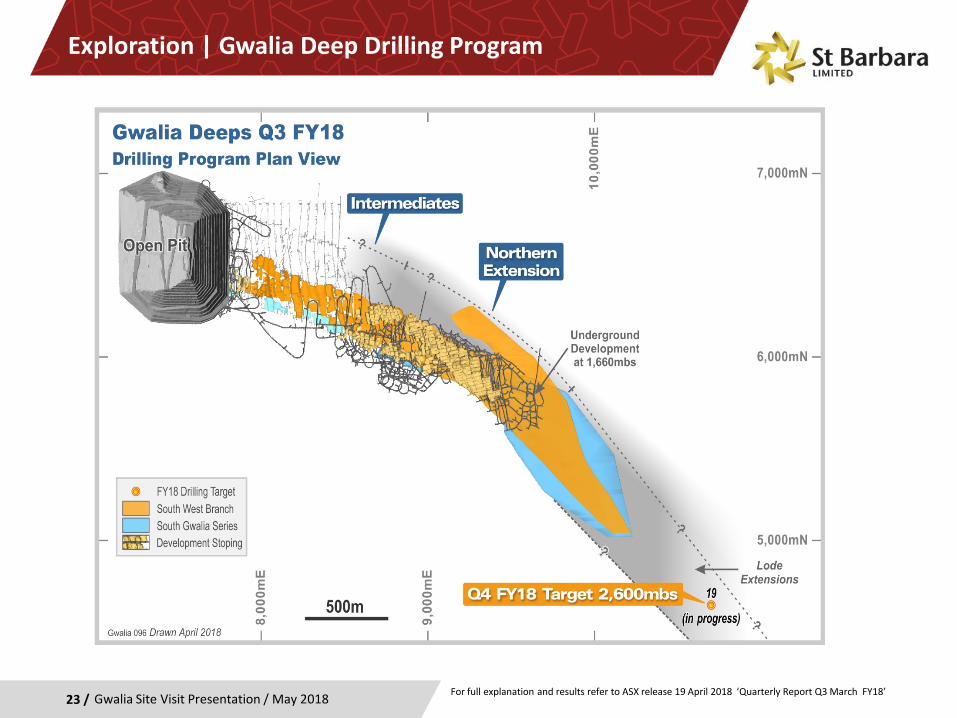
Exploration | Gwalia Deep Drilling Program
For full explanation and results refer to ASX release 19 April 2018 ‘Quarterly Report Q3 March FY18’
24 / Gwalia Site Visit Presentation / May 2018
Gwalia - March 2016
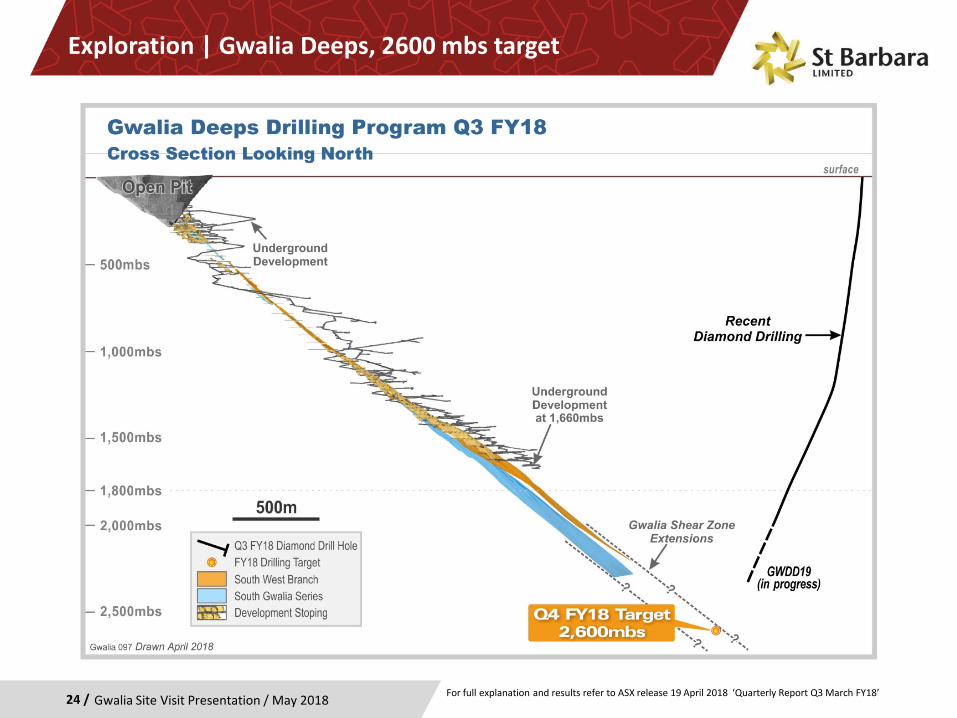
Exploration | Gwalia Deeps, 2600 mbs target
For full explanation and results refer to ASX release 19 April 2018 ‘Quarterly Report Q3 March FY18’
25 / Gwalia Site Visit Presentation / May 2018
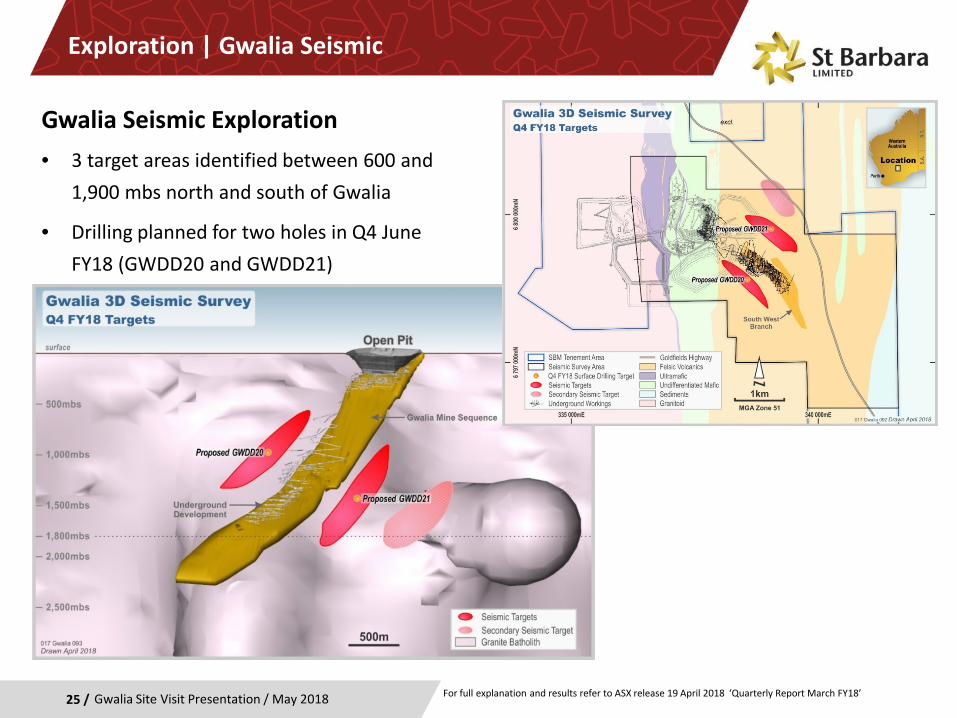
Exploration | Gwalia Seismic
Gwalia Seismic Exploration • 3 target areas identified between 600 and
1,900 mbs north and south of Gwalia
• Drilling planned for two holes in Q4 June FY18 (GWDD20 and GWDD21)
For full explanation and results refer to ASX release 19 April 2018 ‘Quarterly Report March FY18’
26 / Gwalia Site Visit Presentation / May 2018
GwaliaA rich history with a bright future
Gwalia - March 2016
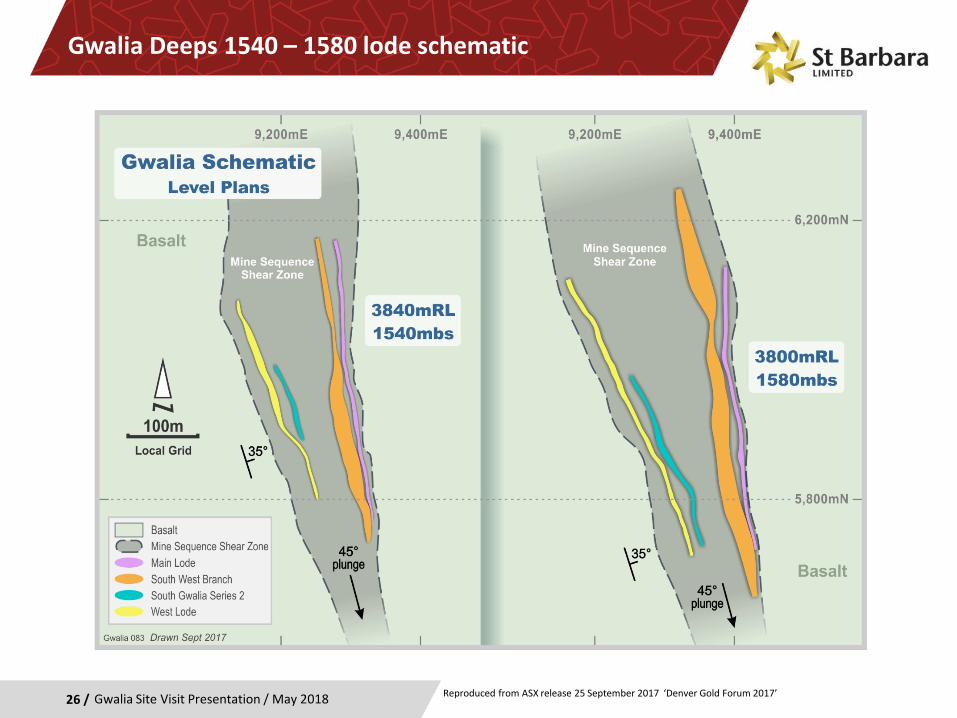
Gwalia Deeps 1540 – 1580 lode schematic
Reproduced from ASX release 25 September 2017 ‘Denver Gold Forum 2017’
Appendices
Gwalia Site Visit Presentation / May 201827 /November 2017 – Gwalia management team visiting raisebore drilling site.
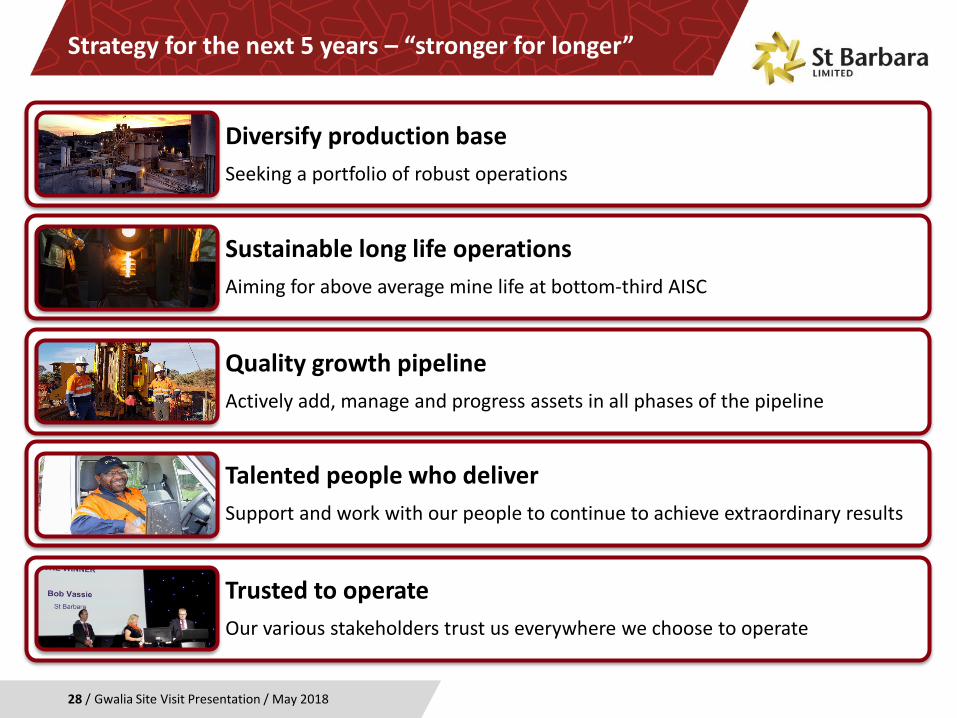
Strategy for the next 5 years – “stronger for longer”
Gwalia Site Visit Presentation / May 201828 /
Diversify production baseSeeking a portfolio of robust operations
Sustainable long life operationsAiming for above average mine life at bottom-third AISC
Quality growth pipelineActively add, manage and progress assets in all phases of the pipeline
Talented people who deliverSupport and work with our people to continue to achieve extraordinary results
Trusted to operateOur various stakeholders trust us everywhere we choose to operate
29 /
GwaliaA rich history with a bright future
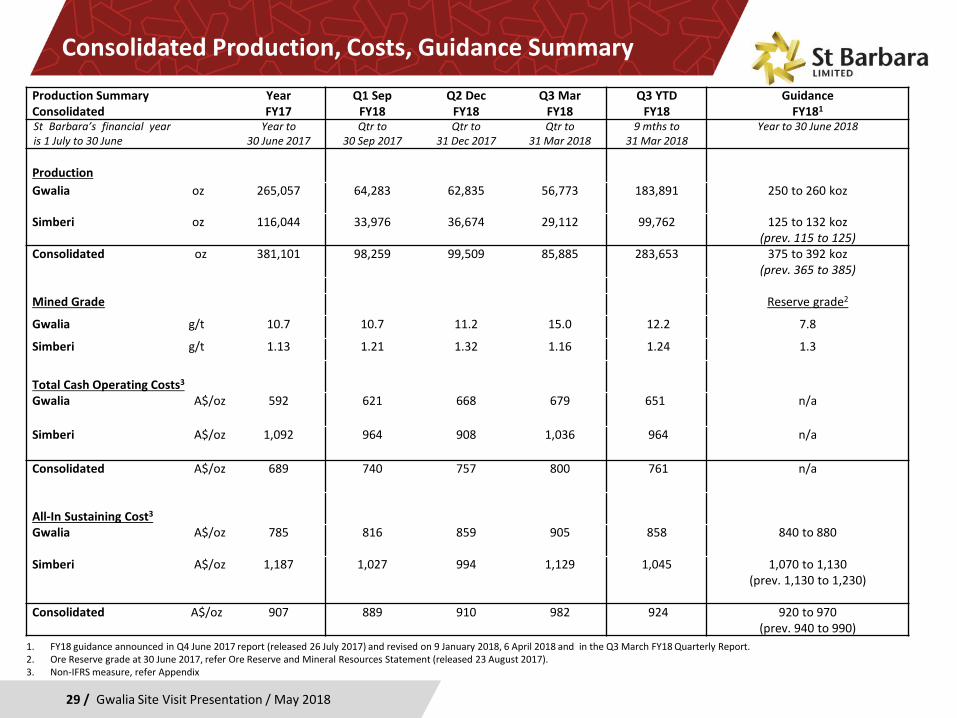
Consolidated Production, Costs, Guidance Summary
Continuous Remote Tele-boggingAt critical times bogger operates 24 hours a day
Gwalia Site Visit Presentation / May 2018
Production SummaryConsolidated
YearFY17
Q1 SepFY18
Q2 DecFY18
Q3 MarFY18
Q3 YTDFY18
GuidanceFY181
St Barbara’s financial yearis 1 July to 30 June
Year to 30 June 2017
Qtr to 30 Sep 2017
Qtr to 31 Dec 2017
Qtr to 31 Mar 2018
9 mths to 31 Mar 2018
Year to 30 June 2018
ProductionGwalia oz 265,057 64,283 62,835 56,773 183,891 250 to 260 koz
Simberi oz 116,044 33,976 36,674 29,112 99,762 125 to 132 koz(prev. 115 to 125)
Consolidated oz 381,101 98,259 99,509 85,885 283,653 375 to 392 koz(prev. 365 to 385)
Mined Grade Reserve grade2
Gwalia g/t 10.7 10.7 11.2 15.0 12.2 7.8
Simberi g/t 1.13 1.21 1.32 1.16 1.24 1.3
Total Cash Operating Costs3
Gwalia A$/oz 592 621 668 679 651 n/a
Simberi A$/oz 1,092 964 908 1,036 964 n/a
Consolidated A$/oz 689 740 757 800 761 n/a
All-In Sustaining Cost3
Gwalia A$/oz 785 816 859 905 858 840 to 880
Simberi A$/oz 1,187 1,027 994 1,129 1,045 1,070 to 1,130(prev. 1,130 to 1,230)
Consolidated A$/oz 907 889 910 982 924 920 to 970(prev. 940 to 990)
1. FY18 guidance announced in Q4 June 2017 report (released 26 July 2017) and revised on 9 January 2018, 6 April 2018 and in the Q3 March FY18 Quarterly Report. 2. Ore Reserve grade at 30 June 2017, refer Ore Reserve and Mineral Resources Statement (released 23 August 2017).3. Non-IFRS measure, refer Appendix
Gwalia Operations
30 / Gwalia Site Visit Presentation / May 2018
Byrnecut – contract mining
• Byrnecut is part of Gwalia’s success
• Started at Gwalia in Sep 2012
• Alliance agreement from Sep 2013
• Approx. 200 employees
• Fleet: inc.
• 7 drill rigs• 5 loaders• 10 trucks
• 5 Atlas Copco MT6020s (60t)• 5 Atlas Copco MT65s (65t)
Other contractors
• Approx. 80 contractors involved as required
St Barbara
• Responsible for
• Planning
• Processing
• Procurement
• Commercial
• Approx. 150 employees, mostly FIFO
• Leonora facilities
• 1.2 Mtpa plant
• 300+ bed camp
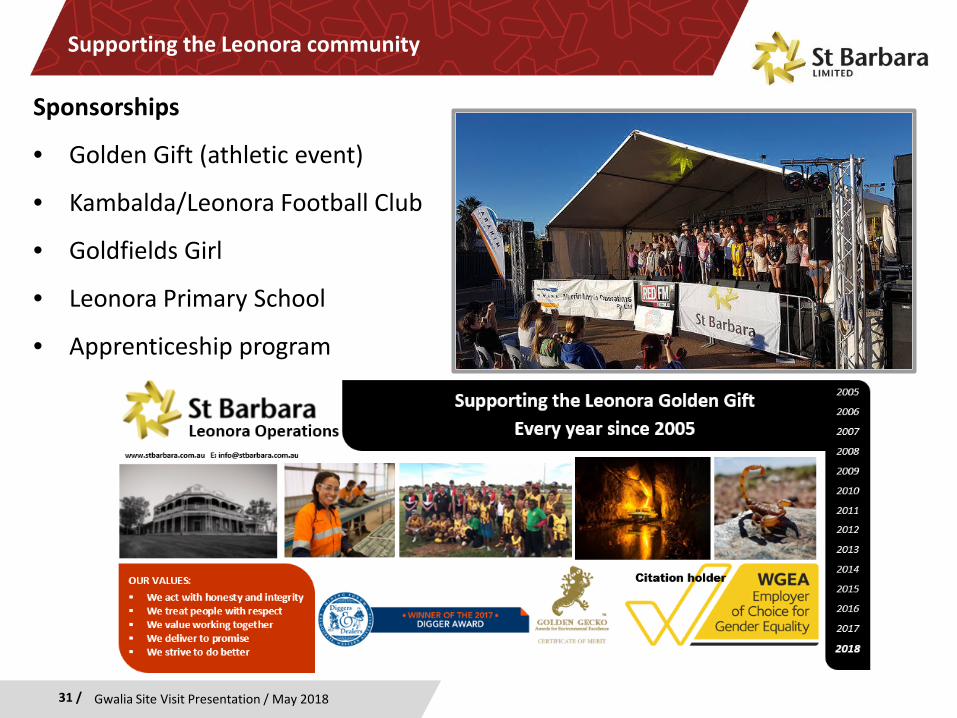
Supporting the Leonora community
31 / Gwalia Site Visit Presentation / May 2018
Sponsorships
• Golden Gift (athletic event)
• Kambalda/Leonora Football Club
• Goldfields Girl
• Leonora Primary School
• Apprenticeship program
32 / Gwalia Site Visit Presentation / May 2018
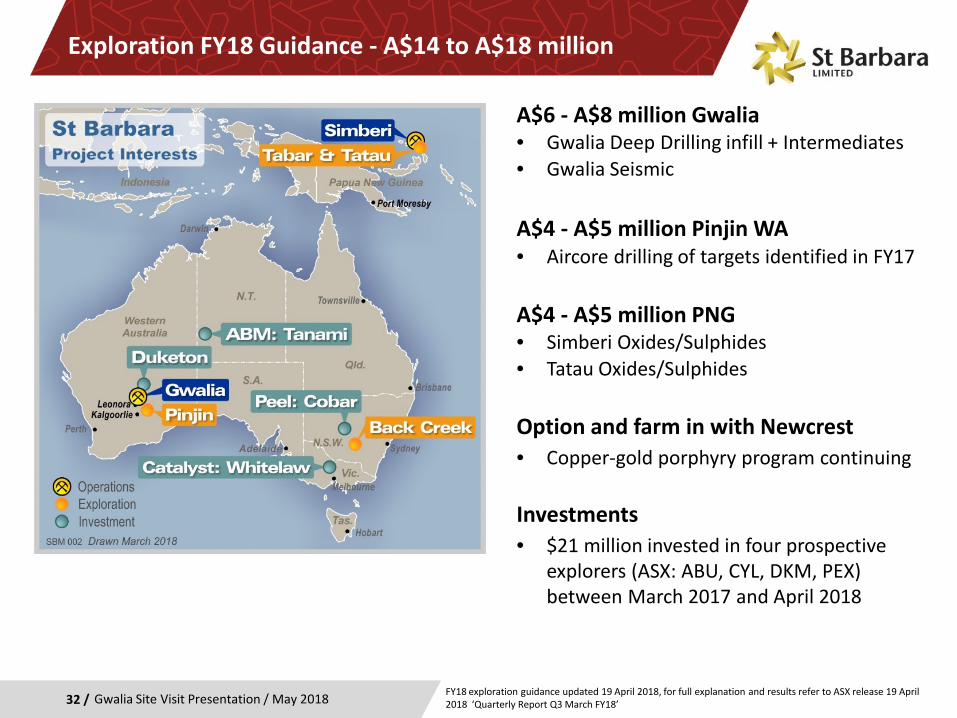
Exploration FY18 Guidance - A$14 to A$18 million
A$6 - A$8 million Gwalia• Gwalia Deep Drilling infill + Intermediates• Gwalia Seismic
A$4 - A$5 million Pinjin WA • Aircore drilling of targets identified in FY17
A$4 - A$5 million PNG• Simberi Oxides/Sulphides• Tatau Oxides/Sulphides
Option and farm in with Newcrest• Copper-gold porphyry program continuing
Investments• $21 million invested in four prospective
explorers (ASX: ABU, CYL, DKM, PEX) between March 2017 and April 2018
FY18 exploration guidance updated 19 April 2018, for full explanation and results refer to ASX release 19 April 2018 ‘Quarterly Report Q3 March FY18’
33 / Gwalia Site Visit Presentation / May 2018
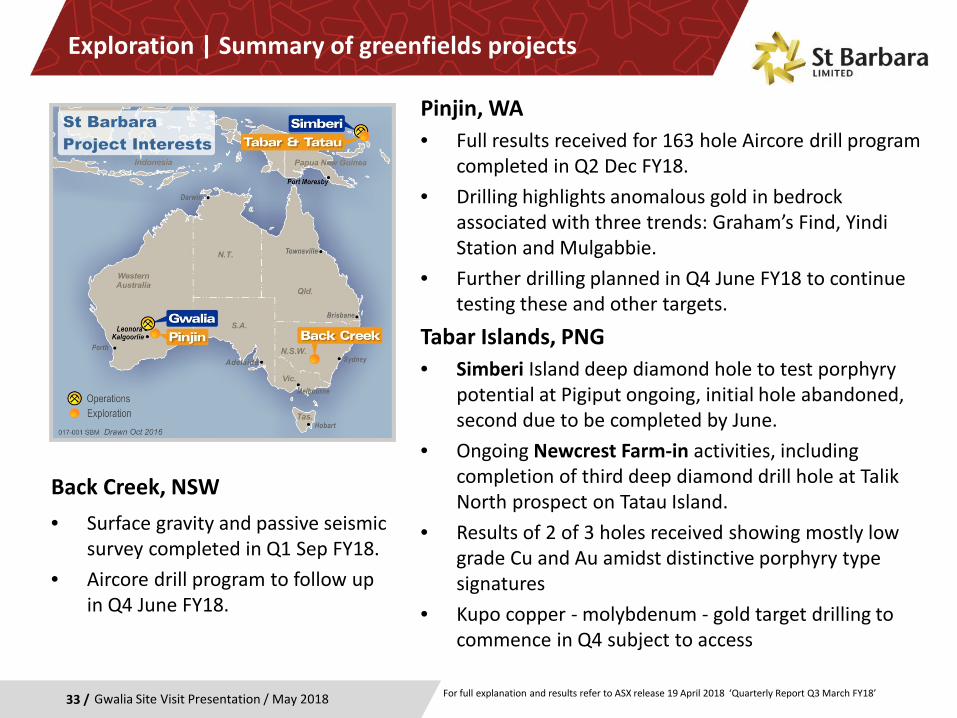
Exploration | Summary of greenfields projects
Pinjin, WA• Full results received for 163 hole Aircore drill program
completed in Q2 Dec FY18.• Drilling highlights anomalous gold in bedrock
associated with three trends: Graham’s Find, Yindi Station and Mulgabbie.
• Further drilling planned in Q4 June FY18 to continue testing these and other targets.
Tabar Islands, PNG• Simberi Island deep diamond hole to test porphyry
potential at Pigiput ongoing, initial hole abandoned, second due to be completed by June.
• Ongoing Newcrest Farm-in activities, including completion of third deep diamond drill hole at Talik North prospect on Tatau Island.
• Results of 2 of 3 holes received showing mostly low grade Cu and Au amidst distinctive porphyry type signatures
• Kupo copper - molybdenum - gold target drilling to commence in Q4 subject to access
Back Creek, NSW• Surface gravity and passive seismic
survey completed in Q1 Sep FY18.• Aircore drill program to follow up
in Q4 June FY18.
For full explanation and results refer to ASX release 19 April 2018 ‘Quarterly Report Q3 March FY18’
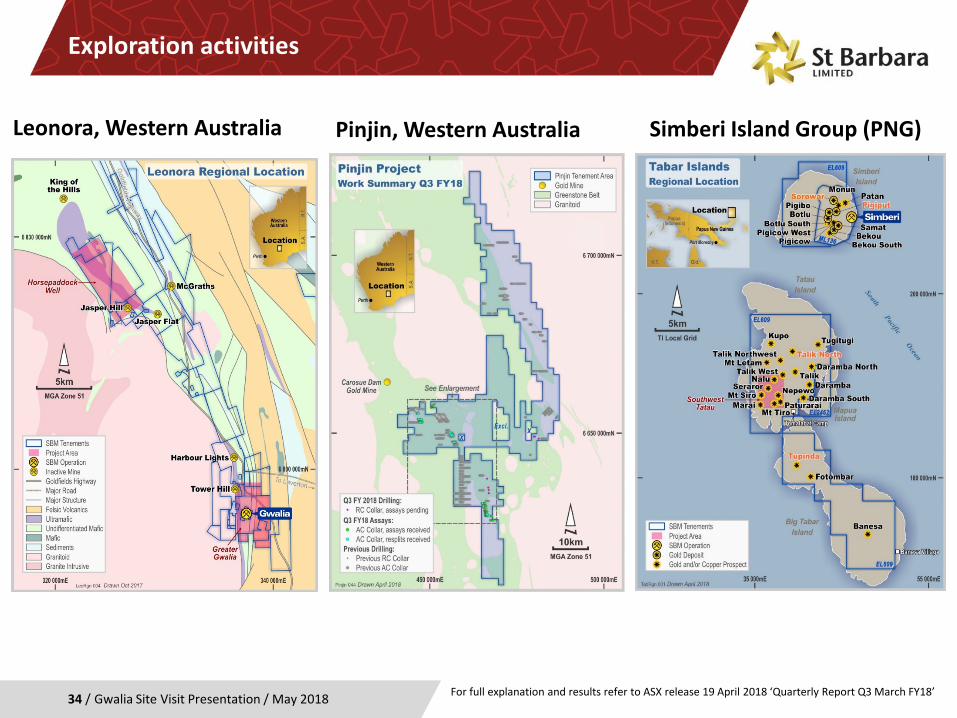
Exploration activities
Gwalia Site Visit Presentation / May 201834 /
Simberi Island Group (PNG)Pinjin, Western Australia
For full explanation and results refer to ASX release 19 April 2018 ‘Quarterly Report Q3 March FY18’
Leonora, Western Australia
Gwalia Mass Extraction - PFS
Gwalia Site Visit Presentation / May 201835 / For details refer to ASX release 19 April 2018 ‘Quarterly Report Q3 March FY18’
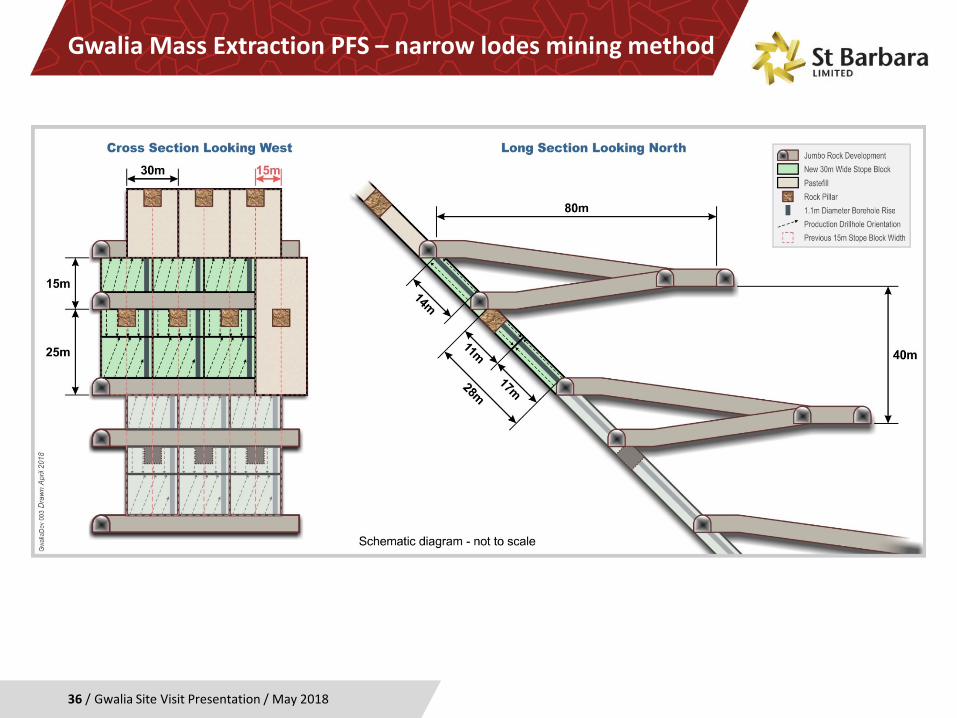
Gwalia Mass Extraction PFS – narrow lodes mining method
Gwalia Site Visit Presentation / May 201836 /
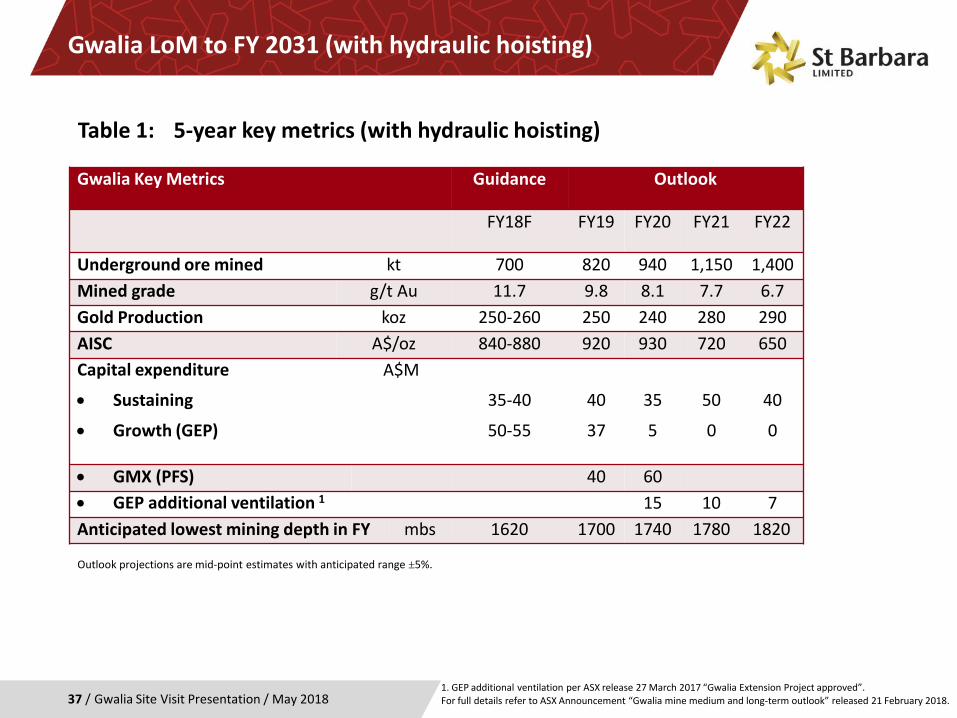
Gwalia LoM to FY 2031 (with hydraulic hoisting)
Gwalia Site Visit Presentation / May 201837 /
Gwalia Key Metrics Guidance Outlook
FY18F FY19 FY20 FY21 FY22
Underground ore mined kt 700 820 940 1,150 1,400Mined grade g/t Au 11.7 9.8 8.1 7.7 6.7Gold Production koz 250-260 250 240 280 290AISC A$/oz 840-880 920 930 720 650Capital expenditure
• Sustaining
• Growth (GEP)
A$M
35-40
50-55
40
37
35
5
50
0
40
0
• GMX (PFS) 40 60• GEP additional ventilation 1 15 10 7Anticipated lowest mining depth in FY mbs 1620 1700 1740 1780 1820
Table 1: 5-year key metrics (with hydraulic hoisting)
1. GEP additional ventilation per ASX release 27 March 2017 “Gwalia Extension Project approved”.For full details refer to ASX Announcement “Gwalia mine medium and long-term outlook” released 21 February 2018.
Outlook projections are mid-point estimates with anticipated range ±5%.
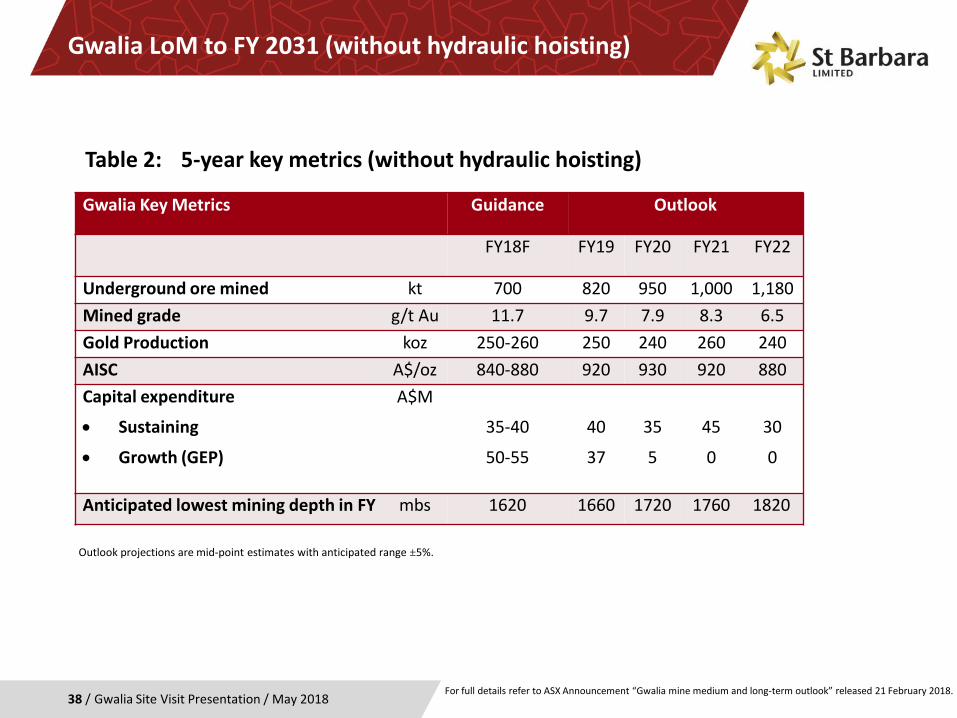
Gwalia LoM to FY 2031 (without hydraulic hoisting)
Gwalia Site Visit Presentation / May 201838 /
Gwalia Key Metrics Guidance Outlook
FY18F FY19 FY20 FY21 FY22
Underground ore mined kt 700 820 950 1,000 1,180Mined grade g/t Au 11.7 9.7 7.9 8.3 6.5Gold Production koz 250-260 250 240 260 240AISC A$/oz 840-880 920 930 920 880Capital expenditure
• Sustaining
• Growth (GEP)
A$M
35-40
50-55
40
37
35
5
45
0
30
0
Anticipated lowest mining depth in FY mbs 1620 1660 1720 1760 1820
Table 2: 5-year key metrics (without hydraulic hoisting)
For full details refer to ASX Announcement “Gwalia mine medium and long-term outlook” released 21 February 2018.
Outlook projections are mid-point estimates with anticipated range ±5%.
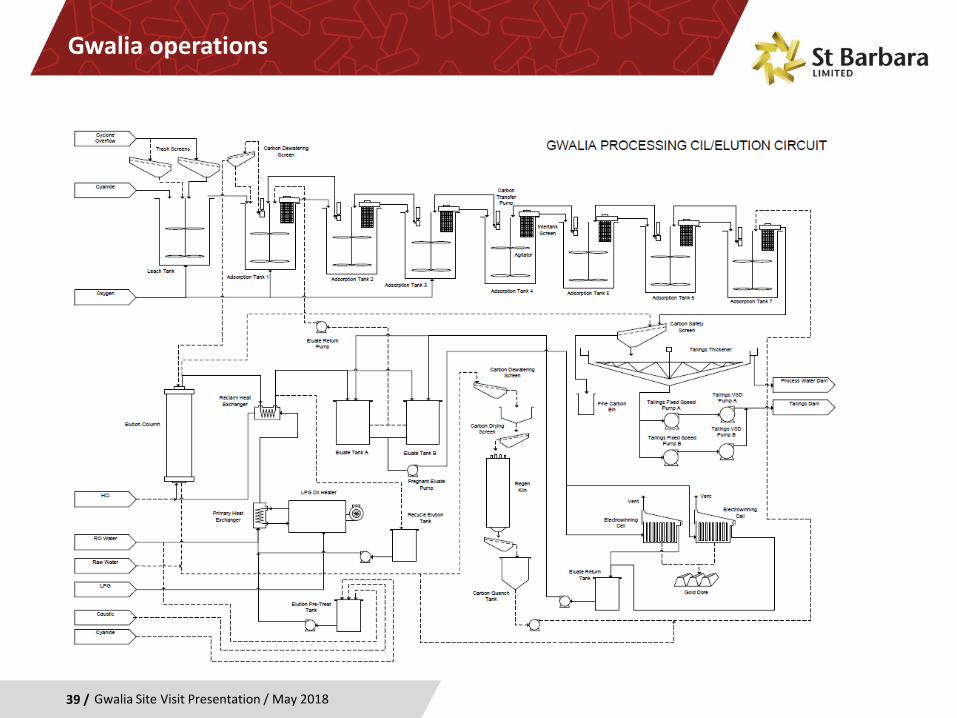
39 / Gwalia Site Visit Presentation / May 2018
Gwalia operations
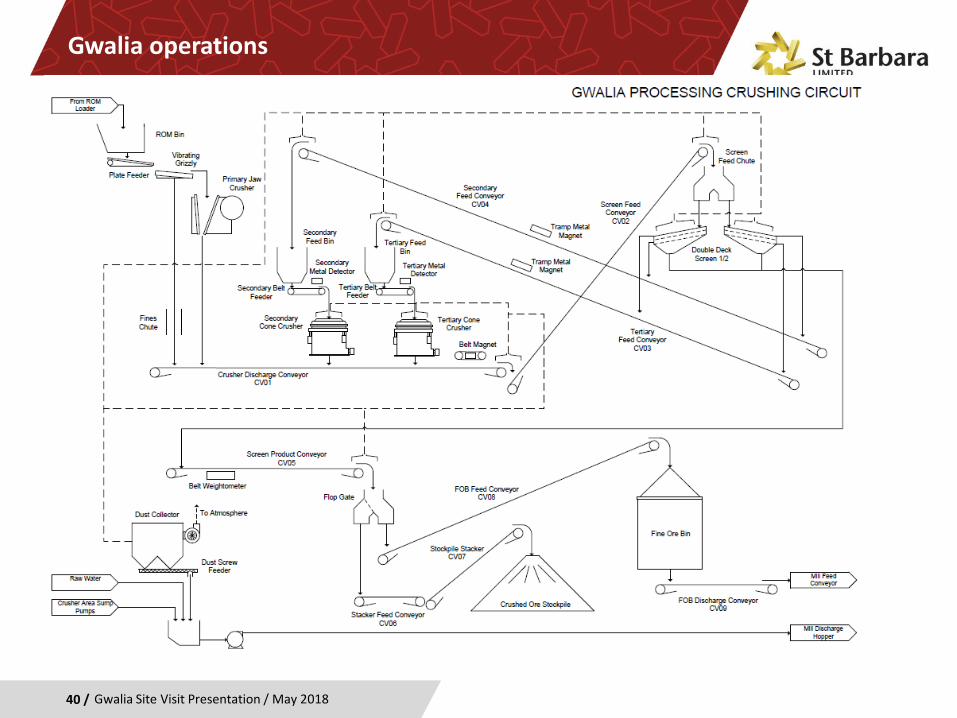
40 / Gwalia Site Visit Presentation / May 2018
GwaliaA rich history with a bright future
Gwalia operations
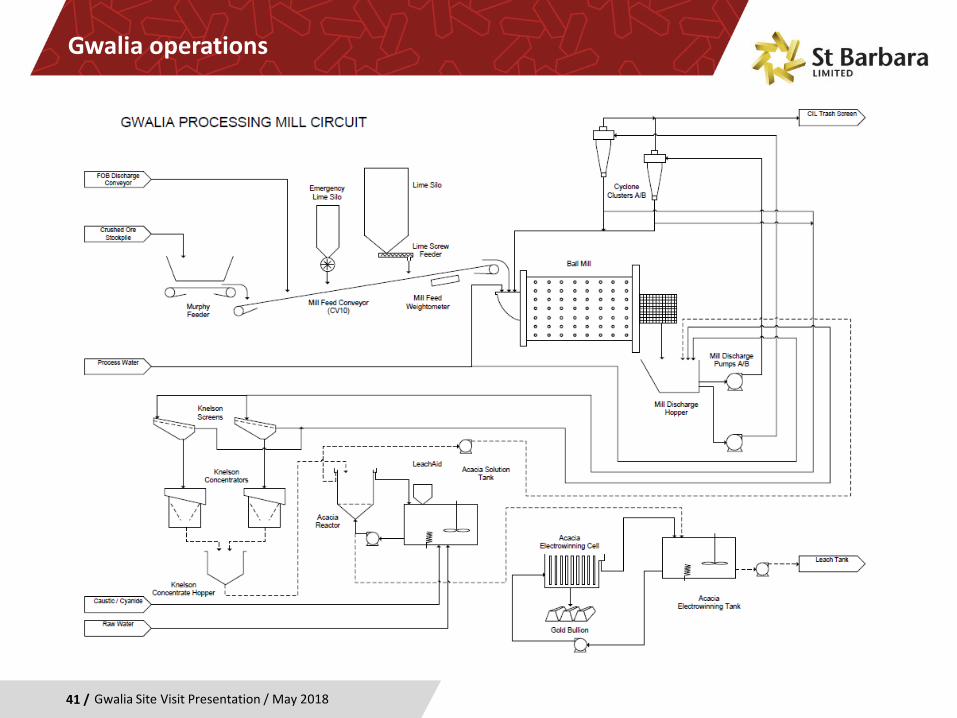
41 / Gwalia Site Visit Presentation / May 2018
GwaliaA rich history with a bright future
Gwalia operations
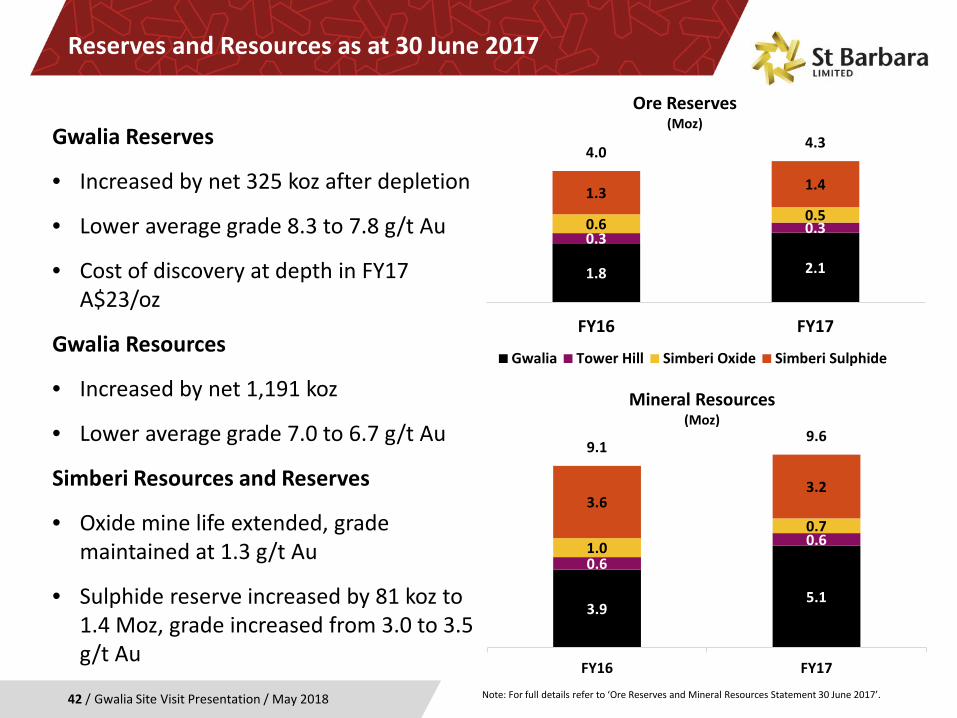
Reserves and Resources as at 30 June 2017
Gwalia Site Visit Presentation / May 201842 /
Gwalia Reserves
• Increased by net 325 koz after depletion
• Lower average grade 8.3 to 7.8 g/t Au
• Cost of discovery at depth in FY17 A$23/oz
Gwalia Resources
• Increased by net 1,191 koz
• Lower average grade 7.0 to 6.7 g/t Au
Simberi Resources and Reserves
• Oxide mine life extended, grade maintained at 1.3 g/t Au
• Sulphide reserve increased by 81 koz to 1.4 Moz, grade increased from 3.0 to 3.5 g/t Au
Note: For full details refer to ‘Ore Reserves and Mineral Resources Statement 30 June 2017’.
3.95.1
0.60.61.00.7
3.63.2
9.19.6
FY16 FY17
Mineral Resources(Moz)
1.8 2.1
0.30.30.6 0.5
1.3 1.4
4.0 4.3
FY16 FY17
Ore Reserves (Moz)
Gwalia Tower Hill Simberi Oxide Simberi Sulphide Total
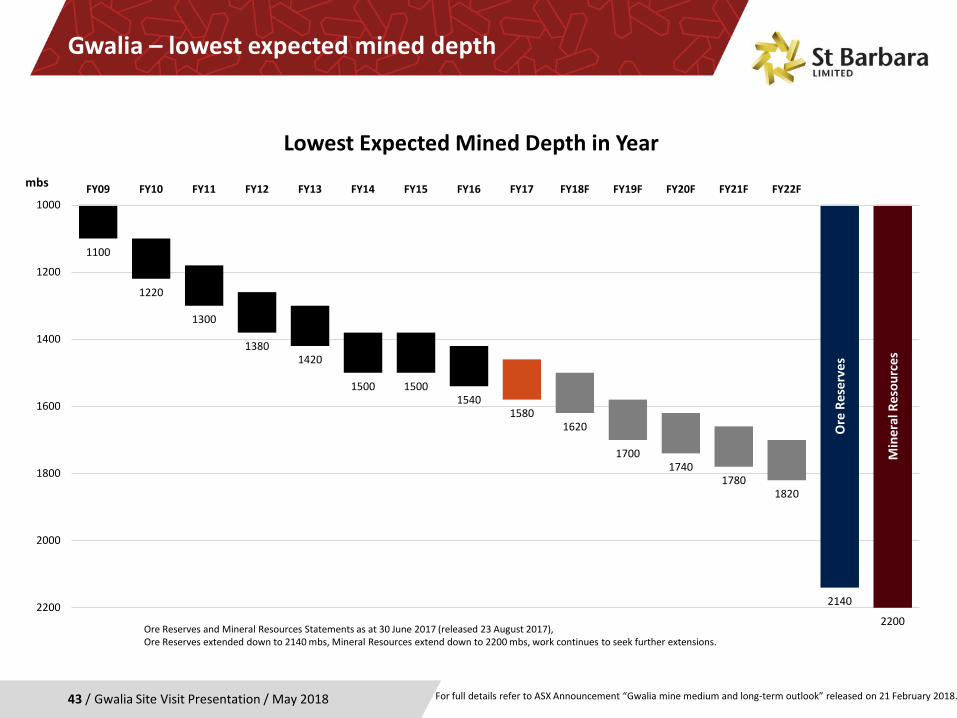
Gwalia – lowest expected mined depth
Gwalia Site Visit Presentation / May 201843 / For full details refer to ASX Announcement “Gwalia mine medium and long-term outlook” released on 21 February 2018.
Ore
Res
erve
s
Min
eral
Res
ourc
es
1100
1220
1300
13801420
1500 15001540
15801620
17001740
17801820
2140
2200
1000
1200
1400
1600
1800
2000
2200
FY09 FY10 FY11 FY12 FY13 FY14 FY15 FY16 FY17 FY18F FY19F FY20F FY21F FY22Fmbs
Lowest Expected Mined Depth in Year
Ore Reserves and Mineral Resources Statements as at 30 June 2017 (released 23 August 2017), Ore Reserves extended down to 2140 mbs, Mineral Resources extend down to 2200 mbs, work continues to seek further extensions.
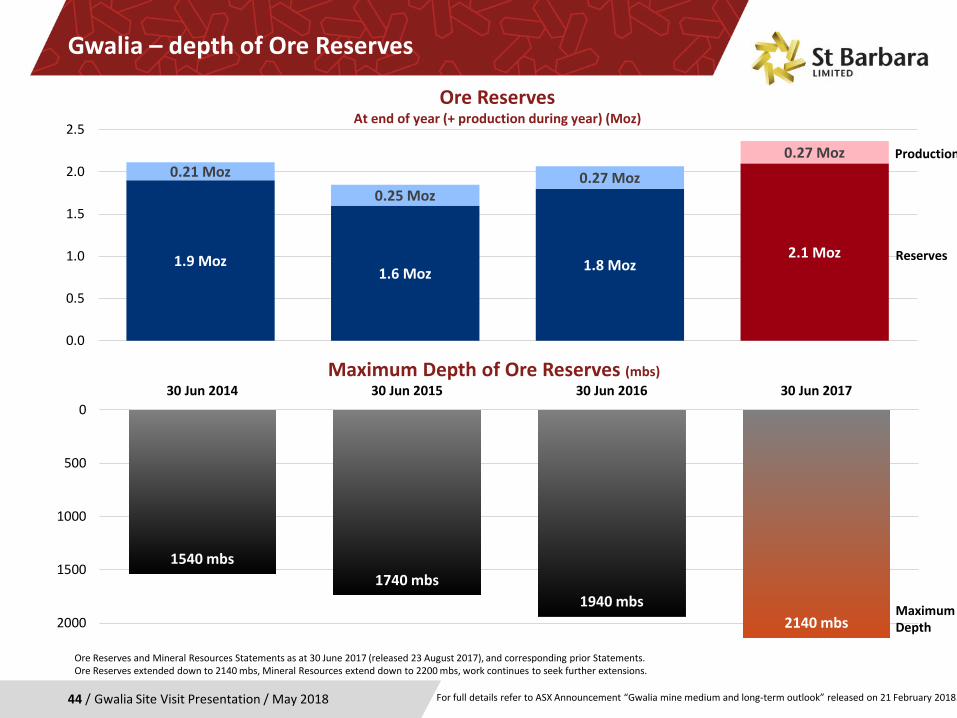
Gwalia – depth of Ore Reserves
Gwalia Site Visit Presentation / May 201844 /
1540 mbs1740 mbs
1940 mbs2140 mbs
0
500
1000
1500
2000
30 Jun 2014 30 Jun 2015 30 Jun 2016 30 Jun 2017
Ore Reserves and Mineral Resources Statements as at 30 June 2017 (released 23 August 2017), and corresponding prior Statements.Ore Reserves extended down to 2140 mbs, Mineral Resources extend down to 2200 mbs, work continues to seek further extensions.
For full details refer to ASX Announcement “Gwalia mine medium and long-term outlook” released on 21 February 2018.
1.9 Moz1.6 Moz 1.8 Moz
2.1 Moz
0.21 Moz0.25 Moz
0.27 Moz
0.27 Moz
0.0
0.5
1.0
1.5
2.0
2.5
Ore Reserves At end of year (+ production during year) (Moz)
Maximum Depth of Ore Reserves (mbs)
Production
Reserves
MaximumDepth
45 /
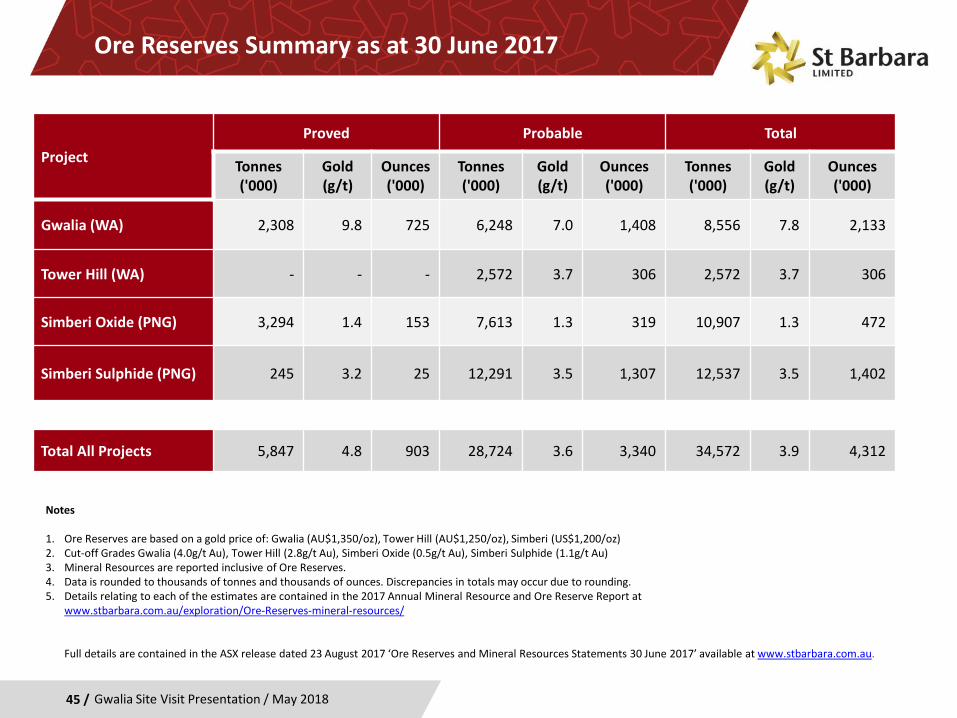
Ore Reserves Summary as at 30 June 2017
ProjectProved Probable Total
Tonnes('000)
Gold (g/t)
Ounces('000)
Tonnes('000)
Gold (g/t)
Ounces('000)
Tonnes('000)
Gold (g/t)
Ounces('000)
Gwalia (WA) 2,308 9.8 725 6,248 7.0 1,408 8,556 7.8 2,133
Tower Hill (WA) - - - 2,572 3.7 306 2,572 3.7 306
Simberi Oxide (PNG) 3,294 1.4 153 7,613 1.3 319 10,907 1.3 472
Simberi Sulphide (PNG) 245 3.2 25 12,291 3.5 1,307 12,537 3.5 1,402
Total All Projects 5,847 4.8 903 28,724 3.6 3,340 34,572 3.9 4,312
Notes
1. Ore Reserves are based on a gold price of: Gwalia (AU$1,350/oz), Tower Hill (AU$1,250/oz), Simberi (US$1,200/oz)2. Cut-off Grades Gwalia (4.0g/t Au), Tower Hill (2.8g/t Au), Simberi Oxide (0.5g/t Au), Simberi Sulphide (1.1g/t Au)3. Mineral Resources are reported inclusive of Ore Reserves.4. Data is rounded to thousands of tonnes and thousands of ounces. Discrepancies in totals may occur due to rounding.5. Details relating to each of the estimates are contained in the 2017 Annual Mineral Resource and Ore Reserve Report at
www.stbarbara.com.au/exploration/Ore-Reserves-mineral-resources/
Full details are contained in the ASX release dated 23 August 2017 ‘Ore Reserves and Mineral Resources Statements 30 June 2017’ available at www.stbarbara.com.au.
Gwalia Site Visit Presentation / May 2018
46 /
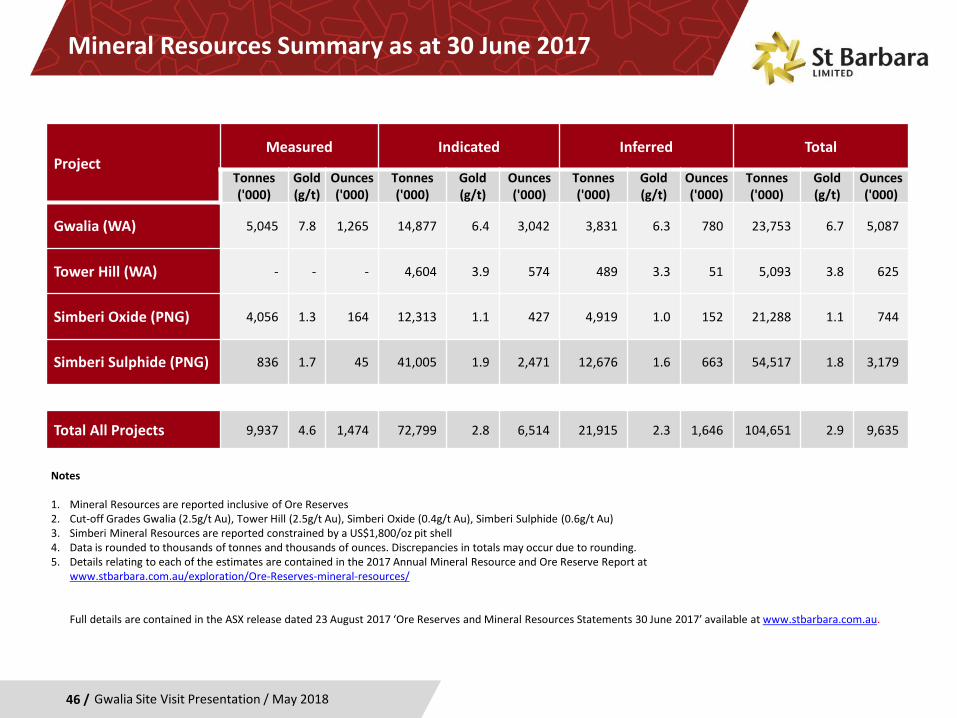
Mineral Resources Summary as at 30 June 2017
ProjectMeasured Indicated Inferred Total
Tonnes('000)
Gold (g/t)
Ounces('000)
Tonnes('000)
Gold (g/t)
Ounces('000)
Tonnes('000)
Gold (g/t)
Ounces('000)
Tonnes('000)
Gold (g/t)
Ounces('000)
Gwalia (WA) 5,045 7.8 1,265 14,877 6.4 3,042 3,831 6.3 780 23,753 6.7 5,087
Tower Hill (WA) - - - 4,604 3.9 574 489 3.3 51 5,093 3.8 625
Simberi Oxide (PNG) 4,056 1.3 164 12,313 1.1 427 4,919 1.0 152 21,288 1.1 744
Simberi Sulphide (PNG) 836 1.7 45 41,005 1.9 2,471 12,676 1.6 663 54,517 1.8 3,179
Total All Projects 9,937 4.6 1,474 72,799 2.8 6,514 21,915 2.3 1,646 104,651 2.9 9,635
Notes
1. Mineral Resources are reported inclusive of Ore Reserves2. Cut-off Grades Gwalia (2.5g/t Au), Tower Hill (2.5g/t Au), Simberi Oxide (0.4g/t Au), Simberi Sulphide (0.6g/t Au)3. Simberi Mineral Resources are reported constrained by a US$1,800/oz pit shell4. Data is rounded to thousands of tonnes and thousands of ounces. Discrepancies in totals may occur due to rounding.5. Details relating to each of the estimates are contained in the 2017 Annual Mineral Resource and Ore Reserve Report at
www.stbarbara.com.au/exploration/Ore-Reserves-mineral-resources/
Full details are contained in the ASX release dated 23 August 2017 ‘Ore Reserves and Mineral Resources Statements 30 June 2017’ available at www.stbarbara.com.au.
Gwalia Site Visit Presentation / May 2018
47 /
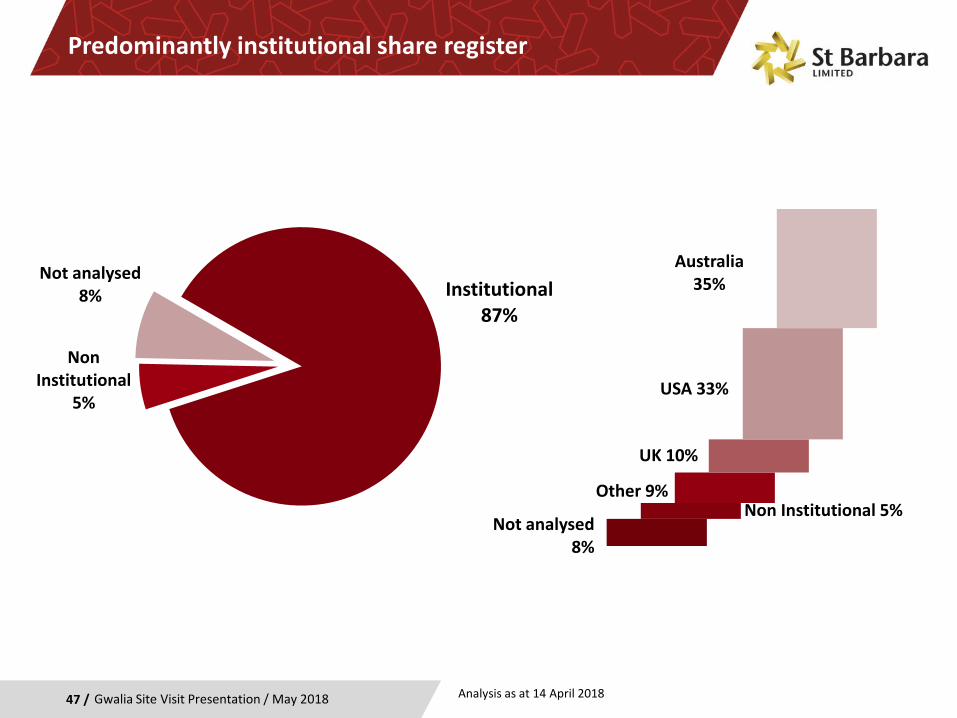
Predominantly institutional share register
Gwalia Site Visit Presentation / May 2018
Institutional87%
Non Institutional
5%
Not analysed8%
Not analysed8%
Non Institutional 5%Other 9%
UK 10%
USA 33%
Australia35%
Analysis as at 14 April 2018
48 /
Substantial shareholders and broker coverage
Gwalia Site Visit Presentation / May 2018
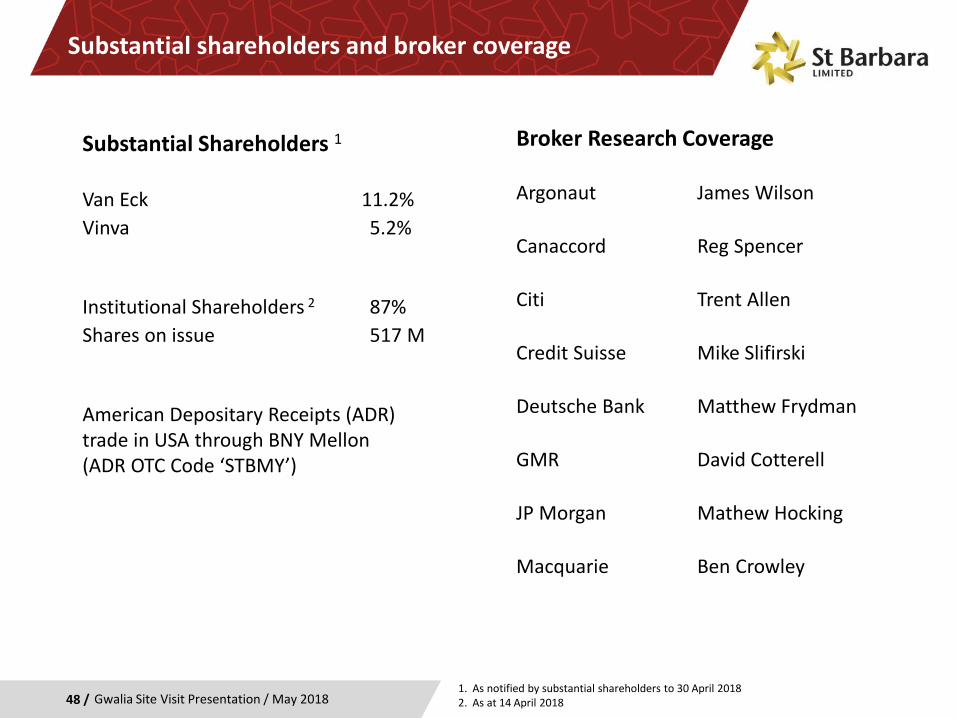
Substantial Shareholders 1
Van Eck 11.2%Vinva 5.2%
Institutional Shareholders 2 87%Shares on issue 517 M
American Depositary Receipts (ADR) trade in USA through BNY Mellon (ADR OTC Code ‘STBMY’)
Broker Research Coverage
Argonaut James Wilson
Canaccord Reg Spencer
Citi Trent Allen
Credit Suisse Mike Slifirski
Deutsche Bank Matthew Frydman
GMR David Cotterell
JP Morgan Mathew Hocking
Macquarie Ben Crowley
1. As notified by substantial shareholders to 30 April 20182. As at 14 April 2018
49 / Gwalia Site Visit Presentation / May 2018
Board of Directors
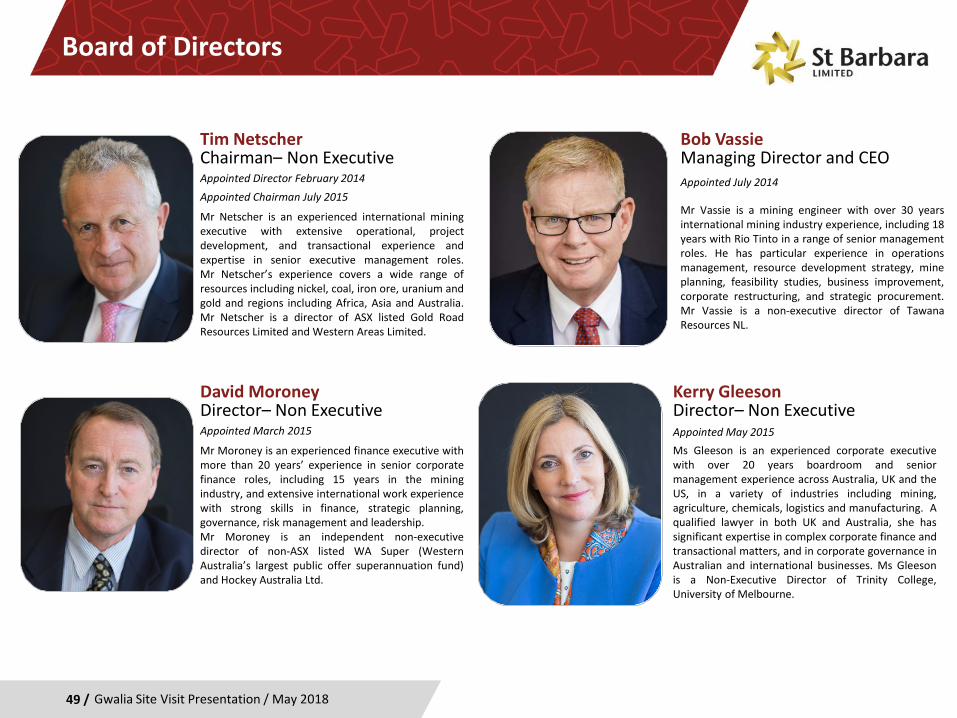
Bob VassieManaging Director and CEOAppointed July 2014
Mr Vassie is a mining engineer with over 30 yearsinternational mining industry experience, including 18years with Rio Tinto in a range of senior managementroles. He has particular experience in operationsmanagement, resource development strategy, mineplanning, feasibility studies, business improvement,corporate restructuring, and strategic procurement.Mr Vassie is a non-executive director of TawanaResources NL.
Tim NetscherChairman– Non ExecutiveAppointed Director February 2014Appointed Chairman July 2015
Mr Netscher is an experienced international miningexecutive with extensive operational, projectdevelopment, and transactional experience andexpertise in senior executive management roles.Mr Netscher’s experience covers a wide range ofresources including nickel, coal, iron ore, uranium andgold and regions including Africa, Asia and Australia.Mr Netscher is a director of ASX listed Gold RoadResources Limited and Western Areas Limited.
David MoroneyDirector– Non ExecutiveAppointed March 2015
Mr Moroney is an experienced finance executive withmore than 20 years’ experience in senior corporatefinance roles, including 15 years in the miningindustry, and extensive international work experiencewith strong skills in finance, strategic planning,governance, risk management and leadership.Mr Moroney is an independent non-executivedirector of non-ASX listed WA Super (WesternAustralia’s largest public offer superannuation fund)and Hockey Australia Ltd.
Kerry GleesonDirector– Non ExecutiveAppointed May 2015Ms Gleeson is an experienced corporate executivewith over 20 years boardroom and seniormanagement experience across Australia, UK and theUS, in a variety of industries including mining,agriculture, chemicals, logistics and manufacturing. Aqualified lawyer in both UK and Australia, she hassignificant expertise in complex corporate finance andtransactional matters, and in corporate governance inAustralian and international businesses. Ms Gleesonis a Non-Executive Director of Trinity College,University of Melbourne.
50 / Gwalia Site Visit Presentation / May 2018
GwaliaA rich history with a bright future
Executive Leadership Team
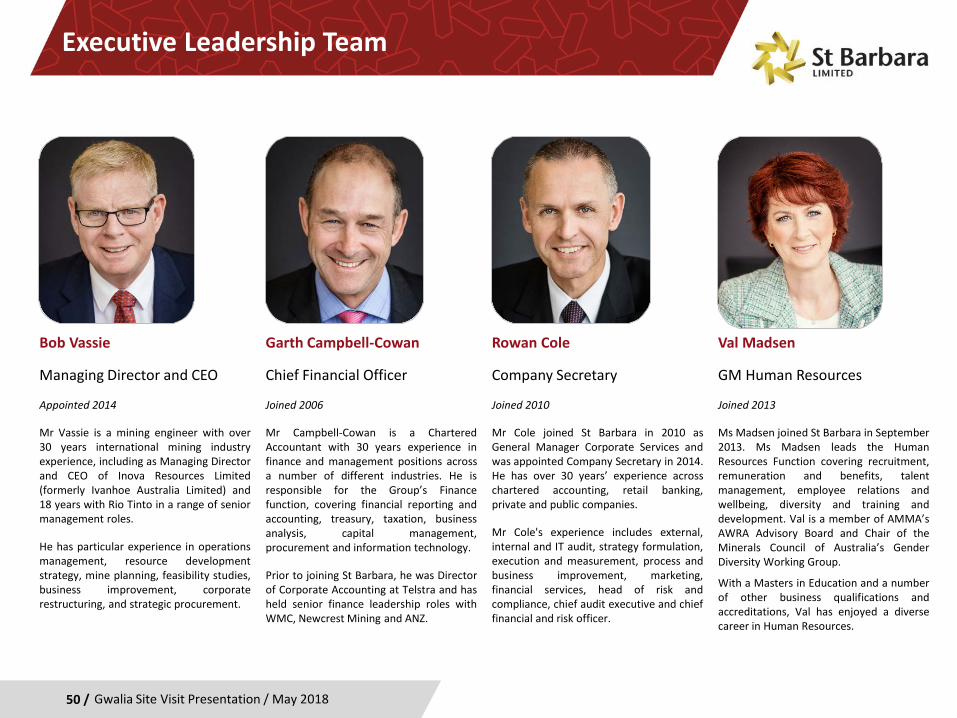
Garth Campbell-Cowan
Chief Financial Officer
Joined 2006
Mr Campbell-Cowan is a CharteredAccountant with 30 years experience infinance and management positions acrossa number of different industries. He isresponsible for the Group’s Financefunction, covering financial reporting andaccounting, treasury, taxation, businessanalysis, capital management,procurement and information technology.
Prior to joining St Barbara, he was Directorof Corporate Accounting at Telstra and hasheld senior finance leadership roles withWMC, Newcrest Mining and ANZ.
Bob Vassie
Managing Director and CEO
Appointed 2014
Mr Vassie is a mining engineer with over30 years international mining industryexperience, including as Managing Directorand CEO of Inova Resources Limited(formerly Ivanhoe Australia Limited) and18 years with Rio Tinto in a range of seniormanagement roles.
He has particular experience in operationsmanagement, resource developmentstrategy, mine planning, feasibility studies,business improvement, corporaterestructuring, and strategic procurement.
Rowan Cole
Company Secretary
Joined 2010
Mr Cole joined St Barbara in 2010 asGeneral Manager Corporate Services andwas appointed Company Secretary in 2014.He has over 30 years’ experience acrosschartered accounting, retail banking,private and public companies.
Mr Cole's experience includes external,internal and IT audit, strategy formulation,execution and measurement, process andbusiness improvement, marketing,financial services, head of risk andcompliance, chief audit executive and chieffinancial and risk officer.
Val Madsen
GM Human Resources
Joined 2013
Ms Madsen joined St Barbara in September2013. Ms Madsen leads the HumanResources Function covering recruitment,remuneration and benefits, talentmanagement, employee relations andwellbeing, diversity and training anddevelopment. Val is a member of AMMA’sAWRA Advisory Board and Chair of theMinerals Council of Australia’s GenderDiversity Working Group.
With a Masters in Education and a numberof other business qualifications andaccreditations, Val has enjoyed a diversecareer in Human Resources.
Competent Persons Statement
Exploration ResultsThe information in this presentation that relates to Exploration Results for Simberi and Pinjin is based on information compiled by Dr Roger Mustard,who is a Member of The Australasian Institute of Mining and Metallurgy. Dr Mustard is a full-time employee of St Barbara and has sufficient experiencerelevant to the style of mineralisation and type of deposit under consideration and to the activity which he is undertaking to qualify as a CompetentPerson as defined in the 2012 Edition of the ‘Australasian Code for Reporting of Exploration Results, Mineral Resources and Ore Reserves’. Dr Mustardconsents to the inclusion in the report of the matters based on his information in the form and context in which it appears.
The information in this presentation that relates to Exploration Results for Gwalia and the Leonora region is based on information compiled by MrRobert Love, who is a Fellow of The Australasian Institute of Mining and Metallurgy. Mr Love is a full-time employee of St Barbara and has sufficientexperience relevant to the style of mineralisation and type of deposit under consideration and to the activity which he is undertaking to qualify as aCompetent Person as defined in the 2012 Edition of the ‘Australasian Code for Reporting of Exploration Results, Mineral Resources and OreReserves’. Mr Love consents to the inclusion in the report of the matters based on his information in the form and context in which it appears.
Mineral Resource and Ore Reserve EstimatesThe information in this presentation that relates to Mineral Resources or Ore Reserves is extracted from the report titled ‘Ore Reserves and MineralResources Statements 30 June 2017’ released to the Australian Securities Exchange (ASX) on 23 August 2017 and available to view atwww.stbarbara.com.au and for which Competent Persons’ consents were obtained. Each Competent Person’s consent remain in place for subsequentreleases by the Company of the same information in the same form and context, until the consent is withdrawn or replaced by a subsequent report andaccompanying consent.
The Company confirms that it is not aware of any new information or data that materially affects the information included in the original ASXannouncement released on 23 August 2017 and, in the case of estimates of Mineral Resources or Ore Reserves, that all material assumptions andtechnical parameters underpinning the estimates in the original ASX announcement continue to apply and have not materially changed. The Companyconfirms that the form and context in which the Competent Person's findings are presented have not been materially modified from the original ASXannouncement.
Competent Person Tim Richards is entitled to participate in St Barbara’s long term incentive plan, details of which are included in the 2017 Directors’and Financial Report released to the ASX on 23 August 2017.
Full details are contained in the ASX release dated 23 August 2017 ‘Ore Reserves and Mineral Resources Statements 30 June 2017’ availableat www.stbarbara.com.au.
51 / Gwalia Site Visit Presentation / May 2018
Gwalia Site Visit Presentation / May 201852 /
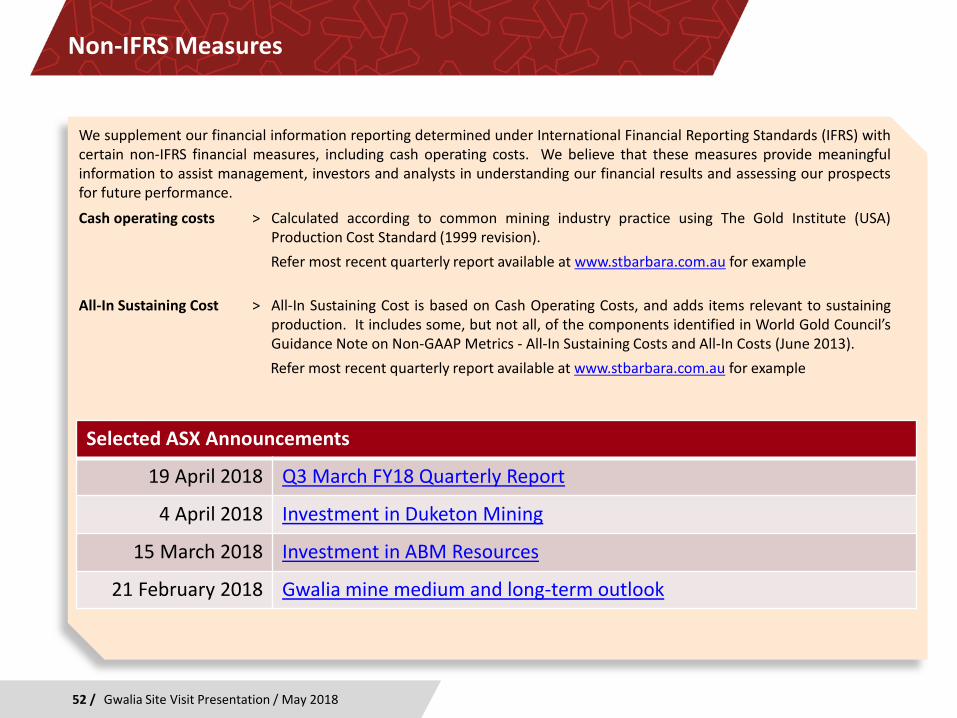
Non-IFRS Measures
We supplement our financial information reporting determined under International Financial Reporting Standards (IFRS) withcertain non-IFRS financial measures, including cash operating costs. We believe that these measures provide meaningfulinformation to assist management, investors and analysts in understanding our financial results and assessing our prospectsfor future performance.
Cash operating costs ˃ Calculated according to common mining industry practice using The Gold Institute (USA)Production Cost Standard (1999 revision).Refer most recent quarterly report available at www.stbarbara.com.au for example
All-In Sustaining Cost ˃ All-In Sustaining Cost is based on Cash Operating Costs, and adds items relevant to sustainingproduction. It includes some, but not all, of the components identified in World Gold Council’sGuidance Note on Non-GAAP Metrics - All-In Sustaining Costs and All-In Costs (June 2013).Refer most recent quarterly report available at www.stbarbara.com.au for example
Selected ASX Announcements
19 April 2018 Q3 March FY18 Quarterly Report
4 April 2018 Investment in Duketon Mining
15 March 2018 Investment in ABM Resources
21 February 2018 Gwalia mine medium and long-term outlook
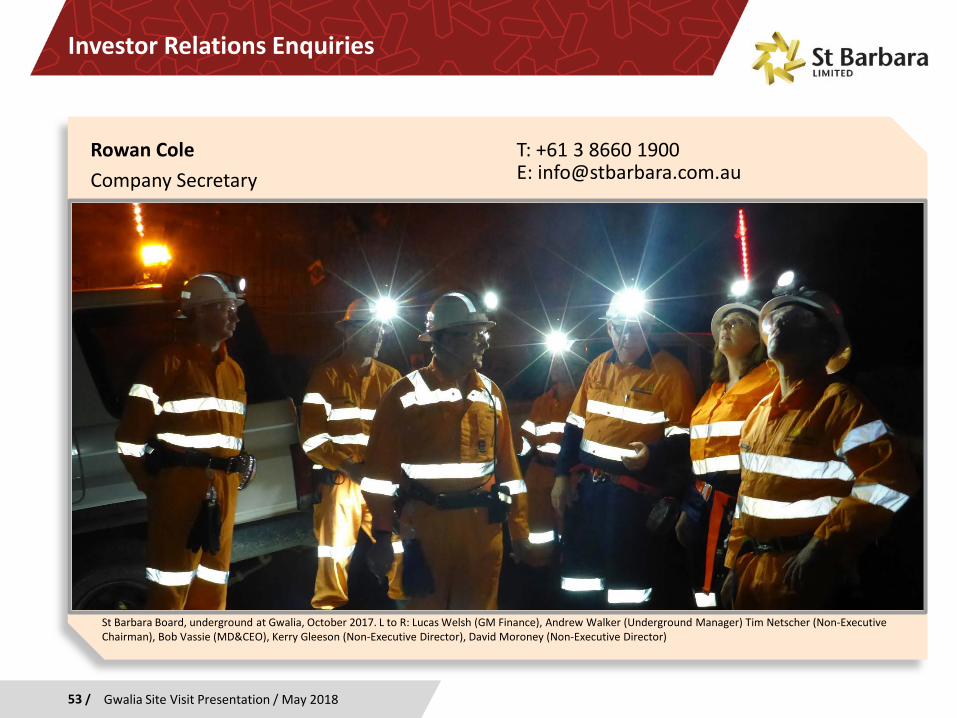
Investor Relations Enquiries
Rowan ColeCompany Secretary
T: +61 3 8660 1900E: [email protected]
53 / Gwalia Site Visit Presentation / May 2018
St Barbara Board, underground at Gwalia, October 2017. L to R: Lucas Welsh (GM Finance), Andrew Walker (Underground Manager) Tim Netscher (Non-Executive Chairman), Bob Vassie (MD&CEO), Kerry Gleeson (Non-Executive Director), David Moroney (Non-Executive Director)