Embed Size (px)
Citation preview
HEALTH NUTRITION MATERIALS
ROYAL DSM
Presentation to investors9M 2017 results

Safe harbor statement
Page 1
▪ This presentation may contain forward-looking statements with respect to DSM’s future (financial) performance and
position. Such statements are based on current expectations, estimates and projections of DSM and information
currently available to the company. DSM cautions readers that such statements involve certain risks and uncertainties
that are difficult to predict and therefore it should be understood that many factors can cause actual performance and
position to differ materially from these statements. DSM has no obligation to update the statements contained in this
presentation, unless required by law.
▪ More details on DSM’s 9M 2017 performance can be found in the 9M 2017 results press release, published together with
this presentation. A more comprehensive discussion of the risk factors affecting DSM’s business can be found in the
company’s latest Annual Report, which can be found on the company's corporate website, www.dsm.com

Highlights YTD 2017
Page 2
▪ Strong performance in Q3, contributing to very good first nine months
▪ Sales up 9% to €6,456m, with 8% organic growth
▪ Adjusted EBITDA up 15% to €1,086m, driven by both Nutrition and Materials
▪ ROCE up 170 bps to 12.3%
▪ Adjusted Net profit up 29% to €504m
▪ Total Net profit of €1,603m, including gain on Patheon disposal of €1,250m
▪ Outlook 2017 unchanged: DSM expects to deliver full-year 2017 results above the targets set out in its Strategy 2018,
with an EBITDA growth for the year slightly up from high single-digit to double digit, and with a ROCE increase from
double digit basis points to over 100 basis points

Highlights Q3 2017
Page 3
▪ DSM reports another strong quarter in Q3
▪ Sales up 7% to €2,136m, with 10% organic growth
▪ Adjusted EBITDA up 13% to €365m
▪ Nutrition: 8% organic sales growth; Adjusted EBITDA up 12%
▪ Materials: 9% volume growth; Adjusted EBITDA up 8%
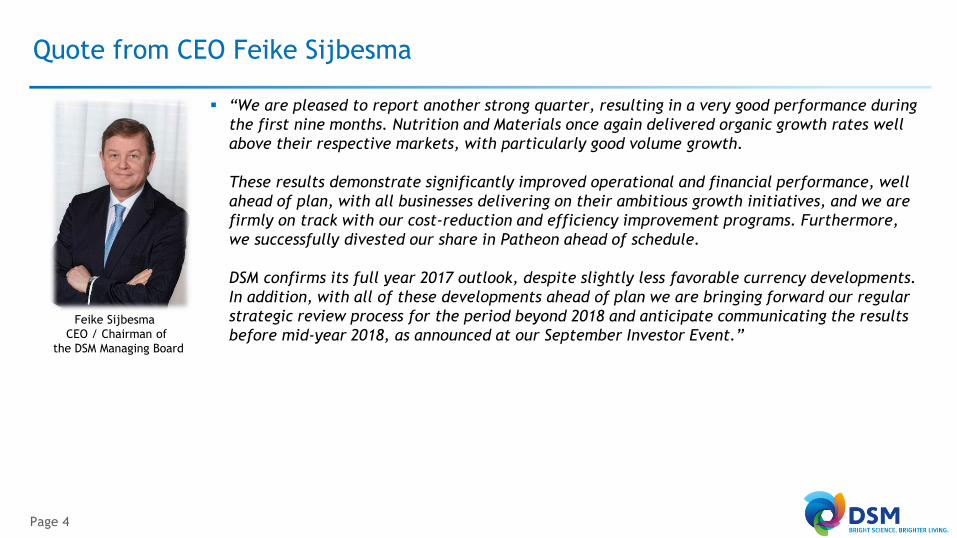
Quote from CEO Feike Sijbesma
Page 4
▪ “We are pleased to report another strong quarter, resulting in a very good performance during
the first nine months. Nutrition and Materials once again delivered organic growth rates well
above their respective markets, with particularly good volume growth.
These results demonstrate significantly improved operational and financial performance, well
ahead of plan, with all businesses delivering on their ambitious growth initiatives, and we are
firmly on track with our cost-reduction and efficiency improvement programs. Furthermore,
we successfully divested our share in Patheon ahead of schedule.
DSM confirms its full year 2017 outlook, despite slightly less favorable currency developments.
In addition, with all of these developments ahead of plan we are bringing forward our regular
strategic review process for the period beyond 2018 and anticipate communicating the results
before mid-year 2018, as announced at our September Investor Event.”Feike Sijbesma
CEO / Chairman of
the DSM Managing Board

Group | Key financials
Page 5
in € million 2017 2016 % Change Q3 2017 Q3 2016 % Change
Sales 6,456 5,905 9% 2,136 1,998 7%
Adjusted EBITDA (cont.operations) 1,086 947 15% 365 323 13%
Adjusted EBITDA margin 16.8% 16.0% 17.1% 16.2%
ROCE (%) 12.3% 10.6%
Adjusted net profit, cont. oper. 504 390 29% 166 146 14%
Net profit - Total DSM 1,603 542 196% 1,291 322 301%
Adjusted net EPS 2.81 2.17 29% 0.91 0.81 12%
Net EPS - Total DSM 9.09 3.04 7.34 1.82
Cash Flow 619 644 -4% 290 325 -11%
January - September
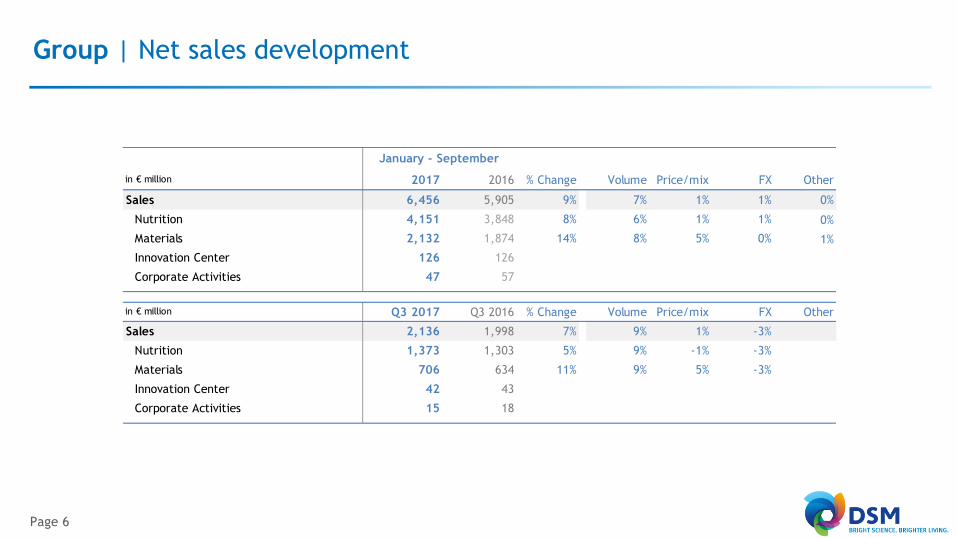
Group | Net sales development
Page 6
in € million 2017 2016 % Change Volume Price/mix FX Other
Sales 6,456 5,905 9% 7% 1% 1% 0%
Nutrition 4,151 3,848 8% 6% 1% 1% 0%
Materials 2,132 1,874 14% 8% 5% 0% 1%
Innovation Center 126 126
Corporate Activities 47 57
in € million Q3 2017 Q3 2016 % Change Volume Price/mix FX Other
Sales 2,136 1,998 7% 9% 1% -3%
Nutrition 1,373 1,303 5% 9% -1% -3%
Materials 706 634 11% 9% 5% -3%
Innovation Center 42 43
Corporate Activities 15 18
January - September

Group | EBITDA development
Page 7
in € million 2017 2016 % Change Q3 2017 Q3 2016 % Change
Adjusted EBITDA (cont.operations) 1,086 947 15% 365 323 13%
Nutrition 786 693 13% 258 231 12%
Materials 369 330 12% 128 118 8%
Innovation Center 5 2 4 1
Corporate Activities -74 -78 -25 -27
January - September

Nutrition | Sales overview
Page 8
Sales bridge | Q3 2016 to Q3 2017Sales bridge | 9M 2016 to 9M 2017
▪ Nine months 2017 sales: Nutrition performed strongly as its growth initiatives led to organic growth rates in all its businesses outpacing their
respective markets
– Animal Nutrition delivered strong volume growth
– Human Nutrition and Food Specialties continued to deliver good volume growth, despite soft conditions in some end-market segments
▪ Q3 2017 sales: 8% organic with 9% higher volumes
– Exceptionally strong growth in Animal Nutrition
– Good growth in Human Nutrition
ytd Q3
2017
4,151
Other
0%
FX
1%
Price/mix
1%
Volume
6%
ytd Q3
2016
3,848
Q3 2017
1,373
OtherFX
-3%
Price/mix
-1%
Volume
9%
Q3 2016
1,303
0%

Nutrition | Key financials
Page 9
▪ Nine months 2017 Adjusted EBITDA increased by 13%
– Mainly driven by volume growth and the contribution of the efficiency and cost improvement programs
– Currency and price/mix effects made a small contribution
▪ Q3 EBITDA was up 12%
– Driven by strong organic growth and the contribution of the improvement programs
– Currencies had a small negative effect
2017 2016 % Change Q3 2017 Q3 2016 % Change
4,151 3,848 8% 1,373 1,303 5%
786 693 13% 258 231 12%
18.9% 18.0% 18.8% 17.7%
575 485 19% 192 159 21%
5,292 5,384
Average Capital Employed 5,454 5,334
14.1% 12.1%
1,472 1,492
27.3% 28.2%
Sales
Adjusted EBITDA
Adjusted EBITDA margin (%)
Adjusted EBIT
Average Total Working Capital as % of Sales 1
January - September
in € million
Capital Employed
ROCE (%)
Total Working Capital
1 Annualized last quarter sales

Animal Nutrition & Health | Sales overview
Page 10
Sales bridge | Q3 2016 to Q3 2017Sales bridge | 9M 2016 to 9M 2017
▪ Nine months 2017 sales: 8% organic growth fully driven by volumes, significantly outperforming the market
– Market conditions were favorable year-to-date, except for Latin America where domestic demand was impacted by weak economic
conditions and exacerbated in Q2 due to the ‘meat scandal’ in Brazil, severely impacting beef exports
– Overall prices were flat while for some vitamins a positive price effect in the first half of the year was offset by a negative price effect in Q3
▪ In Q3 2017: organic growth exceptionally strong at 10%
– 14% volume growth exacerbated by:
• a rapid recovery of beef exports in Brazil, especially in September
• positive timing of orders
• easy comparison with Q3 last year
– Prices had a 4% negative effect which was largely due to lower comparable prices for some of the vitamins versus 2016, when these prices
spiked in the second half of the year
ytd Q3
2017
1,921
Other
0%
FX
2%
Price/mix
0%
Volume
8%
ytd Q3
2016
1,753
Q3
2017
658
Other
0%
FX
-3%
Price/mix
-4%
Volume
14%
Q3
2016
615
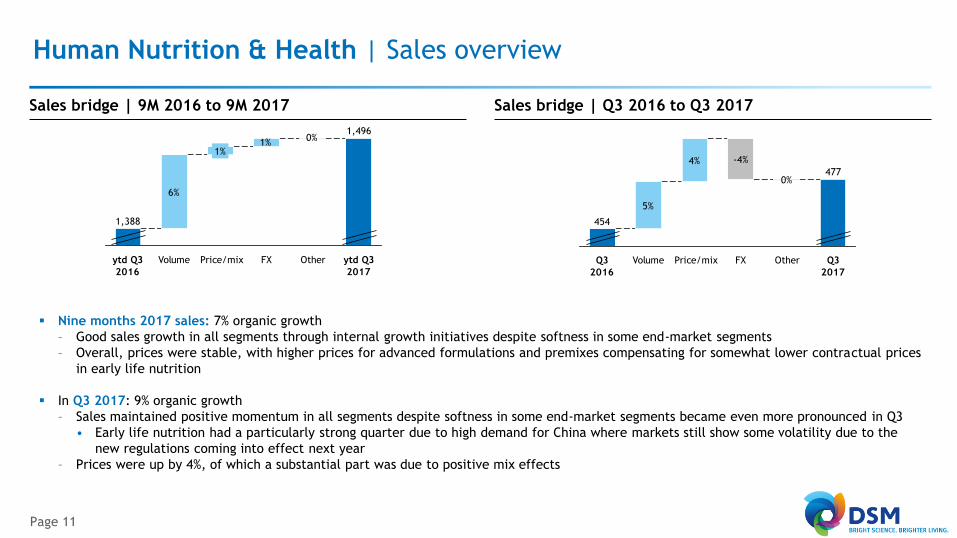
Human Nutrition & Health | Sales overview
Page 11
Sales bridge | Q3 2016 to Q3 2017Sales bridge | 9M 2016 to 9M 2017
▪ Nine months 2017 sales: 7% organic growth
– Good sales growth in all segments through internal growth initiatives despite softness in some end-market segments
– Overall, prices were stable, with higher prices for advanced formulations and premixes compensating for somewhat lower contractual prices
in early life nutrition
▪ In Q3 2017: 9% organic growth
– Sales maintained positive momentum in all segments despite softness in some end-market segments became even more pronounced in Q3
• Early life nutrition had a particularly strong quarter due to high demand for China where markets still show some volatility due to the
new regulations coming into effect next year
– Prices were up by 4%, of which a substantial part was due to positive mix effects
ytd Q3
2017
1,496
OtherFXPrice/mixVolumeytd Q3
2016
1,388
6%
1%1%
0%
4% -4%
0%
FXPrice/mixVolumeQ3
2016
454
Q3
2017
477
Other
5%

Materials | Sales overview
Page 12
Sales bridge | Q3 2016 to Q3 2017Sales bridge | 9M 2016 to 9M 2017
▪ Nine months 2017 sales
– Volumes up 8% with strong growth in specialties
• DSM Engineering Plastics: solid growth overall with good growth in the higher margin specialties for automotive and E&E
• DSM Dyneema: continued strong growth especially in personal protection solutions
• DSM Resins & Functional Materials: strong growth in all segments driven by sustainability-driven substitution and improved conditions in
Building & Construction markets
– The 5% price effect fully reflects increased input costs
▪ Q3 2017 sales: 9% volume growth
– All three businesses showed good growth and performed well
5%
8%
ytd Q3
2017
2,132
OtherFX
0%
Price/mixVolumeytd Q3
2016
1,874
1%
5%-3%
FXPrice/mixVolumeQ3
2016
634
9%
Q3
2017
706
Other
0%

Materials | Key financials
Page 13
▪ Nine months 2017 Adjusted EBITDA: increased by 12%, driven by higher volumes and the group-wide cost savings and efficiency improvement
program
– The Adjusted EBITDA margin was strong at 17.3%, versus 17.6% in the same period last year when DSM still fully benefited from lower input
costs
▪ Q3 2017 Adjusted EBITDA: up 8%
– The Adjusted EBITDA margin was 18.1%, versus 18.6% in Q3 2016, despite higher raw materials costs particularly in the Resins business which
was confronted with various disruptions in the supply of key intermediates
• Robust performance demonstrates the improvements achieved in the quality of returns in the Materials businesses over recent years
2017 2016 % Change Q3 2017 Q3 2016 % Change
2,132 1,874 14% 706 634 11%
369 330 12% 128 118 8%
17.3% 17.6% 18.1% 18.6%
275 234 18% 98 86 14%
1,811 1,798
Average Capital Employed 1,814 1,763
20.2% 17.7%
368 333
12.3% 12.5%
January - September
Adjusted EBIT
Total Working Capital
1 Annualized last quarter sales
Sales
Adjusted EBITDA margin (%)
Capital Employed
ROCE (%)
Average Total Working Capital as % of Sales 1
Adjusted EBITDA
in € million

Innovation | Key financials
Page 14
▪ Nine months 2017 sales showed strong growth in DSM Advanced Solar. DSM Biomedical is also performing well again, with strong underlying
growth largely offsetting the gradual discontinuation of a large contract
▪ Nine months 2017 Adjusted EBITDA includes a one-time positive amount in Q3 2017 related to the release of a liability following the decision
to stop a development project, while the Adjusted EBIT includes an impairment loss on the related assets
in € million 2017 2016 % Change Q3 2017 Q3 2016 % Change
Sales 126 126 0% 42 43 -2%
Adjusted EBITDA 5 2 4 1
Adjusted EBIT -29 -15 -17 -5
Capital Employed 552 553
January - September

Corporate Activities | Key financials
Page 15
▪ Nine months 2017 Adjusted EBITDA slightly improved compared to the same period last year as a result of the contribution of the cost savings
programs
in € million 2017 2016 Q3 2017 Q3 2016
Sales 47 57 15 18
Adjusted EBITDA -74 -78 -25 -27
Adjusted EBIT -104 -103 -34 -35
January - September
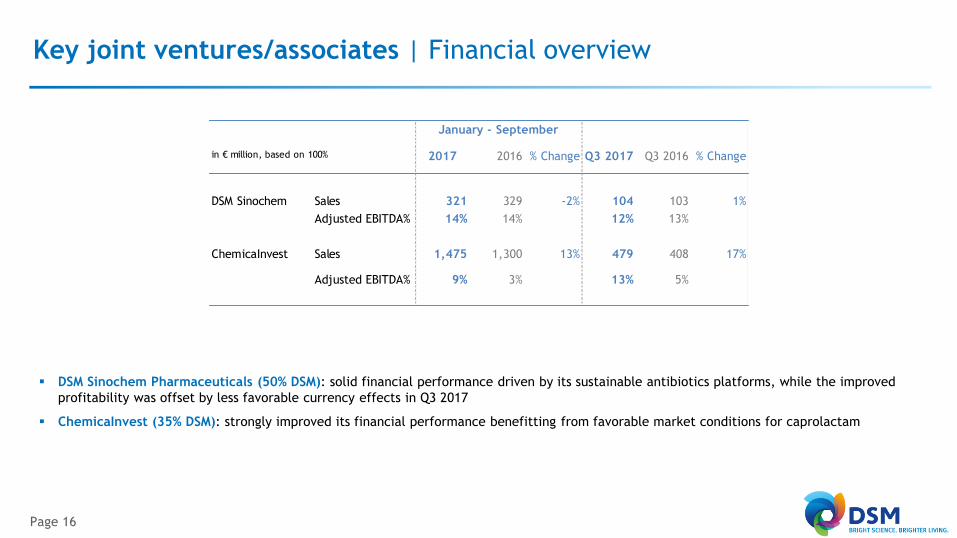
Key joint ventures/associates | Financial overview
Page 16
▪ DSM Sinochem Pharmaceuticals (50% DSM): solid financial performance driven by its sustainable antibiotics platforms, while the improved
profitability was offset by less favorable currency effects in Q3 2017
▪ ChemicaInvest (35% DSM): strongly improved its financial performance benefitting from favorable market conditions for caprolactam
2017 2016 % Change Q3 2017 Q3 2016 % Change
DSM Sinochem Sales 321 329 -2% 104 103 1%
Adjusted EBITDA% 14% 14% 12% 13%
ChemicaInvest Sales 1,475 1,300 13% 479 408 17%
Adjusted EBITDA% 9% 3% 13% 5%
January - September
in € million, based on 100%
Joint ventures/associates | Net result contribution
Page 17
1. DSM’s share in Patheon was 49% in H1 2016 and up until 15 May 2017 33.5%. DSM completed the divestment of its share in Patheon on 29 August 2017
2. The positive net result of the first nine months of 2017 was not recognized, as the total equity value of ChemicaInvest year-to-date Q3 2017 is below zero. DSM has no obligation to fund beyond its net interest
2017 2016 Q3 2017 Q3 2016
DSM Sinochem (50%) 4 5 0 1
Patheon1 7 -5 0 5
ChemicaInvest (35%) 2 0 -9 0 1
Other associates / joint ventures -18 -13 -4 -4
Total before APMs -7 -22 -4 3
APM adjustments 1,152 217 1,150 228
1,145 195 1,146 231
January - September
Share of the profit of
associates/joint ventures
in € million
▪ The following APM adjustments were included in the Q3 2017 result of joint ventures and associates:
– On 29 August 2017, the shares in Patheon N.V. were sold to Thermo Fisher Scientific Inc. resulting in a book profit of €1,250 million
– Certain impairments related to the POET joint venture (€65 million) as well as other various impairments on assets of associates (€35
million)

Cash flow and Working Capital | Overview
Page 18
▪ Cash flow from operating activities amounted to €619 million in the first nine months of 2017, which was below the comparative period in
2016 due to higher working capital reflecting the higher levels of sales
▪ Total Working Capital amounted to €1,635 million at the end of Q3 2017 compared to €1,528 million at the end of Q3 2016 mainly due to a
decrease in non-operating liabilities
– Working capital as a percentage of sales amounted to 19.1%, in line with Q3 2016
Cash Flow, Capital Expenditures and Financing Average Working Capital %
18.6%
28.2%
12.5%
18.6%
27.3%
12.3%
0%
10%
20%
30%
40%
Total DSM Nutrition Materials
9M 2016 9M 2017
in € million 2017 2016 Q3 2017 Q3 2016
Cash from Operating Activities 619 644 290 325
Total Working Capital 1,635 1,528
Total Working Capital as % of Sales 19.1% 19.1%
Capital Expenditure (cash, net of customer funding) 384 305 134 128
Net Debt (end of period) 703 2,054
January - September

Net debt and ROCE | Overview
Page 19
▪ Net debt €703 million compared to €2,054 million end of September 2016
– The decrease of €1,351 million was mainly due to the proceeds from the sale of Patheon shares of in total of
€1,477 million in Q3 2017, with an additional €58 million hedge income to be received in Q4 2017
▪ ROCE up 170bps to 12.3% (versus 10.6% in 9M 2016)
Net debt ROCE
10.6%12.1%
17.7%
12.3%14.1%
20.2%
0%
5%
10%
15%
20%
25%
Total DSM Nutrition Materials
9M 2016 9M 2017
2,054
703
0
1,000
2,000
3,000
9M 2016 9M 2017

CEO/CFO Keynote presentationDSM Investor Event 2017 | 25 September 2017

DSM created a launch pad for growth in the period up to Strategy 2018
Page 21
▪ Implemented important transformation steps
– from Bulk Chemicals to specialty Nutrition and (bio-based) Materials
▪ Business portfolio streamlined and simplified
▪ Created good platform for growth
– Nutrition: unique, global and broad portfolio in food/feed nutritional
ingredients with deep solution offering capabilities
– Materials: ‘silent’ transformation to more attractive, high-quality
specialty materials portfolio with higher margins
▪ More global, innovative and sustainable company

Focus areas identified to improve financial performance
Page 22
▪ Recovery of Nutrition’s financial
performance after Vitamin E and CHF
impact
▪ Successfully executed acquisition
strategy at attractive multiples
(avg. ~8x EV/EBITDA)
▪ Further integration of acquisitions
needed to capture full potential
▪ Return to above market growth rates
Food enzymes &
oilseed processing
Cultures &
enzymes
Market DSM Market DSM Market DSM Market DSM Market Market DSM Market DSM Market DSMDSM
EBITDA 2010 PriceVitamin E
FX Acquisitions Growth/synergiesfrom acquisitions
Growth frompre-acquisition
portfolio
EBITDA 2015
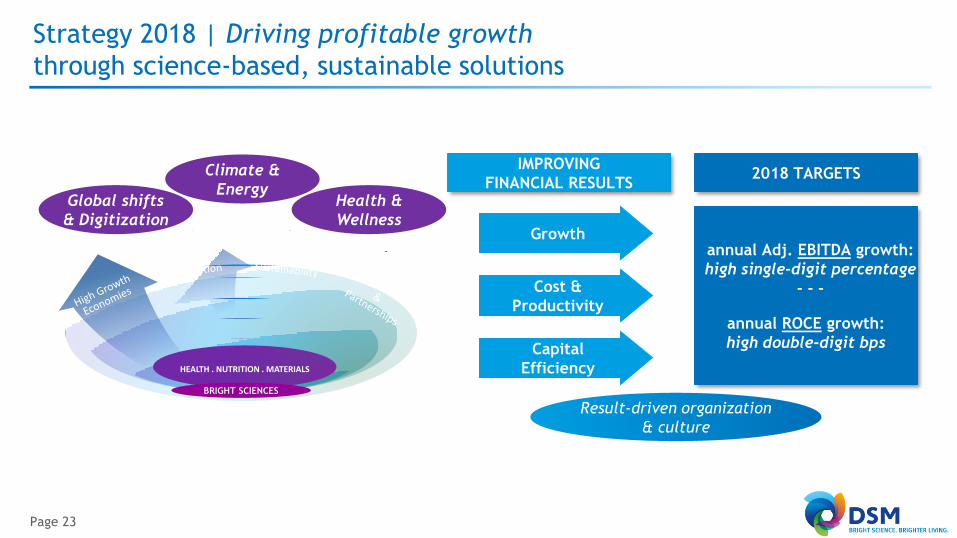
Strategy 2018 | Driving profitable growth
through science-based, sustainable solutions
Page 23
HEALTH . NUTRITION . MATERIALS
IMPROVING
FINANCIAL RESULTS
Growth
Cost &
Productivity
Capital
Efficiency
2018 TARGETS
annual Adj. EBITDA growth:
high single-digit percentage
- - -
annual ROCE growth:
high double-digit bps
Global shifts
& Digitization
Climate &
EnergyHealth &
Wellness
Result-driven organization
& culture
BRIGHT SCIENCES

Strategy 2018 | Initiatives to deliver improved financial results
Page 24
▪ Global organizational and operational adjustments
▪ Outpace market growth through growth initiatives and innovation
▪ Step up in sustainability aspirations
▪ €250-300m cost reduction & efficiency improvements
▪ Consistent improvements in capital efficiency
▪ Extract value from Pharma and Bulk Chemicals JVs
1
2
3
4
5
6

▪ Global organizational and operational adjustments
▪ Outpace market growth through growth initiatives and innovation
▪ Step up in sustainability aspirations
▪ €250-300m cost reduction & efficiency improvements
▪ Consistent improvements in capital efficiency
▪ Extract value from Pharma and Bulk Chemicals JVs
Strategy 2018 | Initiatives to deliver improved financial results
Page 25
1
2
3
4
5
6
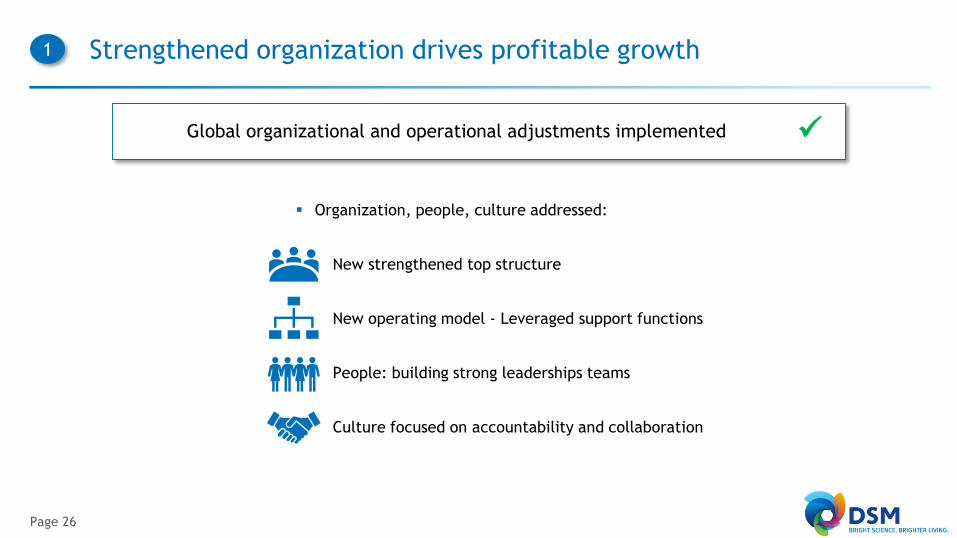
Strengthened organization drives profitable growth
Page 26
1
Global organizational and operational adjustments implemented ✓
▪ Organization, people, culture addressed:
– New strengthened top structure
– New operating model - Leveraged support functions
– People: building strong leaderships teams
– Culture focused on accountability and collaboration

DSM is outpacing market growth
Page 27
2
All businesses are delivering on the growth initiatives ✓
Materials volume growthAnimal Nutrition organic growth Human Nutrition organic growth
1%
5%6%
0%
2%
4%
6%
8%
10%
2011-15CAGR
Market2016-18
2016 H1 2017
2%
4%
8%
0%
1%
2%
3%
4%
5%
6%
7%
8%
9%
10%
2011-15CAGR
Market2016-18
2016 H1 2017
5%
5%6%
0%
2%
4%
6%
8%
10%
2011-15CAGR
Market2016-18
2016 H1 2017
2-3% 2-3% ~3%

Maintained well balanced growth drivers
Page 28
1. Sales from products and applications introduced within the last 5 years
2
44% ~45% 44%
0%
5%
10%
15%
20%
25%
30%
35%
40%
45%
50%
2015 2018
aspiration
2016 2017E
% sales from Innovation% sales to High Growth Economies
24%20% 22%
0%
5%
10%
15%
20%
25%
30%
2015 2018
aspiration
2016 2017E

Innovation Center | Focused platform with deep value
Page 29
2
▪ Adjusted EBITDA contribution
of the Emerging Business Areas
– €30m in 2018
▪ Cost of global, company-wide
innovation support
– ~€20m EBITDA/year
€m
Financial performance
-30
-25
-20
-15
-10
-5
0
5
10
2015 2016 2017
~5~15
0
10
20
30
-20 -18
-50
-40
-30
-20
-10
0
1Innovation
Center
-
EBITDA
Emerging
Business
Areas
-
EBITDA
Innovation
support
-
Costs
-9

Emerging Business Areas provide long-term growth platforms
Page 30
2
Biomedical Advanced SolarBio-based Products & Services
▪ Good progress made by POET-
DSM Advanced Biofuels after a
period of significant delays
– New pre-treatment developed
and installed
▪ New enzymes from DSM improved
effectiveness and efficiency
– Construction of on-site
enzyme manufacturing facility
started
▪ Good growth in anti-reflective
coatings
▪ Recently expanded portfolio with
(sustainable) backsheets via
Sunshine technology acquisition
▪ Kensey Nash acquisition
successful; steady progress
despite market setbacks
▪ Higher volumes esp. in high
growth segments (cardiology,
ophthalmics, orthopedics)

▪ GHG
efficiency
improvements
45% by 2025
– 27%
65%
▪ Energy
efficiency
improvements
>10% (2016-
2025)
– 5%
DSM has stepped up its sustainability aspirations1
Creating value for all stakeholders
Page 31
1. Please see DSM’s Integrated Annual Report 2016 for definitions and additional information
▪ 50% purchased
from
renewable
sources by
2025
– 19%
▪ Employee
engagement
favorable
score 75% by
2020
– 71%
▪ Safety:
Frequency
Recordable
Index of 25%
by 2020
– 35%
▪ Leading in
reporting
benchmarks
– DJSI Gold
Class
– Leader in
Sustainalytics
65%
▪ Brighter living
solutions 65%
of DSM
products by
2020
– 63%
3
H1 2017

Sustainability aspirations are well aligned with the
Sustainable Development Goals1
Page 32
1. Please see DSM’s Integrated Annual Report 2016 for definitions and additional information
3

Sustainability focus drives innovative growth
and positively impacts society
Page 33
DSM’s sustainable
solutions are ideally
positioned to
continue to profit
from these trends
Sustainable farming
Healthier, more
nutritious foods
Nutrition security/
Lower food-waste
Low-carbon solutions
Circular, low-carbon
economy
Bio-based chemicals
3

DSM is recognized for ‘doing well by doing good’
Page 34
3
▪ Named #2 on Fortune Magazine’s Change the World list
▪ Leader Dow Jones Sustainability Index and Sustainalytics

Strategy 2018 | Identified initiatives to deliver improved financial results
Page 35
▪ Global organizational and operational adjustments
▪ Outpace market growth through growth initiatives and innovation
▪ Step up in sustainability aspirations
▪ €250-300m cost reduction & efficiency improvements
▪ Consistent improvements in capital efficiency
▪ Extract value from Pharma and Bulk Chemicals JVs
1
2
3
4
5
6

Cost reduction and efficiency improvement programs
rigorously executed
Page 36
1. Vs. 2014 baseline
2. Vs. 2015 baseline
€250-300m cost reduction & efficiency improvements fully on track ✓
4
▪ Support functions & services program
near finalization
▪ Nutrition-specific Improvement Program
actions on schedule, financial benefits
gradually flowing in
➢ €250m minimal savings locked-in
Actions Cost savings
Total €250-300m by 2018
DSM-wide
support
functions
€125-150m1
(by end 2017)
Nutrition
Program
€130-150m2
(by 2018)
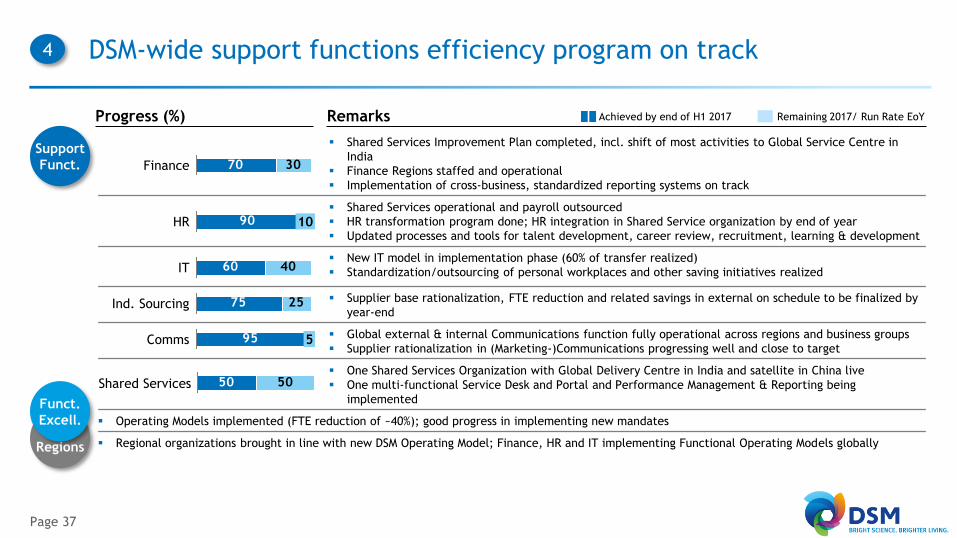
DSM-wide support functions efficiency program on track
Page 37
Support
Funct.
Regions
Funct.
Excell.
▪ Shared Services Improvement Plan completed, incl. shift of most activities to Global Service Centre in
India
▪ Finance Regions staffed and operational
▪ Implementation of cross-business, standardized reporting systems on track
▪ Shared Services operational and payroll outsourced
▪ HR transformation program done; HR integration in Shared Service organization by end of year
▪ Updated processes and tools for talent development, career review, recruitment, learning & development
▪ New IT model in implementation phase (60% of transfer realized)
▪ Standardization/outsourcing of personal workplaces and other saving initiatives realized
▪ Supplier base rationalization, FTE reduction and related savings in external on schedule to be finalized by
year-end
▪ Global external & internal Communications function fully operational across regions and business groups
▪ Supplier rationalization in (Marketing-)Communications progressing well and close to target
▪ One Shared Services Organization with Global Delivery Centre in India and satellite in China live
▪ One multi-functional Service Desk and Portal and Performance Management & Reporting being
implemented
▪ Operating Models implemented (FTE reduction of ~40%); good progress in implementing new mandates
▪ Regional organizations brought in line with new DSM Operating Model; Finance, HR and IT implementing Functional Operating Models globally
70 30Finance
90HR 10
60 40IT
75 25Ind. Sourcing
95Comms 5
50 50Shared Services
RemarksProgress (%) Achieved by end of H1 2017 Remaining 2017/ Run Rate EoY
4

Nutrition-specific improvement program running well
Page 38
4
Purchasing
Fixed cost
reduction
(~100 FTE)
Throughput gain in sold-out units
Efficiency
gains
(Yield &
Energy)
Purchasing ▪ Purchasing savings so far
exceeding target
Fixed cost
reduction
▪ Cost reduction programs are
being executed. Remaining part
will be captured in the upcoming
period
Throughput
gains
▪ Program on track and 2017 target
confirmed
Efficiency
gains
▪ Program on track and 2017 target
confirmed
Actions Financial benefitsCurrent status as per end H1 2017:
Cost improvements Work streams closely monitored and on track

One-time costs within budget
Page 39
€m
~80 ~80
0
50
100
150
200
250
2015 2016 2017 2018
4
One-time costs
Realized Forecast
€m
0
50
100
150
200
250
300
350
2015 2016 2017E 2018E
Timing of cumulative cost savings
Realized Forecast
~25
~110
~190
~50

Disciplined approach to capital allocation maintained
Page 40
1. Continuing operations (as reported)
5
800
1,018
0
200
400
600
800
1,000
1,200
2015 2016
Cash from operating activities (€m)1
27%
Consistent improvements in capital allocation ✓
Cash capex (€m)
444
500-550
475
2500
200
400
600
800
1,000
1,200
2015 Strat. 2018
guidance
2016 2017E
~6% ~6% ~6%
x% Capex as % of sales
H1 2017
~6.5%

Total working capital as % of sales
(average)
Ongoing actions to improve working capital level further
Page 41
5
20.7% 18.6% 18.9%
0%
5%
10%
15%
20%
25%
30%
35%
40%
45%
50%
2015 2016 H1 2017
Total working capital as % of sales
(average) per cluster
29.4% 28.1% 27.6%
0%
5%
10%
15%
20%
25%
30%
35%
40%
45%
50%
2015 2016 H1 2017
14.8%12.5% 12.2%
0%
5%
10%
15%
20%
25%
30%
35%
40%
45%
50%
2015 2016 H1 2017
Nutrition Materials
<20%
by 2018

Patheon transaction: realized cash proceeds of ~€1.5bn in 2017
Page 42
1. Refers to the period 1 August – 31 December
6
50% 35%
€m, 100% 2015 2016 H1 2017
Sales 1,621 1,786
Adj. EBITDA % 23% 20%
€m, 100% 20151 2016 H1 2017
Sales 756 1,802 996
Adj. EBITDA % 0% 6% 8%
€m, 100% 2015 2016 H1 2017
Sales 418 431 217
Adj. EBITDA % 14% 14% 15%
Exit
Extracting value from partnerships ahead of schedule ✓

DSM has been outperforming its 2 headline financial targets…
Page 43
1. Continuing operations
High single-digit percentage
annual Adjusted EBITDA growth
1,075
1,262
624721
0
200
400
600
800
1,000
1,200
1,400
2015 2016 H1 2016 H1 2017
High double-digit basis point
annual ROCE growth
1
✓ ✓
16%
17%
13.9% 15.9% 16.0% 16.7%Adj.
EBITDA %
Adj.
EBITDA €m
7.6%
10.4% 10.5%
12.2%
0%
2%
4%
6%
8%
10%
12%
14%
2015 2016 H1 2016 H1 2017
170bps
280bps
1

… with both businesses outperforming
Page 44
1. Continuing operations
Adjusted EBITDA (€m) ROCE (%)
822931
462528
0
500
1,000
2015 2016 H1 2016 H1 20171
14%
13%
16.6% 18.0% 18.2% 19.0%
Adj.
EBITDA %
10.3%12.0% 12.3%
13.9%
0%
5%
10%
15%
2015 2016 H1 2016 H1 2017
160bps170bps
384435
212 241
0
200
400
600
2015 2016 H1 2016 H1 20171
14%
13%
15.2% 17.3% 17.1% 16.9%
Adj.
EBITDA %
14.4%17.6% 16.9%
19.5%
0%
5%
10%
15%
20%
25%
2015 2016 H1 2016 H1 2017
260bps320bps
Nutr
itio
nM
ate
rials
1
1

Full year 2017 outlook confirmed; aiming to continue growth in 2018
Page 45
▪ DSM confirms its EBITDA and ROCE outlook for 2017 as communicated with the Q2 financial
results despite today’s slightly less favorable exchange rates
– “DSM expects to deliver full-year 2017 results above the targets set out in its Strategy
2018, with an EBITDA growth for the year moving slightly up from high single-digit to
double digit, and with a ROCE increase moving from double digit basis points to over 100
basis points”
▪ DSM aims to continue to deliver in 2018 against its Strategy 2018 “Driving Profitable
Growth”, with full commitment to its growth initiatives as well as its cost-reduction and
efficiency improvement programs

HEALTH NUTRITION MATERIALS
ROYAL DSM
What’s next?

DSM remains ideally positioned to profit from societal megatrends
Page 47
HEALTH . NUTRITION . MATERIALS
Global shifts
& Digitization
Climate &
EnergyHealth &
Wellness
BRIGHT SCIENCES

DSM is confident on further sales growth and EBITDA margin improvements
Page 48
Nutrition
Materials
~5%
Growth Adj. EBITDA margin
Towards
20%
~5%Above
15%
2-3%
~3%
Market growth

Upside will come from innovation-driven growth
Page 49
▪ Force multiplier
technology
(light personal
protection)▪ New bio-medical
products
▪ Fermentative
stevia
▪ Algae-based omega-3
for aquaculture
▪ Clean cow
▪ New bio colorants
(blue/red)
▪ i-Health
(B2C nutrients)
▪ Eubiotics
▪ Hydrocolloids
▪ ForTii® (HPPO
polymer)
▪ Niaga® (recycle
carpets)
▪ Decovery® (bio-
based resins)
▪ Apparel (Dyneema®
textile apps)
▪ 3D options (combine
Somos, Resins,
Biomedical &
Engineering Plastics)
▪ Advanced solar
materials
▪ Bio-based
products and
services
Nutrition Emerging Business AreasMaterials

Bring forward the strategy review process
Page 50
▪ Key actions of Strategy 2018 are progressing well
▪ Financial results are well-ahead of the strategic targets
▪ Cash proceeds from Patheon came in earlier than expected
▪ DSM will bring forward its regular strategic review process for
the period beyond 2018
▪ Aim to communicate conclusions before the summer of 2018

DSM will continue to drive profitable growth!
Page 51
▪ Outlook 2017 confirmed
▪ Continued delivery in 2018
▪ Confident DSM will continue to outgrow its markets
through organic and innovation driven growth
▪ Optionality of enhanced growth through M&A
▪ Bring forward the regular strategic review process