Embed Size (px)
Citation preview
Presentation to Select Committee on Finance:
KZN’s Provincial Expenditure
1
19 June 2015
Overall Provincial Budget Performance by Department
2
Provincial Own Revenue - 2014/15 Preliminary Outcome
3
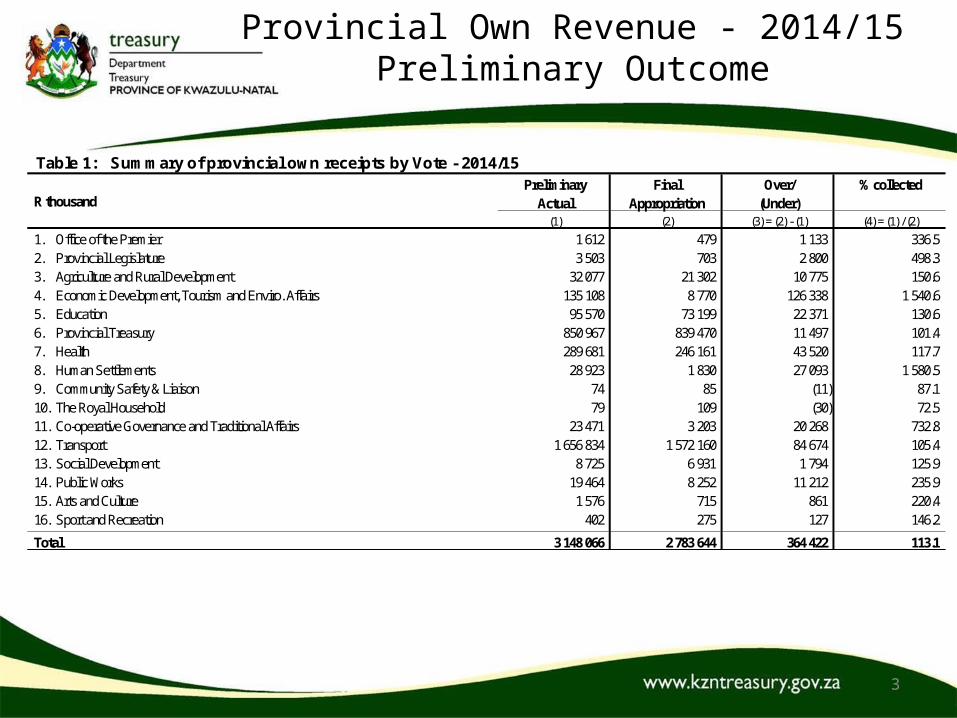
Table 1: Summary of provincial own receipts by Vote - 2014/15Preliminary Final Over/ % collected
Actual Appropriation (Under)(1) (2) (3) = (2) - (1) (4) = (1) / (2)
1. Office of the Premier 1 612 479 1 133 336.5 2. Provincial Legislature 3 503 703 2 800 498.3 3. Agriculture and Rural Development 32 077 21 302 10 775 150.6 4. Economic Development, Tourism and Enviro. Affairs 135 108 8 770 126 338 1 540.6 5. Education 95 570 73 199 22 371 130.6 6. Provincial Treasury 850 967 839 470 11 497 101.4 7. Health 289 681 246 161 43 520 117.7 8. Human Settlements 28 923 1 830 27 093 1 580.5 9. Community Safety & Liaison 74 85 (11) 87.1 10. The Royal Household 79 109 (30) 72.5 11. Co-operative Governance and Traditional Affairs 23 471 3 203 20 268 732.8 12. Transport 1 656 834 1 572 160 84 674 105.4 13. Social Development 8 725 6 931 1 794 125.9 14. Public Works 19 464 8 252 11 212 235.9 15. Arts and Culture 1 576 715 861 220.4 16. Sport and Recreation 402 275 127 146.2
Total 3 148 066 2 783 644 364 422 113.1
R thousand
2014/15 Preliminary Outcome
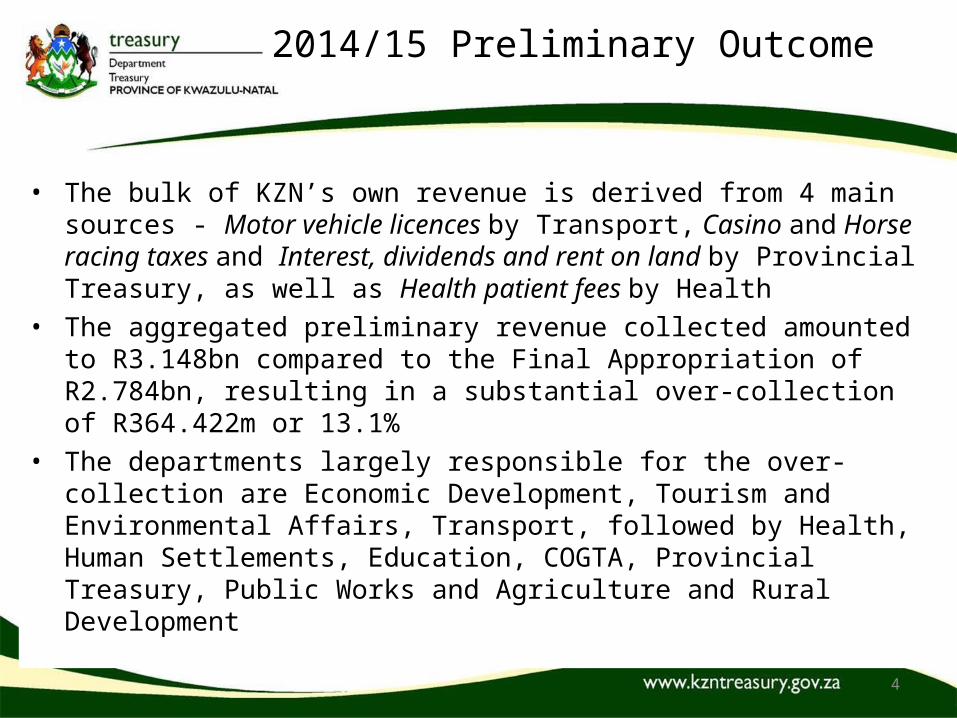
• The bulk of KZN’s own revenue is derived from 4 main sources - Motor vehicle licences by Transport, Casino and Horse racing taxes and Interest, dividends and rent on land by Provincial Treasury, as well as Health patient fees by Health
• The aggregated preliminary revenue collected amounted to R3.148bn compared to the Final Appropriation of R2.784bn, resulting in a substantial over-collection of R364.422m or 13.1%
• The departments largely responsible for the over-collection are Economic Development, Tourism and Environmental Affairs, Transport, followed by Health, Human Settlements, Education, COGTA, Provincial Treasury, Public Works and Agriculture and Rural Development
4
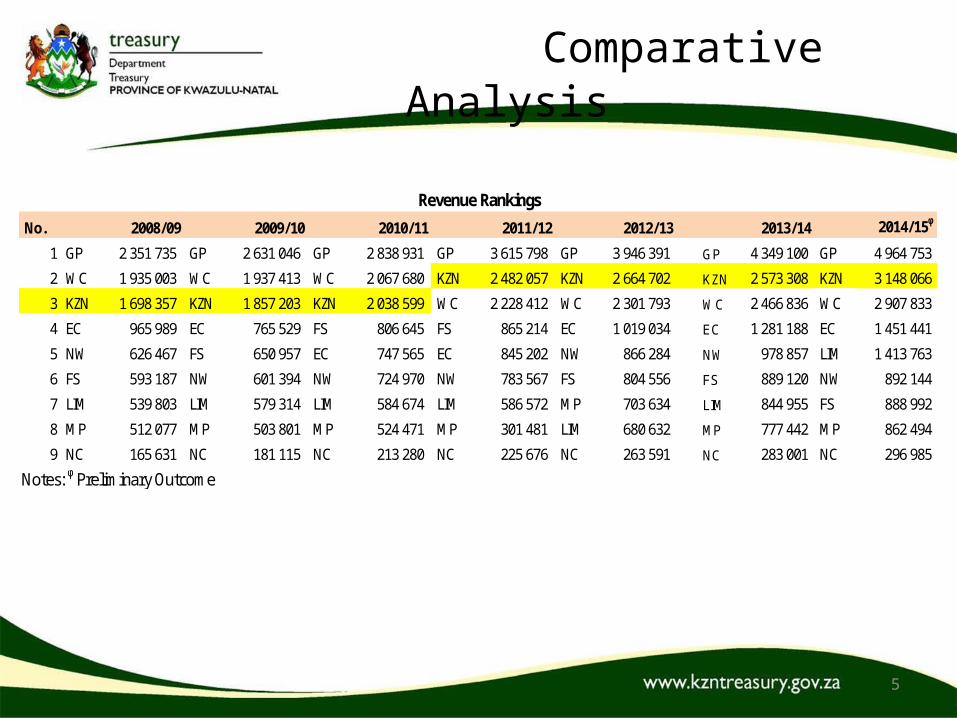
Comparative Analysis
5
No. 2008/09 2009/10 2010/11 2011/12 2012/13 2013/14 2014/15φ
1 GP 2 351 735 GP 2 631 046 GP 2 838 931 GP 3 615 798 GP 3 946 391 GP 4 349 100 GP 4 964 753
2 WC 1 935 003 WC 1 937 413 WC 2 067 680 KZN 2 482 057 KZN 2 664 702 KZN 2 573 308 KZN 3 148 066
3 KZN 1 698 357 KZN 1 857 203 KZN 2 038 599 WC 2 228 412 WC 2 301 793 WC 2 466 836 WC 2 907 833
4 EC 965 989 EC 765 529 FS 806 645 FS 865 214 EC 1 019 034 EC 1 281 188 EC 1 451 441
5 NW 626 467 FS 650 957 EC 747 565 EC 845 202 NW 866 284 NW 978 857 LIM 1 413 763
6 FS 593 187 NW 601 394 NW 724 970 NW 783 567 FS 804 556 FS 889 120 NW 892 144
7 LIM 539 803 LIM 579 314 LIM 584 674 LIM 586 572 MP 703 634 LIM 844 955 FS 888 992
8 MP 512 077 MP 503 801 MP 524 471 MP 301 481 LIM 680 632 MP 777 442 MP 862 494
9 NC 165 631 NC 181 115 NC 213 280 NC 225 676 NC 263 591 NC 283 001 NC 296 985
Notes: φ Preliminary Outcome
Revenue Rankings
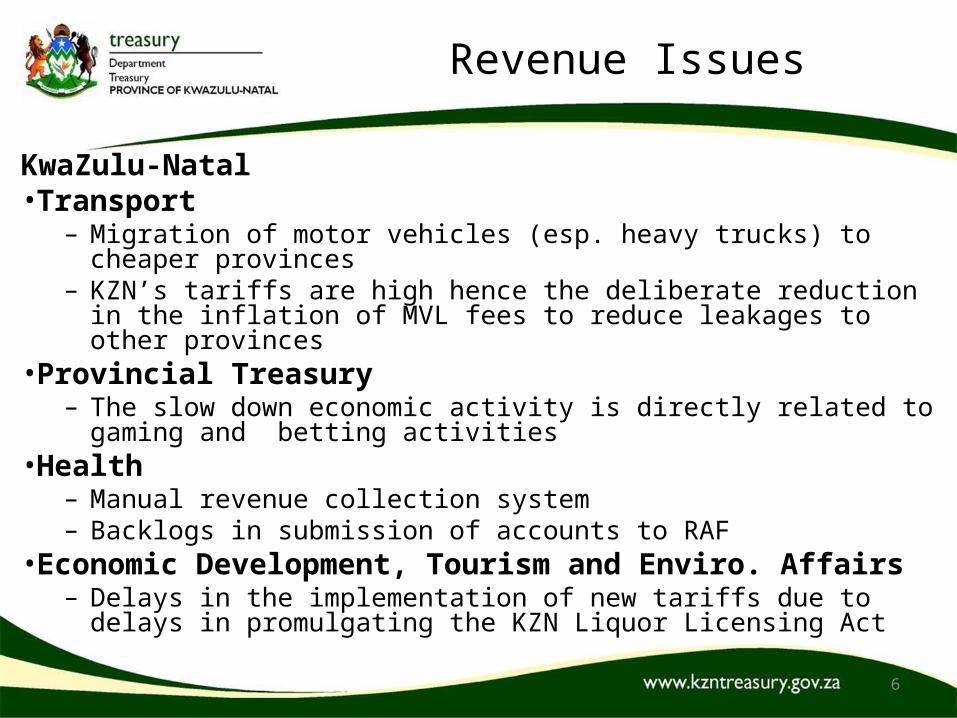
Revenue Issues
KwaZulu-Natal•Transport
– Migration of motor vehicles (esp. heavy trucks) to cheaper provinces– KZN’s tariffs are high hence the deliberate reduction in the inflation of
MVL fees to reduce leakages to other provinces•Provincial Treasury
– The slow down economic activity is directly related to gaming and betting activities
•Health– Manual revenue collection system– Backlogs in submission of accounts to RAF
•Economic Development, Tourism and Enviro. Affairs– Delays in the implementation of new tariffs due to delays in
promulgating the KZN Liquor Licensing Act
6
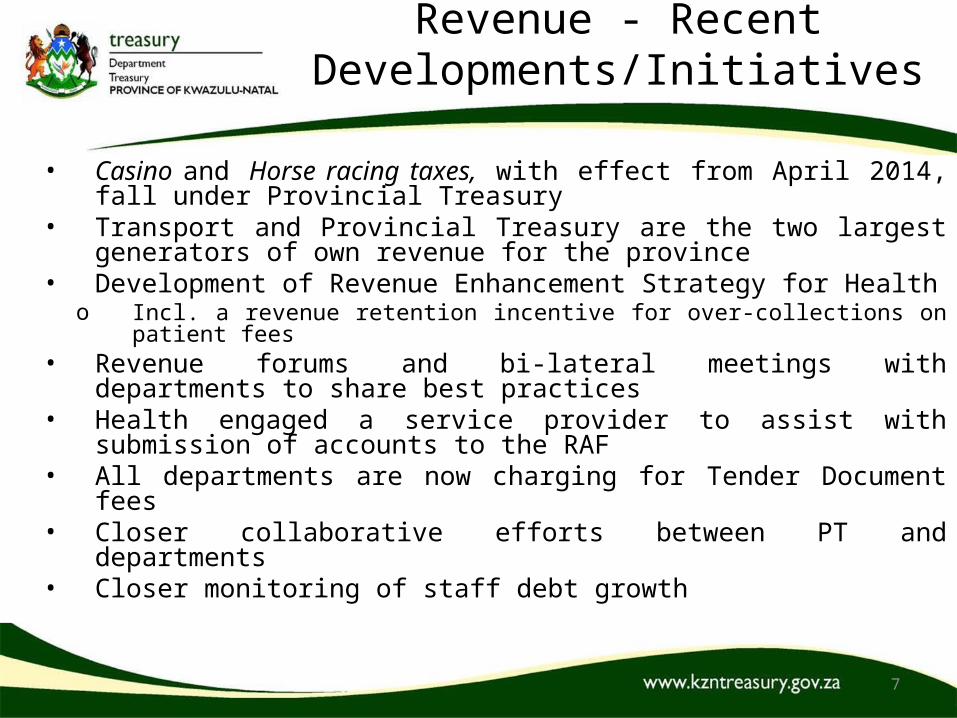
Revenue - Recent Developments/Initiatives
• Casino and Horse racing taxes, with effect from April 2014, fall under Provincial Treasury
• Transport and Provincial Treasury are the two largest generators of own revenue for the province
• Development of Revenue Enhancement Strategy for Healtho Incl. a revenue retention incentive for over-collections on patient fees
• Revenue forums and bi-lateral meetings with departments to share best practices
• Health engaged a service provider to assist with submission of accounts to the RAF
• All departments are now charging for Tender Document fees• Closer collaborative efforts between PT and departments• Closer monitoring of staff debt growth
7
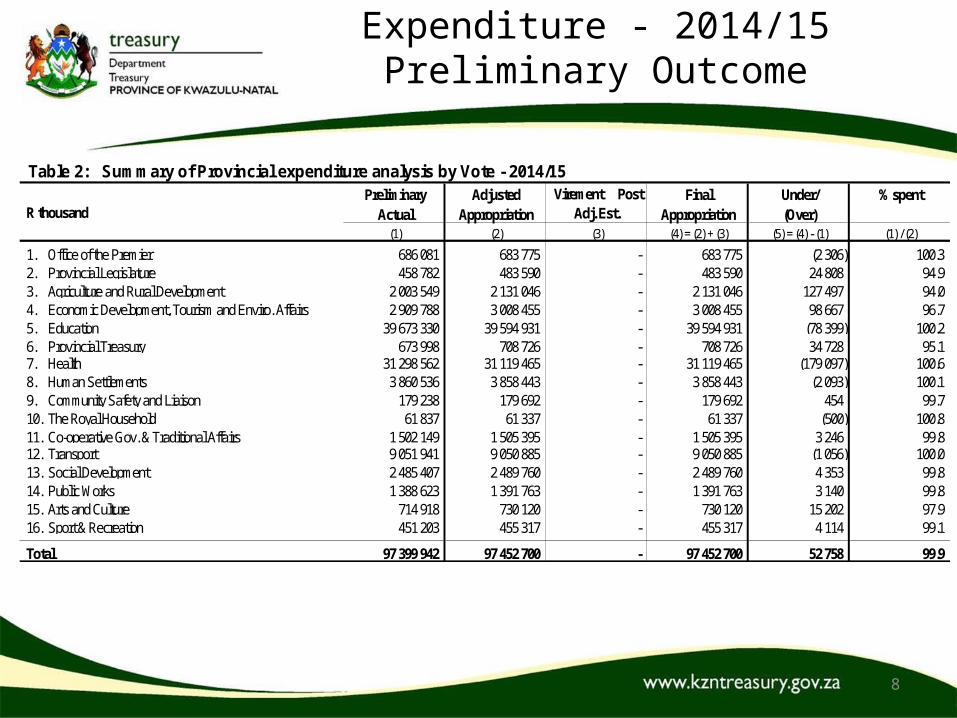
Expenditure - 2014/15 Preliminary Outcome
8
Table 2: Summary of Provincial expenditure analysis by Vote - 2014/15Preliminary Adjusted Final Under/ % spent
Actual Appropriation Appropriation (Over)(1) (2) (3) (4) = (2) + (3) (5) = (4) - (1) (1) / (2)
1. Office of the Premier 686 081 683 775 - 683 775 (2 306) 100.3 2. Provincial Legislature 458 782 483 590 - 483 590 24 808 94.9 3. Agriculture and Rural Development 2 003 549 2 131 046 - 2 131 046 127 497 94.0 4. Economic Development, Tourism and Enviro. Affairs 2 909 788 3 008 455 - 3 008 455 98 667 96.7 5. Education 39 673 330 39 594 931 - 39 594 931 (78 399) 100.2 6. Provincial Treasury 673 998 708 726 - 708 726 34 728 95.1 7. Health 31 298 562 31 119 465 - 31 119 465 (179 097) 100.6 8. Human Settlements 3 860 536 3 858 443 - 3 858 443 (2 093) 100.1 9. Community Safety and Liaison 179 238 179 692 - 179 692 454 99.7 10. The Royal Household 61 837 61 337 - 61 337 (500) 100.8 11. Co-operative Gov. & Traditional Affairs 1 502 149 1 505 395 - 1 505 395 3 246 99.8 12. Transport 9 051 941 9 050 885 - 9 050 885 (1 056) 100.0 13. Social Development 2 485 407 2 489 760 - 2 489 760 4 353 99.8 14. Public Works 1 388 623 1 391 763 - 1 391 763 3 140 99.8 15. Arts and Culture 714 918 730 120 - 730 120 15 202 97.9 16. Sport & Recreation 451 203 455 317 - 455 317 4 114 99.1
Total 97 399 942 97 452 700 - 97 452 700 52 758 99.9
R thousand Virement Post
Adj. Est.
2014/15 Preliminary Outcome
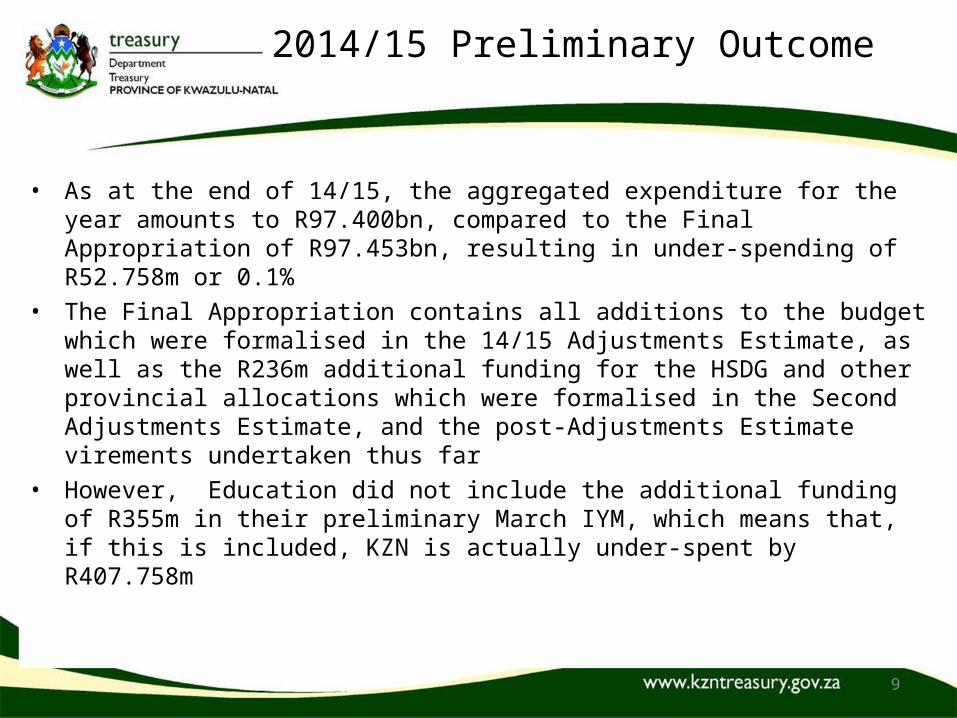
• As at the end of 14/15, the aggregated expenditure for the year amounts to R97.400bn, compared to the Final Appropriation of R97.453bn, resulting in under-spending of R52.758m or 0.1%
• The Final Appropriation contains all additions to the budget which were formalised in the 14/15 Adjustments Estimate, as well as the R236m additional funding for the HSDG and other provincial allocations which were formalised in the Second Adjustments Estimate, and the post-Adjustments Estimate virements undertaken thus far
• However, Education did not include the additional funding of R355m in their preliminary March IYM, which means that, if this is included, KZN is actually under-spent by R407.758m
9
10
Table 3: Summary of conditional grants by Vote - 2014/15Preliminary Final Under/ % spent
Actual Appropriation (Over)(1) (2) (3) = (2) - (1) (1) / (2)
Agriculture and Rural Development 319 760 319 760 - 100.0 Comprehensive Agricultural Support Programme 212 632 212 632 - 100.0 Land Care grant 10 854 10 854 - 100.0 EPWP Integrated Grant for Provinces 4 181 4 181 - 100.0 Ilima/Letsema Projects grant 92 093 92 093 - 100.0
Economic Development, Tourism and Environmental Affairs 13 120 16 827 3 707 78.0 EPWP Integrated Grant for Provinces 13 120 16 827 3 707 78.0
Education 3 200 609 3 193 492 (7 117) 100.2 Education Infrastructure grant 1 385 781 1 385 781 - 100.0 HIV and AIDS (Life-Skills Education) grant 83 651 81 547 (2 104) 102.6 National School Nutrition Programme grant 1 253 920 1 253 300 (620) 100.0 FET College Sector grant 355 330 351 475 (3 855) 101.1 Technical Secondary Schools Recap. grant 53 649 52 833 (816) 101.5 Dinaledi Schools grant 21 953 21 458 (495) 102.3 EPWP Integrated Grant for Provinces 2 937 2 937 - 100.0 OSD for Education Therapists 41 581 41 581 - 100.0 Social Sector EPWP Incentive Grant for Provinces 1 807 2 580 773 70.0
Health 6 380 773 6 434 734 53 961 99.2 Comprehensive HIV and AIDS grant 3 206 610 3 257 992 51 382 98.4 Health Facility Revitalisation grant 1 362 572 1 362 469 (103) 100.0 Health Professions Training and Development grant 291 241 292 837 1 596 99.5 National Tertiary Services grant 1 497 952 1 496 427 (1 525) 100.1 National Health Insurance grant 17 237 19 848 2 611 86.8 EPWP Integrated Grant for Provinces 2 581 2 581 - 100.0 Social Sector EPWP Incentive Grant for Provinces 2 580 2 580 - 100.0
Human Settlements 3 510 523 3 509 045 (1 478) 100.0 Human Settlements Development grant 3 510 523 3 509 045 (1 478) 100.0
Community Safety and Liaison 2 565 2 580 15 99.4 Social Sector EPWP Incentive Grant for Provinces 2 565 2 580 15 99.4
Co-operative Governance and Traditional Affairs 3 471 3 471 - 100.0 EPWP Integrated Grant for Provinces 3 471 3 471 - 100.0
Transport 2 832 553 2 752 384 (80 169) 102.9 Provincial Roads Maintenance grant 1 788 158 1 788 158 - 100.0 Public Transport Operations grant 984 952 904 783 (80 169) 108.9 EPWP Integrated Grant for Provinces 59 443 59 443 - 100.0
Social Development 5 746 5 746 - 100.0 Social Sector EPWP Incentive Grant for Provinces 3 746 3 746 - 100.0 EPWP Integrated Grant for Provinces 2 000 2 000 - 100.0
Public Works 3 167 3 168 1 100.0 EPWP Integrated Grant for Provinces 3 167 3 168 1 100.0
Arts and Culture 110 657 124 856 14 199 88.6 Community Library Services grant 108 555 122 754 14 199 88.4 EPWP Integrated Grant for Provinces 2 102 2 102 - 100.0
Sport and Recreation 93 608 95 595 1 987 97.9 Mass Participation and Sport Development grant 83 448 85 435 1 987 97.7 EPWP Integrated Grant for Provinces 2 102 2 102 - 100.0 Social Sector EPWP Incentive Grant for Provinces 8 058 8 058 - 100.0
Total 16 476 552 16 461 658 (14 894) 100.1
R thousand
Conditional Grants - 2014/15 Preliminary Outcome
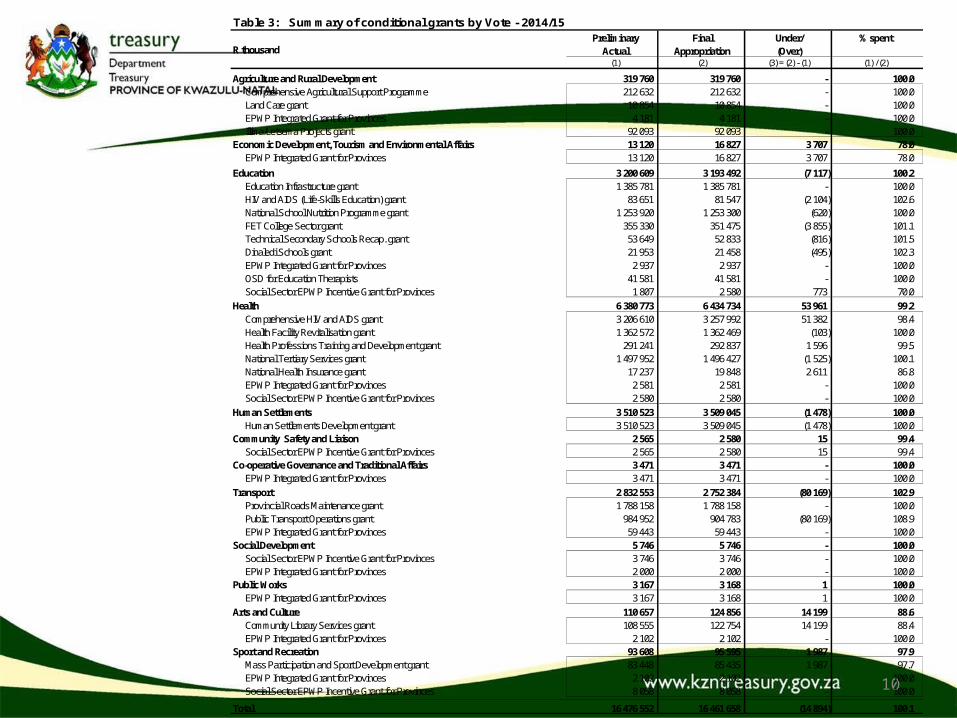
• Table 3 shows the Preliminary Actual expenditure incurred in 14/15 on national conditional grants by department and grant
• It is noted that the Final Appropriation takes into account the increase of the HSDG by R236m that was tabled and formalised in the Second Adjustments Estimate (moved from Limpopo to various provinces)
• The conditional grant allocation was over-spent by R14.894m, with the main contributor to this over-spending being Transport
• The spending at year-end is 100.1% of the annual conditional grant budget
11
12
Table 4 Summary of Infrastructure expenditure analysis by Vote - 2014/15R thousand Preliminary Final Under/ %
Actual Appropriation (Over) Spent
1. Office of the Premier 23 358 17 097 - 17 097 (6 261) 136.6 2. Provincial Legislature 6 382 4 685 - 4 685 (1 697) 136.2 3. Agriculture and Rural Development 209 013 127 686 115 549 243 235 34 222 85.9 4. Economic Development, Tourism and Enviro Affairs 540 775 540 747 - 540 747 (28) 100.0 5. Education 2 216 919 1 862 349 - 1 862 349 (354 570) 119.0 6. Provincial Treasury 31 665 31 883 - 31 883 218 99.3 7. Health 1 654 385 1 632 855 - 1 632 855 (21 530) 101.3 8. Human Settlements 184 389 108 720 - 108 720 (75 669) 169.6 9. Community Safety and Liaison - - - - - - 10. The Royal Household 10 114 8 863 - 8 863 (1 251) 114.1 11. Co-operative Governance & Trad. Affairs 55 892 85 152 (29 800) 55 352 (540) 101.0 12. Transport 6 510 012 6 552 451 - 6 552 451 42 439 99.4 13. Social Development 137 005 135 133 - 135 133 (1 872) 101.4 14. Public Works 108 631 109 168 - 109 168 537 99.5 15. Arts and Culture 60 864 70 257 126 70 383 9 519 86.5 16. Sport and Recreation 62 392 58 378 - 58 378 (4 014) 106.9
Total 11 811 796 11 345 424 85 875 11 431 299 (380 497) 103.3
Adjusted Appropriation
Virement Post Adj. Est.
Infrastructure - 2014/15 Preliminary Outcome
2014/15 Preliminary Outcome
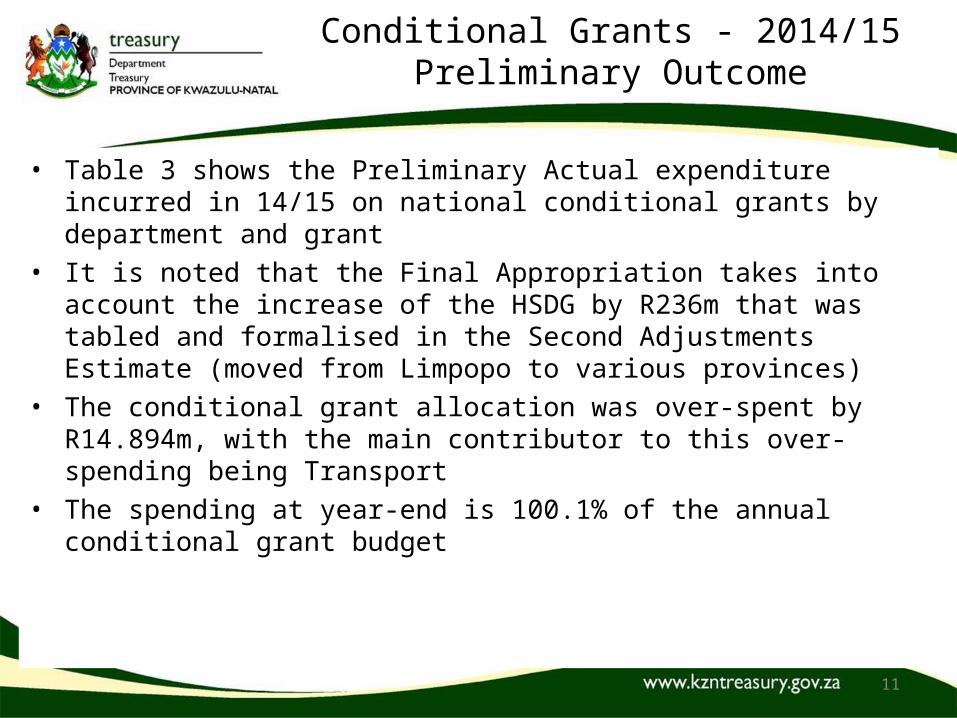
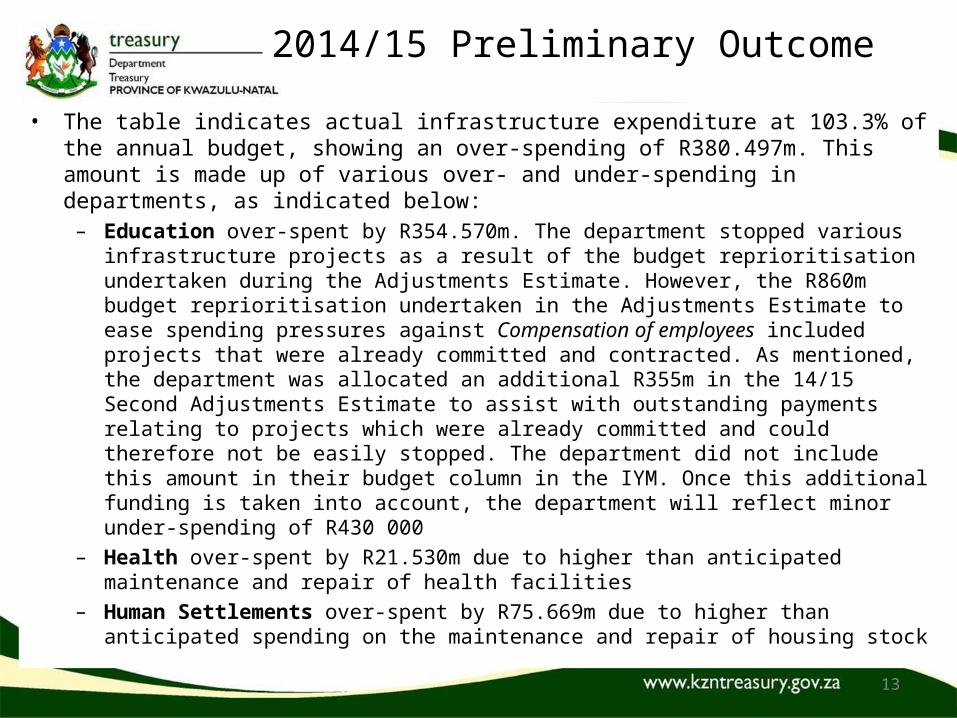
• The table indicates actual infrastructure expenditure at 103.3% of the annual budget, showing an over-spending of R380.497m. This amount is made up of various over- and under-spending in departments, as indicated below:
– Education over-spent by R354.570m. The department stopped various infrastructure projects as a result of the budget reprioritisation undertaken during the Adjustments Estimate. However, the R860m budget reprioritisation undertaken in the Adjustments Estimate to ease spending pressures against Compensation of employees included projects that were already committed and contracted. As mentioned, the department was allocated an additional R355m in the 14/15 Second Adjustments Estimate to assist with outstanding payments relating to projects which were already committed and could therefore not be easily stopped. The department did not include this amount in their budget column in the IYM. Once this additional funding is taken into account, the department will reflect minor under-spending of R430 000
– Health over-spent by R21.530m due to higher than anticipated maintenance and repair of health facilities
– Human Settlements over-spent by R75.669m due to higher than anticipated spending on the maintenance and repair of housing stock
13
Fiscal Sustainability
14
Analysis of spending from 2009/10 to 2014/15
15
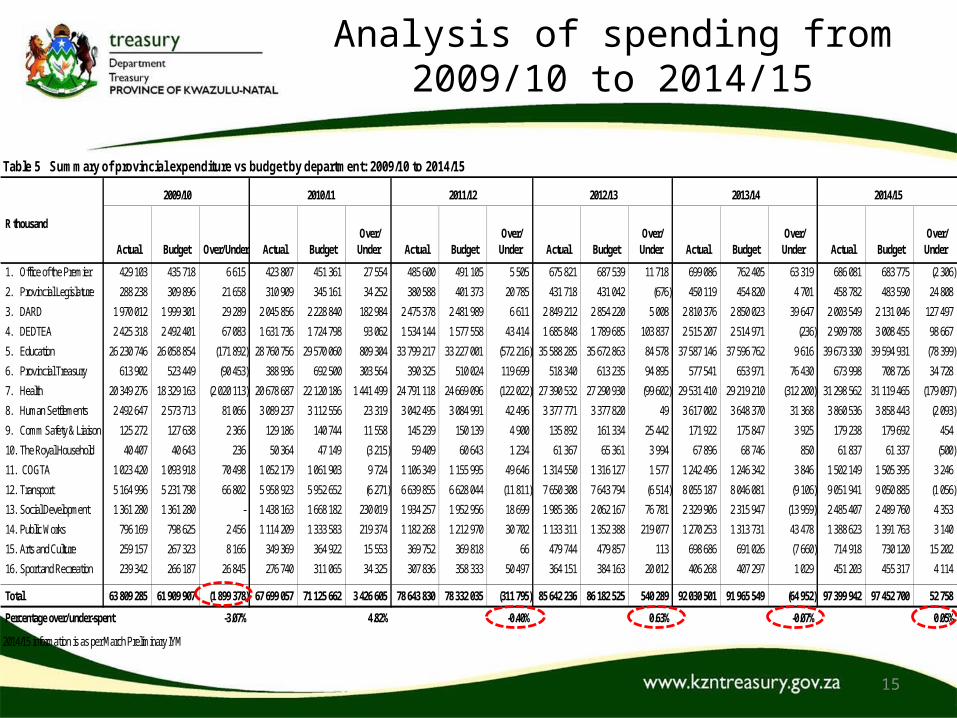
Table 5 Summary of provincial expenditure vs budget by department: 2009/10 to 2014/15
R thousand
1. Office of the Premier 429 103 435 718 6 615 423 807 451 361 27 554 485 600 491 105 5 505 675 821 687 539 11 718 699 086 762 405 63 319 686 081 683 775 (2 306)
2. Provincial Legislature 288 238 309 896 21 658 310 909 345 161 34 252 380 588 401 373 20 785 431 718 431 042 (676) 450 119 454 820 4 701 458 782 483 590 24 808
3. DARD 1 970 012 1 999 301 29 289 2 045 856 2 228 840 182 984 2 475 378 2 481 989 6 611 2 849 212 2 854 220 5 008 2 810 376 2 850 023 39 647 2 003 549 2 131 046 127 497
4. DEDTEA 2 425 318 2 492 401 67 083 1 631 736 1 724 798 93 062 1 534 144 1 577 558 43 414 1 685 848 1 789 685 103 837 2 515 207 2 514 971 (236) 2 909 788 3 008 455 98 667
5. Education 26 230 746 26 058 854 (171 892) 28 760 756 29 570 060 809 304 33 799 217 33 227 001 (572 216) 35 588 285 35 672 863 84 578 37 587 146 37 596 762 9 616 39 673 330 39 594 931 (78 399)
6. Provincial Treasury 613 902 523 449 (90 453) 388 936 692 500 303 564 390 325 510 024 119 699 518 340 613 235 94 895 577 541 653 971 76 430 673 998 708 726 34 728
7. Health 20 349 276 18 329 163 (2 020 113) 20 678 687 22 120 186 1 441 499 24 791 118 24 669 096 (122 022) 27 390 532 27 290 930 (99 602) 29 531 410 29 219 210 (312 200) 31 298 562 31 119 465 (179 097)
8. Human Settlements 2 492 647 2 573 713 81 066 3 089 237 3 112 556 23 319 3 042 495 3 084 991 42 496 3 377 771 3 377 820 49 3 617 002 3 648 370 31 368 3 860 536 3 858 443 (2 093)
9. Comm Safety & Liaison 125 272 127 638 2 366 129 186 140 744 11 558 145 239 150 139 4 900 135 892 161 334 25 442 171 922 175 847 3 925 179 238 179 692 454
10. The Royal Household 40 407 40 643 236 50 364 47 149 (3 215) 59 409 60 643 1 234 61 367 65 361 3 994 67 896 68 746 850 61 837 61 337 (500)
11. COGTA 1 023 420 1 093 918 70 498 1 052 179 1 061 903 9 724 1 106 349 1 155 995 49 646 1 314 550 1 316 127 1 577 1 242 496 1 246 342 3 846 1 502 149 1 505 395 3 246
12. Transport 5 164 996 5 231 798 66 802 5 958 923 5 952 652 (6 271) 6 639 855 6 628 044 (11 811) 7 650 308 7 643 794 (6 514) 8 055 187 8 046 081 (9 106) 9 051 941 9 050 885 (1 056)
13. Social Development 1 361 280 1 361 280 - 1 438 163 1 668 182 230 019 1 934 257 1 952 956 18 699 1 985 386 2 062 167 76 781 2 329 906 2 315 947 (13 959) 2 485 407 2 489 760 4 353
14. Public Works 796 169 798 625 2 456 1 114 209 1 333 583 219 374 1 182 268 1 212 970 30 702 1 133 311 1 352 388 219 077 1 270 253 1 313 731 43 478 1 388 623 1 391 763 3 140
15. Arts and Culture 259 157 267 323 8 166 349 369 364 922 15 553 369 752 369 818 66 479 744 479 857 113 698 686 691 026 (7 660) 714 918 730 120 15 202
16. Sport and Recreation 239 342 266 187 26 845 276 740 311 065 34 325 307 836 358 333 50 497 364 151 384 163 20 012 406 268 407 297 1 029 451 203 455 317 4 114
Total 63 809 285 61 909 907 (1 899 378) 67 699 057 71 125 662 3 426 605 78 643 830 78 332 035 (311 795) 85 642 236 86 182 525 540 289 92 030 501 91 965 549 (64 952) 97 399 942 97 452 700 52 758
Percentage over/ under-spent -3.07% 4.82% -0.40% 0.63% -0.07% 0.05%
2014/15 information is as per March Preliminary IYM
2009/10 2010/11 2011/12 2012/13 2013/14
Over/ Under Actual Budget Over/ Under Actual Budget
Over/ Under Actual Budget
Over/ Under Actual Budget Actual Budget
Over/ Under
2014/15
Actual Budget Over/ Under
Analysis of spending from 2009/10 to 2014/15
• Cost-cutting has been in place in KZN since 2009/10 when the Provincial Recovery Plan was first implemented as the province was projecting over-expenditure of some R5.6bn in that year
• Since 11/12, KZN has had a less than 1% variance in terms of provincial over- or under-spending
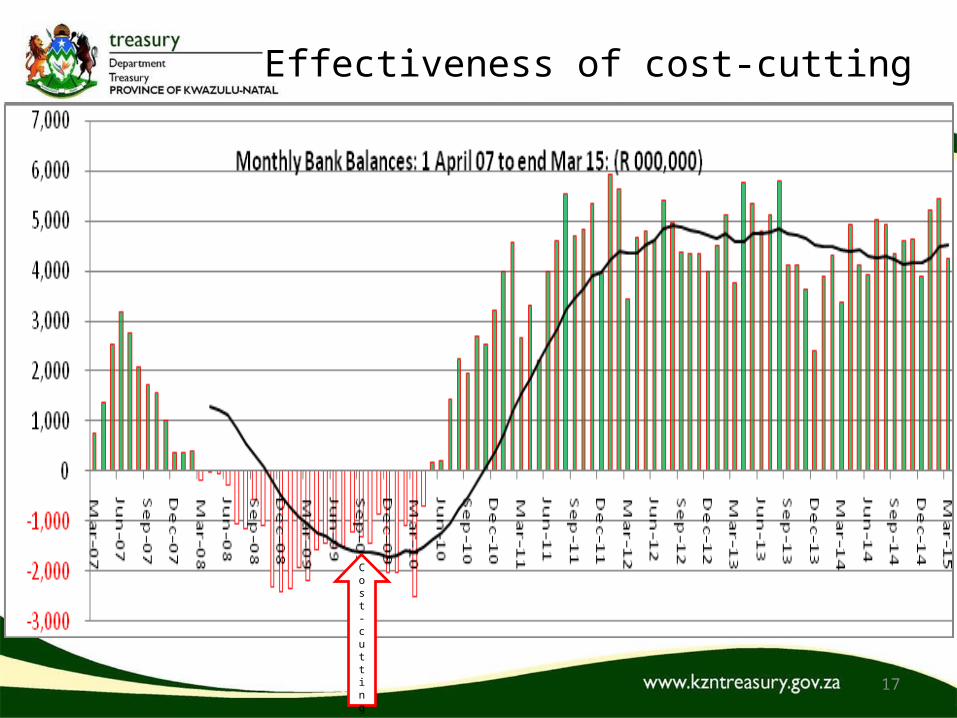
• Province has remained cash positive since May 2010• Figure 1 shows the provincial cash position since March 2007 and up to December 2014. It
also shows the year that cost-cutting started• KZN reports on its spending trends to the Provincial Executive Council on a monthly basis
– Allows for immediate corrective action to be undertaken if there is projected over-expenditure
• KZN also reports mid-year and close-out spending to the provincial Finance Portfolio Committee
– Good team work exists in terms of oversight between Provincial Legislature and PT
• Have formal bilaterals with all departments 3 times a year to look at budget and spending– Informal engagements on a nearly daily basis
16
Effectiveness of cost-cutting
17
Cost-cutting
Effectiveness of cost-cutting
• As can be seen in the graph, KZN was in overdraft from about March 2008, with the overdraft reaching concerning levels from December 2008
• The Provincial Recovery Plan was implemented from October 2009, and this included the implementation of a number of cost-cutting measures
• These cost-cutting measures are reviewed annually to see if they are still applicable or to see if they can be strengthened
• Cost-cutting remains in place in KZN for the foreseeable future and are viewed as elements of good governance rather than a once-off initiative to contain costs
• KZN turned the corner very quickly when it comes to repaying the overdraft with the province being in the black since May 2010
• KZN Treasury has recently undertaken an assessment on just 4 of the spending items that were targeted for cost-cutting, and these include catering, leave gratuities and travel claims. The aggregate savings over the period under review (i.e. from 09/10 to the end of 14/15) was in the region of R2bn
18
Fiscal Position
19
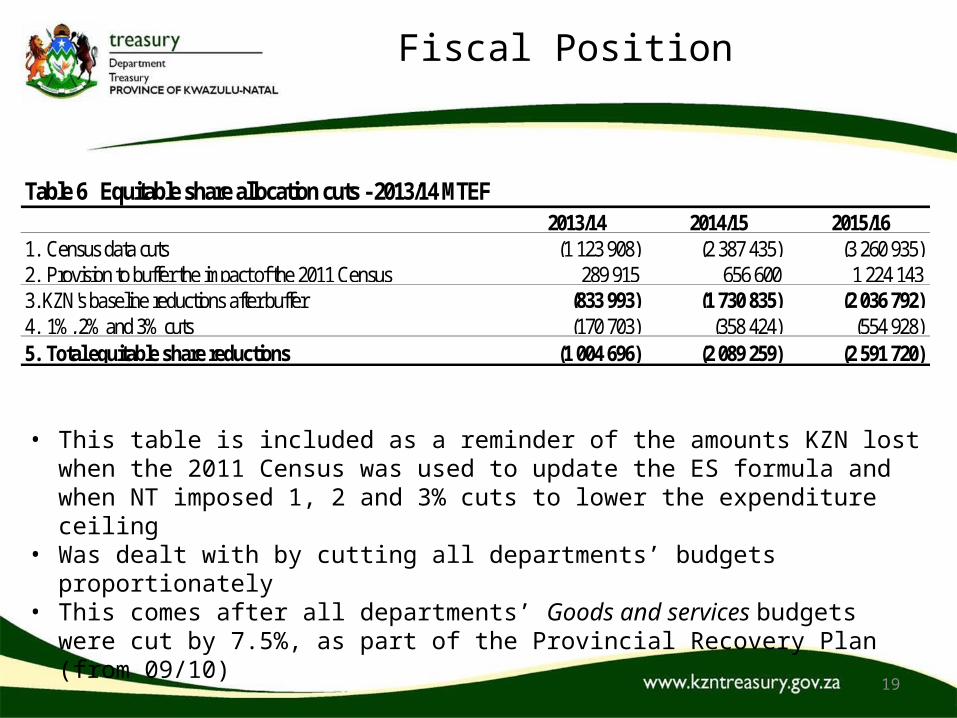
• This table is included as a reminder of the amounts KZN lost when the 2011 Census was used to update the ES formula and when NT imposed 1, 2 and 3% cuts to lower the expenditure ceiling
• Was dealt with by cutting all departments’ budgets proportionately• This comes after all departments’ Goods and services budgets were cut by 7.5%, as part
of the Provincial Recovery Plan (from 09/10)
Table 6 Equitable share allocation cuts - 2013/14 MTEF2013/14 2014/15 2015/16
1. Census data cuts (1 123 908) (2 387 435) (3 260 935) 2. Provision to buffer the impact of the 2011 Census 289 915 656 600 1 224 143 3. KZN's baseline reductions after buffer (833 993) (1 730 835) (2 036 792) 4. 1%, 2% and 3% cuts (170 703) (358 424) (554 928) 5. Total equitable share reductions (1 004 696) (2 089 259) (2 591 720)
Fiscal Position
20
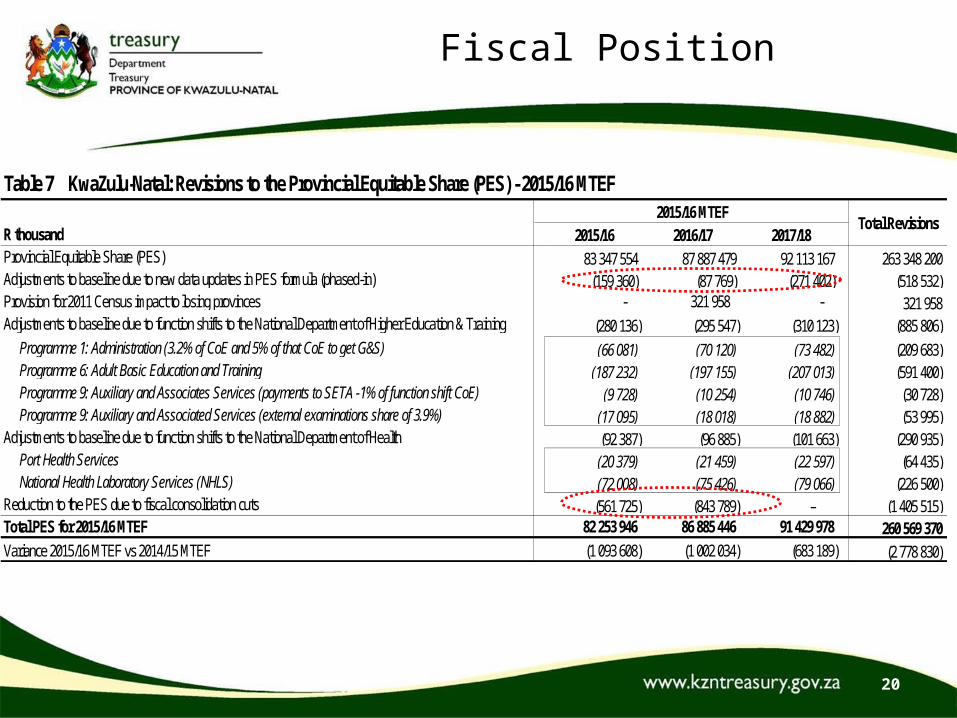
Table 7 KwaZulu-Natal: Revisions to the Provincial Equitable Share (PES) - 2015/16 MTEF
R thousand 2015/16 2016/17 2017/18Provincial Equitable Share (PES) 83 347 554 87 887 479 92 113 167 263 348 200 Adjustments to baseline due to new data updates in PES formula (phased-in) (159 360) (87 769) (271 402) (518 532) Provision for 2011 Census impact to losing provinces - 321 958 - 321 958 Adjustments to baseline due to function shifts to the National Department of Higher Education & Training (280 136) (295 547) (310 123) (885 806)
Programme 1: Administration (3.2% of CoE and 5% of that CoE to get G&S) (66 081) (70 120) (73 482) (209 683) Programme 6: Adult Basic Education and Training (187 232) (197 155) (207 013) (591 400) Programme 9: Auxiliary and Associates Services (payments to SETA -1% of function shift CoE) (9 728) (10 254) (10 746) (30 728) Programme 9: Auxiliary and Associated Services (external examinations share of 3.9%) (17 095) (18 018) (18 882) (53 995)
Adjustments to baseline due to function shifts to the National Department of Health (92 387) (96 885) (101 663) (290 935) Port Health Services (20 379) (21 459) (22 597) (64 435) National Health Laboratory Services (NHLS) (72 008) (75 426) (79 066) (226 500)
Reduction to the PES due to fiscal consolidation cuts (561 725) (843 789) – (1 405 515) Total PES for 2015/16 MTEF 82 253 946 86 885 446 91 429 978 260 569 370 Variance 2015/16 MTEF vs 2014/15 MTEF (1 093 608) (1 002 034) (683 189) (2 778 830)
2015/16 MTEFTotal Revisions
Fiscal Position
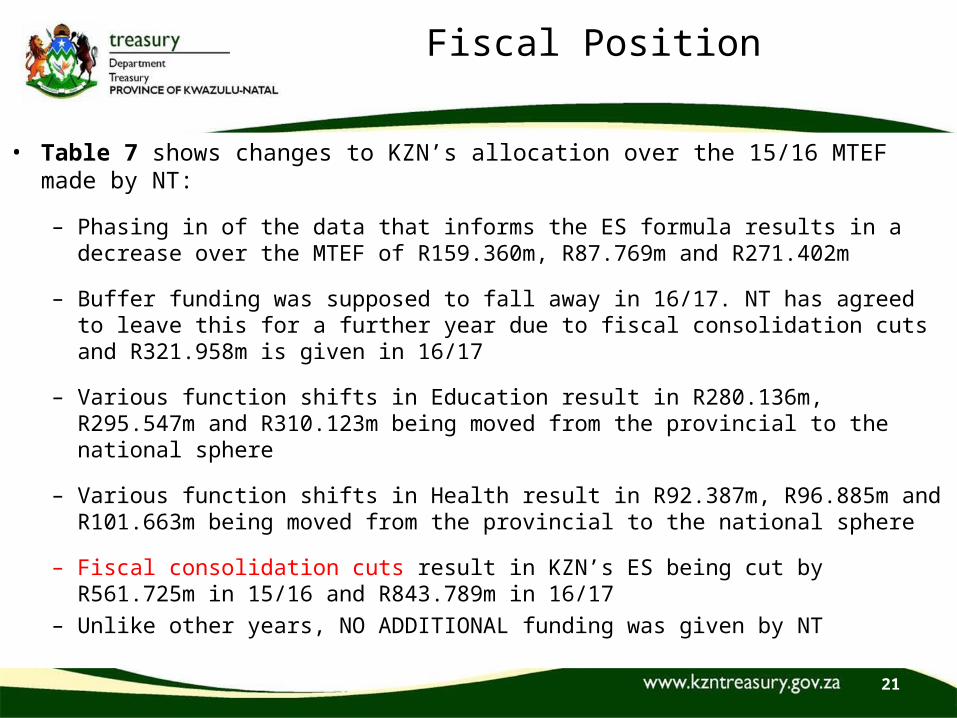
• Table 7 shows changes to KZN’s allocation over the 15/16 MTEF made by NT:
– Phasing in of the data that informs the ES formula results in a decrease over the MTEF of R159.360m, R87.769m and R271.402m
– Buffer funding was supposed to fall away in 16/17. NT has agreed to leave this for a further year due to fiscal consolidation cuts and R321.958m is given in 16/17
– Various function shifts in Education result in R280.136m, R295.547m and R310.123m being moved from the provincial to the national sphere
– Various function shifts in Health result in R92.387m, R96.885m and R101.663m being moved from the provincial to the national sphere
– Fiscal consolidation cuts result in KZN’s ES being cut by R561.725m in 15/16 and R843.789m in 16/17
– Unlike other years, NO ADDITIONAL funding was given by NT
21
Fiscal Position
• The fiscal consolidation cuts and data updates to the ES budget reductions are, once again, quite significant for KZN
• Considering that significant cuts had already been effected against all departments’ budgets in 09/10 during provincial recovery plan period, and again when the Census data cuts were implemented in 13/14, it was felt that the departments would be unable to cope with another major cut
• Had to think differently in terms of funding this cut
• Besides this, it was felt that, despite NT not funding any portion of the 2014 wage agreement shortfall, Education and Health should at least receive a portion of the carry-through costs of the 2014 wage agreement (funded from the provincial fiscus)
• Provincial fiscus therefore provides 40% of the required amount to these 2 depts, with the balance having to be sourced from within their baselines
• As NT was not funding this, the 40% also had to be sourced from within the provincial budget 22
Fiscal Position
• Some tough choices had to be made, but this is a natural consequence of a period of fiscal consolidation. The following were then identified as areas where KZN sourced the required funding to cover these shortfalls:– The Strategic Cabinet Initiatives fund of R100m per annum was put on hold during
this period of fiscal consolidation– The government office precinct project for which R600m had been allocated, was
put on hold during this period of fiscal consolidation– KZN has continued to budget for a Contingency Reserve, with this being set at just
above R1bn per annum over the 14/15 MTEF. This Contingency Reserve is now capped at R750m per annum over the 15/16 MTEF, and this released some funding to finance the budget cuts
– R240m is carried forward from the 14/15 Net Financial Position to fund parts of the 15/16 MTEF equitable share reductions
• This financing plan therefore meant that none of the dept’s equitable share budgets were cut and service delivery spending was protected
23
Provincial Fiscal Framework
24
Table 8 Summary of provincial fiscal frameworkR thousand 2015/16 2016/17 2017/18 1. Receipts
Baseline Allocation 103 665 526 106 474 835 110 859 962 Transfer receipts from national 100 671 247 103 286 051 107 511 739
Equitable share 83 347 554 87 887 479 92 113 167 Conditional grants 17 323 693 15 398 572 15 398 572
Provincial own receipts 2 994 279 3 188 784 3 348 223 Increase / (Decrease) in allocation (1 535 759) 984 043 2 629 921
Transfer receipts from national (1 536 626) 983 471 2 635 771 Equitable share (1 093 608) (1 002 033) (683 189) Conditional grants (443 018) 1 985 504 3 318 960
Provincial own receipts 867 572 (5 850) Revised allocation 102 711 237 107 632 456 113 523 383
Transfer receipts from national 99 134 621 104 269 522 110 147 510 Equitable share (after update of formula data & fiscal consolidation cuts) 82 253 946 86 885 446 91 429 978 Conditional grants 16 880 675 17 384 076 18 717 532
Provincial own receipts 2 995 146 3 189 356 3 342 373 Provincial cash resources 581 470 173 578 33 500
2. Planned spending by departments 101 961 237 106 882 456 112 773 383
3. Contingency Reserve 750 000 750 000 750 000
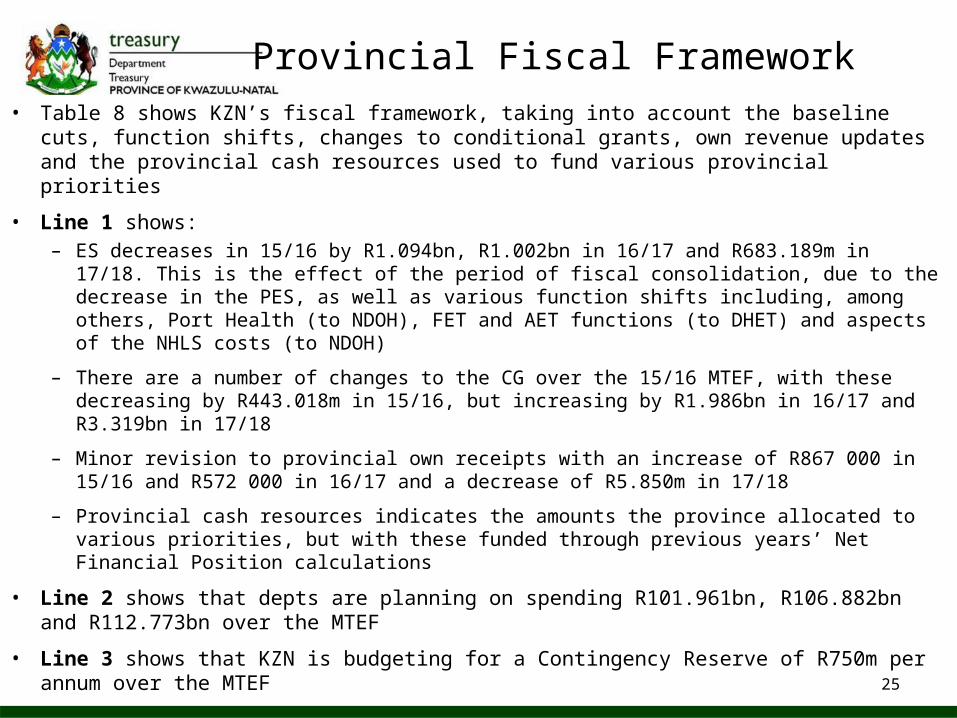
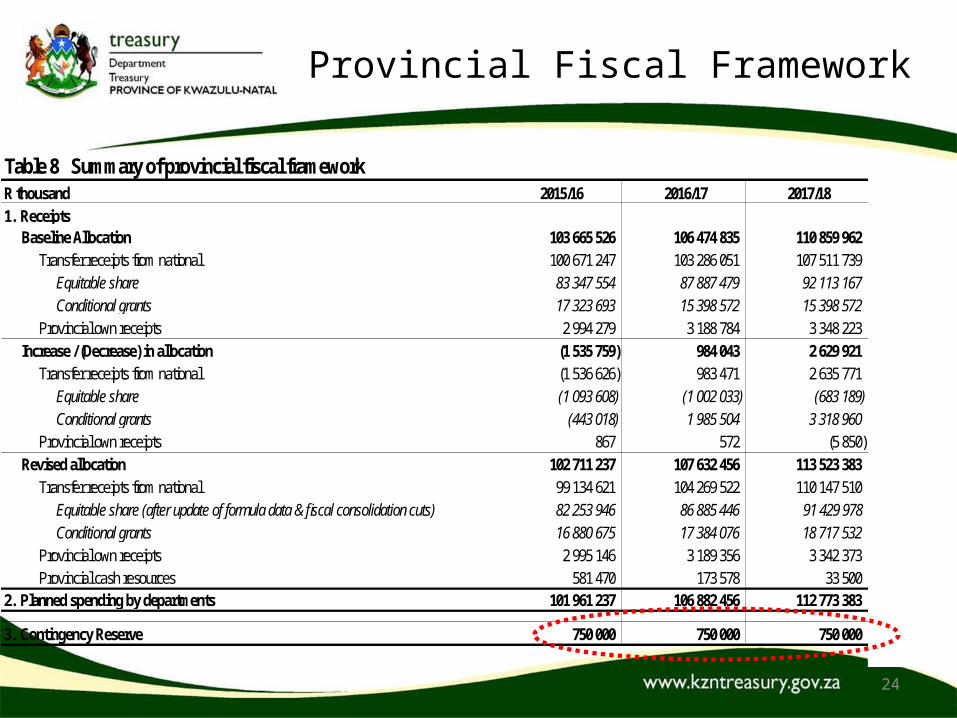
Provincial Fiscal Framework• Table 8 shows KZN’s fiscal framework, taking into account the baseline cuts, function shifts,
changes to conditional grants, own revenue updates and the provincial cash resources used to fund various provincial priorities
• Line 1 shows:– ES decreases in 15/16 by R1.094bn, R1.002bn in 16/17 and R683.189m in 17/18. This is the
effect of the period of fiscal consolidation, due to the decrease in the PES, as well as various function shifts including, among others, Port Health (to NDOH), FET and AET functions (to DHET) and aspects of the NHLS costs (to NDOH)
– There are a number of changes to the CG over the 15/16 MTEF, with these decreasing by R443.018m in 15/16, but increasing by R1.986bn in 16/17 and R3.319bn in 17/18
– Minor revision to provincial own receipts with an increase of R867 000 in 15/16 and R572 000 in 16/17 and a decrease of R5.850m in 17/18
– Provincial cash resources indicates the amounts the province allocated to various priorities, but with these funded through previous years’ Net Financial Position calculations
• Line 2 shows that depts are planning on spending R101.961bn, R106.882bn and R112.773bn over the MTEF
• Line 3 shows that KZN is budgeting for a Contingency Reserve of R750m per annum over the MTEF 25
Provincial Fiscal Framework
• The Contingency Reserve is being kept for a number of reasons:
– The outcome of the 2015 wage negotiations were not known when the 2015/16 MTEF was tabled. If NT does not fund any portion of this, the province will have to fund this from within its baseline
– The negotiations regarding the amount that the province owes to NHLS are still ongoing. This debt could place a significant demand on the provincial fiscus
– It is therefore prudent to keep a Contingency Reserve that will act as a buffer in the event that these potential cost pressures become reality
26
Provincial Fiscal Framework
• As mentioned, KZN’s conditional grant allocations are also being affected by the fiscal consolidation
• National Treasury indicated that all provincial conditional grants will be reduced by the same proportion, with the exception of a few grants that are linked to essential service delivery programmes or are smaller grants that fund important operational expenditure
– The baselines of the Comprehensive HIV and AIDS grant and the NSNP grant were protected from the cut
– The Further Education and Training (FET) Colleges grant and the Occupational Specific Dispensation (OSD) for Education Sector Therapists grant were also protected from the cut
• Budgets of KZN’s departments are presented in the next slide• Despite various cuts, there is still growth in departments’ budgets
27
Provincial Budget – 2015/16 MTEF
28
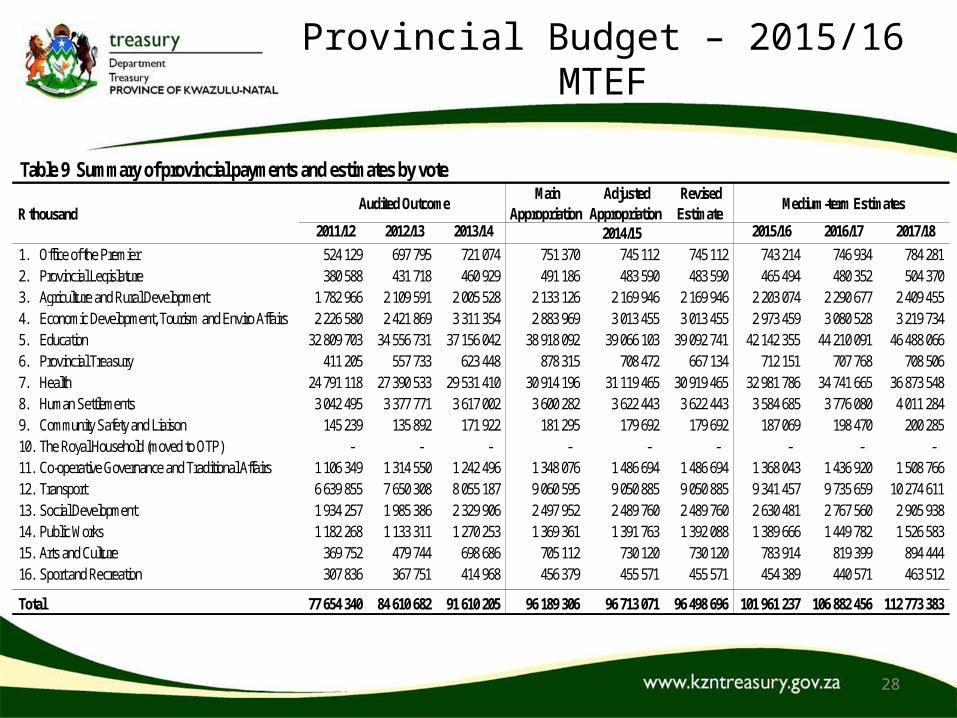
Table 9 Summary of provincial payments and estimates by vote
2011/12 2012/13 2013/14 2015/16 2016/17 2017/18
1. Office of the Premier 524 129 697 795 721 074 751 370 745 112 745 112 743 214 746 934 784 281 2. Provincial Legislature 380 588 431 718 460 929 491 186 483 590 483 590 465 494 480 352 504 370 3. Agriculture and Rural Development 1 782 966 2 109 591 2 005 528 2 133 126 2 169 946 2 169 946 2 203 074 2 290 677 2 409 455 4. Economic Development, Tourism and Enviro Affairs 2 226 580 2 421 869 3 311 354 2 883 969 3 013 455 3 013 455 2 973 459 3 080 528 3 219 734 5. Education 32 809 703 34 556 731 37 156 042 38 918 092 39 066 103 39 092 741 42 142 355 44 210 091 46 488 066 6. Provincial Treasury 411 205 557 733 623 448 878 315 708 472 667 134 712 151 707 768 708 506 7. Health 24 791 118 27 390 533 29 531 410 30 914 196 31 119 465 30 919 465 32 981 786 34 741 665 36 873 548 8. Human Settlements 3 042 495 3 377 771 3 617 002 3 600 282 3 622 443 3 622 443 3 584 685 3 776 080 4 011 284 9. Community Safety and Liaison 145 239 135 892 171 922 181 295 179 692 179 692 187 069 198 470 200 285 10. The Royal Household (moved to OTP) - - - - - - - - - 11. Co-operative Governance and Traditional Affairs 1 106 349 1 314 550 1 242 496 1 348 076 1 486 694 1 486 694 1 368 043 1 436 920 1 508 766 12. Transport 6 639 855 7 650 308 8 055 187 9 060 595 9 050 885 9 050 885 9 341 457 9 735 659 10 274 611 13. Social Development 1 934 257 1 985 386 2 329 906 2 497 952 2 489 760 2 489 760 2 630 481 2 767 560 2 905 938 14. Public Works 1 182 268 1 133 311 1 270 253 1 369 361 1 391 763 1 392 088 1 389 666 1 449 782 1 526 583 15. Arts and Culture 369 752 479 744 698 686 705 112 730 120 730 120 783 914 819 399 894 444 16. Sport and Recreation 307 836 367 751 414 968 456 379 455 571 455 571 454 389 440 571 463 512
Total 77 654 340 84 610 682 91 610 205 96 189 306 96 713 071 96 498 696 101 961 237 106 882 456 112 773 383
Audited Outcome Main
Appropriation Revised Estimate
Medium-term Estimates
2014/15
Adjusted Appropriation R thousand
Macroeconomic Framework
29
Macroeconomic Scene
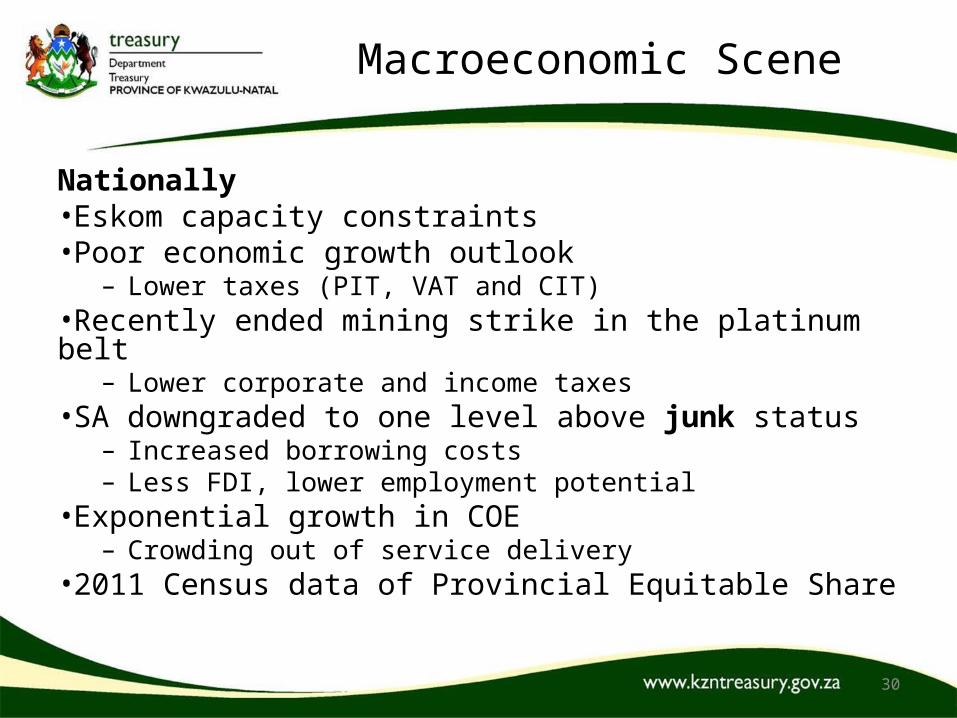
Nationally•Eskom capacity constraints•Poor economic growth outlook
– Lower taxes (PIT, VAT and CIT)•Recently ended mining strike in the platinum belt
– Lower corporate and income taxes•SA downgraded to one level above junk status
– Increased borrowing costs– Less FDI, lower employment potential
•Exponential growth in COE– Crowding out of service delivery
•2011 Census data of Provincial Equitable Share
30
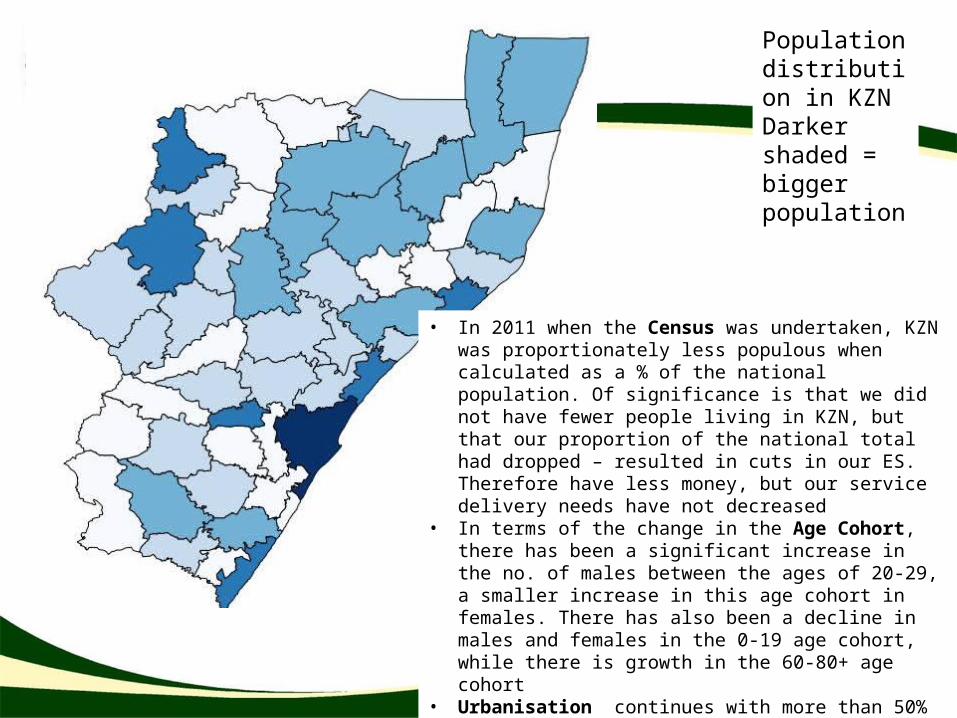
Population distribution in KZN Darker shaded = bigger population
• In 2011 when the Census was undertaken, KZN was proportionately less populous when calculated as a % of the national population. Of significance is that we did not have fewer people living in KZN, but that our proportion of the national total had dropped – resulted in cuts in our ES. Therefore have less money, but our service delivery needs have not decreased
• In terms of the change in the Age Cohort, there has been a significant increase in the no. of males between the ages of 20-29, a smaller increase in this age cohort in females. There has also been a decline in males and females in the 0-19 age cohort, while there is growth in the 60-80+ age cohort
• Urbanisation continues with more than 50% of the KZN province expected to live in urban areas by 2024
• The unemployment rate (expanded definition) has increased from 38.53% in Q2 of 2011, to 40.42% in Q1 of 2015
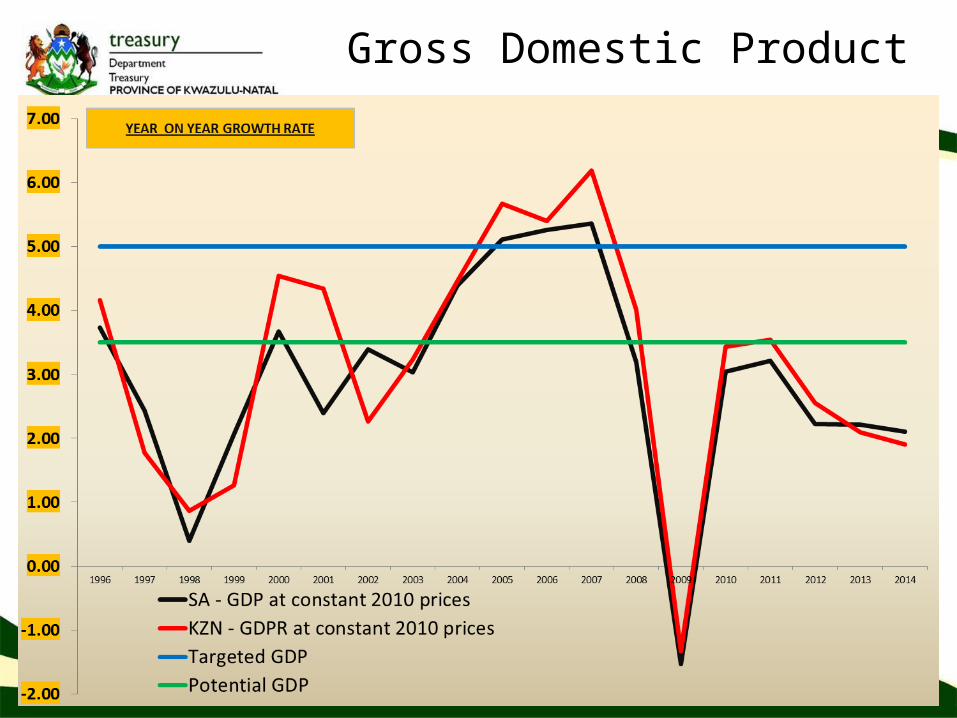
Gross Domestic Product
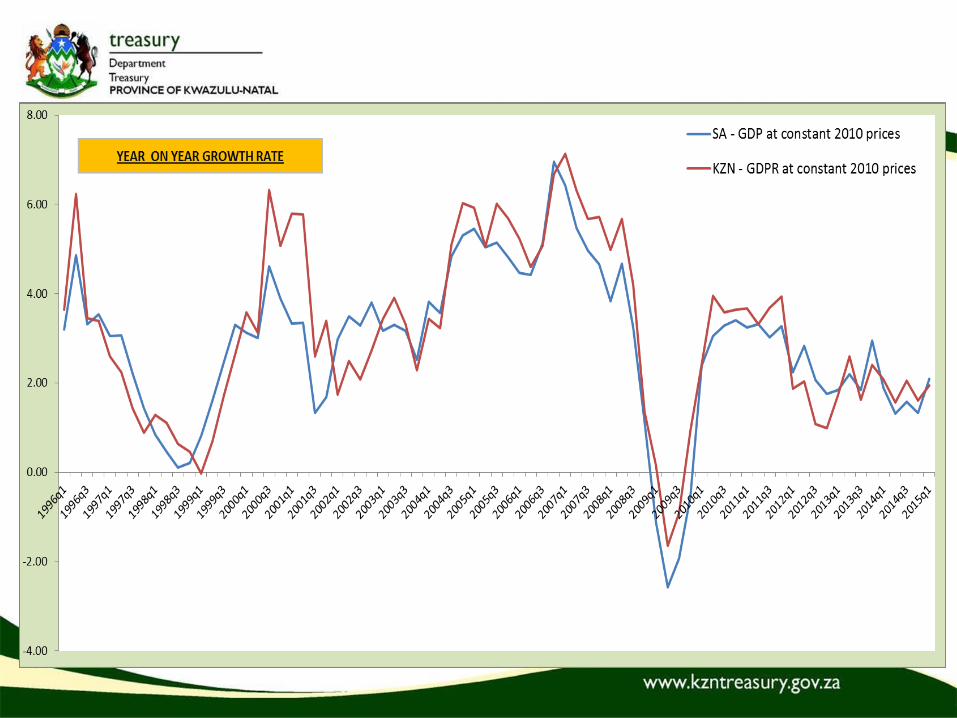
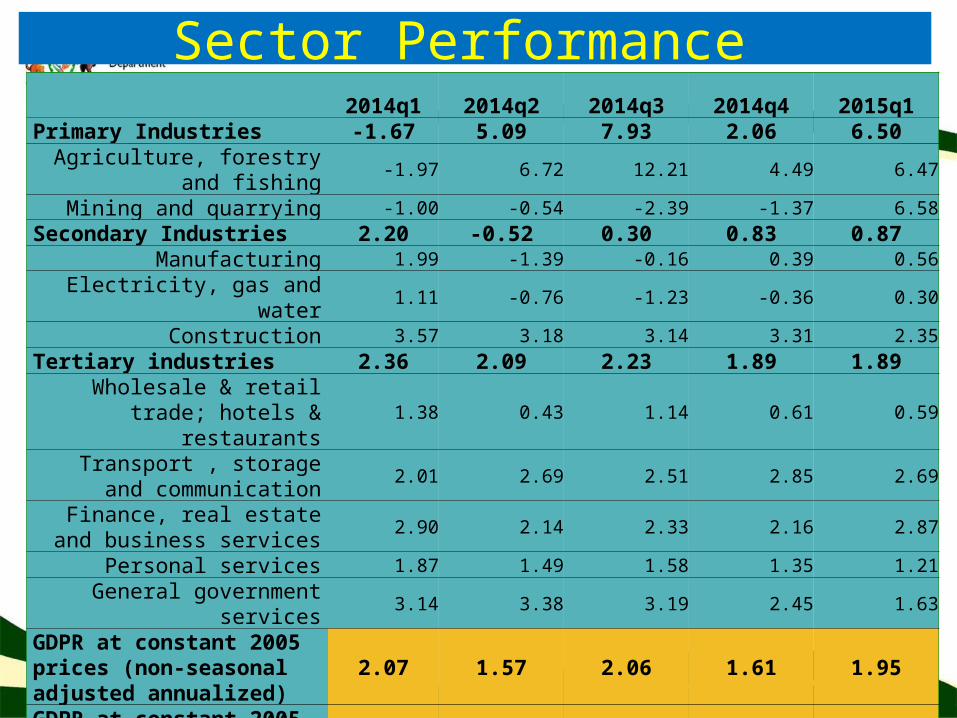
Sector Performance 2014q1 2014q2 2014q3 2014q4 2015q1
Primary Industries -1.67 5.09 7.93 2.06 6.50Agriculture, forestry and
fishing-1.97 6.72 12.21 4.49 6.47
Mining and quarrying -1.00 -0.54 -2.39 -1.37 6.58Secondary Industries 2.20 -0.52 0.30 0.83 0.87
Manufacturing 1.99 -1.39 -0.16 0.39 0.56Electricity, gas and water 1.11 -0.76 -1.23 -0.36 0.30
Construction 3.57 3.18 3.14 3.31 2.35Tertiary industries 2.36 2.09 2.23 1.89 1.89
Wholesale & retail trade; hotels & restaurants
1.38 0.43 1.14 0.61 0.59
Transport , storage and communication
2.01 2.69 2.51 2.85 2.69
Finance, real estate and business services
2.90 2.14 2.33 2.16 2.87
Personal services 1.87 1.49 1.58 1.35 1.21General government services 3.14 3.38 3.19 2.45 1.63
GDPR at constant 2005 prices (non-seasonal adjusted annualized)
2.07 1.57 2.06 1.61 1.95
GDPR at constant 2005 prices (seasonal adjusted annualized)
2.35 1.43 1.87 1.66 1.76
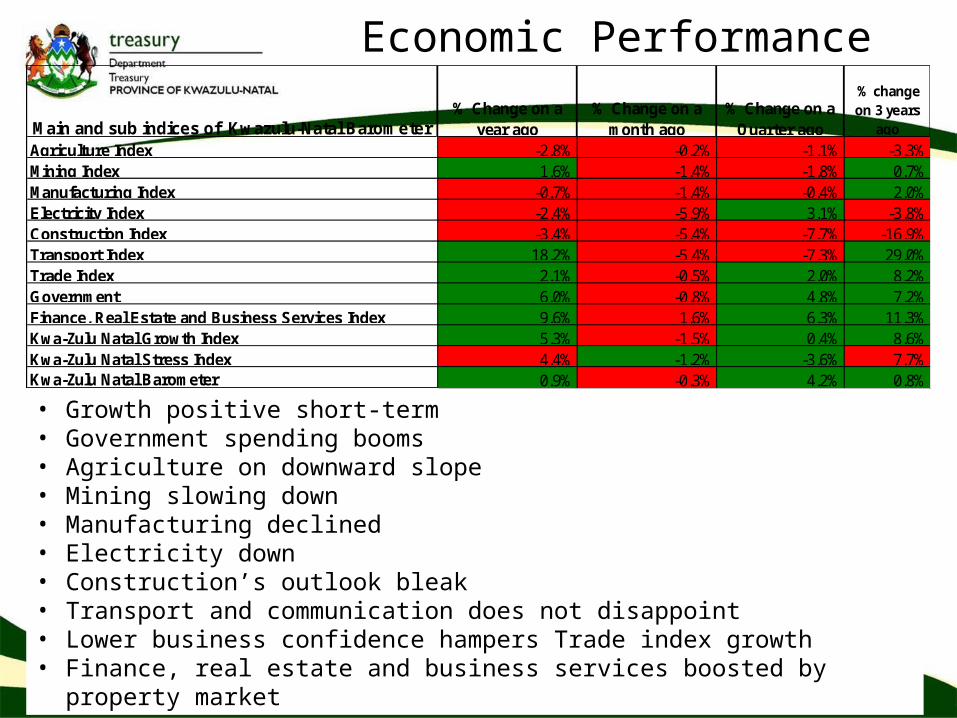
Main and sub indices of Kwazulu-Natal Barometer% Change on a
year ago% Change on a
month ago% Change on a
Quarter ago
% change on 3 years
ago
Agriculture Index -2.8% -0.2% -1.1% -3.3%Mining Index 1.6% -1.4% -1.8% 0.7%Manufacturing Index -0.7% -1.4% -0.4% 2.0%Electricity Index -2.4% -5.9% 3.1% -3.8%Construction Index -3.4% -5.4% -7.7% -16.9%Transport Index 18.2% -5.4% -7.3% 29.0%Trade Index 2.1% -0.5% 2.0% 8.2%Government 6.0% -0.8% 4.8% 7.2%Finance, Real Estate and Business Services Index 9.6% 1.6% 6.3% 11.3%Kwa-Zulu Natal Growth Index 5.3% -1.5% 0.4% 8.6%Kwa-Zulu Natal Stress Index 4.4% -1.2% -3.6% 7.7%Kwa-Zulu Natal Barometer 0.9% -0.3% 4.2% 0.8%
• Growth positive short-term• Government spending booms• Agriculture on downward slope• Mining slowing down• Manufacturing declined• Electricity down• Construction’s outlook bleak• Transport and communication does not disappoint• Lower business confidence hampers Trade index growth • Finance, real estate and business services boosted by property market
Economic Performance
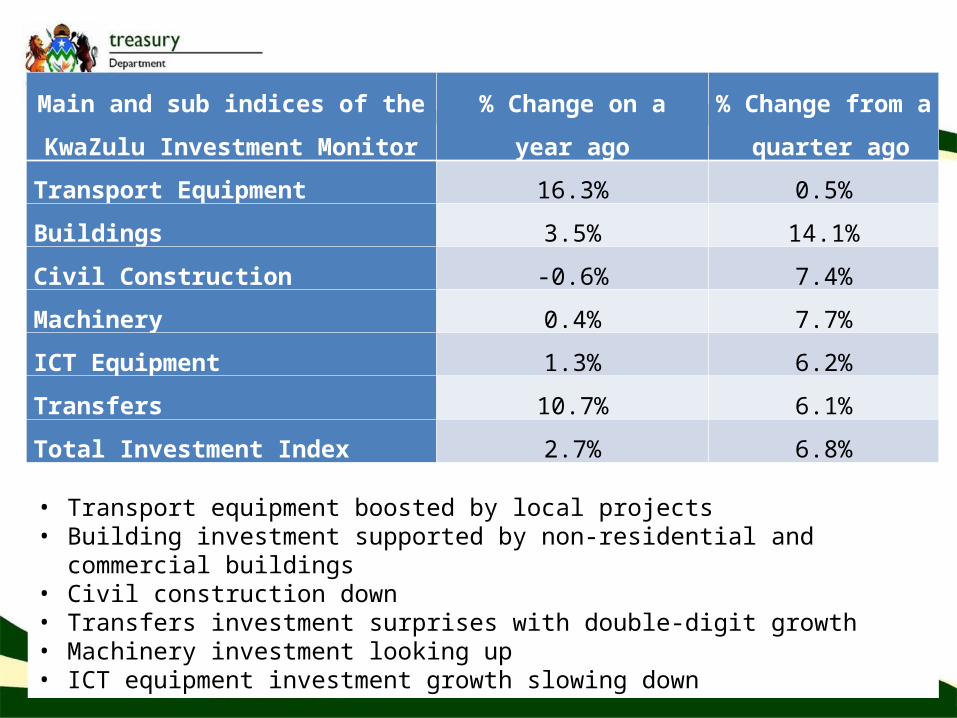
• Transport equipment boosted by local projects• Building investment supported by non-residential and commercial buildings• Civil construction down• Transfers investment surprises with double-digit growth• Machinery investment looking up• ICT equipment investment growth slowing down
Main and sub indices of the KwaZulu
Investment Monitor % Change on a year ago
% Change from a
quarter ago
Transport Equipment 16.3% 0.5%
Buildings 3.5% 14.1%
Civil Construction -0.6% 7.4%
Machinery 0.4% 7.7%
ICT Equipment 1.3% 6.2%
Transfers 10.7% 6.1%
Total Investment Index 2.7% 6.8%
Summary of KZN’s economic outlook
• The economic outlook for KZN is somewhat less optimistic than last year and earlier (January 2015) expectations, despite the lower oil price, which has already and will continue to put pressure on inflation which in turn will keep interest rates lower for longer
• The lower oil price has also, to some degree, improved the current depressed levels of consumer confidence and has given consumers some debt breathing space
• The weaker exchange rate and moderate improvement in global economic conditions should also support the KZN manufacturing and transport sectors
• Unfortunately, continued electricity constraints, labour concerns, logistical bottlenecks, digital un-competitiveness and economic policy divide will hamper the growth prospects for 2015
• Provincial economic growth is therefore estimated at 1.8 per cent for 2015 compared to 2.1 per cent estimated in January 2015
Provincial Growth and Development Strategy and
Plan(and Poverty Eradication
Master Plan)
39
Working Together For A Secure and Prosperous Future.
Macro Policy Focus on Eradication of Poverty firmly embedded in the
National Development Plan and the 2014- 19 MTSF
40
Providing leadership towards achieving KZN Vision 2030.41
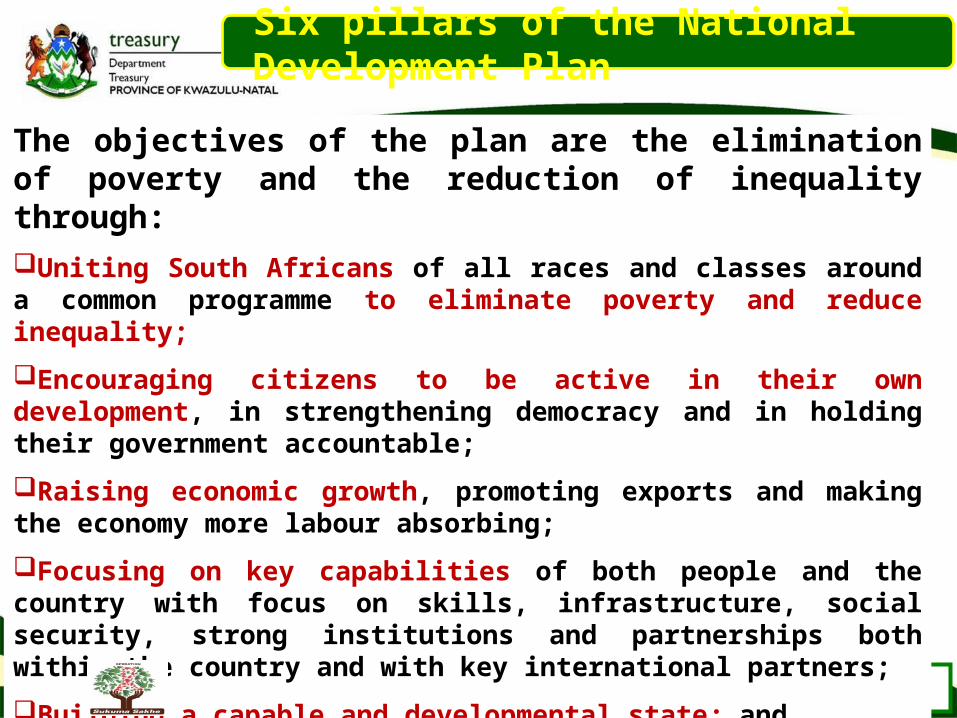
The objectives of the plan are the elimination of poverty and the reduction of inequality through:Uniting South Africans of all races and classes around a common programme to eliminate poverty and reduce inequality;
Encouraging citizens to be active in their own development, in strengthening democracy and in holding their government accountable;
Raising economic growth, promoting exports and making the economy more labour absorbing;
Focusing on key capabilities of both people and the country with focus on skills, infrastructure, social security, strong institutions and partnerships both within the country and with key international partners;
Building a capable and developmental state; and
Strong leadership throughout society that work together to solve our problems
Six pillars of the National Development Plan
Working Together For A Secure and Prosperous Future.42
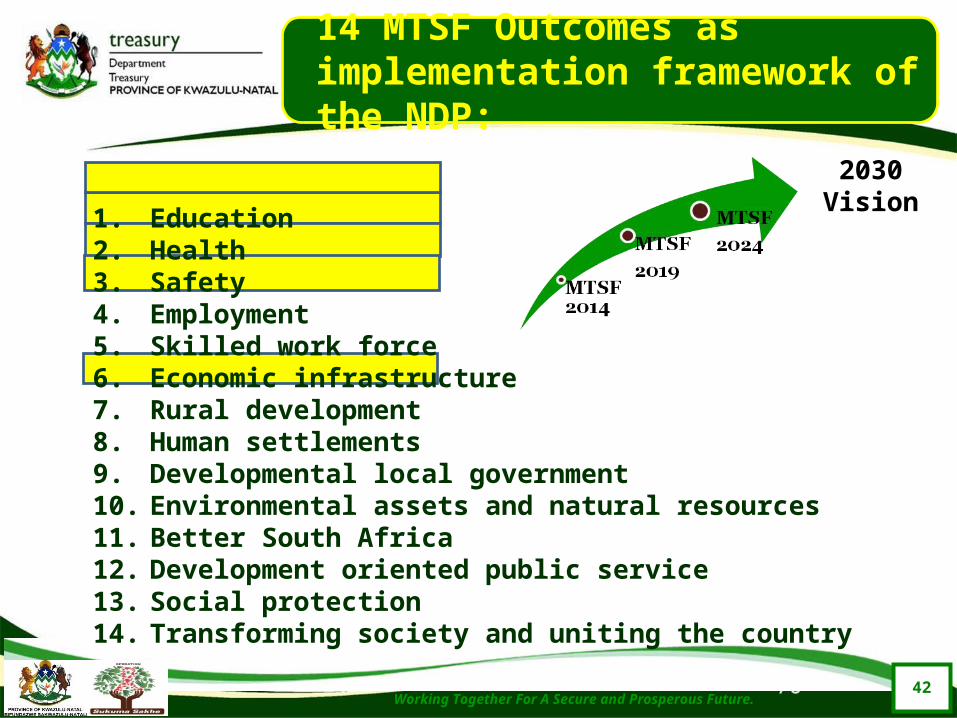
1. Education 2. Health3. Safety4. Employment 5. Skilled work force 6. Economic infrastructure7. Rural development 8. Human settlements 9. Developmental local government 10. Environmental assets and natural resources 11. Better South Africa 12. Development oriented public service 13. Social protection 14. Transforming society and uniting the country
2030 Vision
14 MTSF Outcomes as implementation framework of the NDP:
Working Together For A Secure and Prosperous Future.
Macro Policy Focus on Eradication of Poverty firmly embedded in the
Provincial Growth and Development Strategy and Plan
43
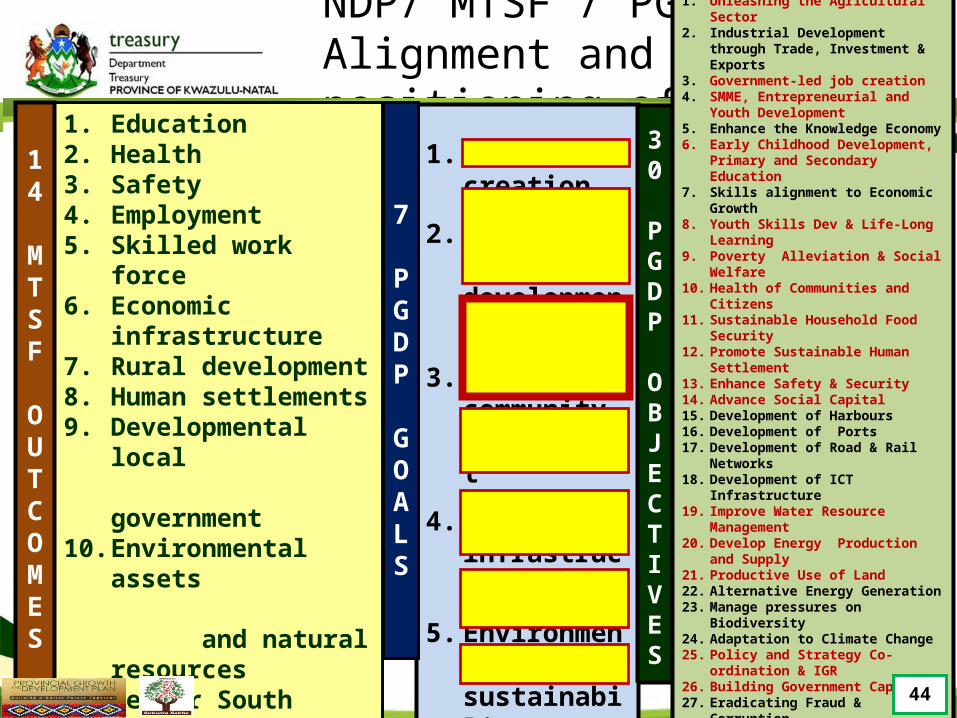
NDP/ MTSF / PGDP Alignment and positioning of OSS
1. Education 2. Health3. Safety4. Employment 5. Skilled work force 6. Economic infrastructure7. Rural development 8. Human settlements 9. Developmental local
government 10. Environmental assets
and natural resources
11. Better South Africa 12. Development oriented
public service
13. Social protection 14. Transforming society
and uniting the country
1. Job creation
2. Human resource development
3. Human and community development
4. Strategic infrastructure
5. Environmental sustainability
6. Policy and governance
7. Spatial equity
14
MTSF
OUTCOMES
7
PGDP
GOALS
30
PGDP
OBJ ECTI VE S
1. Unleashing the Agricultural Sector 2. Industrial Development through Trade,
Investment & Exports3. Government-led job creation 4. SMME, Entrepreneurial and Youth
Development5. Enhance the Knowledge Economy6. Early Childhood Development, Primary
and Secondary Education7. Skills alignment to Economic Growth8. Youth Skills Dev & Life-Long Learning9. Poverty Alleviation & Social Welfare10. Health of Communities and Citizens11. Sustainable Household Food Security 12. Promote Sustainable Human Settlement13. Enhance Safety & Security 14. Advance Social Capital15. Development of Harbours 16. Development of Ports17. Development of Road & Rail Networks18. Development of ICT Infrastructure19. Improve Water Resource Management20. Develop Energy Production and Supply21. Productive Use of Land 22. Alternative Energy Generation23. Manage pressures on Biodiversity24. Adaptation to Climate Change 25. Policy and Strategy Co-ordination & IGR26. Building Government Capacity 27. Eradicating Fraud & Corruption28. Participative Governance 29. Promoting Spatial Concentration 30. Integrated Land Man & Spatial Planning
44
45
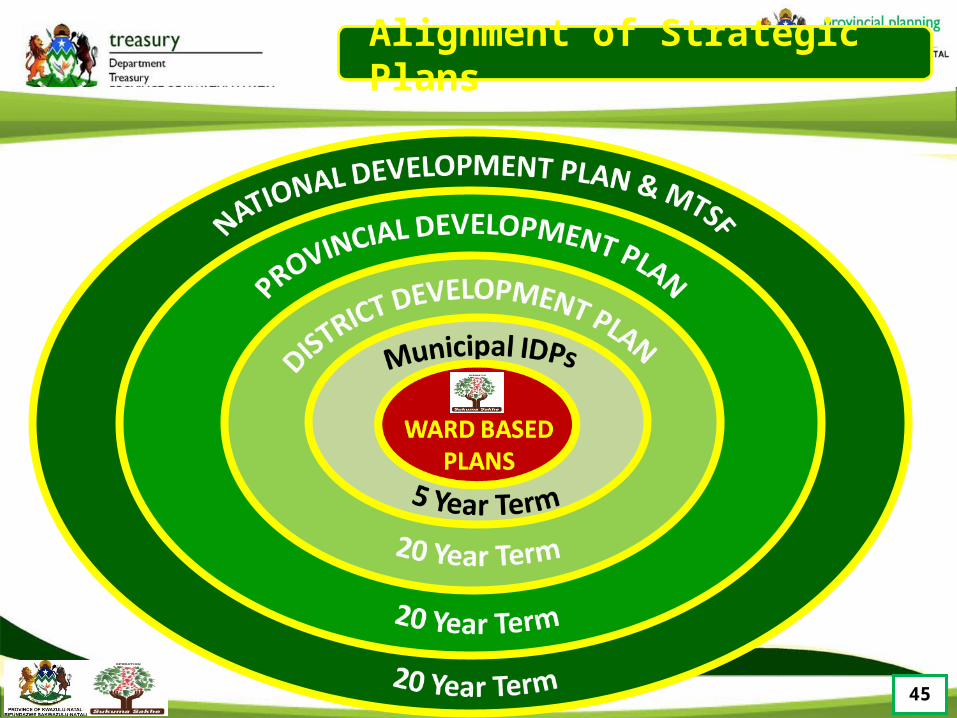
Alignment of Strategic Plans
307Vision2030
Aspire to …
STRATEGIC GOALS
STRATEGIC OBJECTIVES
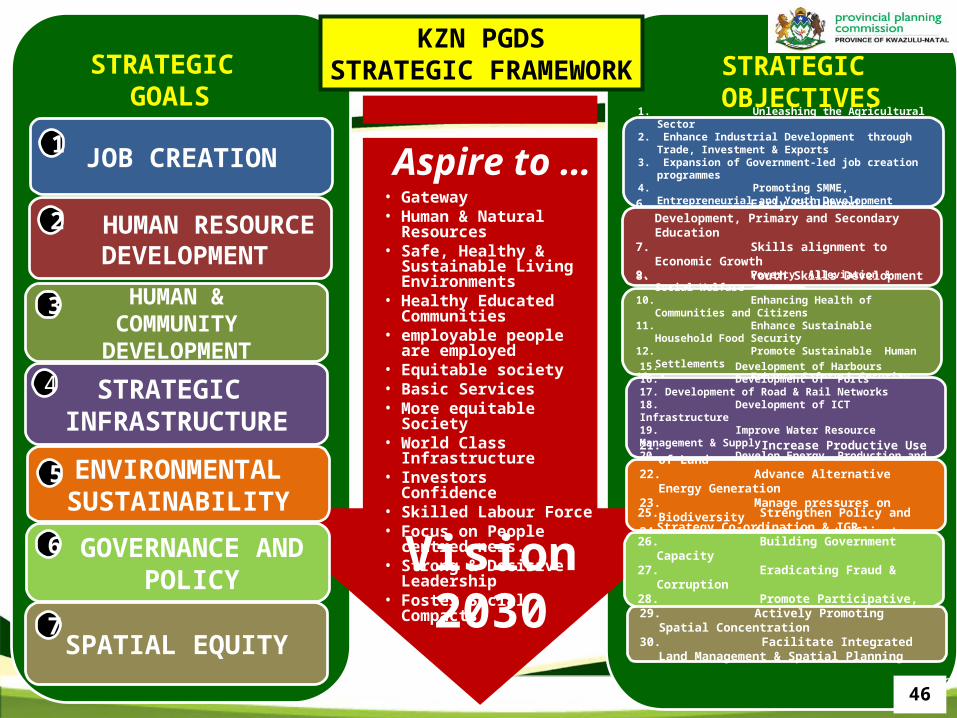
KZN PGDSSTRATEGIC FRAMEWORK
• Gateway• Human & Natural Resources• Safe, Healthy & Sustainable
Living Environments• Healthy Educated
Communities• employable people are
employed• Equitable society• Basic Services• More equitable Society• World Class Infrastructure• Investors Confidence • Skilled Labour Force• Focus on People centred-
ness.• Strong & Decisive Leadership• Foster Social Compacts
JOB CREATION1
GOVERNANCE AND POLICY
6
ENVIRONMENTAL SUSTAINABILITY
5
STRATEGIC INFRASTRUCTURE
4
HUMAN RESOURCE DEVELOPMENT
2
SPATIAL EQUITY7
HUMAN &COMMUNITY DEVELOPMENT3
1. Unleashing the Agricultural Sector 2. Enhance Industrial Development through Trade, Investment
& Exports3. Expansion of Government-led job creation programmes 4. Promoting SMME, Entrepreneurial and Youth Development5. Enhance the Knowledge Economy
6. Early Childhood Development, Primary and Secondary Education
7. Skills alignment to Economic Growth8. Youth Skills Development & Life-Long Learning
9. Poverty Alleviation & Social Welfare10. Enhancing Health of Communities and Citizens11. Enhance Sustainable Household Food Security 12. Promote Sustainable Human Settlements13. Enhance Safety & Security 14. Advance Social Capital15. Development of Harbours 16. Development of Ports17. Development of Road & Rail Networks18. Development of ICT Infrastructure19. Improve Water Resource Management & Supply20. Develop Energy Production and Supply 21. Increase Productive Use of Land 22. Advance Alternative Energy Generation23. Manage pressures on Biodiversity24. Adaptation to Climate Change
25. Strengthen Policy and Strategy Co-ordination & IGR26. Building Government Capacity 27. Eradicating Fraud & Corruption28. Promote Participative, Facilitative & Accountable
Governance
29. Actively Promoting Spatial Concentration 30. Facilitate Integrated Land Management & Spatial
Planning
4646
Working Together For A Secure and Prosperous Future.
Poverty Eradication Master Plan prepared through an Operation
Phakisa Labs approach, adopted by the Provincial Executive Council and
now ready for
IMPLEMENTATION
47
Working Together For A Secure and Prosperous Future.48
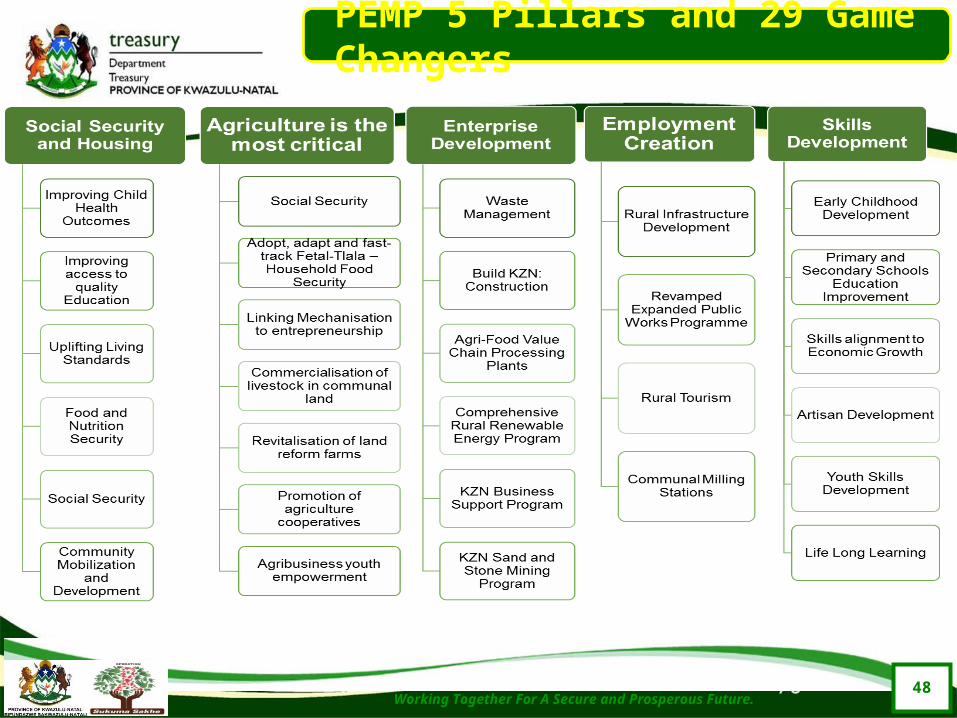
PEMP 5 Pillars and 29 Game Changers
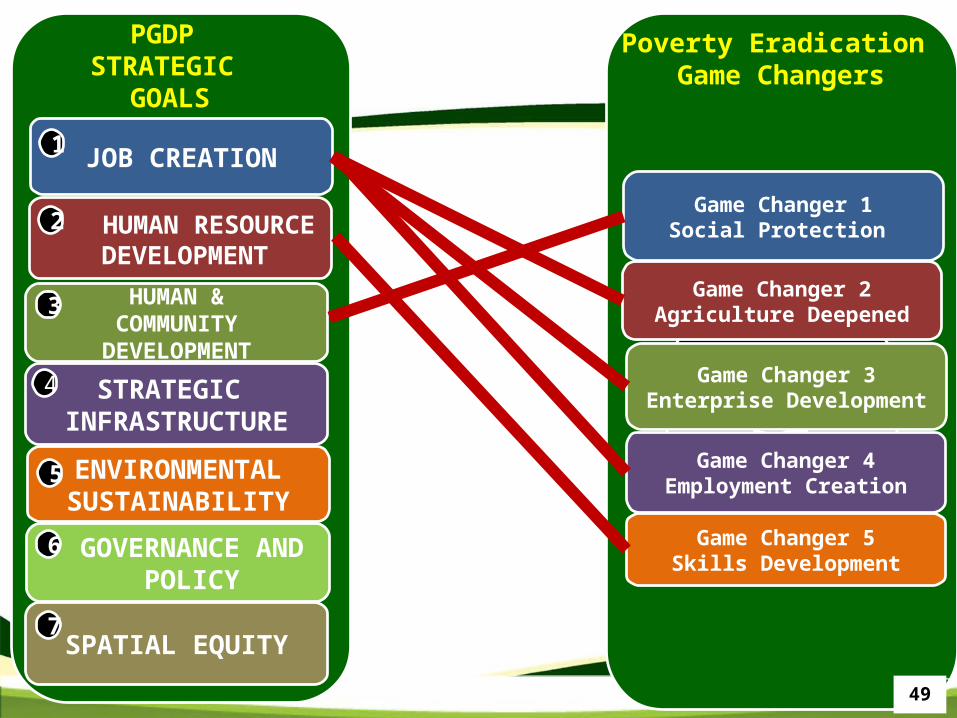
57Vision2030
Aspire to …
PGDP STRATEGIC
GOALS
Poverty Eradication Game Changers
JOB CREATION1
GOVERNANCE AND POLICY
6
ENVIRONMENTAL SUSTAINABILITY
5
STRATEGIC INFRASTRUCTURE
4
HUMAN RESOURCE DEVELOPMENT
2
SPATIAL EQUITY7
HUMAN &COMMUNITY DEVELOPMENT3
Game Changer 1Social Protection
Game Changer 2Agriculture Deepened
Game Changer 3Enterprise Development
Game Changer 4Employment Creation
Game Changer 5Skills Development
4949
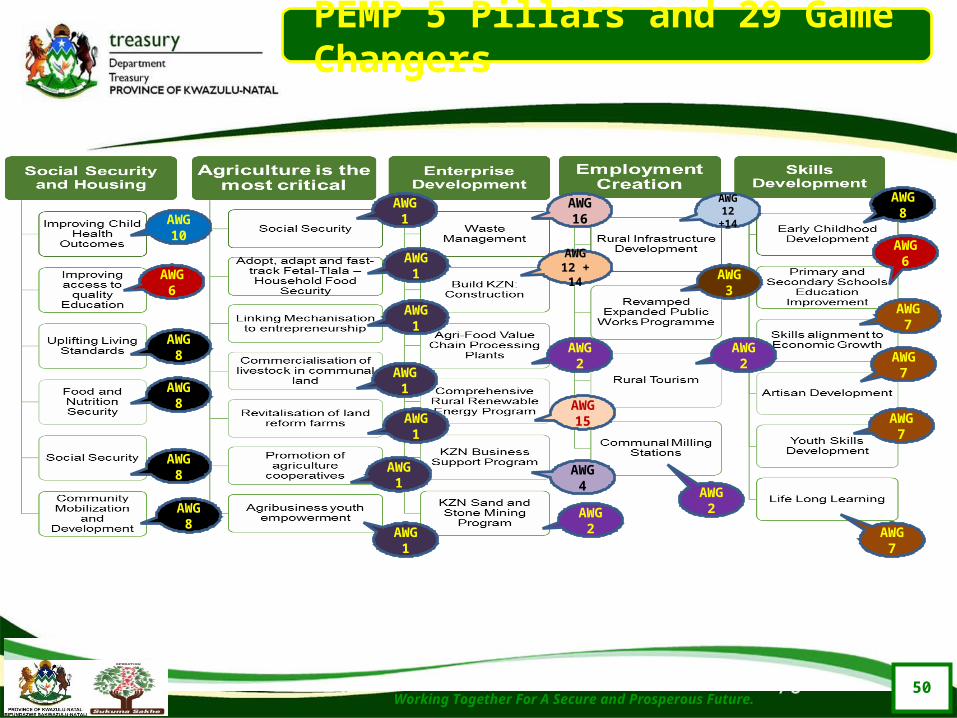
Working Together For A Secure and Prosperous Future.50
PEMP 5 Pillars and 29 Game Changers
AWG 10
AWG 6
AWG 8
AWG 8
AWG 8
AWG 8
AWG 1
AWG 1
AWG 1
AWG 1
AWG 1
AWG 1
AWG 1
AWG 16
AWG 12 + 14
AWG 2
AWG 15
AWG 4
AWG 2
AWG 12 +14
AWG 3
AWG 2
AWG 2
AWG 8
AWG 6
AWG 7
AWG 7
AWG 7
AWG 7
Working Together For A Secure and Prosperous Future.
Institutional Framework and Structure for implementing the Poverty Eradication Master Plan
51
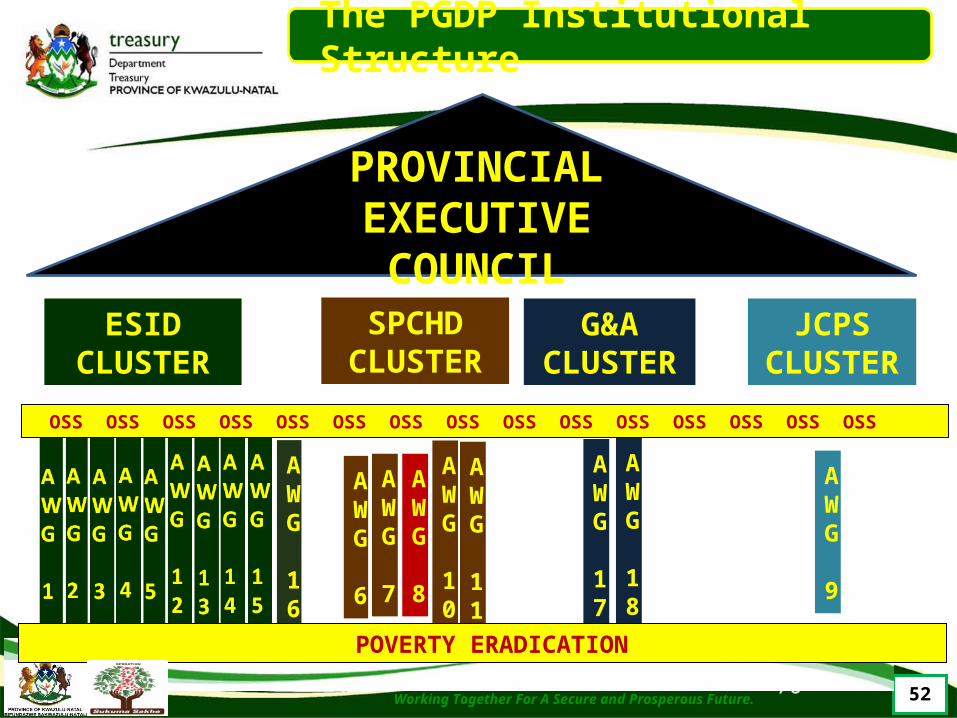
52
AWG
9
AWG
6
AWG
7
AWG
8
AWG
10
AWG
11
AWG
16
AWG
17
AWG
18
ESIDCLUSTER
SPCHDCLUSTER
G&ACLUSTER
JCPSCLUSTER
PROVINCIAL EXECUTIVE COUNCIL
The PGDP Institutional Structure
Working Together For A Secure and Prosperous Future.
OSS OSS OSS OSS OSS OSS OSS OSS OSS OSS OSS OSS OSS OSS OSS
POVERTY ERADICATION
Providing leadership towards achieving KZN Vision 2030.53
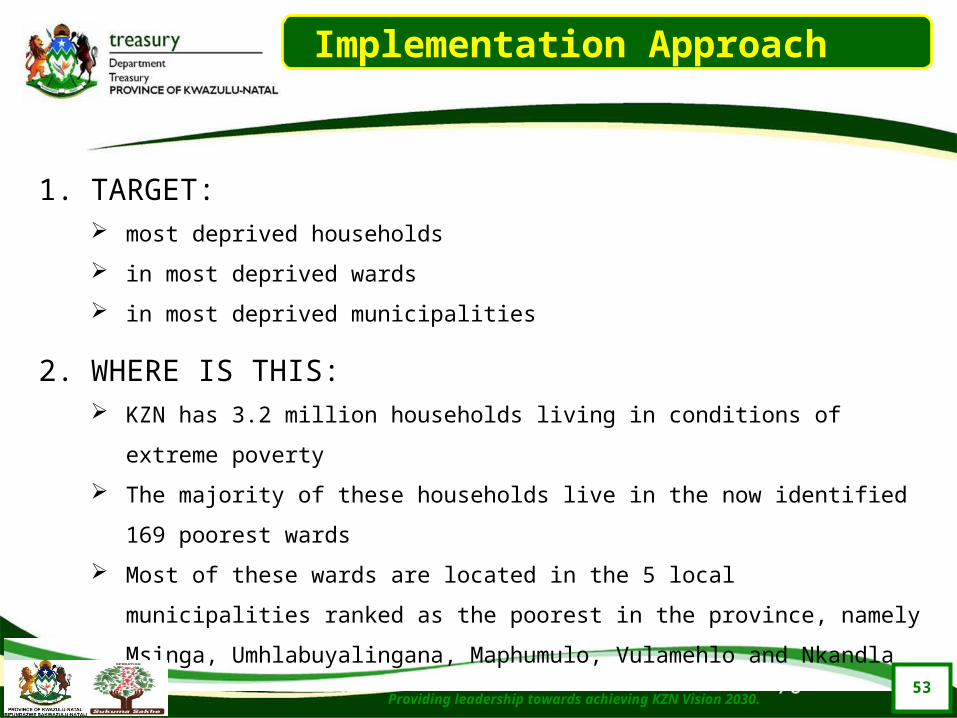
Implementation Approach
1. TARGET: most deprived households
in most deprived wards
in most deprived municipalities
2. WHERE IS THIS: KZN has 3.2 million households living in conditions of extreme poverty
The majority of these households live in the now identified 169 poorest
wards
Most of these wards are located in the 5 local municipalities ranked as the
poorest in the province, namely Msinga, Umhlabuyalingana, Maphumulo,
Vulamehlo and Nkandla
Providing leadership towards achieving KZN Vision 2030.54
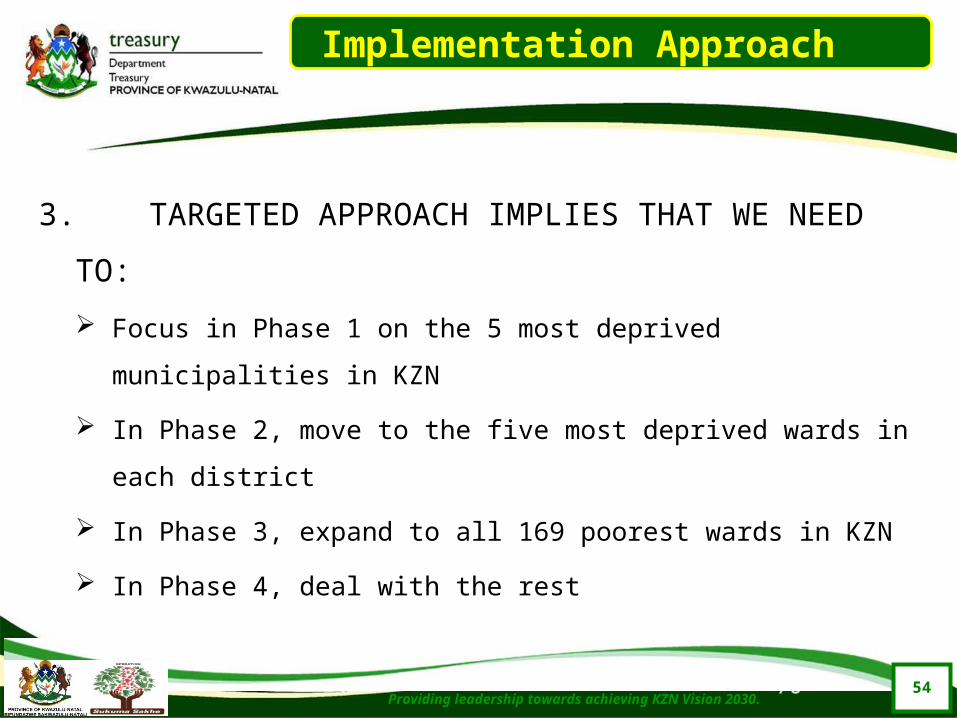
Implementation Approach
3. TARGETED APPROACH IMPLIES THAT WE NEED TO:
Focus in Phase 1 on the 5 most deprived municipalities in KZN
In Phase 2, move to the five most deprived wards in each district
In Phase 3, expand to all 169 poorest wards in KZN
In Phase 4, deal with the rest
Providing leadership towards achieving KZN Vision 2030.55
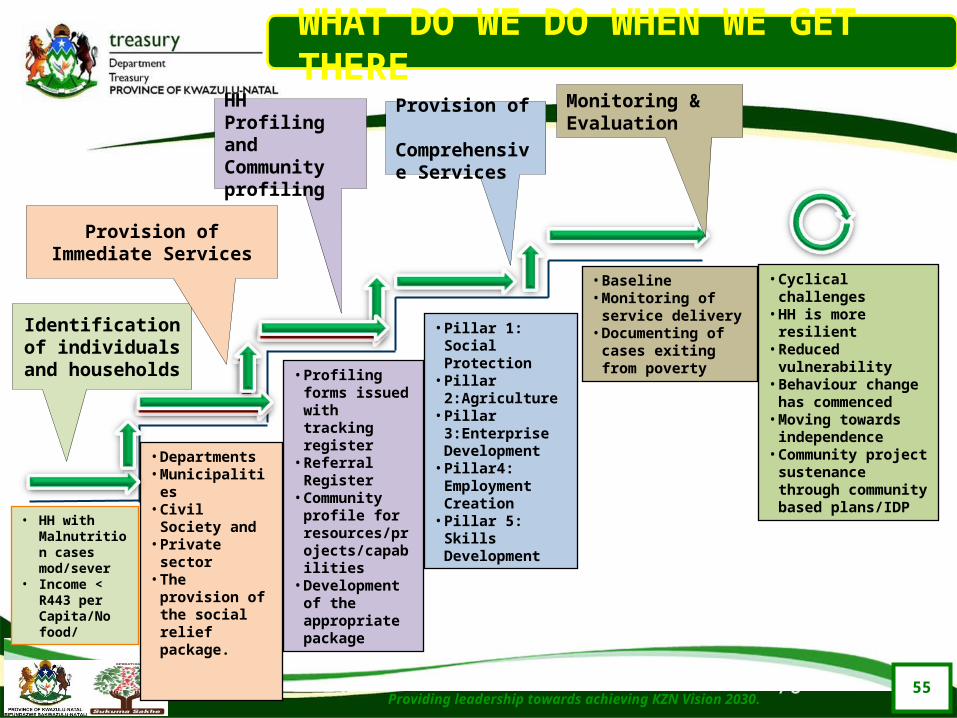
WHAT DO WE DO WHEN WE GET THERE
• HH with Malnutrition cases mod/sever
• Income < R443 per Capita/No food/
• Departments• Municipalities
• Civil Society and
• Private sector
• The provision of the social relief package.
• Profiling forms issued with tracking register
• Referral Register
• Community profile for resources/projects/capabilities
• Development of the appropriate package
• Pillar 1: Social Protection
• Pillar 2:Agriculture
• Pillar 3:Enterprise Development
• Pillar4: Employment Creation
• Pillar 5: Skills Development
• Baseline• Monitoring of service delivery
• Documenting of cases exiting from poverty
• Cyclical challenges
• HH is more resilient
• Reduced vulnerability
• Behaviour change has commenced
• Moving towards independence
• Community project sustenance through community based plans/IDP
Identification of individuals
and households
Provision of Immediate Services
HH Profiling and Community profiling
Monitoring & EvaluationProvision of
Comprehensive Services
Thank You
56