Embed Size (px)
Citation preview

1
Massachusetts Water Resources Authority
Presentation to the
Energy Leaders Roundtable
Implementation of Energy Initiatives at Massachusetts Water Resources Authority
Kristen Patneaude, Program Manager Energy ManagementDenise Breiteneicher, Project Manager Technical Services
September 15, 2010

2
Massachusetts Water Resources Authority
Presentation Summary – Supply Side Management
• MWRA Background
• Energy Usage Overview
• Competitive Electricity Supply Contracts
• Self-Generated Renewable Energy
• Development, Funding and Procurement of Renewable Energy

3
MWRA’s Mission
• MWRA was created in 1984 to assume responsibility for the water and sewer infrastructure serving greater Boston, and to end the pollution of Boston Harbor from obsolete treatment plants
• MWRA was created as an independent authority charged with raising its revenue from ratepayers, bond sales and grants
• MWRA was also charged with promotion and enforcement of water conservation and planning for the future

4
MWRA Service Area
• MWRA provides wholesale water and wastewater services to over 2.5 million customers in 61 communities
• On average, MWRA delivers 215 million gallons per day to its water customers
• MWRA collects and treats an average of 350 million gallons of wastewater per day, with a peak capacity of 1.2 billion gallons

5
Leading By Example
• As a leading environmental agency, MWRA has been successfully meeting the goals established in Governor Patrick’s Executive Order 484 (April 2007).
• Goals include:- Overall Reduction of Energy Consumption- Increase Renewable On-site Energy Production- Purchase of Renewable Energy
• Governor Patrick visit to Deer Island in August 2009: "No state agency is leading by example better than the MWRA”

6
MWRA Facilities
Wastewater- 2 Treatment Plants
• Deer Island• Clinton
- 12 Pump Stations- 4 Headworks- 5 CSO Facilities
Water- 2 Treatment Plants
• CWTP• Quabbin
-10 Pump Stations
7
MWRA Energy Usage
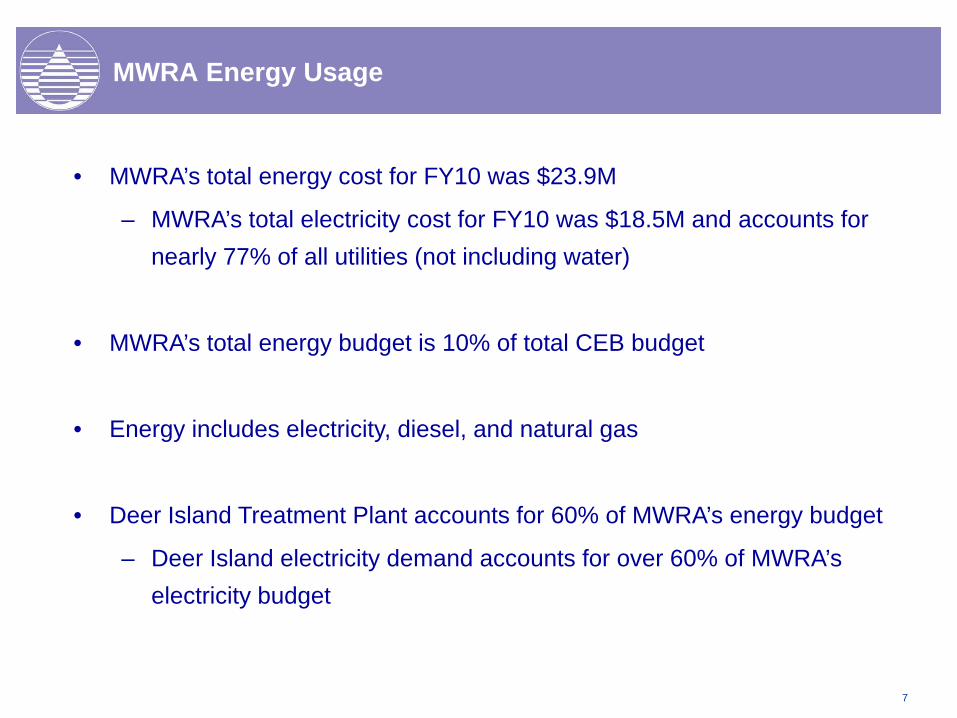
• MWRA’s total energy cost for FY10 was $23.9M
– MWRA’s total electricity cost for FY10 was $18.5M and accounts for nearly 77% of all utilities (not including water)
• MWRA’s total energy budget is 10% of total CEB budget
• Energy includes electricity, diesel, and natural gas
• Deer Island Treatment Plant accounts for 60% of MWRA’s energy budget
– Deer Island electricity demand accounts for over 60% of MWRA’s electricity budget

8
Competitive Electricity Supply Contracts
• Total MWRA annual electricity purchases 168,500,000kWh (19.2MW)
• 70 total electricity accounts– Deer Island account 70% of usage (62% cost)– Interval accounts 26% usage (31% cost)– Profile accounts 4% usage (7% cost)
• First competitive power supply contract for Deer Island in 2001– Single account– Large load– Block fixed pricing
• Re-sale of unused blockReal-time pricing
• Added other accounts in 2006– Interval accounts – 25 larger consumption time of use
• Portion of load fixed price– Profile accounts – 44 smaller consumption
• All-in fixed price

9
Competitive Electricity Supply Contracts
• Contract terms and structures modified over time (durations, block sizing, green energy)
• Contract structures offer a balance of budget certainty and acceptable risk (currently 60% fixed pricing)
• Bids taken in spring and fall during typical downward trend in energy market
• Diversify portfolio (structure and contract duration) to avoid potential risk of procurement in unpredictable energy market
• MWRA competitive suppliers - Hess, Constellation, TransCanada,

10
Self-Generated Renewable Energy
• MWRA self-generated over 40% of it’s energy demand in FY10 from Deer Island Renewable Energy assets– Digester gas heat supply– Digester gas STG electricity– Hydro electricity– Wind– Solar
• Deer Island Renewable Energy assets generated over 16% (35M kWh/yr) of MWRA’s total electricity demand (215M kWh/yr) in FY10– Or 22% of Deer Island total electricity demand (164M kWh/yr)
• Other MWRA existing and future renewable energy assets also include hydroelectric, wind, and solar

11
Deer Island RPS Credits, $523,000 Oakdale Hydro,
$811,100
Cosgrove Hydro, $213,400
CWTP Demand Response, $130,000
Deer Island Demand Response, $900,000
Non-rate Revenues
• MWRA generated $2.5 million from energy sources in FY10

12
Technical Assistance for Renewable Energy Projects
• Technical Assistance Engineering As-Needed Contracts
• Renewable Energy Technical Assistance Contracts Wind– Solar– Energy Efficiency– Emerging Technologies

13
Funding of Renewable Energy Projects
• MA Clean Energy Center (formerly Massachusetts Technology Collaborative)– Community Wind Collaborative– LORI Program– Commonwealth Solar– Commonwealth Wind– Commonwealth Hydro– www.masscec.com
• Clean Renewable Energy Bonds (CREBs)
• ARRA Stimulus Funding– State Revolving Loan Fund (SRF) – Green Infrastructure– MA Solar Stimulus
• Power Purchase Agreements

14
Procurement for Capital Projects
• Traditional procurement – Design: Development of 100% design documents– Bid: Public opening of sealed bids in accordance with M.G.L.
c.30 or M.G.L. c.149– Build: Construction as specified in contract documents
• Alternate procurement– Energy Management under M.G.L. c.25A, sec. 11C
• Cogeneration project with a term not more than 20 years

15
Procurement for Capital Renewable Energy Projects
• Design Build Contracts under M.G.L. c.25A, sec. 11C
– Bids documents include 20% design and other special site specifications
– MWRA procurement practices - 2 step process• Minimum threshold qualifications (experience, finances, etc.)• Lump sum bid (low $ or $/kWh)
– Can do best value– Reduces time for projection completion– Provides cost competitiveness – Elimination or reduction in change orders

16
MWRA Procurement for Capital Renewable Energy Projects
• MWRA Design Build Contracts under M.G.L. c.25A, sec. 11CProject Name Project Rating Total Project Cost Evaluation Method
Deer Island Residuals Odor Control PV
100 kW $850,000 lowest $/kWh
Deer Island Maintenance Building PV
180 kW $1,119,000 lowest $/kWh
Carroll Water Treatment Plant PV
496 kW $2,187,414 Best value
Deer Island Power Purchase Agreement PV
456 kW N/A Lowest NPV of 20 yr contract cost
Deer Island Wind 2 at 600 kW $3,998,500 lowest $
Charlestown Wind 1500 kW $4,686,500 lowest $
Deer Island Backpressure STG
1100 kW $1,338,000 lowest $
• Traditional M.G.L. c.30 Procurement for Loring Rd hydroelectric project– 200kW, Design - $102,000, Construction - $1,857,000

17
Deer Island Wind Turbine Installation

18
MWRA Energy Conservation Projects for Wastewater and Water Facilities

19
Energy Audits
• Energy audits have been completed at 16 facilities and recommendations are being implemented at the following locations:
– Carroll Water Treatment Plant– Chelsea Office & Maintenance Facility– Multiple remote headworks, and water and wastewater pump
stations
• Audits were funded by MWRA and utilities, NSTAR and NGRID. In general, costs were split 50-50. The total costs of the audits ranged from $6,500 to $54,000 per facility

20
Types of Energy Audit Recommendations
• Operational Measures – low or no cost actions that reduce energy use and produce savings
• Energy Conservation Measures:– Controls– Retrofits
21
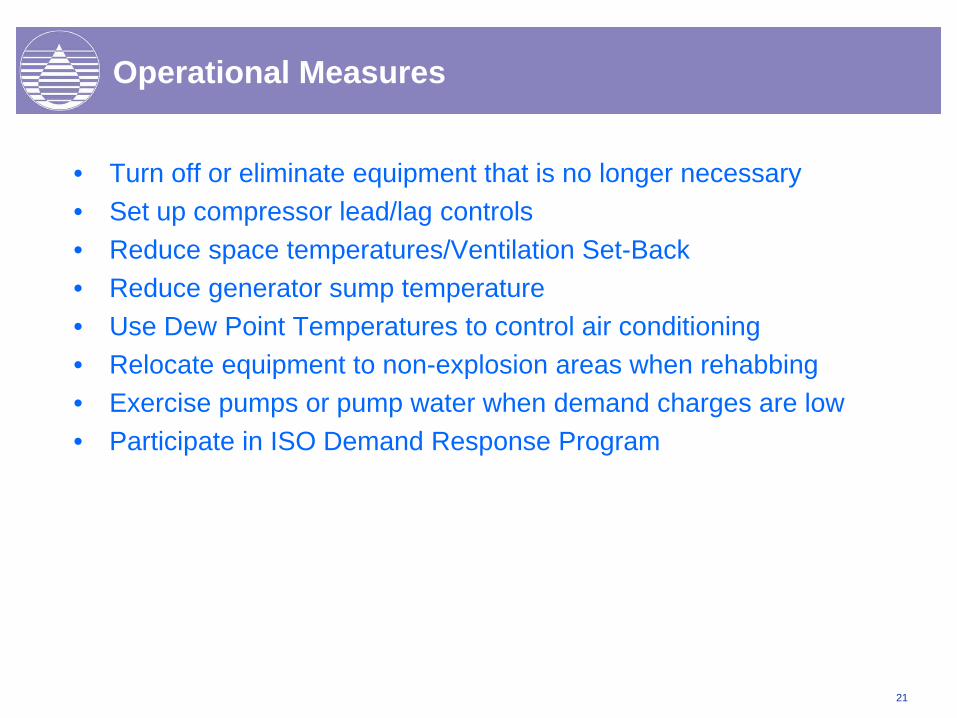
Operational Measures
• Turn off or eliminate equipment that is no longer necessary• Set up compressor lead/lag controls• Reduce space temperatures/Ventilation Set-Back• Reduce generator sump temperature• Use Dew Point Temperatures to control air conditioning• Relocate equipment to non-explosion areas when rehabbing • Exercise pumps or pump water when demand charges are low• Participate in ISO Demand Response Program

22
Examples of Operational Measures Taken
• Turn off soda ash mixers at the Carroll Water Treatment Plant - resulted in $200,000/yr savings
• Ventilation Set-Back at Chelsea Headworks resulted in $91,000 electricity and natural gas savings
• Exercise water pumps off-peak reduced demand charges by 70% – resulted in savings of $8,000 quarterly
• Setting thermostats lower at night in Chelsea Office and Maintenance Facility resulted in a 33% reduction in natural gas usage during the winter.

23
Energy Conservation Measures
Most work can be done under the Green Communities Act (cost must be at or under $100,000), significantly speeding up the implementation process.
• Install VFDs on:– Exhaust and Supply Fans for Occupancy-based Controls– Pumps
• Demand Controlled Ventilation based on CO2 • Upgrade Lighting Systems and Install Lighting Controls (don’t forget
outdoor lighting)

24
Equipment Upgrades: Rehab of Water Pump Stations
• New VFDs, motors and pumps at 6 water pump stations
• Will decrease energy use. At Brattle Ct., kWh usage per million gallons pumped has been reduced by 45-55% when VFD in use
• Eligible for $190,000 in rebates for 4 of these facilities

25
VFDs
• MWRA installing VFDs on scrubber pumps at headworks to reduce speed to provide flow at a lower pressure than throttled discharge valve. Work in progress; estimated to save 120,888 kWh and about $17,045 annually at a cost of $14,000 for a payback of about 0.8 yrs.
• MWRA installing VFDs on exhaust and supply fans at headworks to reduce fan speed based on occupancy. Work in progress; estimated to save 186,600 kWh and $85,000 annually at a cost of $88,000 for a payback of about 1 year. (This is what I mean by ventilation set-back)
• MWRA installing VFDs on hot water pumps at CWTP – proposed costs to install = $10,500, NGRID incentive = $4,600, so final cost to MWRA = $5,900

26
Lighting Retrofits
• Lighting improvements at Carroll WTP cost MWRA $79,500 after receiving a $30,000 incentive from NGRID. MWRA has saved approximately 450,000 kWh and about $56,000 annually, resulting in a payback of less than 2 yrs.
• Lighting improvements at Chelsea Office and Maintenance Facility cost $84,600 after receiving a $50,000 incentive from NSTAR. MWRA has saved approximately 188,000 kWh and $29,000 annually, resulting in a payback of slightly less than 3 yrs.
• Deer Island lighting improvements include a multi-phase program for replacement of lamps, ballasts, exit signs, day lighting, and motion sensors. Three phases completed to date resulted in savings of over 3M kWh/yr or $350,000. Additional phases continue

27
Controls
• HVAC audit completed. Recommendations to install an energy management system. NSTAR to provide $169,000 rebate and project expected to save 600,000 kWh annually ($80,000-$90,000/yr)
• Demand Controlled Ventilation at the CWTP – estimated cost $3,700; predicted gas savings = 2,500 therms and 2,000 in kWh annually ($3,500)

28
Demand Response
What is Demand Response/Load Response?
“Demand Response or Load Response is an New EnglandIndependent System Operator (ISO-NE) designed program toensure the electric grids reliability. By reducing your electricalconsumption via an emergency generator or shedding yourelectrical load, you will receive monthly revenue based oncommitted and demonstrated ability to curtail.”

29
Program Facts
Program Enrollment = Minimum 100kW
Types of Programs in DR = there are two distinct real-time programs, Real-Time DemandResponse and Real-Time Emergency Generation.
Potential Number of Events = Real-Time Demand Response: 12 events or 50 hours.Real-Time Emergency Generation: 4 events or 10 hours
Length of Event = Length of an emergency event may vary; typically several hours.
Response Time = Within 30 minutes
Notification = Notified is via your preferred means of communication when you enrolled in the program. This may include but not limited to phone, email, text, and/or pager.
Underperformance = You will not be assessed any penalties for good faith failure to perform for any single event/test. Your future payments will be reduced in accordance with your event/test performance.
Event Hours = Real-Time Demand Response: 24-7 year round Real-Time Emergency Generation: 7am-7pm weekdays – non-holidays
30
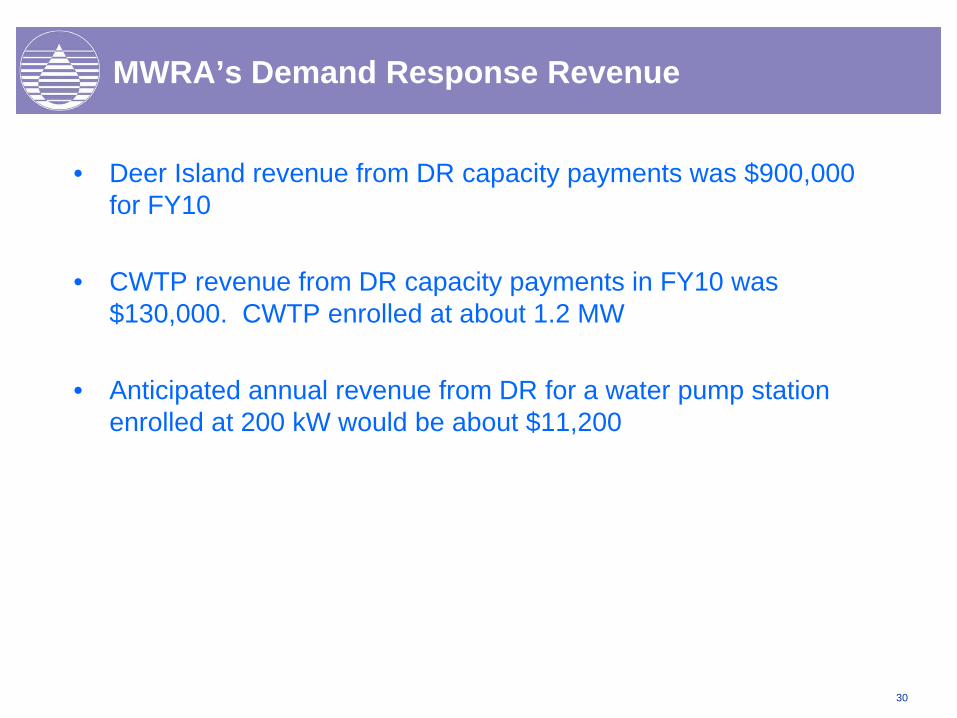
MWRA’s Demand Response Revenue
• Deer Island revenue from DR capacity payments was $900,000 for FY10
• CWTP revenue from DR capacity payments in FY10 was $130,000. CWTP enrolled at about 1.2 MW
• Anticipated annual revenue from DR for a water pump station enrolled at 200 kW would be about $11,200

31
MWRA Contact Information
Denise BreiteneicherProject Manager Technical [email protected]
Kristen PatneaudeProgram Manager Energy [email protected]