Embed Size (px)
Citation preview
Presentation to the House Appropriations Subcommittee on Article II:
Overview of Texas Medicaid Hospital Finance and the Section 1115 Demonstration Waiver
Health and Human Services Commission
Charles Smith, Executive Commissioner Pam McDonald, Director of Rate Analysis
Ardas Khalsa, Deputy Medicaid/CHIP Director, Healthcare Transformation Waiver
July 13, 2016
2
Overview of Hospital Finance Texas Medicaid Hospital Payment Overview
• Historically hospital payments have been made using four mechanisms: Inpatient payments Outpatient payments Disproportionate Share Hospital (DSH) payments Upper Payment Limit (UPL) payments
UPL payments transitioned to Medicaid 1115 Transformation Waiver Uncompensated Care (UC) Pool payments in FFY 2012.
• A fifth mechanism, Delivery System Reform Incentive Payments (DSRIP) under the waiver, began in early FFY 2013.
• An additional mechanism, the Network Adequacy Improvement Program (NAIP), began in March 2015.
3
Overview of Hospital Finance Inpatient Rates
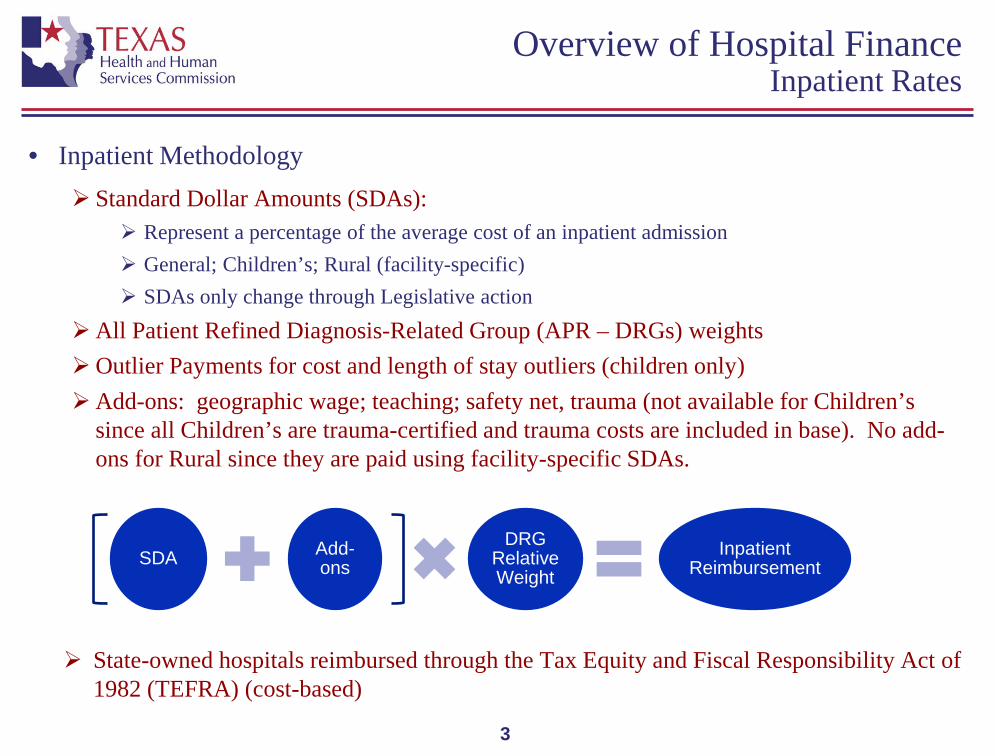
• Inpatient Methodology
Standard Dollar Amounts (SDAs): Represent a percentage of the average cost of an inpatient admission General; Children’s; Rural (facility-specific) SDAs only change through Legislative action
All Patient Refined Diagnosis-Related Group (APR – DRGs) weights Outlier Payments for cost and length of stay outliers (children only) Add-ons: geographic wage; teaching; safety net, trauma (not available for Children’s
since all Children’s are trauma-certified and trauma costs are included in base). No add-ons for Rural since they are paid using facility-specific SDAs.
State-owned hospitals reimbursed through the Tax Equity and Fiscal Responsibility Act of 1982 (TEFRA) (cost-based)
SDA Add-ons
DRG Relative Weight
Inpatient Reimbursement
4
Overview of Hospital Finance Outpatient Rates
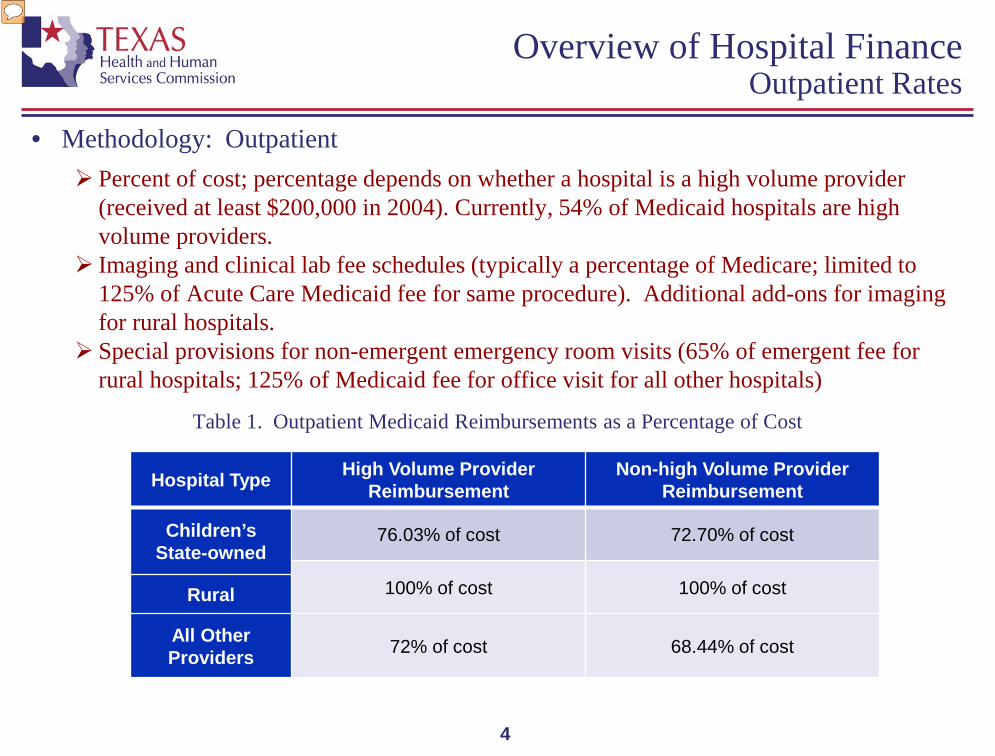
• Methodology: Outpatient Percent of cost; percentage depends on whether a hospital is a high volume provider
(received at least $200,000 in 2004). Currently, 54% of Medicaid hospitals are high volume providers.
Imaging and clinical lab fee schedules (typically a percentage of Medicare; limited to 125% of Acute Care Medicaid fee for same procedure). Additional add-ons for imaging for rural hospitals.
Special provisions for non-emergent emergency room visits (65% of emergent fee for rural hospitals; 125% of Medicaid fee for office visit for all other hospitals)
Table 1. Outpatient Medicaid Reimbursements as a Percentage of Cost
Hospital Type High Volume Provider Reimbursement
Non-high Volume Provider Reimbursement
Children’s State-owned
76.03% of cost 72.70% of cost
100% of cost 100% of cost Rural
All Other Providers 72% of cost 68.44% of cost
5
Overview of Hospital Finance Inpatient Funding Increases from 84th Session
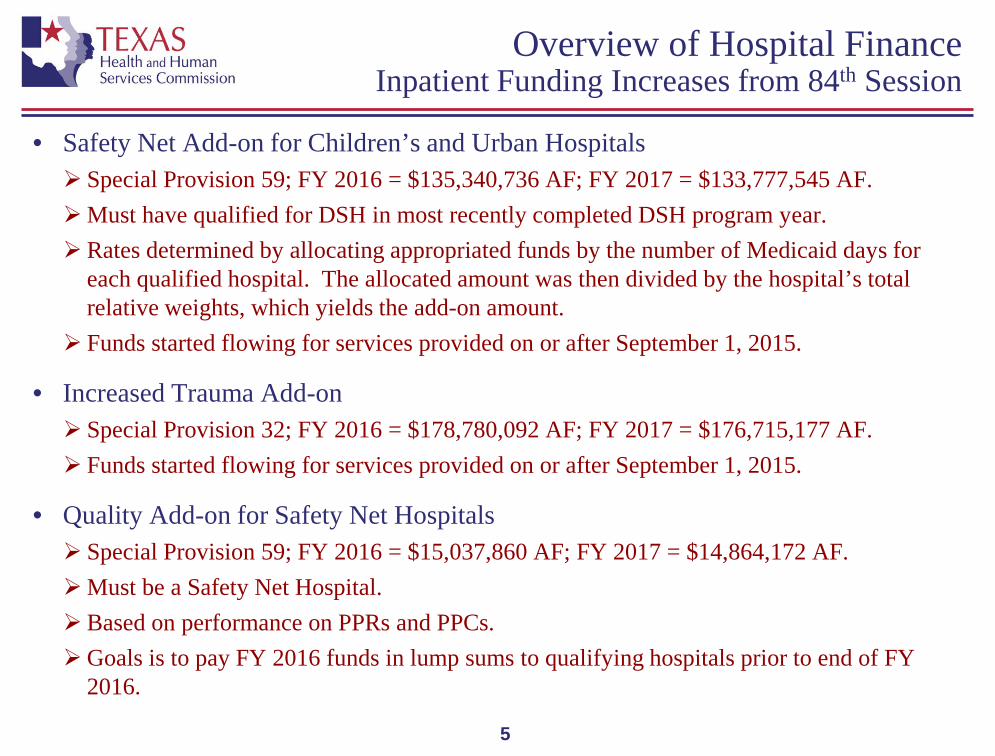
• Safety Net Add-on for Children’s and Urban Hospitals
Special Provision 59; FY 2016 = $135,340,736 AF; FY 2017 = $133,777,545 AF. Must have qualified for DSH in most recently completed DSH program year. Rates determined by allocating appropriated funds by the number of Medicaid days for
each qualified hospital. The allocated amount was then divided by the hospital’s total relative weights, which yields the add-on amount.
Funds started flowing for services provided on or after September 1, 2015.
• Increased Trauma Add-on
Special Provision 32; FY 2016 = $178,780,092 AF; FY 2017 = $176,715,177 AF. Funds started flowing for services provided on or after September 1, 2015.
• Quality Add-on for Safety Net Hospitals
Special Provision 59; FY 2016 = $15,037,860 AF; FY 2017 = $14,864,172 AF. Must be a Safety Net Hospital. Based on performance on PPRs and PPCs. Goals is to pay FY 2016 funds in lump sums to qualifying hospitals prior to end of FY
2016.
6
Overview of Hospital Finance Outpatient Funding Increases from 84th Session
• Special Provision 58 directed HHSC to expend certain funds to provide increases in, or add-ons to, Medicaid outpatient provider rates for rural hospitals to ensure access to critical services.
FY 2016 = $28,043,936 AF; FY 2017 = $30,030,030 AF
Increased general outpatient reimbursement such that final payments do not exceed 100%
of cost.
Increased reimbursement for outpatient emergency department services that do not qualify as emergency visits such that final payments do not exceed 65% of cost.
Created rural hospital add-ons to the outpatient hospital imaging services fee schedule.
7
Overview of Hospital Finance Availability of Trauma Funds to Support
Increases from the 84th Session will Decline
• Legislative appropriations from the state’s trauma fund (GR dedicated Designated Trauma Facility and Emergency Medical Services account 5111) support Medicaid trauma related payments to 290 hospitals. $150 million annually matched with $192 million in federal funds totals $343 million in
higher hospital payments which reduce the size of the Medicaid shortfall. An additional $24 million is appropriated for other purposes. This appropriation level includes prior year fund balances as well as current biennium
revenues. Certification Revenue Estimate includes $117,959,000 annual revenue for account 5111.
Use of fund balance achieves two goals: Use of dedicated account for statutorily authorized purposes. Wind down reliance on GR-D funds for GR certification purposes.
As a result, the annual appropriation level is not sustainable beyond this biennium (subject to Revenue Estimate).
Further revenue may be affected by legislative action as the Driver Responsibility Program and other revenue sources for account 5111 are reviewed.
8
Overview of Hospital Finance Children’s and Rural Hospitals
• Prior to September 1, 2013, children’s and rural hospitals’ inpatient costs were reimbursed using a cost-based methodology that followed principles laid out in the federal Tax Equity and Fiscal Responsibility Act of 1982 (TEFRA).
• The 2014-2015 General Appropriations Act, Article II, Rider 38 directed HHSC to rebase rural hospital rates by implementing a facility-specific prospective full cost standard dollar amount (SDA) based on historical costs, trended forward for inflation and limited by a floor and a ceiling.
• Rider 51.b.(17) and (19) directed HHSC to pay more appropriate outlier payments and to adjust inpatient hospital reimbursement for labor and delivery services provided to adults at a children’s hospital.
• Rider 71 directed HHSC to implement an All Patient Refined Diagnostic Related Group (APR-DRG) prospective payment system for inpatient services provided by a children’s hospital, trended forward for inflation.

9
Overview of Hospital Finance Children’s and Rural Hospitals (cont.)
• Currently, Children’s Hospitals: Are reimbursed for inpatient services using a single, children’s statewide base SDA with
add-ons for geographic wage differences and for teaching medical education. The children’s hospital single base SDA is currently $9,506 (by way of comparison, the
urban base SDA is $2,994) The average children’s hospital inpatient SDA with add-ons is $12,040. Average adult delivery rate in a children’s hospital is $3,305. Outpatient reimbursement as percentage of cost is approximately 4 percent greater than
for urban hospitals.
• Currently, Rural Hospitals: Are reimbursed for inpatient services using facility-specific SDA’s with a floor of $4,533
and a ceiling of $12,968. Because SDAs are facility-specific based on each hospitals’ costs, there are no add-ons. General outpatient services are reimbursed at 100% of cost. Non-emergent, emergency room services are reimbursed at 65% of cost. Imaging and clinical laboratory services are reimbursed via a fee schedule with special
rural hospital add-ons for imaging.
10
Overview of Hospital Finance “Medicaid Shortfall” and Hospital-specific Limit
• “Medicaid Shortfall” Definition: Medicaid costs not covered by Medicaid rates result in the Medicaid shortfall. Inpatient: In 2014, Medicaid rates covered approximately 57% of Medicaid costs, on
average, for general Medicaid hospitals (excluding children’s, rural and state-owned) and 67% of Medicaid costs, on average, for all Medicaid hospitals.
Outpatient rules for general hospitals limit payments to 72% of cost for high volume providers and 68.44% of cost for all other hospitals. For children’s and state-owned hospitals, outpatient rules limit payments to 76.03% for high volume providers and 72.70% for all others. Rural hospitals are reimbursed 100% of cost for general outpatient services.
• For each hospital, a hospital-specific limit (HSL) is calculated as the sum of: The hospital’s Medicaid shortfall (difference between hospital costs for Medicaid patients
and Medicaid claims payments); and The hospital’s unreimbursed costs of caring for low-income uninsured individuals.
• Each hospital that is eligible may receive combined DSH and UC payments up to its HSL, if there are sufficient non-federal funds to support these payments. Under the Transformation Waiver, hospitals may also receive payments for uncompensated physician, clinic and pharmacy costs.
11
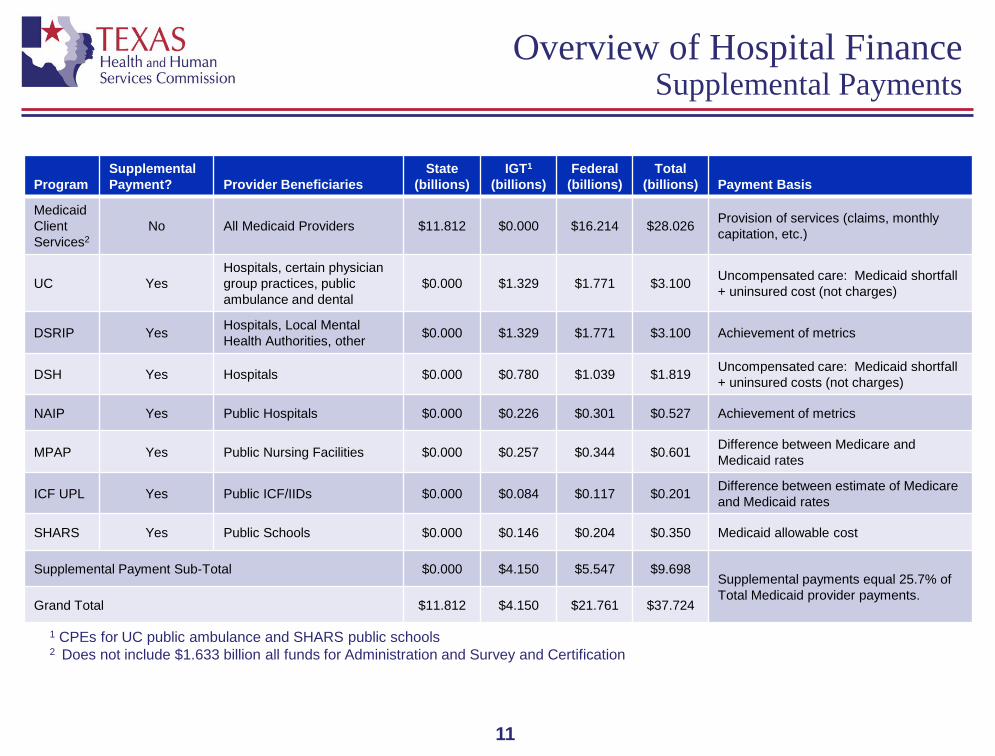
Overview of Hospital Finance Supplemental Payments
Program
Supplemental Payment?
Provider Beneficiaries
State (billions)
IGT1 (billions)
Federal (billions)
Total (billions)
Payment Basis
Medicaid Client Services2
No All Medicaid Providers $11.812 $0.000 $16.214 $28.026 Provision of services (claims, monthly capitation, etc.)
UC Yes Hospitals, certain physician group practices, public ambulance and dental
$0.000 $1.329 $1.771 $3.100 Uncompensated care: Medicaid shortfall + uninsured cost (not charges)
DSRIP Yes Hospitals, Local Mental Health Authorities, other $0.000 $1.329 $1.771 $3.100 Achievement of metrics
DSH Yes Hospitals $0.000 $0.780 $1.039 $1.819 Uncompensated care: Medicaid shortfall + uninsured costs (not charges)
NAIP Yes Public Hospitals $0.000 $0.226 $0.301 $0.527 Achievement of metrics
MPAP Yes Public Nursing Facilities $0.000 $0.257 $0.344 $0.601 Difference between Medicare and Medicaid rates
ICF UPL Yes Public ICF/IIDs $0.000 $0.084 $0.117 $0.201 Difference between estimate of Medicare and Medicaid rates
SHARS Yes Public Schools $0.000 $0.146 $0.204 $0.350 Medicaid allowable cost
Supplemental Payment Sub-Total $0.000 $4.150 $5.547 $9.698 Supplemental payments equal 25.7% of Total Medicaid provider payments.
Grand Total $11.812 $4.150 $21.761 $37.724
1 CPEs for UC public ambulance and SHARS public schools 2 Does not include $1.633 billion all funds for Administration and Survey and Certification
12
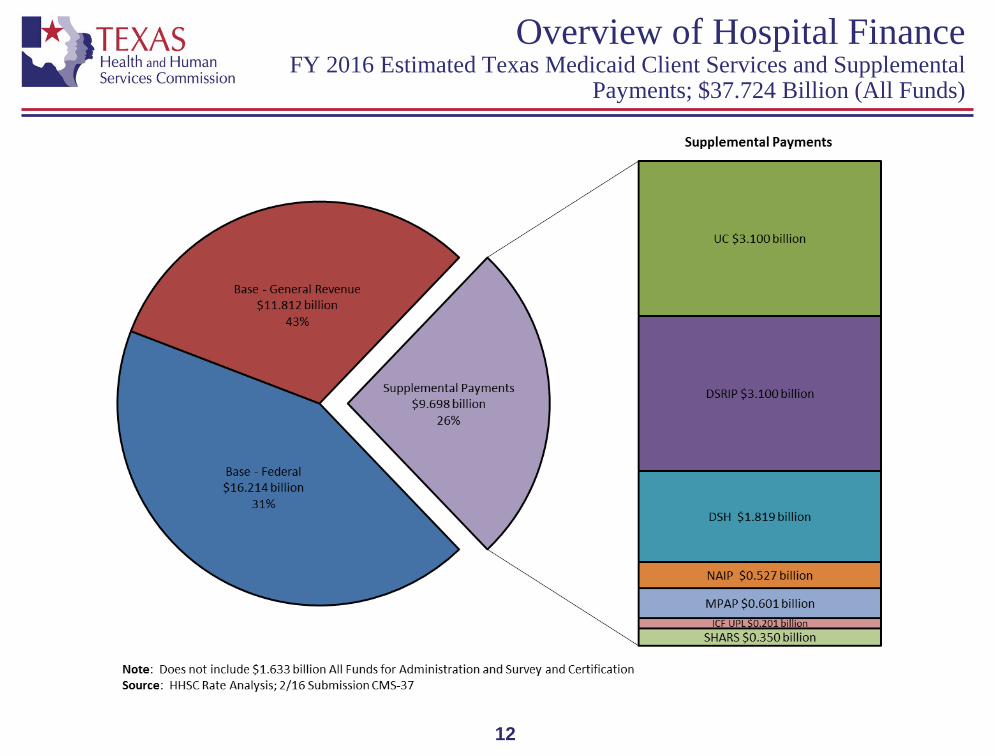
Overview of Hospital Finance FY 2016 Estimated Texas Medicaid Client Services and Supplemental
Payments; $37.724 Billion (All Funds)
13
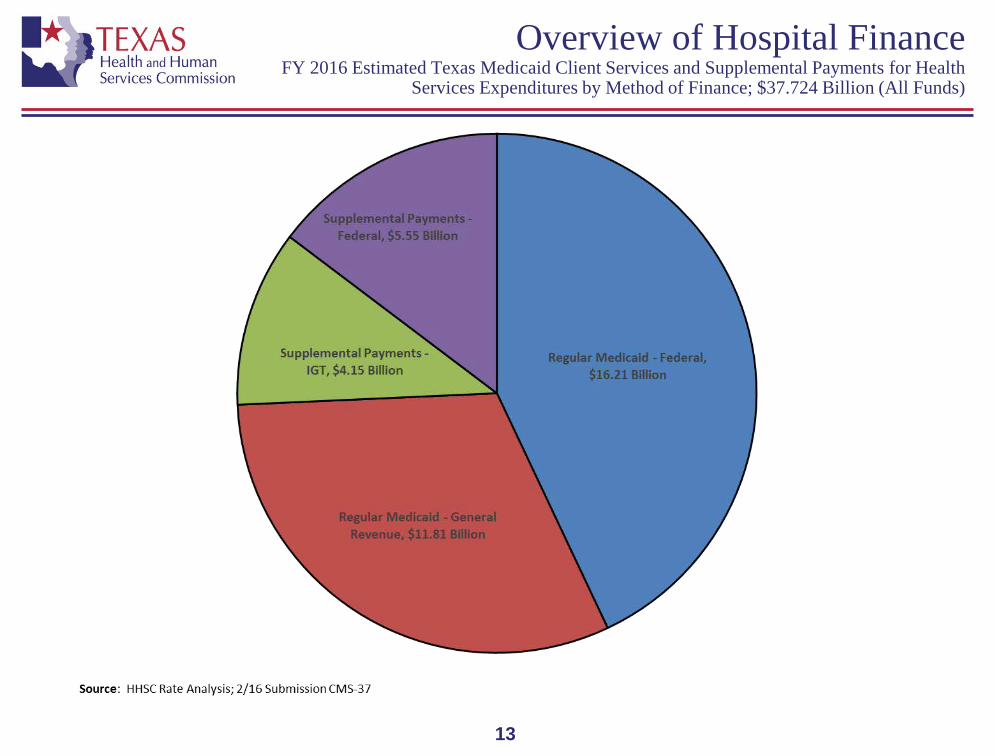
Overview of Hospital Finance FY 2016 Estimated Texas Medicaid Client Services and Supplemental Payments for Health
Services Expenditures by Method of Finance; $37.724 Billion (All Funds)
14
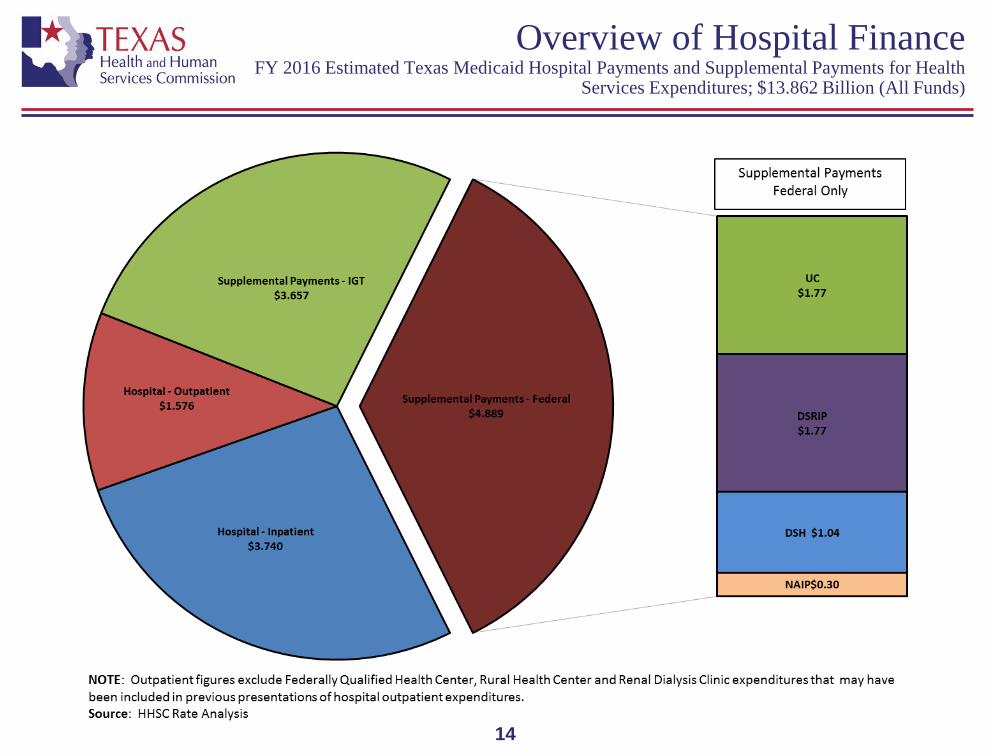
Overview of Hospital Finance FY 2016 Estimated Texas Medicaid Hospital Payments and Supplemental Payments for Health
Services Expenditures; $13.862 Billion (All Funds)
15
Overview of Hospital Finance Risks to Supplemental Payment Programs
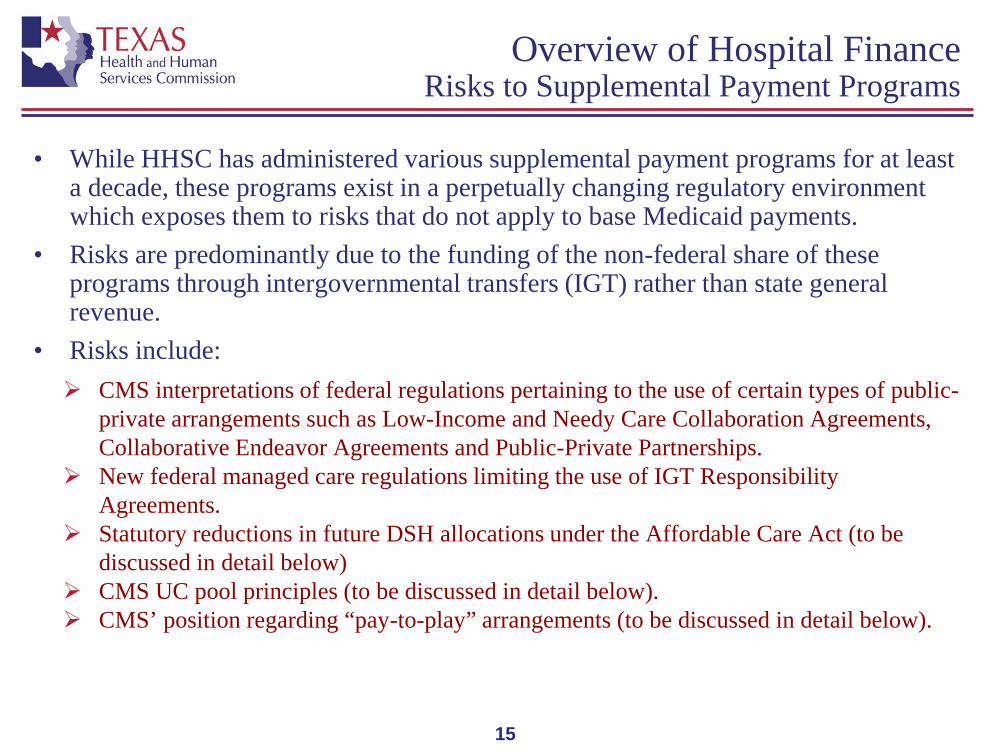
• While HHSC has administered various supplemental payment programs for at least a decade, these programs exist in a perpetually changing regulatory environment which exposes them to risks that do not apply to base Medicaid payments.
• Risks are predominantly due to the funding of the non-federal share of these programs through intergovernmental transfers (IGT) rather than state general revenue.
• Risks include: CMS interpretations of federal regulations pertaining to the use of certain types of public-
private arrangements such as Low-Income and Needy Care Collaboration Agreements, Collaborative Endeavor Agreements and Public-Private Partnerships.
New federal managed care regulations limiting the use of IGT Responsibility Agreements.
Statutory reductions in future DSH allocations under the Affordable Care Act (to be discussed in detail below)
CMS UC pool principles (to be discussed in detail below). CMS’ position regarding “pay-to-play” arrangements (to be discussed in detail below).
16
Overview of Hospital Finance Disproportionate Share Hospital (DSH) Basics
• Participation in the DSH program is limited to hospitals that bear a disproportionate share of the state’s Medicaid and low-income uninsured care burden.
• DSH funds are distributed to qualifying hospitals based on each hospital’s sum of Medicaid and low-income uninsured days as a percentage of all qualifying hospitals’ sum of Medicaid and low-income uninsured days.
• Each hospital’s DSH payment is limited to its HSL. • HHSC is required by the Social Security Act to annually complete an independent
certified audit of each DSH hospital. Starting with the 2011 audit, HHSC has been recouping overpayments of DSH funds and redistributing the recouped funds to DSH providers that are eligible for additional payments.
• The nonfederal share of DSH payments to public hospitals is funded through IGTs from each public hospital. The nonfederal share of DSH payments for private hospitals is funded through IGTs from six large public hospital districts.
17
Overview of Hospital Finance ACA DSH allocation reductions
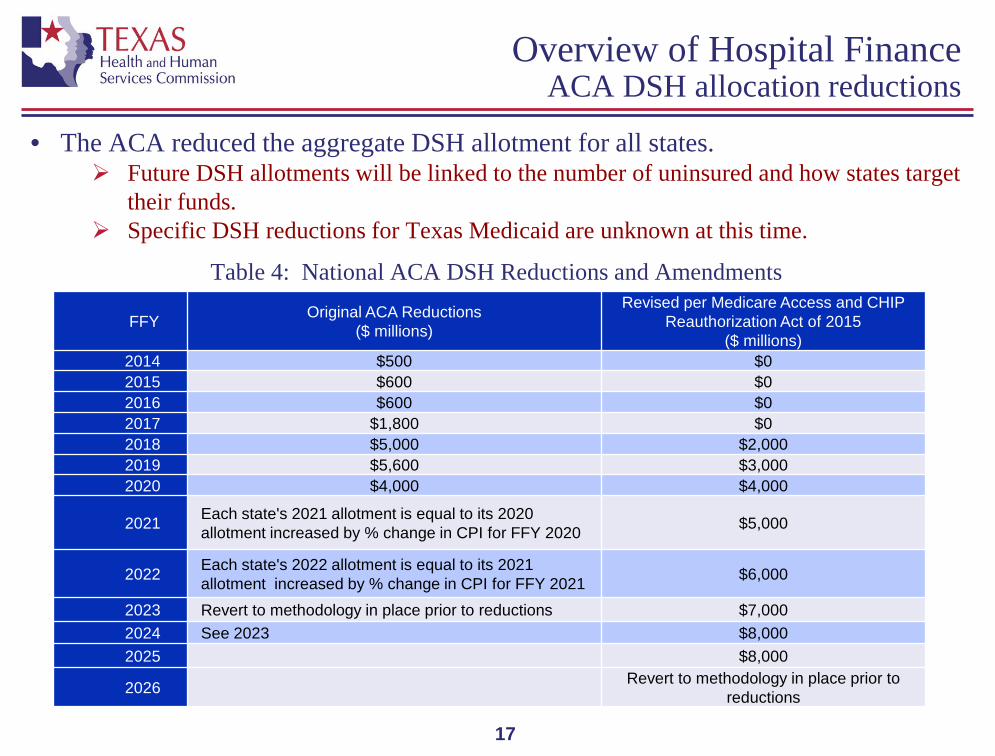
• The ACA reduced the aggregate DSH allotment for all states.
Future DSH allotments will be linked to the number of uninsured and how states target their funds.
Specific DSH reductions for Texas Medicaid are unknown at this time.
Table 4: National ACA DSH Reductions and Amendments
FFY Original ACA Reductions ($ millions)
Revised per Medicare Access and CHIP Reauthorization Act of 2015
($ millions) 2014 $500 $0 2015 $600 $0 2016 $600 $0 2017 $1,800 $0 2018 $5,000 $2,000 2019 $5,600 $3,000 2020 $4,000 $4,000
2021 Each state's 2021 allotment is equal to its 2020 allotment increased by % change in CPI for FFY 2020 $5,000
2022 Each state's 2022 allotment is equal to its 2021 allotment increased by % change in CPI for FFY 2021 $6,000
2023 Revert to methodology in place prior to reductions $7,000 2024 See 2023 $8,000 2025 $8,000
2026 Revert to methodology in place prior to reductions
18
Overview of Hospital Finance 1115 Waiver
• Managed care expansion Allows statewide Medicaid managed care services (STAR, STAR+PLUS, and
Children’s Medicaid Dental Services) while preserving historical UPL funding.
• Hospital financing component Uncompensated Care (UC) Pool:
Replaces UPL Covers Medicaid shortfall and costs of care provided to individuals who have no third
part insurance coverage. Creates 20 Regional Healthcare Partnerships (RHPs) Delivery system Reform Incentive Payment (DSRIP) Pool
New incentive program to support coordinated care and quality improvements through the RHPs.
Goals: transform delivery systems to improve care for individuals (including access, quality and health outcomes), improve health for the population and lower costs through efficiencies and improvements.
Targets Medicaid recipients and low income uninsured individuals
• Five year waiver FFY 2011-2016 (15 month extension to December 31, 2017, awarded by CMS April 2016)
19
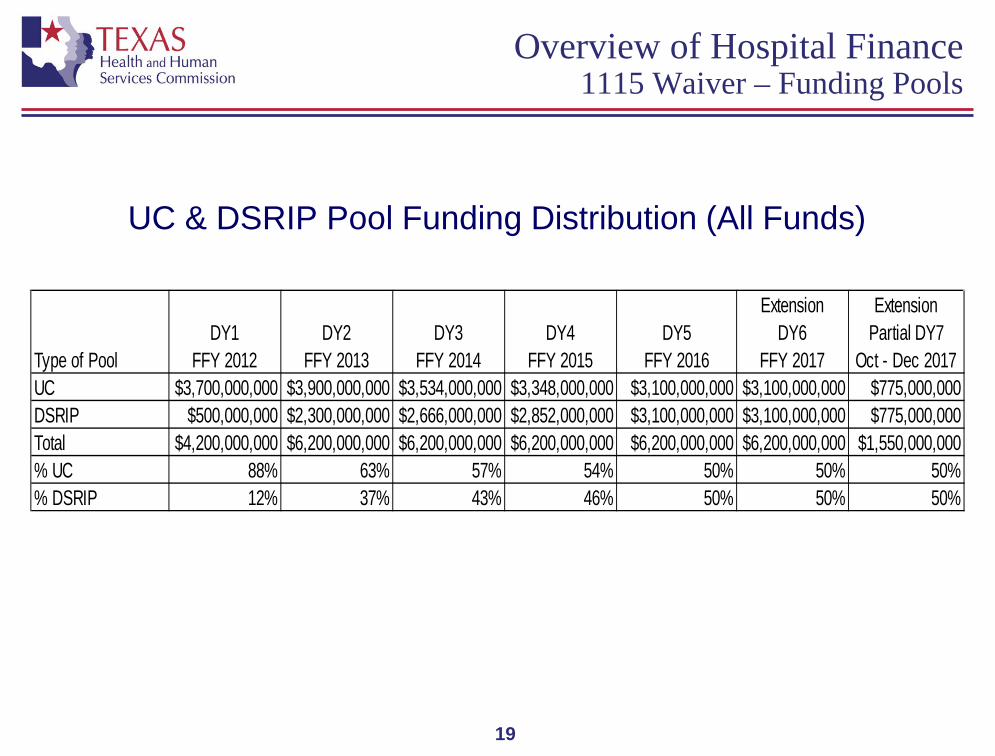
Overview of Hospital Finance 1115 Waiver – Funding Pools
UC & DSRIP Pool Funding Distribution (All Funds)
Type of PoolDY1
FFY 2012DY2
FFY 2013DY3
FFY 2014DY4
FFY 2015DY5
FFY 2016
ExtensionDY6
FFY 2017
ExtensionPartial DY7
Oct - Dec 2017UC $3,700,000,000 $3,900,000,000 $3,534,000,000 $3,348,000,000 $3,100,000,000 $3,100,000,000 $775,000,000DSRIP $500,000,000 $2,300,000,000 $2,666,000,000 $2,852,000,000 $3,100,000,000 $3,100,000,000 $775,000,000Total $4,200,000,000 $6,200,000,000 $6,200,000,000 $6,200,000,000 $6,200,000,000 $6,200,000,000 $1,550,000,000% UC 88% 63% 57% 54% 50% 50% 50%% DSRIP 12% 37% 43% 46% 50% 50% 50%
20
Overview of Hospital Finance 1115 Waiver - UC Basics
• UC Allocation Methodology:
Establish distinct UC pools for different types of providers (including large public, small public, and private hospitals). If UC costs in a pool exceed the funds allocated to that pool, reduce payments to providers in the pool so that total payments from the pool do not exceed funds allocated to the pool.
Pool sizes based on the ratio of each pool’s “UC need” to the total of all pools’ “UC need”.
“UC need” was defined as follows: Large public hospitals: sum of HSLs less payments made under DSH plus an amount equal to the
IGTs they transferred to support DSH payments to private hospitals and their own hospitals. Small public hospitals: sum of HSLs less payments made under DSH plus an amount equal to the
IGTs they transferred to support DSH payments to their own hospitals. Private hospitals: sum of HSLs less payments made under DSH
Special protections for Rider 38 rural hospitals.
• Any unused pool funds used to offset $466 million “UPL debt” to CMS.
21
Overview of Hospital Finance 1115 Waiver – DSRIP Status
• 1,451 active DSRIP projects
• 298 providers – hospitals (public and private), physician groups, community mental health centers and local health departments
• Major project focuses:
Over 25% - behavioral healthcare 20% - access to primary care 18% - chronic care management and helping patients with complex needs navigate the
healthcare system 9% - access to specialty care 8% - health promotion and disease prevention.
• Over $7.1 billion earned through January 2016
22
Overview of Hospital Finance 1115 Waiver – Extension Request
• HHSC was required to submit to the federal Centers for Medicare and Medicaid Services (CMS) a request to extend the waiver by September 30, 2015.
• In September, HHSC requested to continue all three components of the waiver (statewide managed care, UC pool and DSRIP pool) for another five years
Continue DY5 funding level for DSRIP ($3.1 billion annually) Increase UC pool to equal the unmet need in Texas adjusted to remain within
budget neutrality each year (ranging from $5.8 billion to $7.4 billion per demonstration year)
• Texas has made progress related to all five waiver goals, and has proposed program improvements to make further progress toward those goals to support and strengthen the healthcare delivery system for low-income Texans
23
Overview of Hospital Finance 1115 Waiver – Independent Report
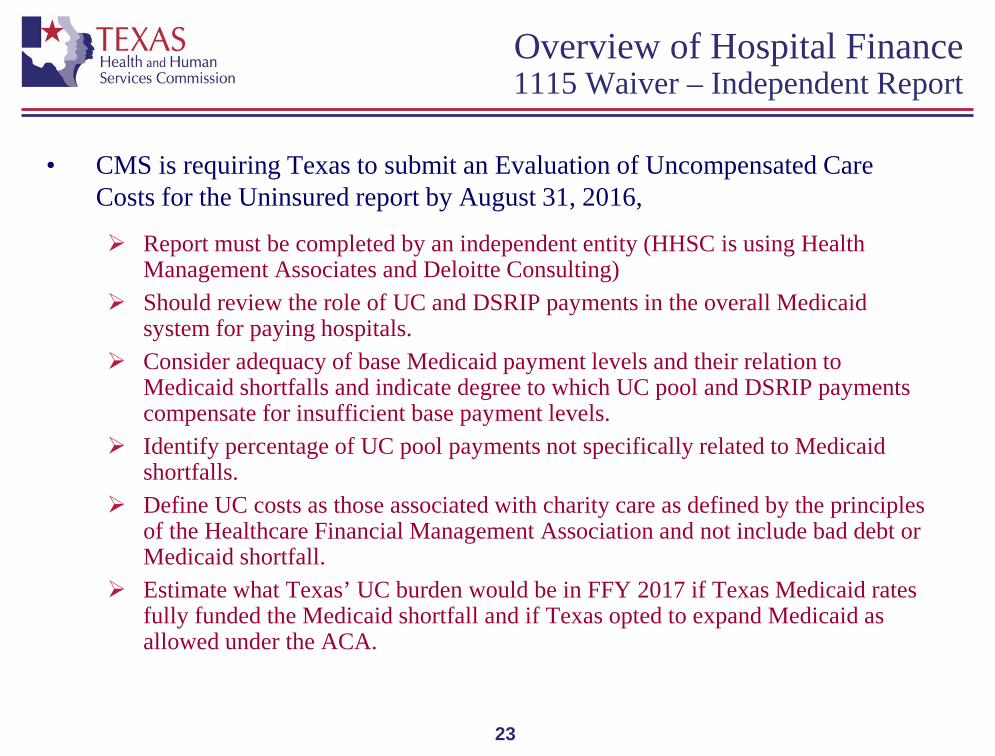
• CMS is requiring Texas to submit an Evaluation of Uncompensated Care Costs for the Uninsured report by August 31, 2016,
Report must be completed by an independent entity (HHSC is using Health Management Associates and Deloitte Consulting)
Should review the role of UC and DSRIP payments in the overall Medicaid system for paying hospitals.
Consider adequacy of base Medicaid payment levels and their relation to Medicaid shortfalls and indicate degree to which UC pool and DSRIP payments compensate for insufficient base payment levels.
Identify percentage of UC pool payments not specifically related to Medicaid shortfalls.
Define UC costs as those associated with charity care as defined by the principles of the Healthcare Financial Management Association and not include bad debt or Medicaid shortfall.
Estimate what Texas’ UC burden would be in FFY 2017 if Texas Medicaid rates fully funded the Medicaid shortfall and if Texas opted to expand Medicaid as allowed under the ACA.
24
Overview of Hospital Finance 1115 Waiver – CMS Approach to Further Extension
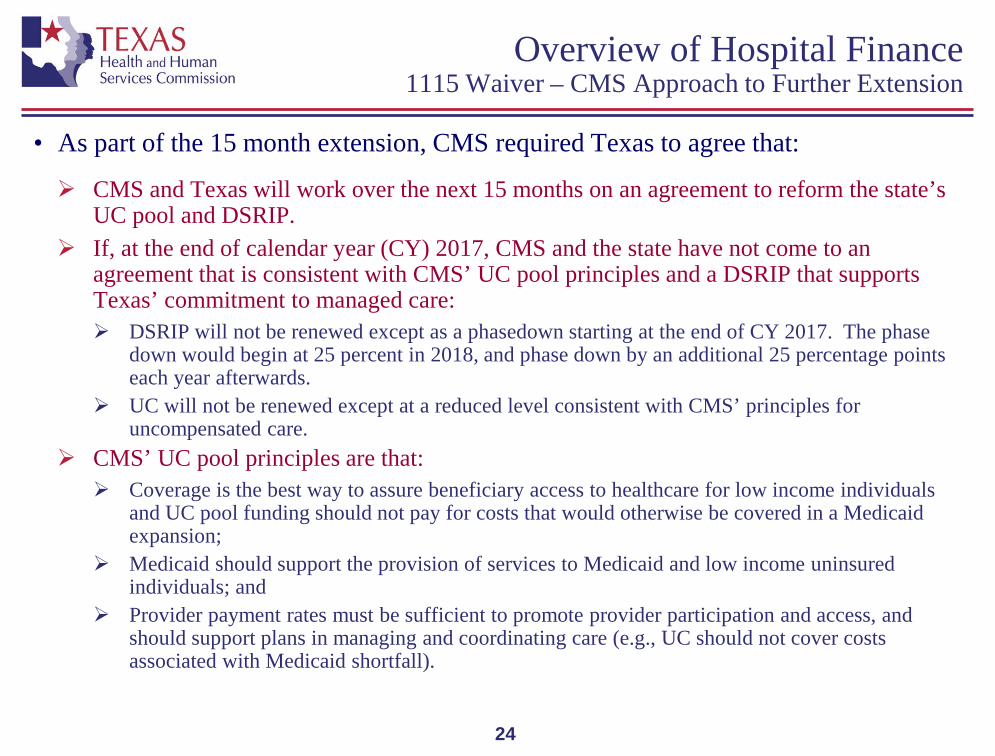
• As part of the 15 month extension, CMS required Texas to agree that:
CMS and Texas will work over the next 15 months on an agreement to reform the state’s UC pool and DSRIP.
If, at the end of calendar year (CY) 2017, CMS and the state have not come to an agreement that is consistent with CMS’ UC pool principles and a DSRIP that supports Texas’ commitment to managed care: DSRIP will not be renewed except as a phasedown starting at the end of CY 2017. The phase
down would begin at 25 percent in 2018, and phase down by an additional 25 percentage points each year afterwards.
UC will not be renewed except at a reduced level consistent with CMS’ principles for uncompensated care.
CMS’ UC pool principles are that: Coverage is the best way to assure beneficiary access to healthcare for low income individuals
and UC pool funding should not pay for costs that would otherwise be covered in a Medicaid expansion;
Medicaid should support the provision of services to Medicaid and low income uninsured individuals; and
Provider payment rates must be sufficient to promote provider participation and access, and should support plans in managing and coordinating care (e.g., UC should not cover costs associated with Medicaid shortfall).
25
Overview of Hospital Finance 1115 Waiver – Lessons from Florida Renewal
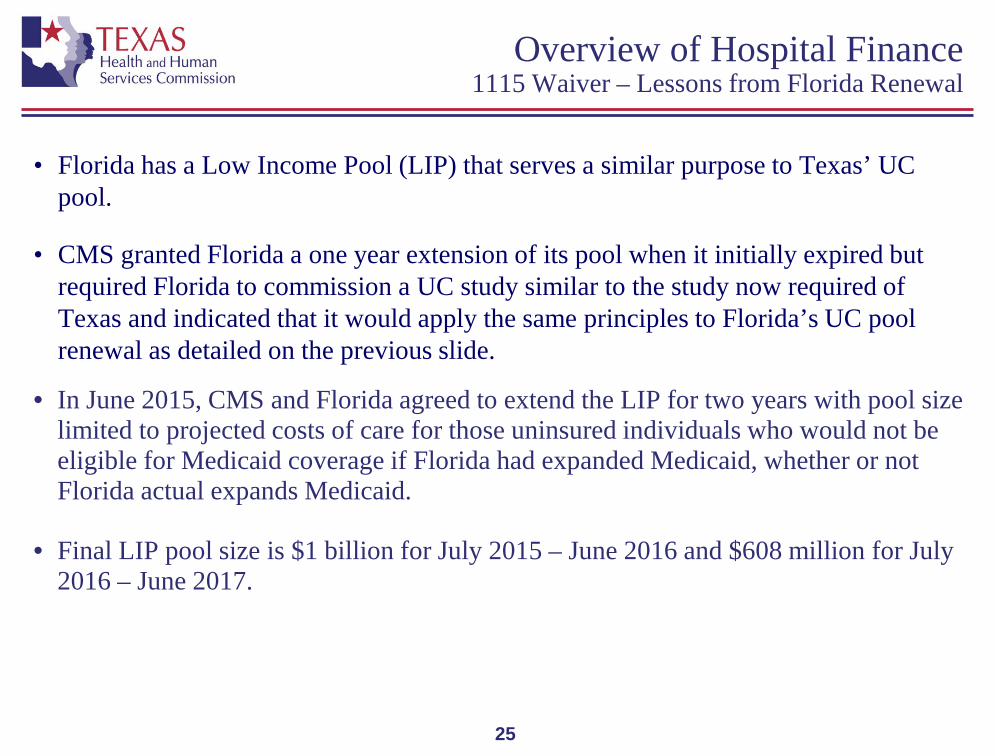
• Florida has a Low Income Pool (LIP) that serves a similar purpose to Texas’ UC pool.
• CMS granted Florida a one year extension of its pool when it initially expired but required Florida to commission a UC study similar to the study now required of Texas and indicated that it would apply the same principles to Florida’s UC pool renewal as detailed on the previous slide.
• In June 2015, CMS and Florida agreed to extend the LIP for two years with pool size limited to projected costs of care for those uninsured individuals who would not be eligible for Medicaid coverage if Florida had expanded Medicaid, whether or not Florida actual expands Medicaid.
• Final LIP pool size is $1 billion for July 2015 – June 2016 and $608 million for July 2016 – June 2017.
26
Overview of Hospital Finance 1115 Waiver – Differences between Florida and Texas
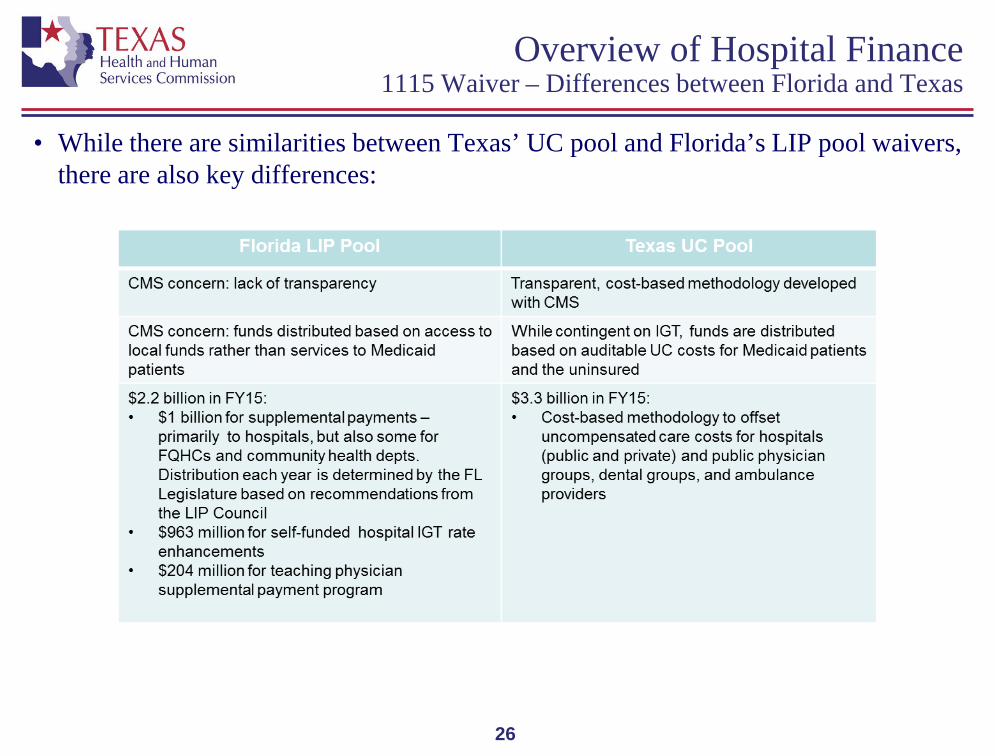
• While there are similarities between Texas’ UC pool and Florida’s LIP pool waivers, there are also key differences:
27
Overview of Hospital Finance Nursing Facility Minimum Payment Amounts Program (MPAP)
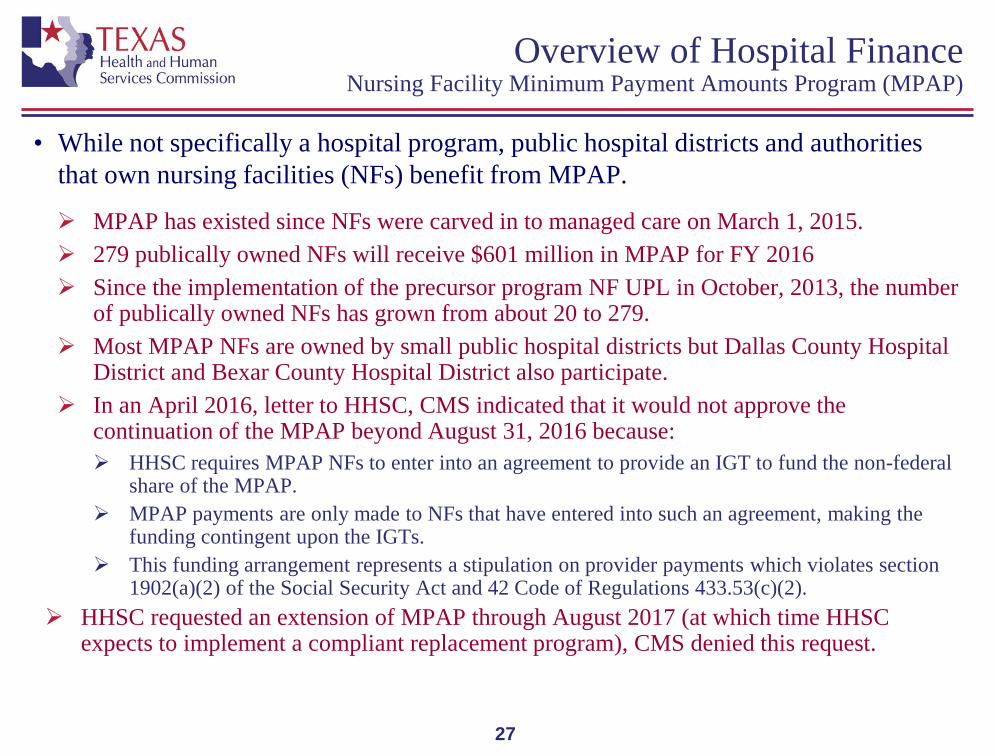
• While not specifically a hospital program, public hospital districts and authorities that own nursing facilities (NFs) benefit from MPAP.
MPAP has existed since NFs were carved in to managed care on March 1, 2015. 279 publically owned NFs will receive $601 million in MPAP for FY 2016 Since the implementation of the precursor program NF UPL in October, 2013, the number
of publically owned NFs has grown from about 20 to 279. Most MPAP NFs are owned by small public hospital districts but Dallas County Hospital
District and Bexar County Hospital District also participate. In an April 2016, letter to HHSC, CMS indicated that it would not approve the
continuation of the MPAP beyond August 31, 2016 because: HHSC requires MPAP NFs to enter into an agreement to provide an IGT to fund the non-federal
share of the MPAP. MPAP payments are only made to NFs that have entered into such an agreement, making the
funding contingent upon the IGTs. This funding arrangement represents a stipulation on provider payments which violates section
1902(a)(2) of the Social Security Act and 42 Code of Regulations 433.53(c)(2). HHSC requested an extension of MPAP through August 2017 (at which time HHSC
expects to implement a compliant replacement program), CMS denied this request.
Hospital Financing Overview
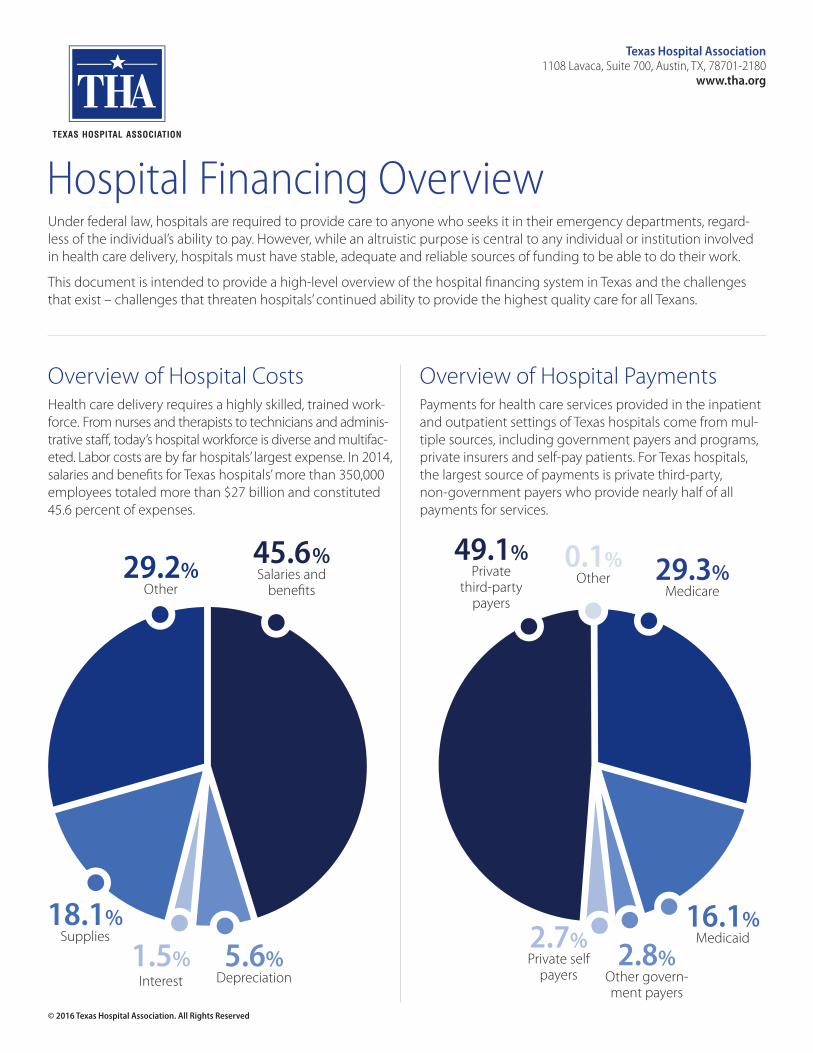
45.6%Salaries and
benefits29.2%
Other
18.1%Supplies
5.6%Depreciation
1.5%Interest
Under federal law, hospitals are required to provide care to anyone who seeks it in their emergency departments, regard-less of the individual’s ability to pay. However, while an altruistic purpose is central to any individual or institution involved in health care delivery, hospitals must have stable, adequate and reliable sources of funding to be able to do their work.
This document is intended to provide a high-level overview of the hospital financing system in Texas and the challenges that exist – challenges that threaten hospitals’ continued ability to provide the highest quality care for all Texans.
Overview of Hospital CostsHealth care delivery requires a highly skilled, trained work-force. From nurses and therapists to technicians and adminis-trative staff, today’s hospital workforce is diverse and multifac-eted. Labor costs are by far hospitals’ largest expense. In 2014, salaries and benefits for Texas hospitals’ more than 350,000 employees totaled more than $27 billion and constituted 45.6 percent of expenses.
Overview of Hospital PaymentsPayments for health care services provided in the inpatient and outpatient settings of Texas hospitals come from mul-tiple sources, including government payers and programs, private insurers and self-pay patients. For Texas hospitals, the largest source of payments is private third-party, non-government payers who provide nearly half of all payments for services.
49.1%Private
third-party payers
29.3%Medicare
16.1%Medicaid
2.8%Other govern-ment payers
2.7%Private self
payers
0.1%Other
Texas Hospital Association1108 Lavaca, Suite 700, Austin, TX, 78701-2180
www.tha.org
© 2016 Texas Hospital Association. All Rights Reserved
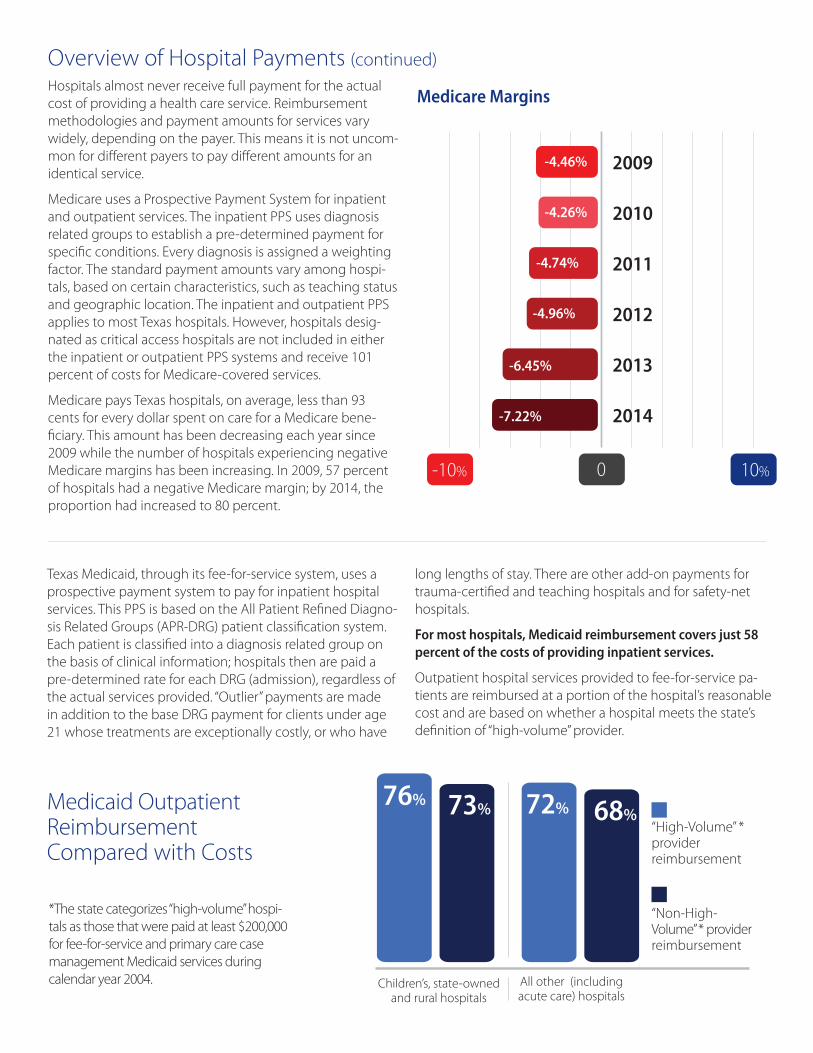
Hospitals almost never receive full payment for the actual cost of providing a health care service. Reimbursement methodologies and payment amounts for services vary widely, depending on the payer. This means it is not uncom-mon for different payers to pay different amounts for an identical service.
Medicare uses a Prospective Payment System for inpatient and outpatient services. The inpatient PPS uses diagnosis related groups to establish a pre-determined payment for specific conditions. Every diagnosis is assigned a weighting factor. The standard payment amounts vary among hospi-tals, based on certain characteristics, such as teaching status and geographic location. The inpatient and outpatient PPS applies to most Texas hospitals. However, hospitals desig-nated as critical access hospitals are not included in either the inpatient or outpatient PPS systems and receive 101 percent of costs for Medicare-covered services.
Medicare pays Texas hospitals, on average, less than 93 cents for every dollar spent on care for a Medicare bene-ficiary. This amount has been decreasing each year since 2009 while the number of hospitals experiencing negative Medicare margins has been increasing. In 2009, 57 percent of hospitals had a negative Medicare margin; by 2014, the proportion had increased to 80 percent.
0 10%-10%
-7.22%
-6.45%
-4.96%
-4.74%
-4.26%
-4.46% 2009
2010
2011
2012
2013
2014
Overview of Hospital Payments (continued)
Medicare Margins
Texas Medicaid, through its fee-for-service system, uses a prospective payment system to pay for inpatient hospital services. This PPS is based on the All Patient Refined Diagno-sis Related Groups (APR-DRG) patient classification system. Each patient is classified into a diagnosis related group on the basis of clinical information; hospitals then are paid a pre-determined rate for each DRG (admission), regardless of the actual services provided. “Outlier” payments are made in addition to the base DRG payment for clients under age 21 whose treatments are exceptionally costly, or who have
“High-Volume” * provider reimbursement
76% 73% 72% 68%
Children’s, state-owned and rural hospitals
All other (including acute care) hospitals
Medicaid Outpatient Reimbursement Compared with Costs
*The state categorizes “high-volume” hospi-tals as those that were paid at least $200,000 for fee-for-service and primary care case management Medicaid services during calendar year 2004.
“Non-High- Volume” * provider reimbursement
long lengths of stay. There are other add-on payments for trauma-certified and teaching hospitals and for safety-net hospitals.
For most hospitals, Medicaid reimbursement covers just 58 percent of the costs of providing inpatient services.
Outpatient hospital services provided to fee-for-service pa-tients are reimbursed at a portion of the hospital’s reasonable cost and are based on whether a hospital meets the state’s definition of “high-volume” provider.
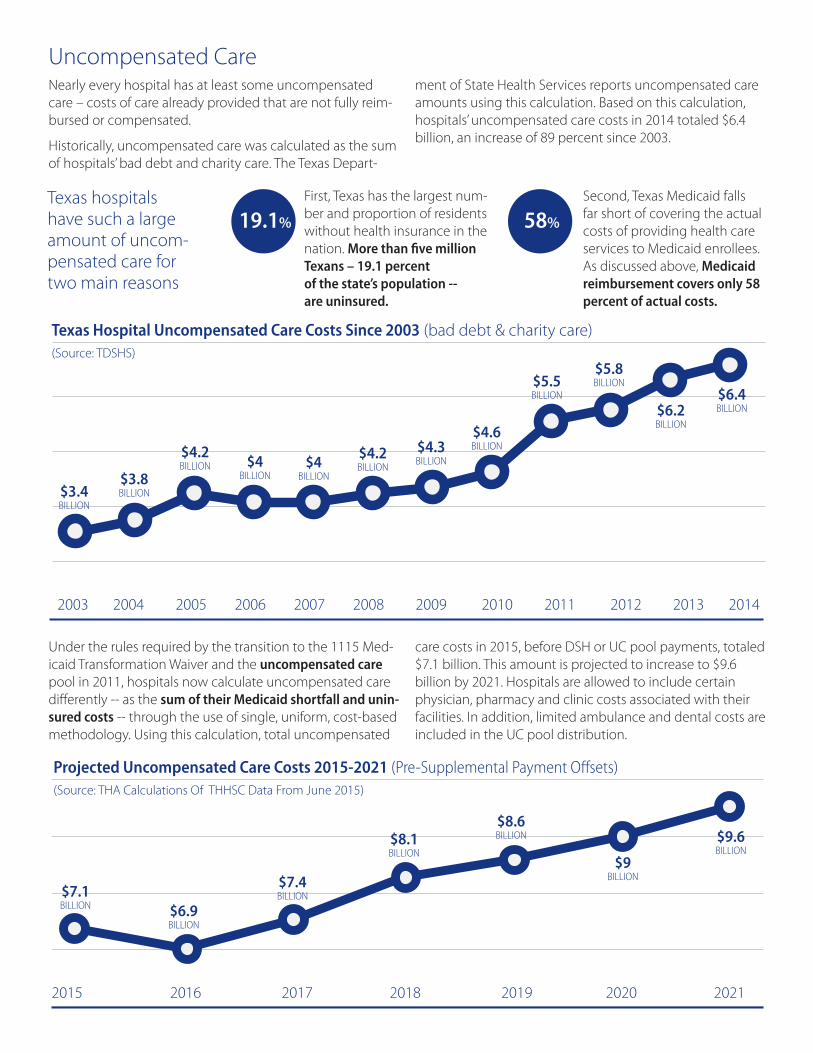
Uncompensated CareNearly every hospital has at least some uncompensated care – costs of care already provided that are not fully reim-bursed or compensated.
Historically, uncompensated care was calculated as the sum of hospitals’ bad debt and charity care. The Texas Depart-
Under the rules required by the transition to the 1115 Med-icaid Transformation Waiver and the uncompensated care pool in 2011, hospitals now calculate uncompensated care differently -- as the sum of their Medicaid shortfall and unin-sured costs -- through the use of single, uniform, cost-based methodology. Using this calculation, total uncompensated
2003 2004 2005 2006 2007 2008 2009 2010 2011 2012 2013 2014
$3.4 BILLION
$3.8 BILLION
$4.2 BILLION $4
BILLION$4
BILLION
$4.2 BILLION
$4.3 BILLION
$4.6 BILLION
$5.5 BILLION
$5.8 BILLION
$6.2 BILLION
$6.4 BILLION
Texas Hospital Uncompensated Care Costs Since 2003 (bad debt & charity care)(Source: TDSHS)
Texas hospitals have such a large amount of uncom-pensated care for two main reasons
First, Texas has the largest num-ber and proportion of residents without health insurance in the nation. More than five million Texans – 19.1 percent of the state’s population -- are uninsured.
Second, Texas Medicaid falls far short of covering the actual costs of providing health care services to Medicaid enrollees. As discussed above, Medicaid reimbursement covers only 58 percent of actual costs.
ment of State Health Services reports uncompensated care amounts using this calculation. Based on this calculation, hospitals’ uncompensated care costs in 2014 totaled $6.4 billion, an increase of 89 percent since 2003.
care costs in 2015, before DSH or UC pool payments, totaled $7.1 billion. This amount is projected to increase to $9.6 billion by 2021. Hospitals are allowed to include certain physician, pharmacy and clinic costs associated with their facilities. In addition, limited ambulance and dental costs are included in the UC pool distribution.
2015 2016 2017 2018 2019 2020 2021
$7.1 BILLION $6.9
BILLION
$7.4 BILLION
$8.1 BILLION
$8.6 BILLION
$9 BILLION
$9.6 BILLION
Projected Uncompensated Care Costs 2015-2021 (Pre-Supplemental Payment Offsets)(Source: THA Calculations Of THHSC Data From June 2015)
19.1% 58%
Supplemental PaymentsGiven the large shortfall between Medicaid payments and the cost of services and the large number of uninsured Tex-ans, supplemental payments are an essential component of financing for Texas hospitals. Currently, there are three types of supplemental payments for which hospitals may be eligible:
1. Disproportionate share hospital payments (DSH); and
2. Waiver payments: a. Uncompensated care pool (UC) payments; and b. Delivery System Reform Incentive Program (DSRIP) payments.
However, in order to receive UC, DSH and DSRIP payments, there must be sufficient non-federal funds to support the payments. As with other Medicaid services, the federal government and the state are required to contribute to these payments. In Texas, however, the state share is funded almost entirely by intergovernmental transfers from public hospitals. (see section below on financing the non-federal share of Medicaid payments)
Each hospital has its own “hospital-specific limit,” established by the Texas Health and Human Services Commission. The
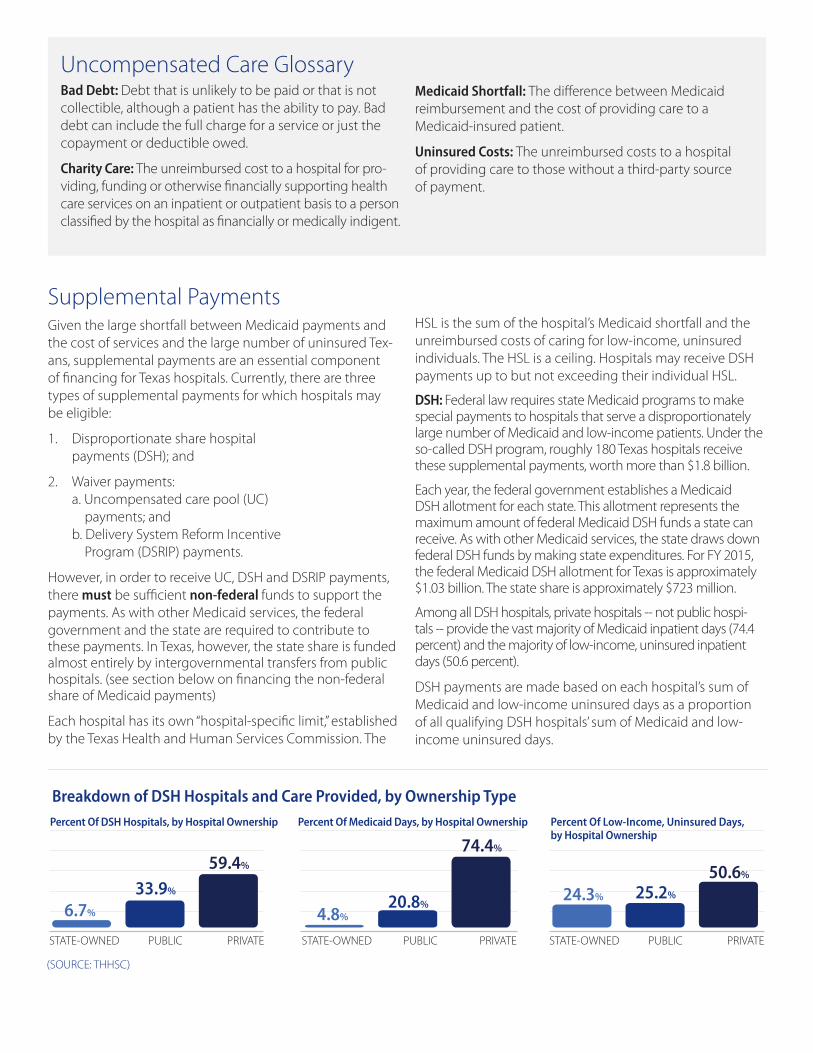
Percent Of DSH Hospitals, by Hospital Ownership
STATE-OWNED PUBLIC PRIVATE
Percent Of Medicaid Days, by Hospital Ownership
STATE-OWNED PUBLIC PRIVATE
Percent Of Low-Income, Uninsured Days, by Hospital Ownership
STATE-OWNED PUBLIC PRIVATE
24.3% 25.2%
50.6%
6.7%
33.9%
59.4%
4.8%20.8%
74.4%
Uncompensated Care GlossaryBad Debt: Debt that is unlikely to be paid or that is not collectible, although a patient has the ability to pay. Bad debt can include the full charge for a service or just the copayment or deductible owed.
Charity Care: The unreimbursed cost to a hospital for pro-viding, funding or otherwise financially supporting health care services on an inpatient or outpatient basis to a person classified by the hospital as financially or medically indigent.
Medicaid Shortfall: The difference between Medicaid reimbursement and the cost of providing care to a Medicaid-insured patient.
Uninsured Costs: The unreimbursed costs to a hospital of providing care to those without a third-party source of payment.
HSL is the sum of the hospital’s Medicaid shortfall and the unreimbursed costs of caring for low-income, uninsured individuals. The HSL is a ceiling. Hospitals may receive DSH payments up to but not exceeding their individual HSL.
DSH: Federal law requires state Medicaid programs to make special payments to hospitals that serve a disproportionately large number of Medicaid and low-income patients. Under the so-called DSH program, roughly 180 Texas hospitals receive these supplemental payments, worth more than $1.8 billion.
Each year, the federal government establishes a Medicaid DSH allotment for each state. This allotment represents the maximum amount of federal Medicaid DSH funds a state can receive. As with other Medicaid services, the state draws down federal DSH funds by making state expenditures. For FY 2015, the federal Medicaid DSH allotment for Texas is approximately $1.03 billion. The state share is approximately $723 million.
Among all DSH hospitals, private hospitals -- not public hospi-tals -- provide the vast majority of Medicaid inpatient days (74.4 percent) and the majority of low-income, uninsured inpatient days (50.6 percent).
DSH payments are made based on each hospital’s sum of Medicaid and low-income uninsured days as a proportion of all qualifying DSH hospitals’ sum of Medicaid and low- income uninsured days.
(SOURCE: THHSC)
Breakdown of DSH Hospitals and Care Provided, by Ownership Type
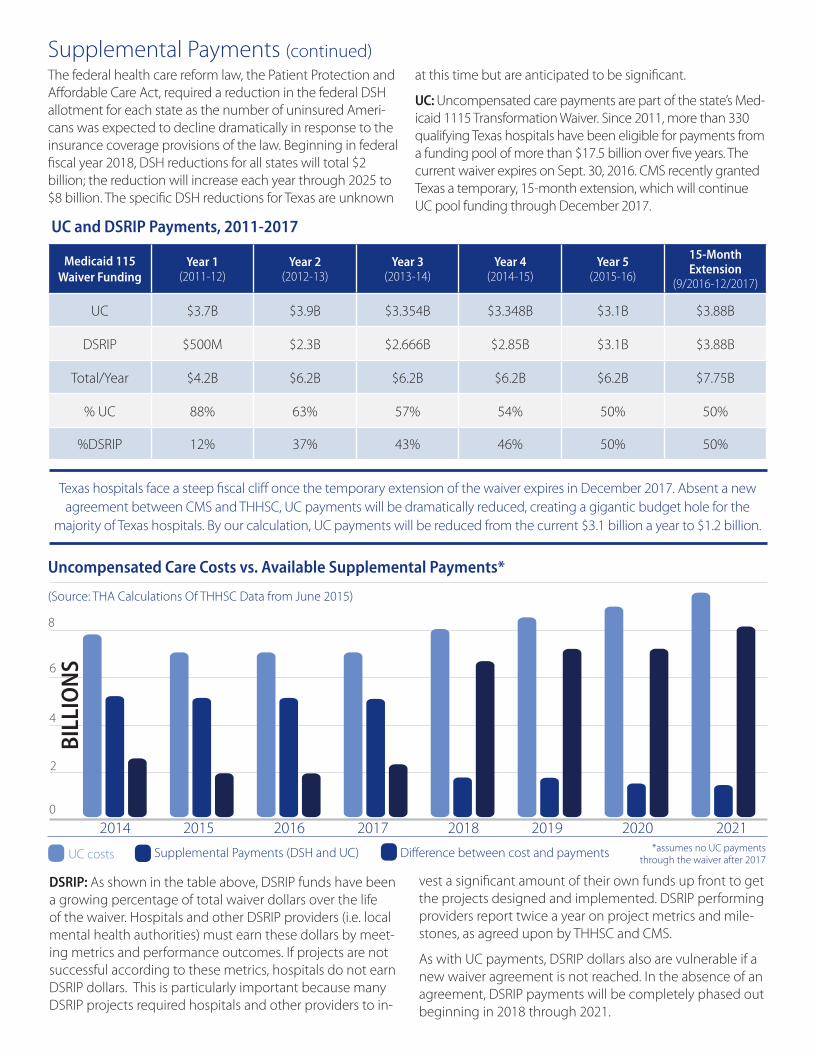
2014 2015 2016 2017 2018 2019 2020 2021
Uncompensated Care Costs vs. Available Supplemental Payments*
(Source: THA Calculations Of THHSC Data from June 2015)
*assumes no UC payments through the waiver after 2017UC costs Supplemental Payments (DSH and UC) Difference between cost and payments
The federal health care reform law, the Patient Protection and Affordable Care Act, required a reduction in the federal DSH allotment for each state as the number of uninsured Ameri-cans was expected to decline dramatically in response to the insurance coverage provisions of the law. Beginning in federal fiscal year 2018, DSH reductions for all states will total $2 billion; the reduction will increase each year through 2025 to $8 billion. The specific DSH reductions for Texas are unknown
Supplemental Payments (continued)at this time but are anticipated to be significant.
UC: Uncompensated care payments are part of the state’s Med-icaid 1115 Transformation Waiver. Since 2011, more than 330 qualifying Texas hospitals have been eligible for payments from a funding pool of more than $17.5 billion over five years. The current waiver expires on Sept. 30, 2016. CMS recently granted Texas a temporary, 15-month extension, which will continue UC pool funding through December 2017.
Medicaid 115Waiver Funding
Year 1 (2011-12)
Year 2 (2012-13)
Year 3 (2013-14)
Year 4 (2014-15)
Year 5 (2015-16)
15-Month Extension
(9/2016-12/2017)
UC $3.7B $3.9B $3.354B $3.348B $3.1B $3.88B
DSRIP $500M $2.3B $2.666B $2.85B $3.1B $3.88B
Total/Year $4.2B $6.2B $6.2B $6.2B $6.2B $7.75B
% UC 88% 63% 57% 54% 50% 50%
%DSRIP 12% 37% 43% 46% 50% 50%
Texas hospitals face a steep fiscal cliff once the temporary extension of the waiver expires in December 2017. Absent a new agreement between CMS and THHSC, UC payments will be dramatically reduced, creating a gigantic budget hole for the
majority of Texas hospitals. By our calculation, UC payments will be reduced from the current $3.1 billion a year to $1.2 billion.
DSRIP: As shown in the table above, DSRIP funds have been a growing percentage of total waiver dollars over the life of the waiver. Hospitals and other DSRIP providers (i.e. local mental health authorities) must earn these dollars by meet-ing metrics and performance outcomes. If projects are not successful according to these metrics, hospitals do not earn DSRIP dollars. This is particularly important because many DSRIP projects required hospitals and other providers to in-
vest a significant amount of their own funds up front to get the projects designed and implemented. DSRIP performing providers report twice a year on project metrics and mile-stones, as agreed upon by THHSC and CMS.
As with UC payments, DSRIP dollars also are vulnerable if a new waiver agreement is not reached. In the absence of an agreement, DSRIP payments will be completely phased out beginning in 2018 through 2021.
0
8
6
4
2
UC and DSRIP Payments, 2011-2017
BILL
ION
S
Texas traditionally has relied on the largest public hospitals in the state to provide the state share of Medicaid DSH, UC and DSRIP funds necessary to draw down federal funds. Through “intergovernmental transfers (IGTs),” a local governmental entity – in Texas, primarily public hospitals – make a transfer of funds to the Texas Health and Human Services Commission.
In 2013, for the first time, the state legislature appropriated state general revenue funds averaging $150 million for FY 2014 and 2015 to alleviate some of the burden on the public hospitals to finance DSH payments. Nonetheless, the burden on the public hospitals totaled $395 million in FY 2014. These state funds have not been maintained. As a result, today, the full cost of the state share for DSH payments to non-state owned hospitals falls to the public hospitals. At the same time, the full state share of UC and most DSRIP payments for non-state hospitals is borne by public hospitals.
Public hospitals’ continued ability to provide this essential IGT is at risk for a number of reasons:
1. Growing pressure to stabilize or even reduce local prop-erty taxes;
2. Persistently high number of uninsured;
3. State funding cuts, including 10 percent reduction in Medicaid inpatient and outpatient reimbursement rates; reduction of facility payments for use of the hospital ER for non-emergent reasons; elimination of payment for elective deliveries before 39 weeks; and reduction of reimbursement rates based on potentially preventable adverse events; and
4. Federal funding cuts, including prolonged Medicare sequestration.
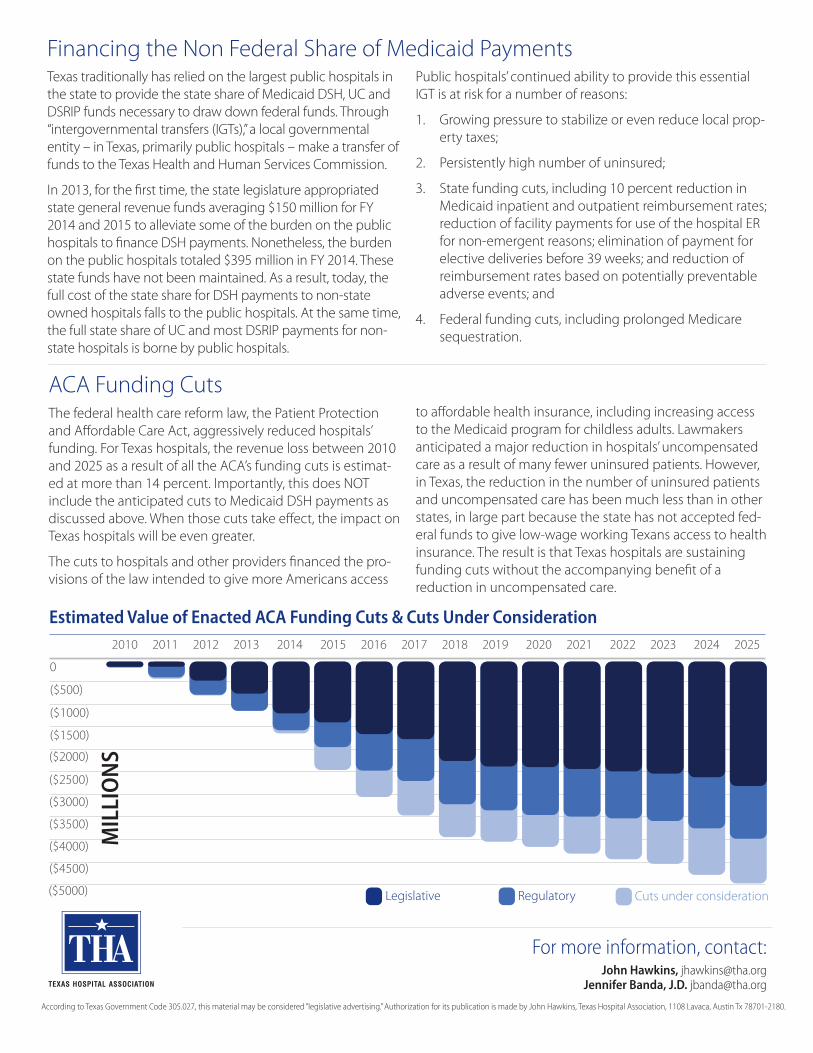
ACA Funding CutsThe federal health care reform law, the Patient Protection and Affordable Care Act, aggressively reduced hospitals’ funding. For Texas hospitals, the revenue loss between 2010 and 2025 as a result of all the ACA’s funding cuts is estimat-ed at more than 14 percent. Importantly, this does NOT include the anticipated cuts to Medicaid DSH payments as discussed above. When those cuts take effect, the impact on Texas hospitals will be even greater.
The cuts to hospitals and other providers financed the pro-visions of the law intended to give more Americans access
Financing the Non Federal Share of Medicaid Payments
Estimated Value of Enacted ACA Funding Cuts & Cuts Under Consideration
0
($500)
($1000)
($1500)
($2000)
($2500)
($3000)
($3500)
($4000)
($4500)
($5000)
MIL
LIO
NS
2010 2011 2012 2013 2014 2015 2016 2017 2018 2019 2020 2021 2022 2023 2024 2025
Cuts under considerationRegulatoryLegislative
to affordable health insurance, including increasing access to the Medicaid program for childless adults. Lawmakers anticipated a major reduction in hospitals’ uncompensated care as a result of many fewer uninsured patients. However, in Texas, the reduction in the number of uninsured patients and uncompensated care has been much less than in other states, in large part because the state has not accepted fed-eral funds to give low-wage working Texans access to health insurance. The result is that Texas hospitals are sustaining funding cuts without the accompanying benefit of a reduction in uncompensated care.
For more information, contact:John Hawkins, [email protected]
Jennifer Banda, J.D. [email protected]
According to Texas Government Code 305.027, this material may be considered “legislative advertising.” Authorization for its publication is made by John Hawkins, Texas Hospital Association, 1108 Lavaca, Austin Tx 78701-2180.
1
Testimony for House Appropriations Art. II Sub-Committee Hearing
Charge: Texas Healthcare Transformation and Quality Improvement Program 1115 Waiver (Invited Testimony July 13th, 2016. Dr. Fred Cerise, THOT Chair, President & CEO of
Parkland Health and Hospital System). Who we are
• While only representing about five percent of Texas’ hospitals and 16% of patient days, THOT members provide 23% of Medicaid care; 36% of the hospital care provided to uninsured Texans; almost two-thirds of Level 1 Trauma care; and about two-thirds of hospital based Graduate Medical Education residencies. THOT members comprise 11 of the 20 waiver anchors; provide significant outpatient care; and provide the bulk of the state match for the waivers’ billions in healthcare investments for Texas providers (See Appendix Chart 1).
Thank you - Increased funding in 16-17
• Thank you for Trauma SDA Add On funding increase from payments of about $87M of $300 trauma UC to about $180M (See Appendix Chart 2). We are particularly grateful since THOT’s members provide nearly half of Texas’ uncompensated trauma care.
• Thank you also for the Safety Net Add On which brought safety net funding for hospitals
and systems that provide care to low income Texans to $135M all funds per year for the biennium. While the prior session’s $300 million General Revenue support for DSH was not continued, the trauma and safety net add on payments helped to offset part of that discontinuation.
• To better target scarce state funds consistent with legislative language, we recommend that
moving forward, safety net funding be distributed based on providers’ share of both Medicaid and uninsured care provided. Under the current distribution methodology, providers serving a significant share of uninsured Texans are disadvantaged. For providers with thin margins, these funds make a difference in providing care or cutting services. (Page 2 of the detailed testimony provides an illustration.)
Emerging Financial Challenges Texas’ 1115 Waiver Renewal • We are thankful and appreciative of HHSC’s successful 15-month waiver extension at
current funding levels. The extension provides short term stability and certainty.
THOT members shared commitments include: Supporting access to care for all in our communities, with a special focus on
vulnerable populations; Providing and coordinating essential community health services, such as
trauma and disaster management; and Preparing for the future by training tomorrow’s healthcare providers and
supporting clinical and health delivery system research and transformation.
2
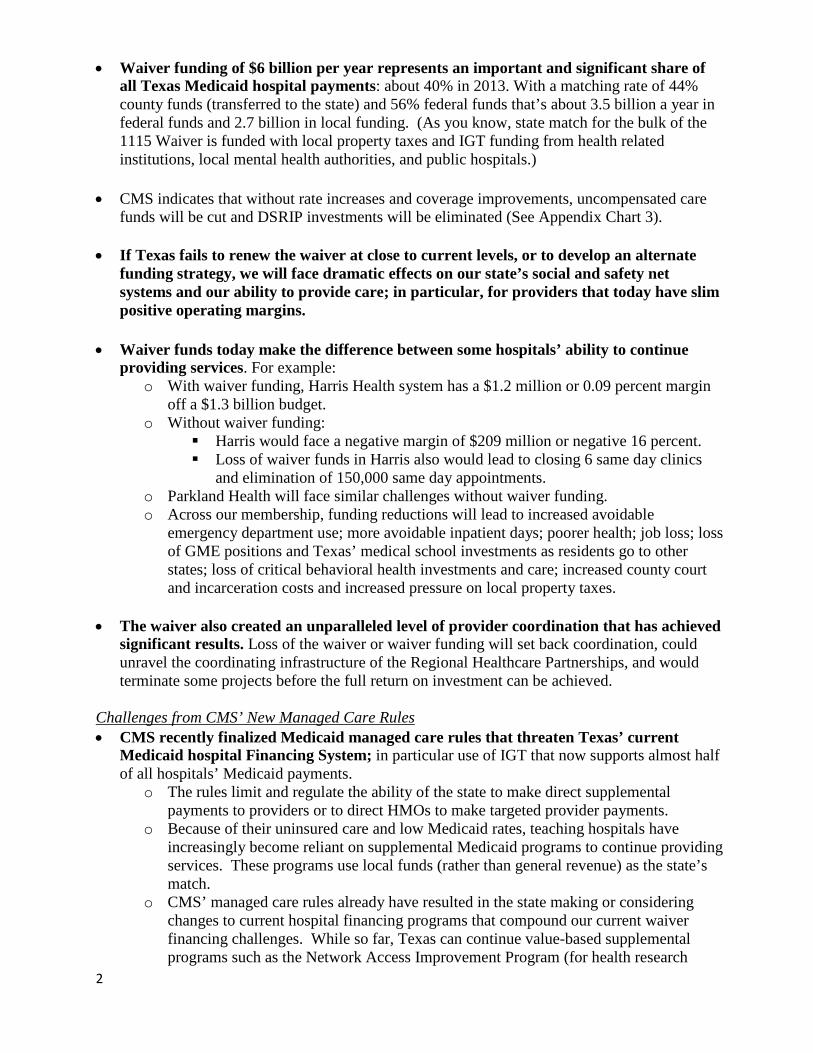
• Waiver funding of $6 billion per year represents an important and significant share of all Texas Medicaid hospital payments: about 40% in 2013. With a matching rate of 44% county funds (transferred to the state) and 56% federal funds that’s about 3.5 billion a year in federal funds and 2.7 billion in local funding. (As you know, state match for the bulk of the 1115 Waiver is funded with local property taxes and IGT funding from health related institutions, local mental health authorities, and public hospitals.)
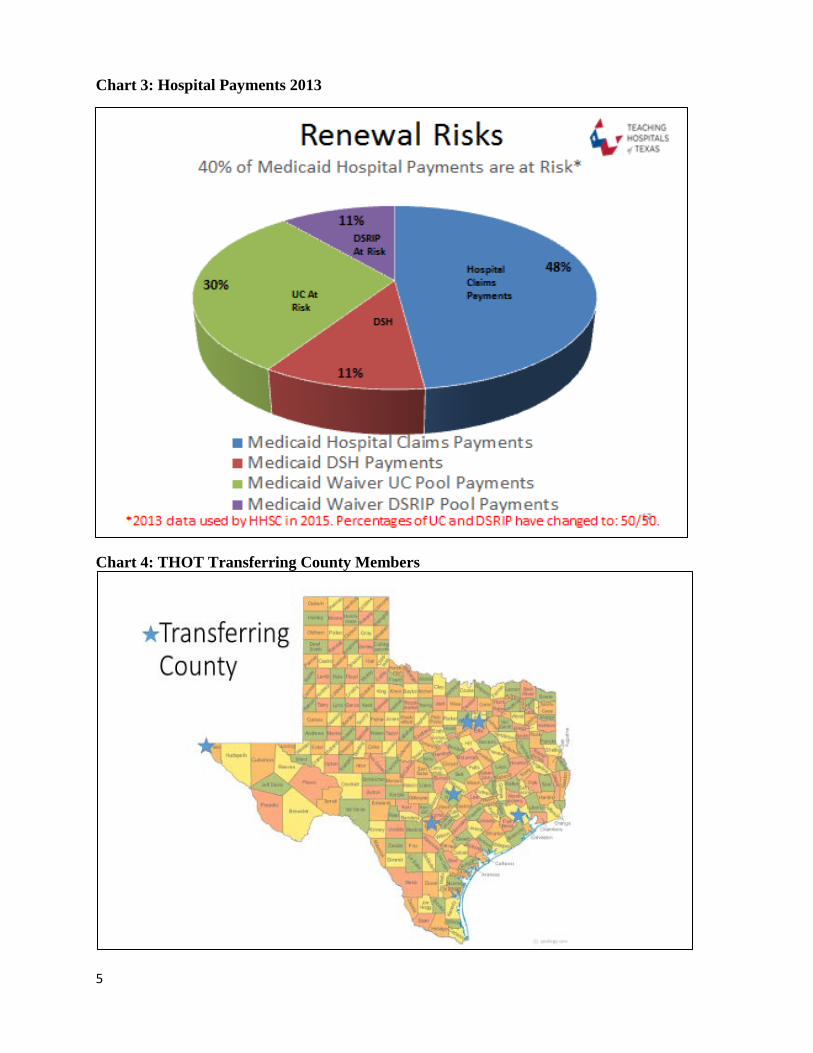
• CMS indicates that without rate increases and coverage improvements, uncompensated care funds will be cut and DSRIP investments will be eliminated (See Appendix Chart 3).
• If Texas fails to renew the waiver at close to current levels, or to develop an alternate funding strategy, we will face dramatic effects on our state’s social and safety net systems and our ability to provide care; in particular, for providers that today have slim positive operating margins.
• Waiver funds today make the difference between some hospitals’ ability to continue
providing services. For example: o With waiver funding, Harris Health system has a $1.2 million or 0.09 percent margin
off a $1.3 billion budget. o Without waiver funding:
Harris would face a negative margin of $209 million or negative 16 percent. Loss of waiver funds in Harris also would lead to closing 6 same day clinics
and elimination of 150,000 same day appointments. o Parkland Health will face similar challenges without waiver funding. o Across our membership, funding reductions will lead to increased avoidable
emergency department use; more avoidable inpatient days; poorer health; job loss; loss of GME positions and Texas’ medical school investments as residents go to other states; loss of critical behavioral health investments and care; increased county court and incarceration costs and increased pressure on local property taxes.
• The waiver also created an unparalleled level of provider coordination that has achieved
significant results. Loss of the waiver or waiver funding will set back coordination, could unravel the coordinating infrastructure of the Regional Healthcare Partnerships, and would terminate some projects before the full return on investment can be achieved.
Challenges from CMS’ New Managed Care Rules • CMS recently finalized Medicaid managed care rules that threaten Texas’ current
Medicaid hospital Financing System; in particular use of IGT that now supports almost half of all hospitals’ Medicaid payments.
o The rules limit and regulate the ability of the state to make direct supplemental payments to providers or to direct HMOs to make targeted provider payments.
o Because of their uninsured care and low Medicaid rates, teaching hospitals have increasingly become reliant on supplemental Medicaid programs to continue providing services. These programs use local funds (rather than general revenue) as the state’s match.
o CMS’ managed care rules already have resulted in the state making or considering changes to current hospital financing programs that compound our current waiver financing challenges. While so far, Texas can continue value-based supplemental programs such as the Network Access Improvement Program (for health research
3
institutions and public hospitals), CMS is looking more closely and critically at the use of local funding and how these programs are set up.
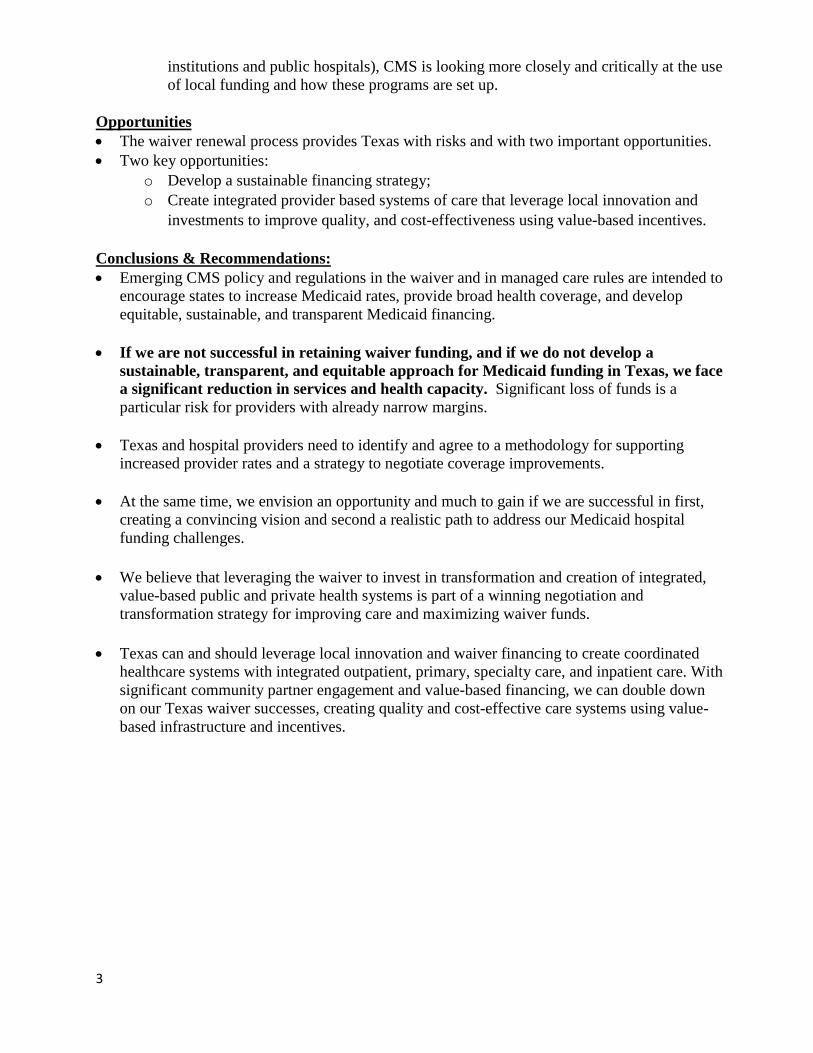
Opportunities • The waiver renewal process provides Texas with risks and with two important opportunities. • Two key opportunities:
o Develop a sustainable financing strategy; o Create integrated provider based systems of care that leverage local innovation and
investments to improve quality, and cost-effectiveness using value-based incentives. Conclusions & Recommendations: • Emerging CMS policy and regulations in the waiver and in managed care rules are intended to
encourage states to increase Medicaid rates, provide broad health coverage, and develop equitable, sustainable, and transparent Medicaid financing.
• If we are not successful in retaining waiver funding, and if we do not develop a sustainable, transparent, and equitable approach for Medicaid funding in Texas, we face a significant reduction in services and health capacity. Significant loss of funds is a particular risk for providers with already narrow margins.
• Texas and hospital providers need to identify and agree to a methodology for supporting increased provider rates and a strategy to negotiate coverage improvements.
• At the same time, we envision an opportunity and much to gain if we are successful in first, creating a convincing vision and second a realistic path to address our Medicaid hospital funding challenges.
• We believe that leveraging the waiver to invest in transformation and creation of integrated,
value-based public and private health systems is part of a winning negotiation and transformation strategy for improving care and maximizing waiver funds.
• Texas can and should leverage local innovation and waiver financing to create coordinated
healthcare systems with integrated outpatient, primary, specialty care, and inpatient care. With significant community partner engagement and value-based financing, we can double down on our Texas waiver successes, creating quality and cost-effective care systems using value-based infrastructure and incentives.

4
Appendix:
Chart 1: THOT’s Key Hospital Activity
Chart 2: SDA Trauma Care Add-on 2016-2017
0
20
40
60
80
100
120
140
160
180
Est. Trauma Approps2015
Est. Trauma Approps2016
Est. Trauma Approps2017
2016-2017 Trauma SDA Add-On Thank you!
Federal $
Trauma GR
Millions
5
Chart 3: Hospital Payments 2013
Chart 4: THOT Transferring County Members
1
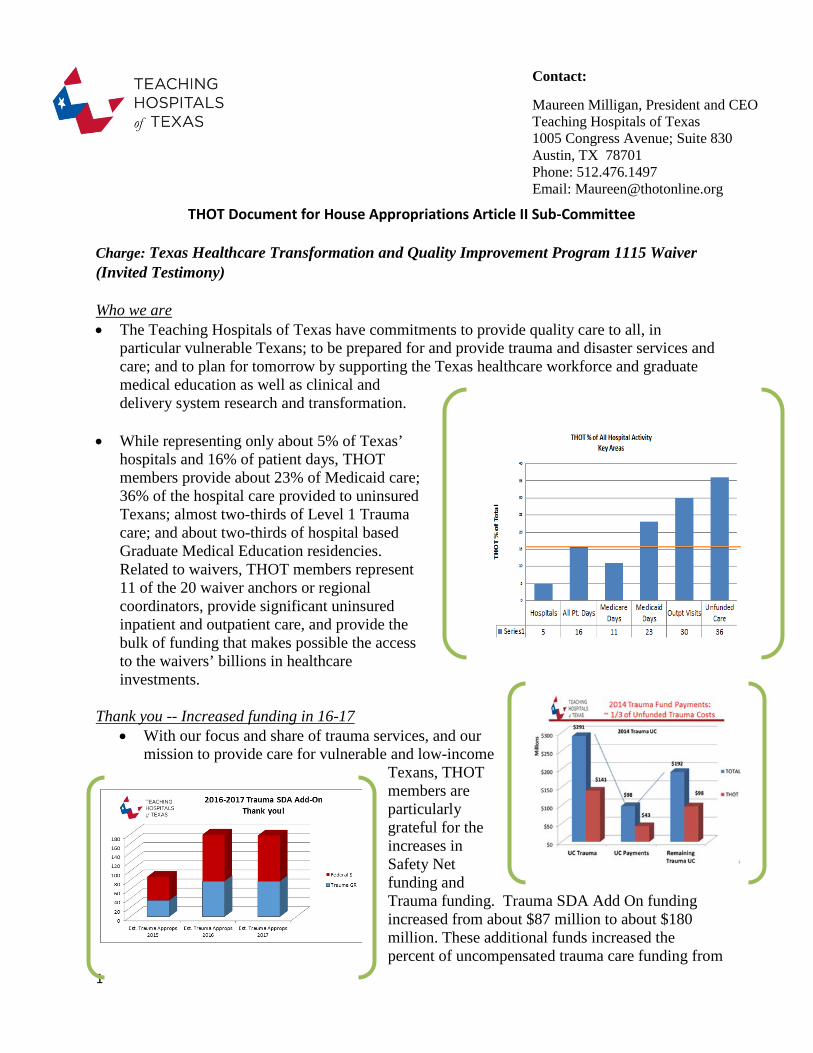
Contact:
Maureen Milligan, President and CEO Teaching Hospitals of Texas 1005 Congress Avenue; Suite 830 Austin, TX 78701 Phone: 512.476.1497 Email: [email protected]
THOT Document for House Appropriations Article II Sub-Committee
Charge: Texas Healthcare Transformation and Quality Improvement Program 1115 Waiver (Invited Testimony) Who we are • The Teaching Hospitals of Texas have commitments to provide quality care to all, in
particular vulnerable Texans; to be prepared for and provide trauma and disaster services and care; and to plan for tomorrow by supporting the Texas healthcare workforce and graduate medical education as well as clinical and delivery system research and transformation.
• While representing only about 5% of Texas’ hospitals and 16% of patient days, THOT members provide about 23% of Medicaid care; 36% of the hospital care provided to uninsured Texans; almost two-thirds of Level 1 Trauma care; and about two-thirds of hospital based Graduate Medical Education residencies. Related to waivers, THOT members represent 11 of the 20 waiver anchors or regional coordinators, provide significant uninsured inpatient and outpatient care, and provide the bulk of funding that makes possible the access to the waivers’ billions in healthcare investments.
Thank you -- Increased funding in 16-17
• With our focus and share of trauma services, and our mission to provide care for vulnerable and low-income
Texans, THOT members are particularly grateful for the increases in Safety Net funding and Trauma funding. Trauma SDA Add On funding increased from about $87 million to about $180 million. These additional funds increased the percent of uncompensated trauma care funding from
2
one-third (as in the 2014 chart above) to about two-thirds; leaving only one-third of uncompensated trauma costs without trauma funding in 2016-2017. While the prior session’s $300 million General Revenue support for DSH was not continued, the trauma and safety net add on payments helped to offset part of that discontinuation.
• Thank you also for the safety net add on which brought safety net funding for hospitals and
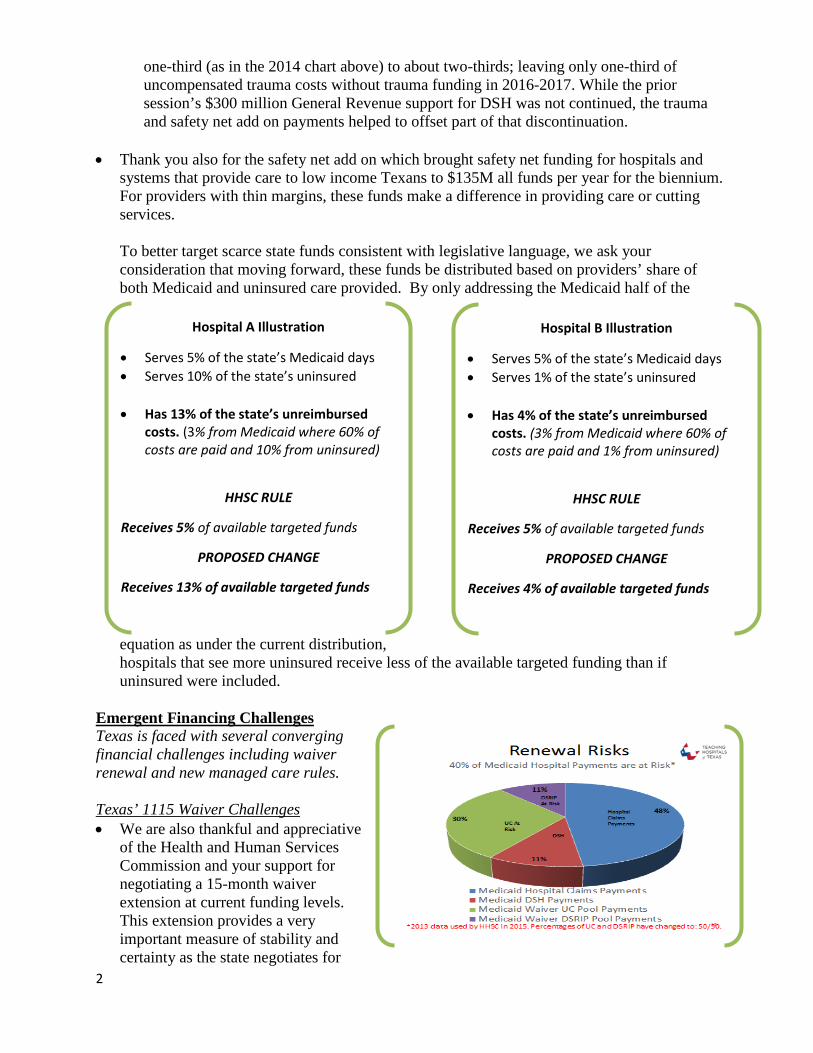
systems that provide care to low income Texans to $135M all funds per year for the biennium. For providers with thin margins, these funds make a difference in providing care or cutting services. To better target scarce state funds consistent with legislative language, we ask your consideration that moving forward, these funds be distributed based on providers’ share of both Medicaid and uninsured care provided. By only addressing the Medicaid half of the
equation as under the current distribution, hospitals that see more uninsured receive less of the available targeted funding than if uninsured were included.
Emergent Financing Challenges Texas is faced with several converging financial challenges including waiver renewal and new managed care rules. Texas’ 1115 Waiver Challenges • We are also thankful and appreciative
of the Health and Human Services Commission and your support for negotiating a 15-month waiver extension at current funding levels. This extension provides a very important measure of stability and certainty as the state negotiates for
Hospital A Illustration
• Serves 5% of the state’s Medicaid days • Serves 10% of the state’s uninsured
• Has 13% of the state’s unreimbursed
costs. (3% from Medicaid where 60% of costs are paid and 10% from uninsured)
HHSC RULE
Receives 5% of available targeted funds
PROPOSED CHANGE
Receives 13% of available targeted funds
Hospital B Illustration
• Serves 5% of the state’s Medicaid days • Serves 1% of the state’s uninsured
• Has 4% of the state’s unreimbursed
costs. (3% from Medicaid where 60% of costs are paid and 1% from uninsured)
HHSC RULE
Receives 5% of available targeted funds
PROPOSED CHANGE
Receives 4% of available targeted funds
3
the full waiver renewal. THOT members include the entities providing the majority of state match for the waiver’s $6 billion in funding; and represent 11 of the 20 waiver “anchors” or administrative coordinators throughout Texas. Waiver funding is particularly crucial for our members since it makes the difference between slim positive and significant negative margins and their ability to maintain services.
• The 1115 Waiver is funded on the local level through Intergovernmental Transfers from health related institutions, local mental health authorities, and public hospitals.
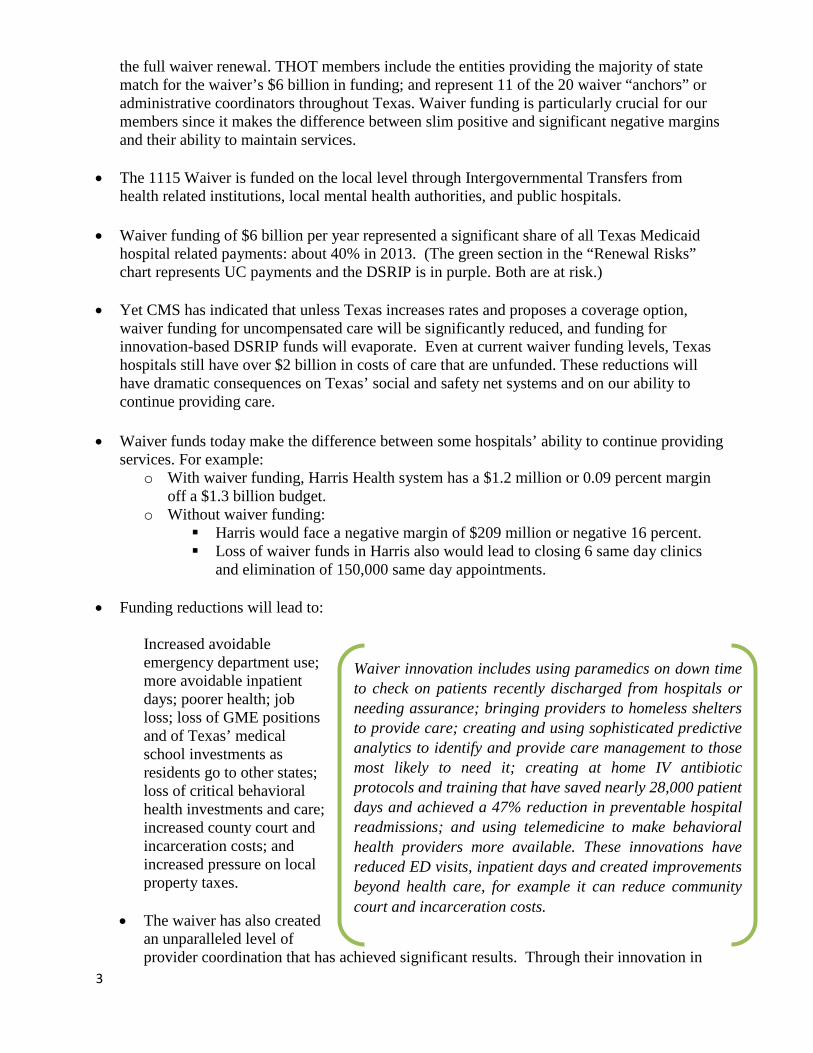
• Waiver funding of $6 billion per year represented a significant share of all Texas Medicaid
hospital related payments: about 40% in 2013. (The green section in the “Renewal Risks” chart represents UC payments and the DSRIP is in purple. Both are at risk.)
• Yet CMS has indicated that unless Texas increases rates and proposes a coverage option, waiver funding for uncompensated care will be significantly reduced, and funding for innovation-based DSRIP funds will evaporate. Even at current waiver funding levels, Texas hospitals still have over $2 billion in costs of care that are unfunded. These reductions will have dramatic consequences on Texas’ social and safety net systems and on our ability to continue providing care.
• Waiver funds today make the difference between some hospitals’ ability to continue providing
services. For example: o With waiver funding, Harris Health system has a $1.2 million or 0.09 percent margin
off a $1.3 billion budget. o Without waiver funding:
Harris would face a negative margin of $209 million or negative 16 percent. Loss of waiver funds in Harris also would lead to closing 6 same day clinics
and elimination of 150,000 same day appointments.
• Funding reductions will lead to:
Increased avoidable emergency department use; more avoidable inpatient days; poorer health; job loss; loss of GME positions and of Texas’ medical school investments as residents go to other states; loss of critical behavioral health investments and care; increased county court and incarceration costs; and increased pressure on local property taxes.
• The waiver has also created an unparalleled level of provider coordination that has achieved significant results. Through their innovation in
Waiver innovation includes using paramedics on down time to check on patients recently discharged from hospitals or needing assurance; bringing providers to homeless shelters to provide care; creating and using sophisticated predictive analytics to identify and provide care management to those most likely to need it; creating at home IV antibiotic protocols and training that have saved nearly 28,000 patient days and achieved a 47% reduction in preventable hospital readmissions; and using telemedicine to make behavioral health providers more available. These innovations have reduced ED visits, inpatient days and created improvements beyond health care, for example it can reduce community court and incarceration costs.
4
the current waiver, providers including hospitals, behavioral health providers, participating physicians, and other integrated partners have reduced avoidable Emergency Department visits, inpatient stays and provided better care often with less cost that focuses on the needs of patients.
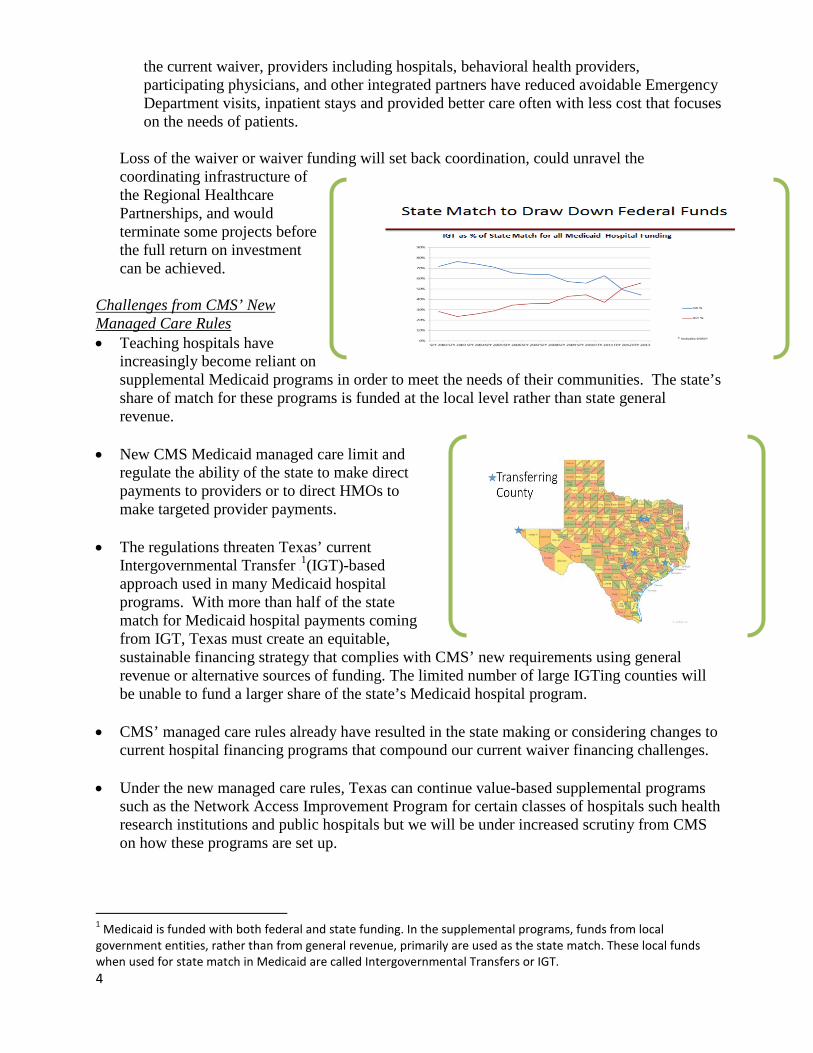
Loss of the waiver or waiver funding will set back coordination, could unravel the coordinating infrastructure of the Regional Healthcare Partnerships, and would terminate some projects before the full return on investment can be achieved.
Challenges from CMS’ New Managed Care Rules • Teaching hospitals have
increasingly become reliant on supplemental Medicaid programs in order to meet the needs of their communities. The state’s share of match for these programs is funded at the local level rather than state general revenue.
• New CMS Medicaid managed care limit and regulate the ability of the state to make direct payments to providers or to direct HMOs to make targeted provider payments.
• The regulations threaten Texas’ current Intergovernmental Transfer 0 F
1(IGT)-based approach used in many Medicaid hospital programs. With more than half of the state match for Medicaid hospital payments coming from IGT, Texas must create an equitable, sustainable financing strategy that complies with CMS’ new requirements using general revenue or alternative sources of funding. The limited number of large IGTing counties will be unable to fund a larger share of the state’s Medicaid hospital program.
• CMS’ managed care rules already have resulted in the state making or considering changes to current hospital financing programs that compound our current waiver financing challenges.
• Under the new managed care rules, Texas can continue value-based supplemental programs such as the Network Access Improvement Program for certain classes of hospitals such health research institutions and public hospitals but we will be under increased scrutiny from CMS on how these programs are set up.
1 Medicaid is funded with both federal and state funding. In the supplemental programs, funds from local government entities, rather than from general revenue, primarily are used as the state match. These local funds when used for state match in Medicaid are called Intergovernmental Transfers or IGT.
5
Opportunities • Waiver renewal negotiations provide Texas with risks but also with two important
opportunities:
o First, the renewal process provides an impetus to address our need for a long term sustainable approach to equitably fund Medicaid payments for hospitals.
o Second, it provides Texas and Texas providers the opportunity to use the lessons and successes of the current waiver to create public and private provider based integrated systems of care. What does that mean?
• First with Medicaid rates paying most hospitals significantly less than the costs of services
provided, myriad complex payment programs, largely funded by a diminishing number of counties’ property taxes, have evolved into a very complicated, unstable and unsustainable patchwork of Medicaid hospital financing. In addition to DSH, Texas used UPL, and now has DSRIP, UC, NAIP and MPAP1F
i programs– mostly funded with county property tax and complex financing relationships. The waiver renewal process will give Texas the opportunity to create a more streamlined efficient and equitable payment system that addresses the fundamental problems of low hospital rates, and increasing dependence on a diminishing number of local county property taxes.
• Second, the waiver renewal offers Texas providers the opportunity to create provider based, integrated healthcare systems that improve care and bend the cost curve by tapping into the deep roots and strong community relationships that our public and private hospitals have. It provides the opportunity to continue providing innovative care for all Texans, including uninsured Texans through “DSRIP” innovation in provider based systems. CMS has supported and encouraged similar integrated provider based systems that include approaches like these (for example in New York and California), that preference value of care over simple volume of care. Through the 1115 waiver, Texas has been leading the way with an unprecedented scale of innovation and local engagement.
Conclusions and recommendations: • Emerging CMS policy and regulations in the waiver and in managed care rules are intended to
encourage states to increase Medicaid rates, provide health coverage, and develop equitable, sustainable, and transparent Medicaid financing.
• If we aren’t successful in negotiating the waiver renewal and funding, and if we do not develop a sustainable, transparent, and equitable approach for Medicaid funding in Texas, we’ll face significant care reductions.
Two key opportunities: 1) Develop sustainable financing; 2) Create integrated provider based
systems of care that leverage local innovation and investments improving quality, and cost-effectiveness using value-based incentives.
6
• Texas and hospital providers need to identify and agree to a methodology for supporting increased provider rates and a strategy to negotiate coverage improvements in order to limit CMS’ funding cuts.
• At the same time, we envision an opportunity and much to gain if we are successful in first, creating a convincing vision and second a realistic path to address our Medicaid hospital funding challenges.
• We believe that leveraging the waiver to invest in transformation and creation of integrated, value-based public and private health systems is part of a winning negotiation and transformation strategy for improving care and maximizing waiver funds.
• Texas can and should leverage local innovation and waiver financing to continue waiver funding for investments in coordinated provider-based healthcare systems with integrated outpatient, primary, specialty care, and inpatient care for uninsured Texans losing services now available through DSRIP. With significant community partner engagement and value-based financing, we can double down on our Texas waiver successes, creating quality and cost-effective care systems using value-based infrastructure and incentives.
7
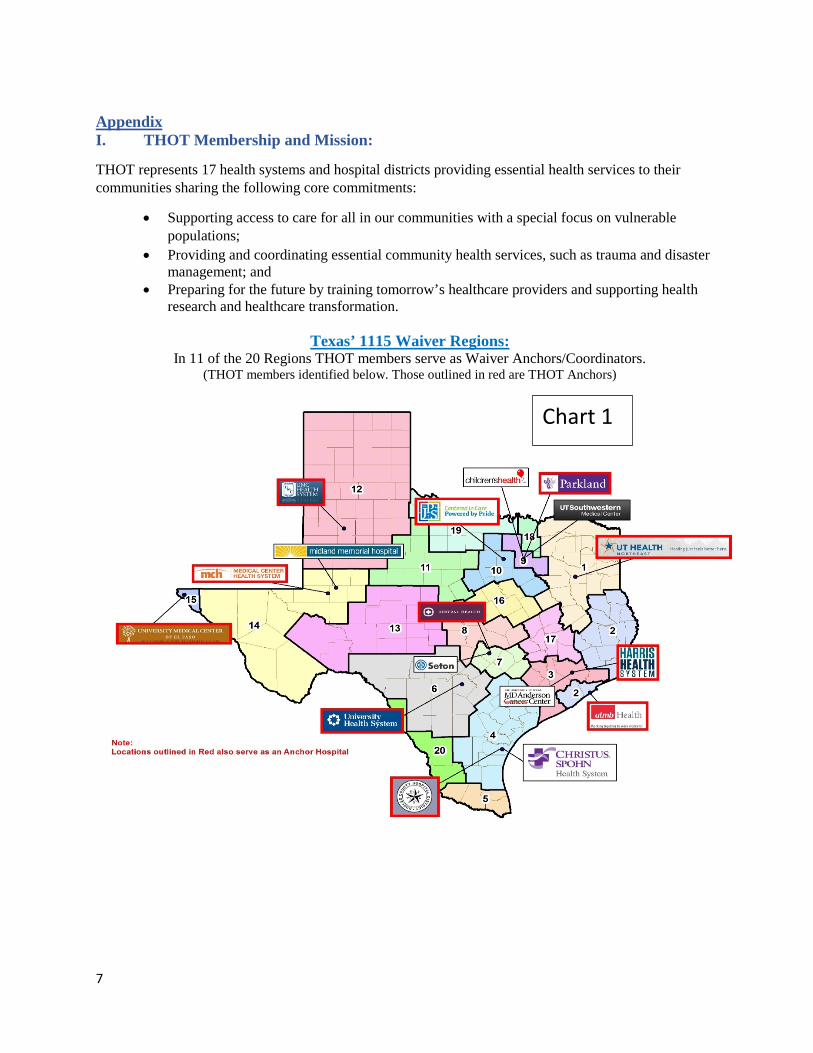
Appendix I. THOT Membership and Mission:
THOT represents 17 health systems and hospital districts providing essential health services to their communities sharing the following core commitments:
• Supporting access to care for all in our communities with a special focus on vulnerable populations;
• Providing and coordinating essential community health services, such as trauma and disaster management; and
• Preparing for the future by training tomorrow’s healthcare providers and supporting health research and healthcare transformation.
Texas’ 1115 Waiver Regions:
In 11 of the 20 Regions THOT members serve as Waiver Anchors/Coordinators. (THOT members identified below. Those outlined in red are THOT Anchors)
Chart 1

8
i Disproportionate Share Hospital or DSH funding; Upper Payment Limit or UPL funding; Delivery System Reform Incentive Payment or DSRIP funding; Uncompensated Care or UC funding; Network Access Improvement Program or NAIP, and Minimum Payments Amounts Program or MPAP.
Testimony of the Children’s Hospital Association of Texas
House Appropriations Committee July 13, 2016
Stacy E. Wilson, J.D. President 823 Congress Ave., Suite 1500 Austin, TX 78701 (512) 320-0910
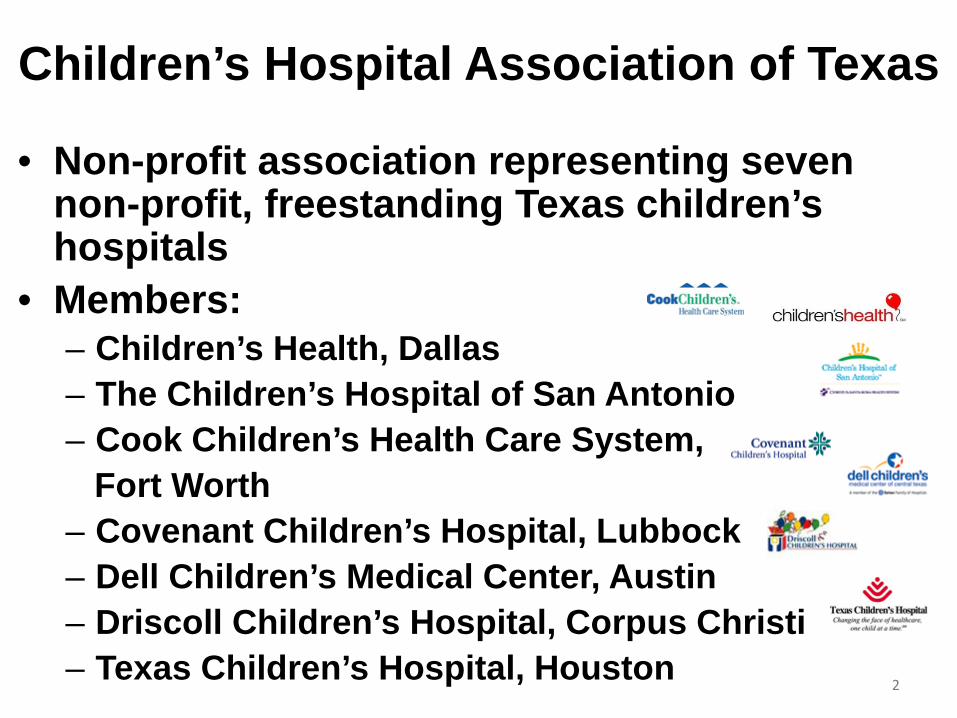
Children’s Hospital Association of Texas
2
• Non-profit association representing seven non-profit, freestanding Texas children’s hospitals
• Members: – Children’s Health, Dallas – The Children’s Hospital of San Antonio – Cook Children’s Health Care System, Fort Worth – Covenant Children’s Hospital, Lubbock – Dell Children’s Medical Center, Austin – Driscoll Children’s Hospital, Corpus Christi – Texas Children’s Hospital, Houston
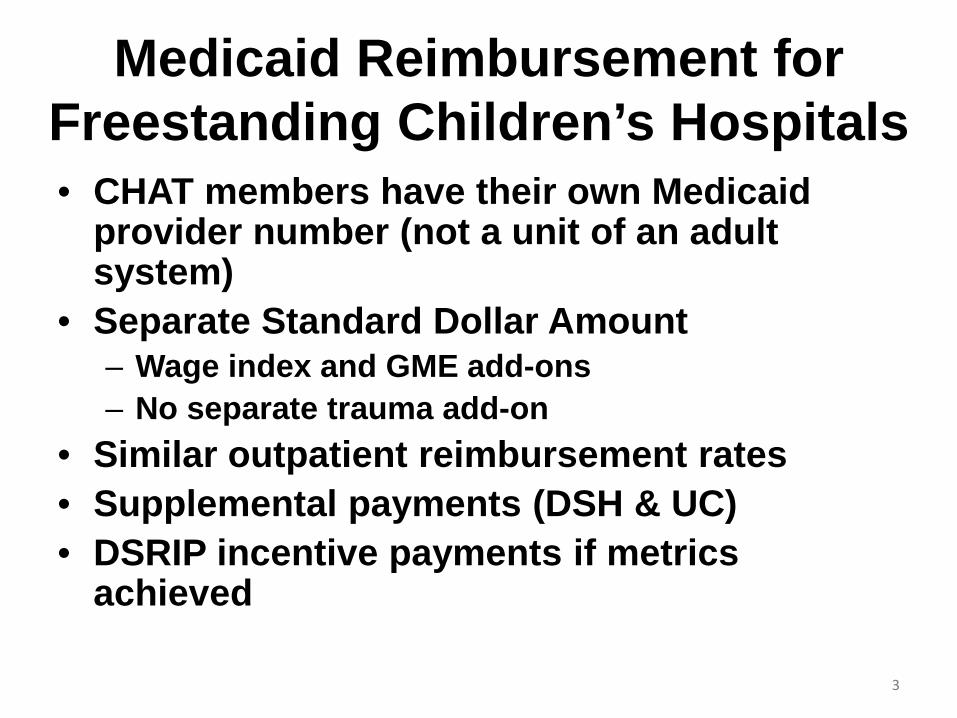
Medicaid Reimbursement for Freestanding Children’s Hospitals • CHAT members have their own Medicaid
provider number (not a unit of an adult system)
• Separate Standard Dollar Amount – Wage index and GME add-ons – No separate trauma add-on
• Similar outpatient reimbursement rates • Supplemental payments (DSH & UC) • DSRIP incentive payments if metrics
achieved
3
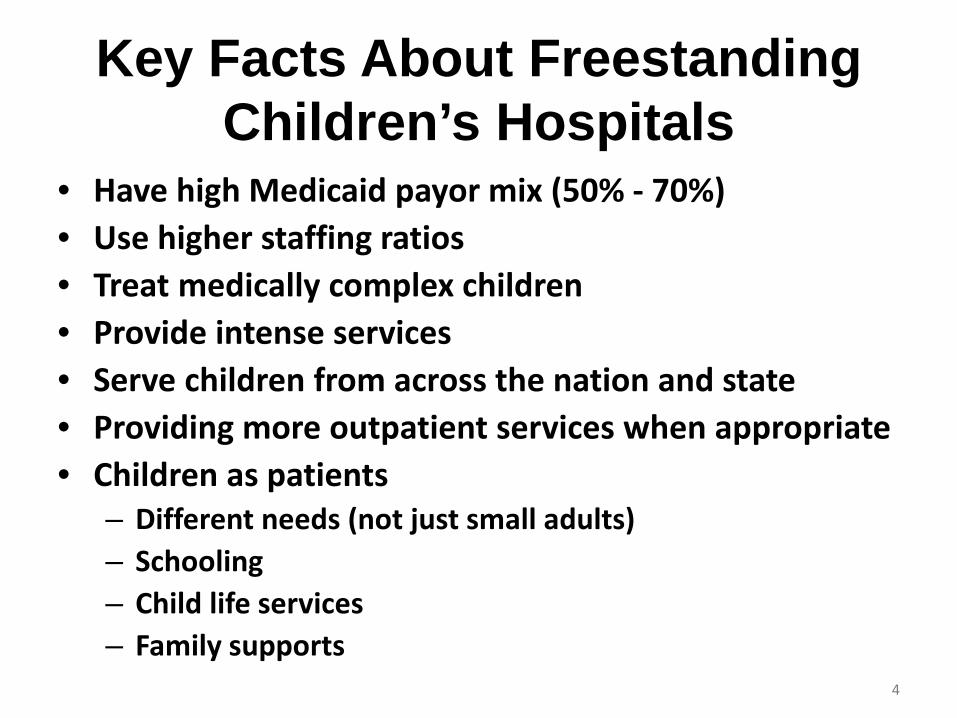
Key Facts About Freestanding Children’s Hospitals
• Have high Medicaid payor mix (50% - 70%) • Use higher staffing ratios • Treat medically complex children • Provide intense services • Serve children from across the nation and state • Providing more outpatient services when appropriate • Children as patients
– Different needs (not just small adults) – Schooling – Child life services – Family supports
4
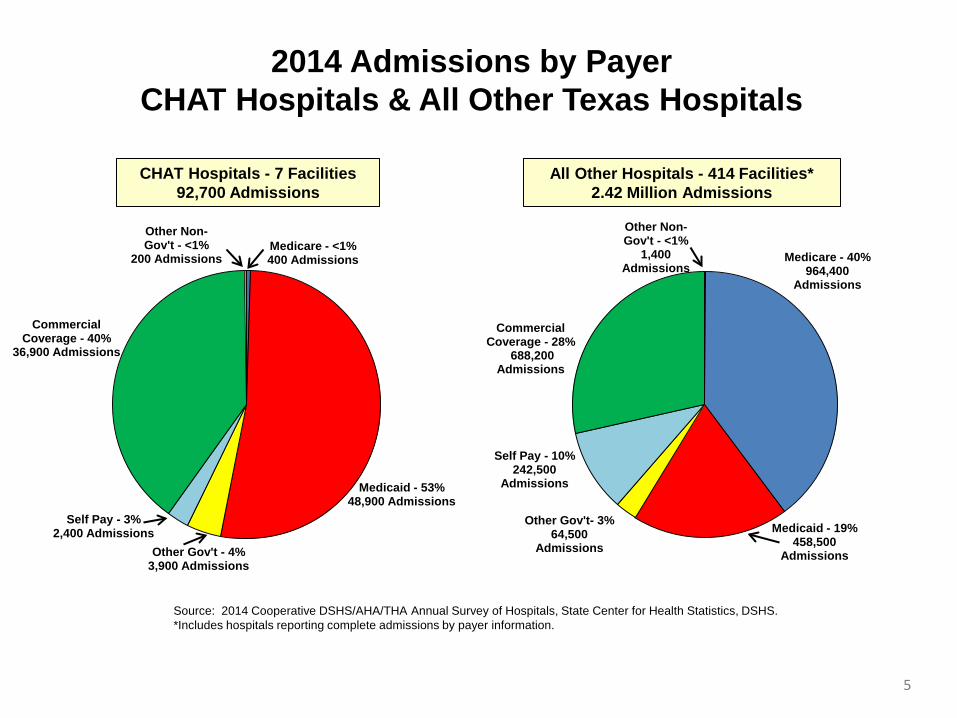
Medicare - <1% 400 Admissions
Medicaid - 53% 48,900 Admissions
Other Gov't - 4% 3,900 Admissions
Self Pay - 3% 2,400 Admissions
Commercial Coverage - 40%
36,900 Admissions
Other Non- Gov't - <1%
200 Admissions
CHAT Hospitals - 7 Facilities 92,700 Admissions
All Other Hospitals - 414 Facilities* 2.42 Million Admissions
Source: 2014 Cooperative DSHS/AHA/THA Annual Survey of Hospitals, State Center for Health Statistics, DSHS. *Includes hospitals reporting complete admissions by payer information.
Medicare - 40% 964,400
Admissions
Medicaid - 19% 458,500
Admissions
Other Gov't- 3% 64,500
Admissions
Self Pay - 10% 242,500
Admissions
Commercial Coverage - 28%
688,200 Admissions
Other Non-Gov't - <1%
1,400 Admissions
2014 Admissions by Payer CHAT Hospitals & All Other Texas Hospitals
5
Total TotalMedicaid Inpatient Percent
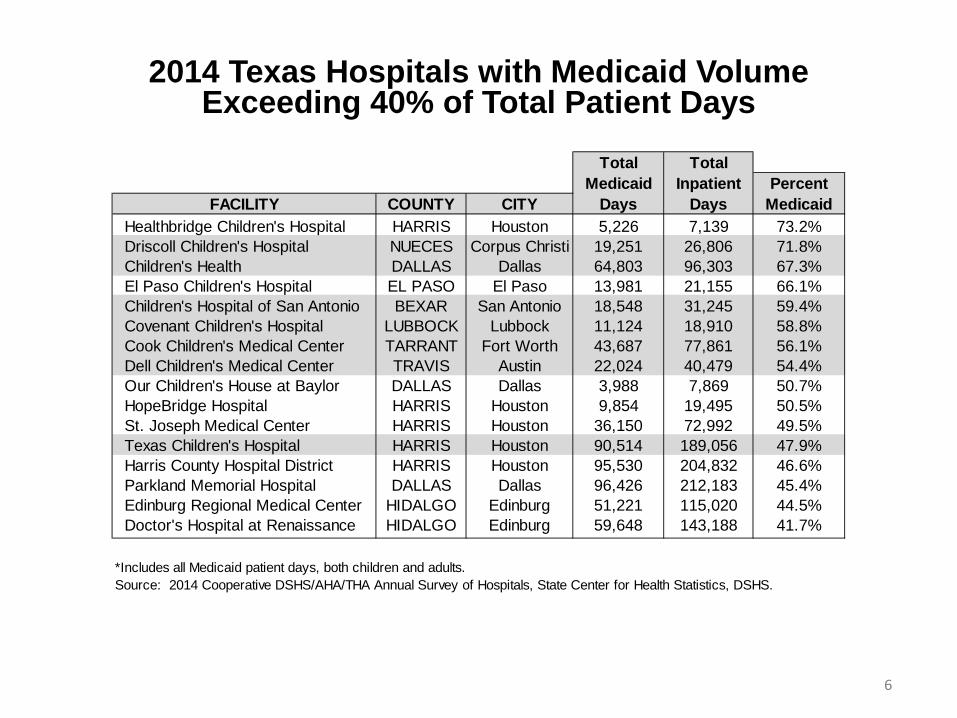
FACILITY COUNTY CITY Days Days MedicaidHealthbridge Children's Hospital HARRIS Houston 5,226 7,139 73.2%Driscoll Children's Hospital NUECES Corpus Christi 19,251 26,806 71.8%Children's Health DALLAS Dallas 64,803 96,303 67.3%El Paso Children's Hospital EL PASO El Paso 13,981 21,155 66.1%Children's Hospital of San Antonio BEXAR San Antonio 18,548 31,245 59.4%Covenant Children's Hospital LUBBOCK Lubbock 11,124 18,910 58.8%Cook Children's Medical Center TARRANT Fort Worth 43,687 77,861 56.1%Dell Children's Medical Center TRAVIS Austin 22,024 40,479 54.4%Our Children's House at Baylor DALLAS Dallas 3,988 7,869 50.7%HopeBridge Hospital HARRIS Houston 9,854 19,495 50.5%St. Joseph Medical Center HARRIS Houston 36,150 72,992 49.5%Texas Children's Hospital HARRIS Houston 90,514 189,056 47.9%Harris County Hospital District HARRIS Houston 95,530 204,832 46.6%Parkland Memorial Hospital DALLAS Dallas 96,426 212,183 45.4%Edinburg Regional Medical Center HIDALGO Edinburg 51,221 115,020 44.5%Doctor's Hospital at Renaissance HIDALGO Edinburg 59,648 143,188 41.7%
*Includes all Medicaid patient days, both children and adults.Source: 2014 Cooperative DSHS/AHA/THA Annual Survey of Hospitals, State Center for Health Statistics, DSHS.
2014 Texas Hospitals with Medicaid Volume Exceeding 40% of Total Patient Days
6
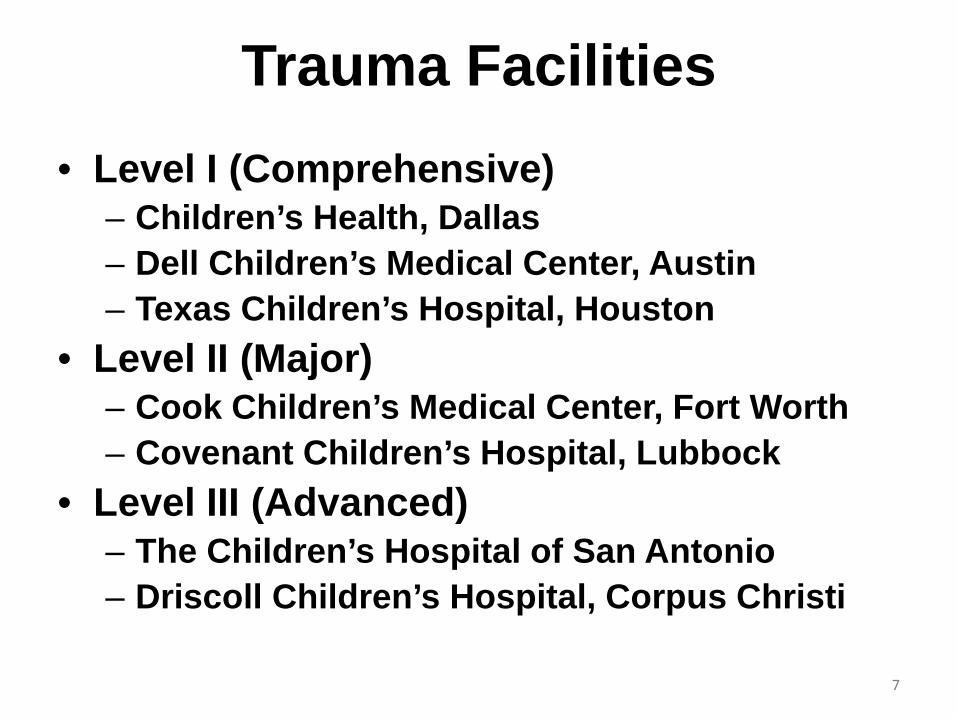
Trauma Facilities • Level I (Comprehensive)
– Children’s Health, Dallas – Dell Children’s Medical Center, Austin – Texas Children’s Hospital, Houston
• Level II (Major) – Cook Children’s Medical Center, Fort Worth – Covenant Children’s Hospital, Lubbock
• Level III (Advanced) – The Children’s Hospital of San Antonio – Driscoll Children’s Hospital, Corpus Christi
7
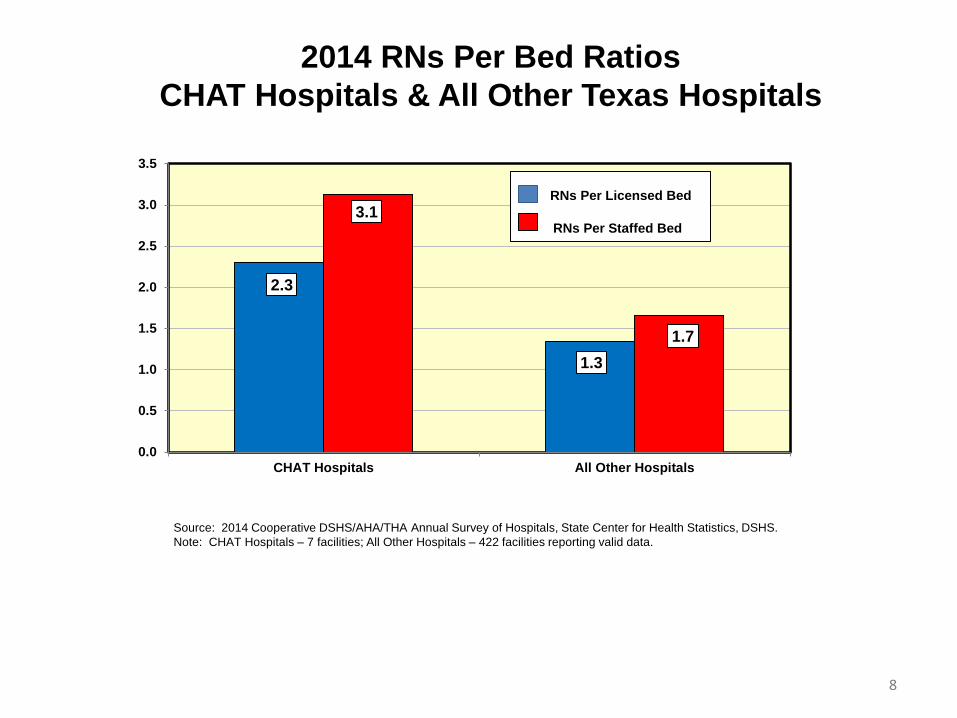
2.3
1.3
3.1
1.7
0.0
0.5
1.0
1.5
2.0
2.5
3.0
3.5
CHAT Hospitals All Other Hospitals
2014 RNs Per Bed Ratios CHAT Hospitals & All Other Texas Hospitals
RNs Per Licensed Bed RNs Per Staffed Bed
Source: 2014 Cooperative DSHS/AHA/THA Annual Survey of Hospitals, State Center for Health Statistics, DSHS. Note: CHAT Hospitals – 7 facilities; All Other Hospitals – 422 facilities reporting valid data.
8
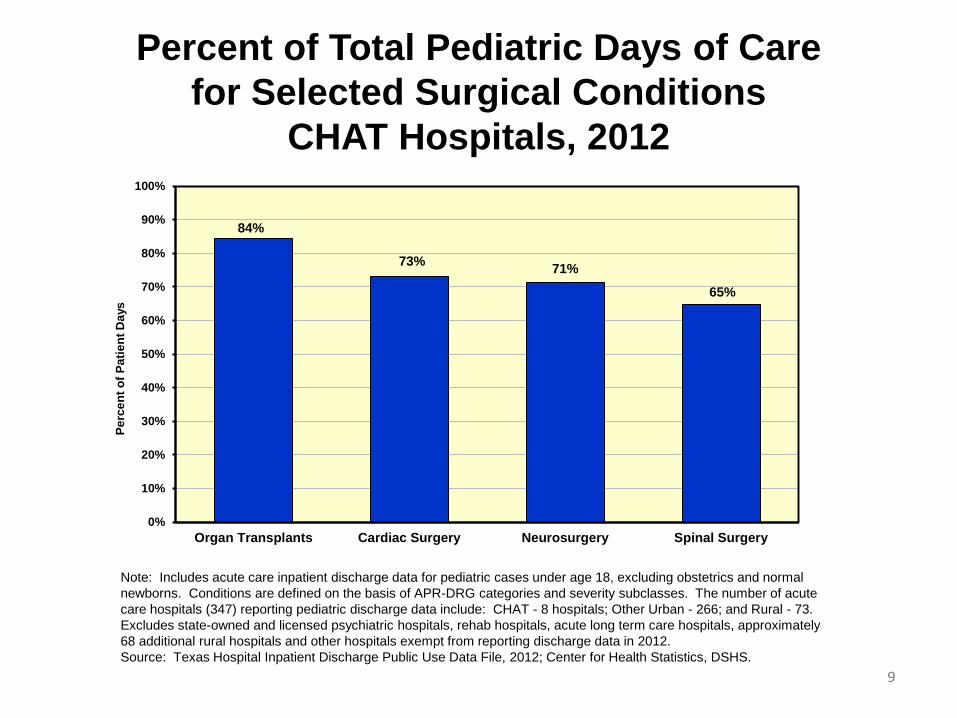
84%
73% 71%
65%
0%
10%
20%
30%
40%
50%
60%
70%
80%
90%
100%
Organ Transplants Cardiac Surgery Neurosurgery Spinal Surgery
Perc
ent o
f Pat
ient
Day
s
9
Percent of Total Pediatric Days of Care for Selected Surgical Conditions
CHAT Hospitals, 2012
Note: Includes acute care inpatient discharge data for pediatric cases under age 18, excluding obstetrics and normal newborns. Conditions are defined on the basis of APR-DRG categories and severity subclasses. The number of acute care hospitals (347) reporting pediatric discharge data include: CHAT - 8 hospitals; Other Urban - 266; and Rural - 73. Excludes state-owned and licensed psychiatric hospitals, rehab hospitals, acute long term care hospitals, approximately 68 additional rural hospitals and other hospitals exempt from reporting discharge data in 2012. Source: Texas Hospital Inpatient Discharge Public Use Data File, 2012; Center for Health Statistics, DSHS.
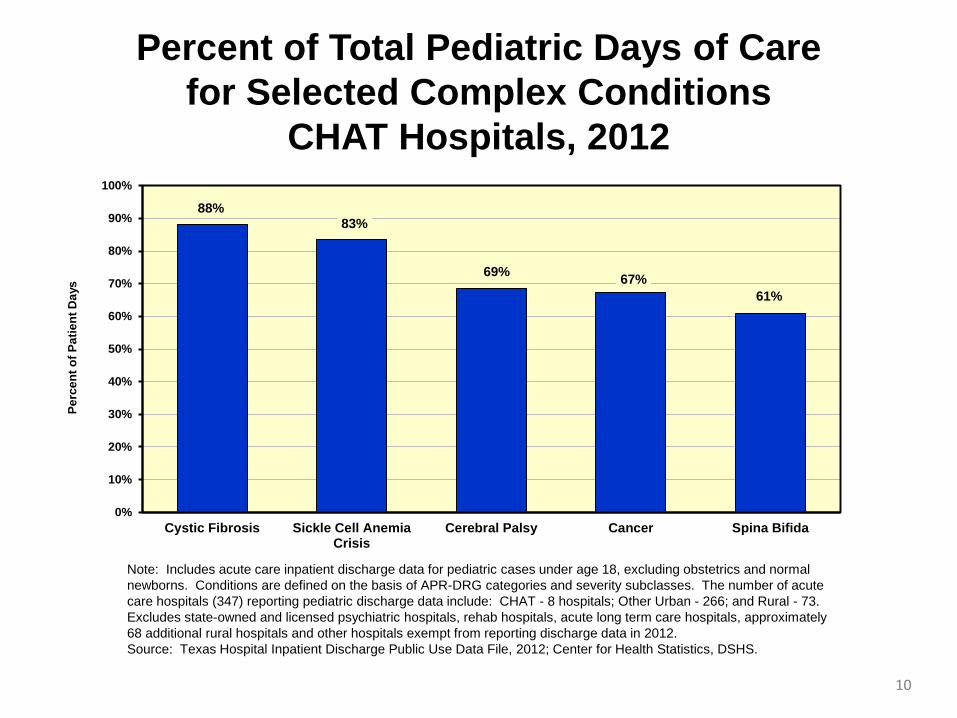
88% 83%
69% 67% 61%
0%
10%
20%
30%
40%
50%
60%
70%
80%
90%
100%
Cystic Fibrosis Sickle Cell AnemiaCrisis
Cerebral Palsy Cancer Spina Bifida
Perc
ent o
f Pat
ient
Day
s Percent of Total Pediatric Days of Care
for Selected Complex Conditions CHAT Hospitals, 2012
Note: Includes acute care inpatient discharge data for pediatric cases under age 18, excluding obstetrics and normal newborns. Conditions are defined on the basis of APR-DRG categories and severity subclasses. The number of acute care hospitals (347) reporting pediatric discharge data include: CHAT - 8 hospitals; Other Urban - 266; and Rural - 73. Excludes state-owned and licensed psychiatric hospitals, rehab hospitals, acute long term care hospitals, approximately 68 additional rural hospitals and other hospitals exempt from reporting discharge data in 2012. Source: Texas Hospital Inpatient Discharge Public Use Data File, 2012; Center for Health Statistics, DSHS.
10
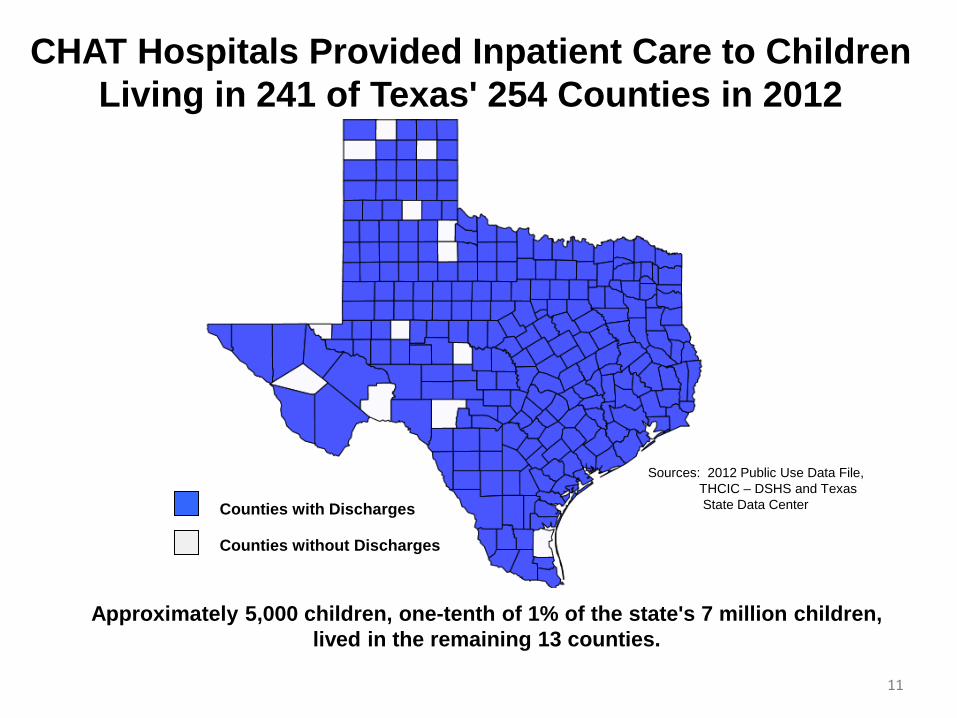
CHAT Hospitals Provided Inpatient Care to Children Living in 241 of Texas' 254 Counties in 2012
Counties with Discharges
Counties without Discharges
Sources: 2012 Public Use Data File, THCIC – DSHS and Texas State Data Center
Approximately 5,000 children, one-tenth of 1% of the state's 7 million children, lived in the remaining 13 counties.
11
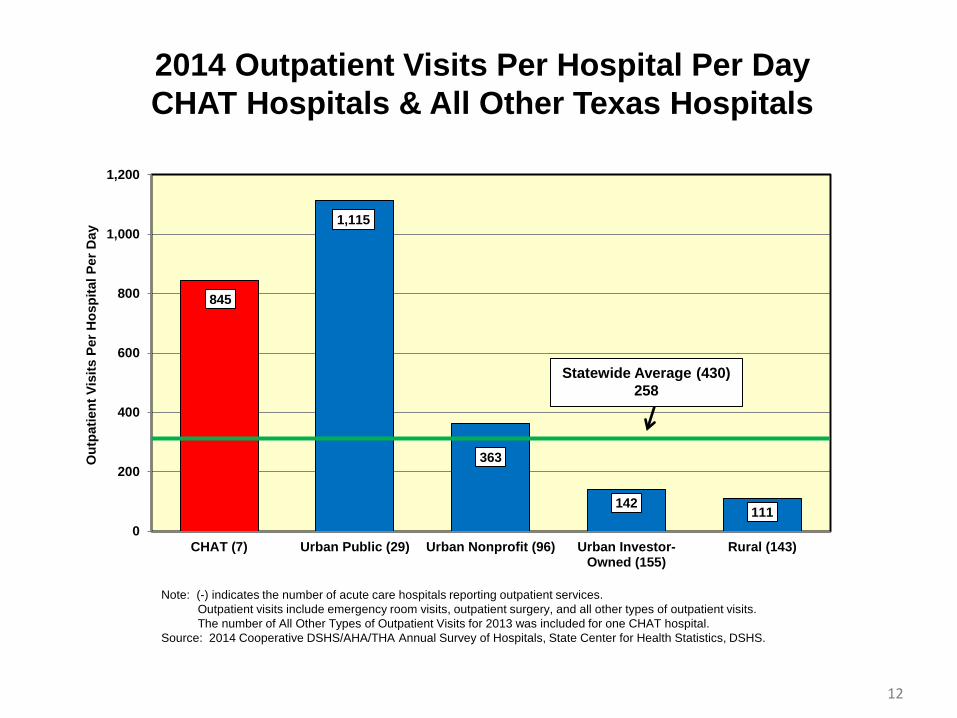
845
1,115
363
142 111 0
200
400
600
800
1,000
1,200
CHAT (7) Urban Public (29) Urban Nonprofit (96) Urban Investor-Owned (155)
Rural (143)
Out
patie
nt V
isits
Per
Hos
pita
l Per
Day
2014 Outpatient Visits Per Hospital Per Day CHAT Hospitals & All Other Texas Hospitals
Statewide Average (430) 258
Note: (-) indicates the number of acute care hospitals reporting outpatient services. Outpatient visits include emergency room visits, outpatient surgery, and all other types of outpatient visits. The number of All Other Types of Outpatient Visits for 2013 was included for one CHAT hospital. Source: 2014 Cooperative DSHS/AHA/THA Annual Survey of Hospitals, State Center for Health Statistics, DSHS.
12
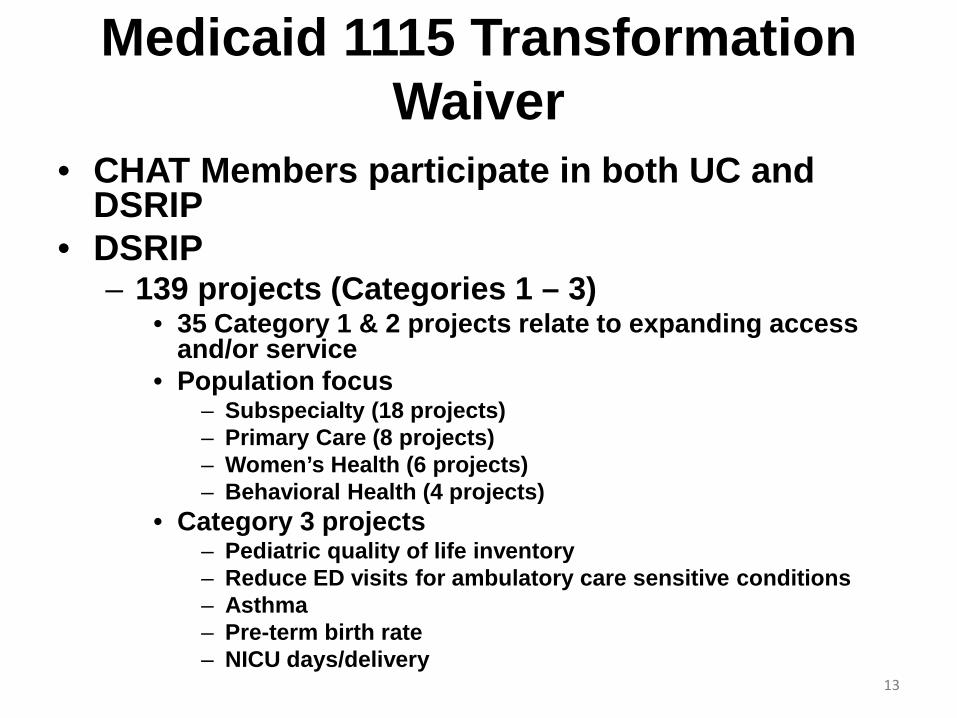
Medicaid 1115 Transformation Waiver
• CHAT Members participate in both UC and DSRIP
• DSRIP – 139 projects (Categories 1 – 3)
• 35 Category 1 & 2 projects relate to expanding access and/or service
• Population focus – Subspecialty (18 projects) – Primary Care (8 projects) – Women’s Health (6 projects) – Behavioral Health (4 projects)
• Category 3 projects – Pediatric quality of life inventory – Reduce ED visits for ambulatory care sensitive conditions – Asthma – Pre-term birth rate – NICU days/delivery
13
Moving to Value-Based Care Patient Safety & Quality Collaboratives
• Solutions for Patient Safety – Reducing patient harm in children’s
hospitals • Three quality collaboratives
– Asthma – Sepsis – Bronchiolitis – Improving quality of care, patient
experience, and lowering cost of care
14
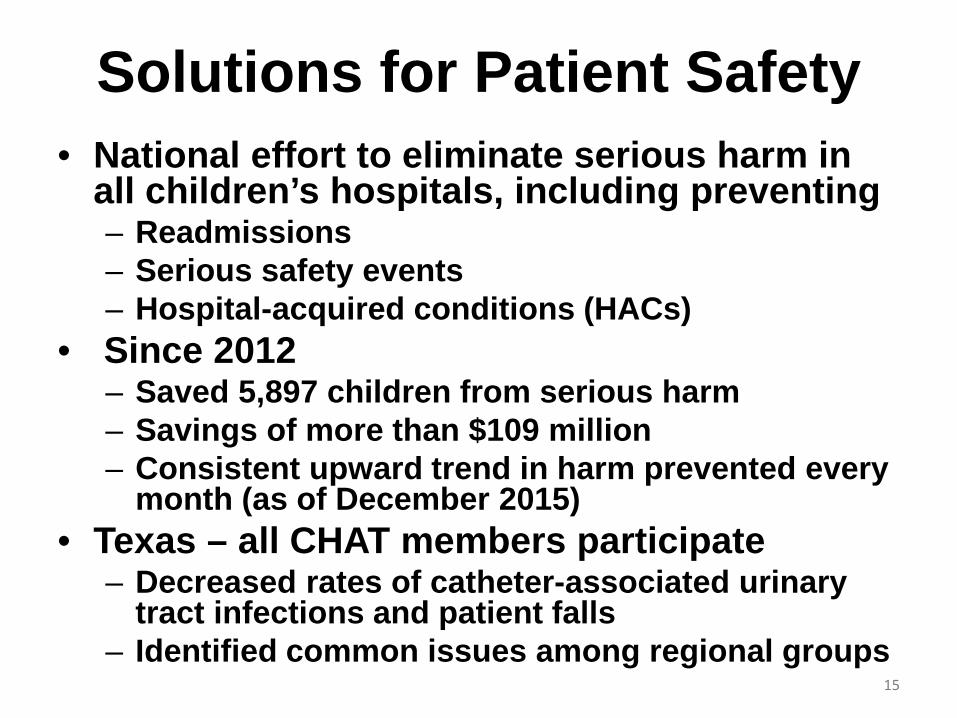
Solutions for Patient Safety • National effort to eliminate serious harm in
all children’s hospitals, including preventing – Readmissions – Serious safety events – Hospital-acquired conditions (HACs)
• Since 2012 – Saved 5,897 children from serious harm – Savings of more than $109 million – Consistent upward trend in harm prevented every
month (as of December 2015) • Texas – all CHAT members participate
– Decreased rates of catheter-associated urinary tract infections and patient falls
– Identified common issues among regional groups 15
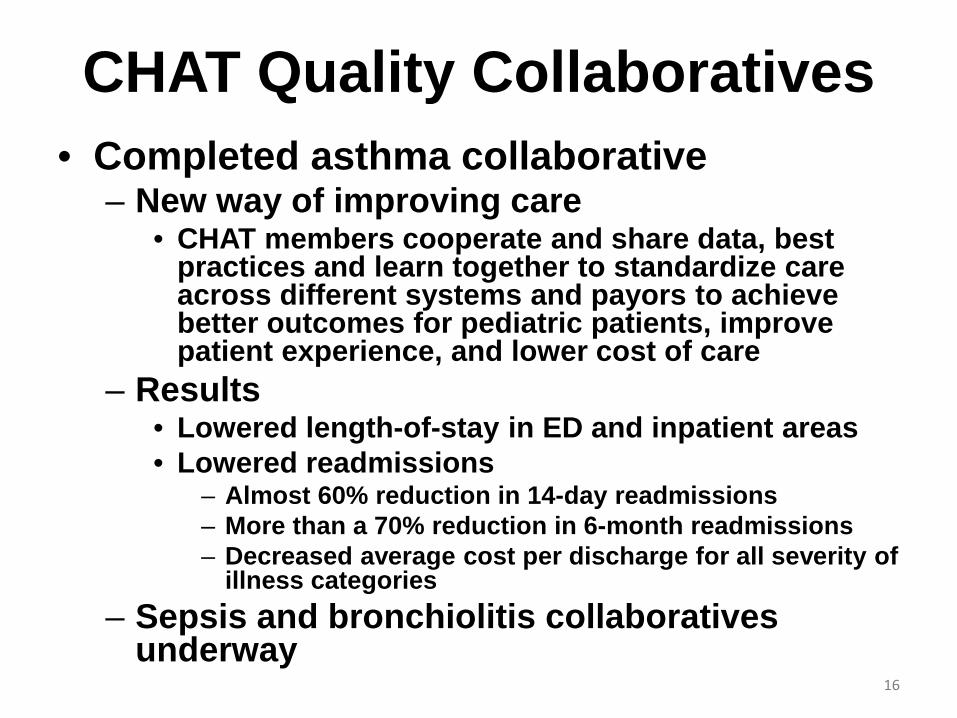
CHAT Quality Collaboratives • Completed asthma collaborative
– New way of improving care • CHAT members cooperate and share data, best
practices and learn together to standardize care across different systems and payors to achieve better outcomes for pediatric patients, improve patient experience, and lower cost of care
– Results • Lowered length-of-stay in ED and inpatient areas • Lowered readmissions
– Almost 60% reduction in 14-day readmissions – More than a 70% reduction in 6-month readmissions – Decreased average cost per discharge for all severity of
illness categories – Sepsis and bronchiolitis collaboratives
underway 16
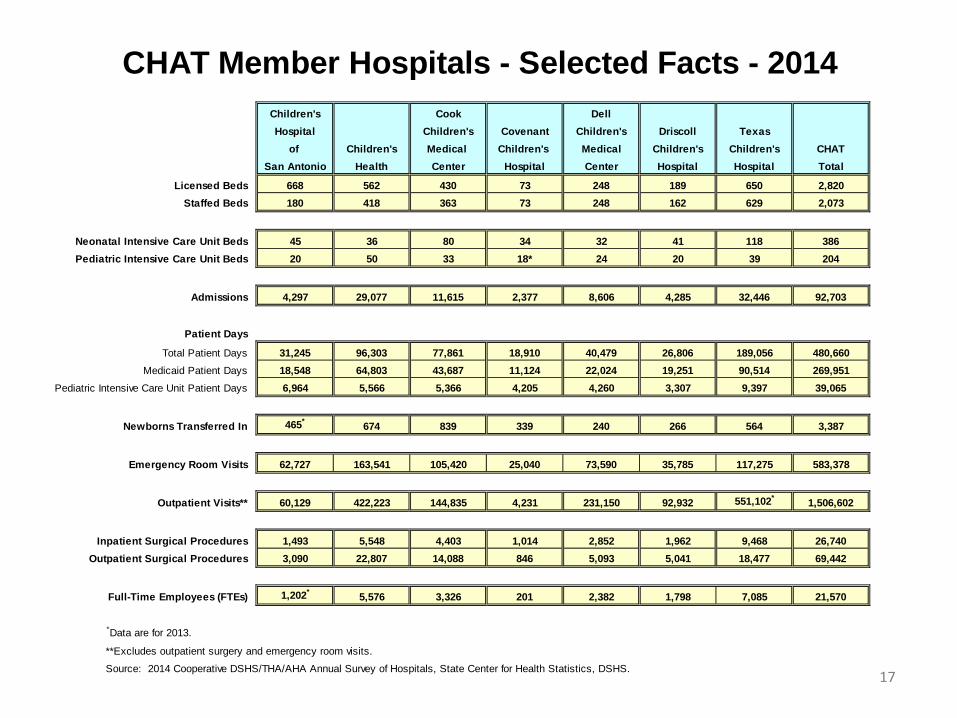
Children's Cook DellHospital Children's Covenant Children's Driscoll Texas
of Children's Medical Children's Medical Children's Children's CHATSan Antonio Health Center Hospital Center Hospital Hospital Total
Licensed Beds 668 562 430 73 248 189 650 2,820Staffed Beds 180 418 363 73 248 162 629 2,073
Neonatal Intensive Care Unit Beds 45 36 80 34 32 41 118 386Pediatric Intensive Care Unit Beds 20 50 33 18* 24 20 39 204
Admissions 4,297 29,077 11,615 2,377 8,606 4,285 32,446 92,703
Patient Days
Total Patient Days 31,245 96,303 77,861 18,910 40,479 26,806 189,056 480,660 Medicaid Patient Days 18,548 64,803 43,687 11,124 22,024 19,251 90,514 269,951
Pediatric Intensive Care Unit Patient Days 6,964 5,566 5,366 4,205 4,260 3,307 9,397 39,065
Newborns Transferred In 465* 674 839 339 240 266 564 3,387
Emergency Room Visits 62,727 163,541 105,420 25,040 73,590 35,785 117,275 583,378
Outpatient Visits** 60,129 422,223 144,835 4,231 231,150 92,932 551,102* 1,506,602
Inpatient Surgical Procedures 1,493 5,548 4,403 1,014 2,852 1,962 9,468 26,740 Outpatient Surgical Procedures 3,090 22,807 14,088 846 5,093 5,041 18,477 69,442
Full-Time Employees (FTEs) 1,202* 5,576 3,326 201 2,382 1,798 7,085 21,570
*Data are for 2013.
**Excludes outpatient surgery and emergency room visits.
Source: 2014 Cooperative DSHS/THA/AHA Annual Survey of Hospitals, State Center for Health Statistics, DSHS.
CHAT Member Hospitals - Selected Facts - 2014
17
Children’s Hospital Association of Texas
Stacy E. Wilson, J.D. President 823 Congress Ave., Suite 1500 Austin, TX 78701 (512) 320-0910 [email protected]
1 | P a g e
TEXAS RURAL HOSPITAL MEDICAID PAYMENTS
Presented to the Texas House
Appropriations Subcommittee on Article II
By Don McBeath
Director of Government Relations Texas Organization of Rural & Community Hospitals
(TORCH)
July 13, 2016
2 | P a g e
TEXAS RURAL HOSPITAL MEDICAID PAYMENTS
PAGE 3 WHAT IS A RURAL HOSPITAL?
PAGE 4 MAP OF TEXAS RURAL HOSPITALS PAGE 5 RURAL HOSPITAL CRISIS
PAGE 6 CRITICAL OPERATING DYNAMICS FOR TEXAS RURAL HOSPITALS
PAGE 7 FEDERAL HISTORY ON RURAL HOSPITAL REIMBURSEMENT
TEXAS HISTORY ON RURAL HOSPITAL REIMBURSEMENT
PAGE 8 POLICY CONSIDERATIONS WITH THE RURAL HOSPITAL BUDGET RIDER 84TH SESSION CHANGES TO RURAL HOSPITAL RIDER
PAGE 9 WHAT DOES THE CURRENT RIDER STATE?
PAGE 10 HOW DID HHSC IMPLEMENT THE NEW OUTPATIENT RIDER AND
CONTINUE THE INPATIENT POLICY
PAGE 11 KEY FACTS ABOUT RURAL HOSPITAL MEDICAID PAYMENTS
PAGE 12 HOW DO RURAL HOSPITALS FIT INTO THE TEXAS MEDICAID SYSTEM?
PAGE 13 RECOMMENDATIONS FOR THE 85TH SESSION ON RURAL HOSPITAL PAYMENTS
PAGE 14 (ATTACHMENT) RURAL HOSPITAL FACTSHEET
PAGE 15-17 (ATTACHMENT) HISTORY OF RURAL HOSPITAL RIDER LANGUAGE
3 | P a g e
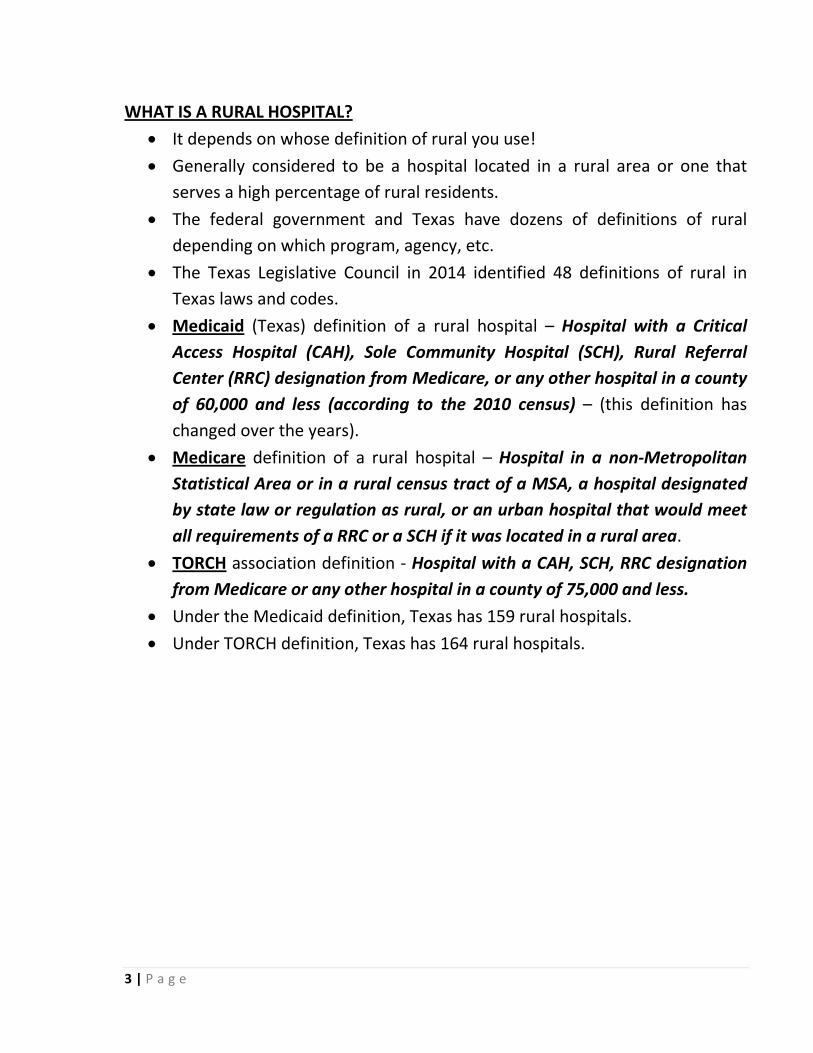
WHAT IS A RURAL HOSPITAL?
• It depends on whose definition of rural you use! • Generally considered to be a hospital located in a rural area or one that
serves a high percentage of rural residents. • The federal government and Texas have dozens of definitions of rural
depending on which program, agency, etc. • The Texas Legislative Council in 2014 identified 48 definitions of rural in
Texas laws and codes. • Medicaid (Texas) definition of a rural hospital – Hospital with a Critical
Access Hospital (CAH), Sole Community Hospital (SCH), Rural Referral Center (RRC) designation from Medicare, or any other hospital in a county of 60,000 and less (according to the 2010 census) – (this definition has changed over the years).
• Medicare definition of a rural hospital – Hospital in a non-Metropolitan Statistical Area or in a rural census tract of a MSA, a hospital designated by state law or regulation as rural, or an urban hospital that would meet all requirements of a RRC or a SCH if it was located in a rural area.
• TORCH association definition - Hospital with a CAH, SCH, RRC designation from Medicare or any other hospital in a county of 75,000 and less.
• Under the Medicaid definition, Texas has 159 rural hospitals. • Under TORCH definition, Texas has 164 rural hospitals.
4 | P a g e
5 | P a g e
RURAL HOSPITAL CRISIS
• 15 Texas rural hospitals have closed* since the beginning of 2013 (last 3 ½ years).
• Several more are in financial distress, bankruptcy, and on the brink of closure.
• 7 Texas rural hospitals closed in the decade 2003-2012. • 14 Texas rural hospitals closed in the decade 1993-2002. • Deaths have been directly and indirectly attributed to hospital closures in
Texas over the past few years because of added time and distance to get to trauma care in communities where a hospital closed.
• Upswing in Texas closures starting in early 2013 primarily attributed to Medicare and Medicaid payment cuts to rural hospitals totaling almost $100 million a year starting in 2011-12.
• Texas cuts in Medicaid outpatient starting in FY2012 totaled an estimated $32-35 million a year for rural hospitals (as estimated by those hospitals).
• Rural hospital Medicaid cuts were substantially restored in the FY16-17 state budget with $58 million for the biennium (all funds) for higher Medicaid outpatient rates ($25 million general revenue for the biennium).
• The higher Medicaid outpatient payments are having a positive impact on the safety-net rural hospitals appearing to slow the closure rate in Texas with only one closure thus far in 2016.
• Texas rural hospitals continue to be shorted about $65+ million a year because of Medicare cuts that Congress has not yet addressed, and $4-6 million a year still short in Medicaid (lab, x-ray, ER, rates lagging behind cost).
(*Ceasing inpatient services is considered a hospital closure. Of the 15 closures in the last 3 ½ years, 2 have reopened for now, 5 continue to operate only an ER, and one new rural hospital was constructed).
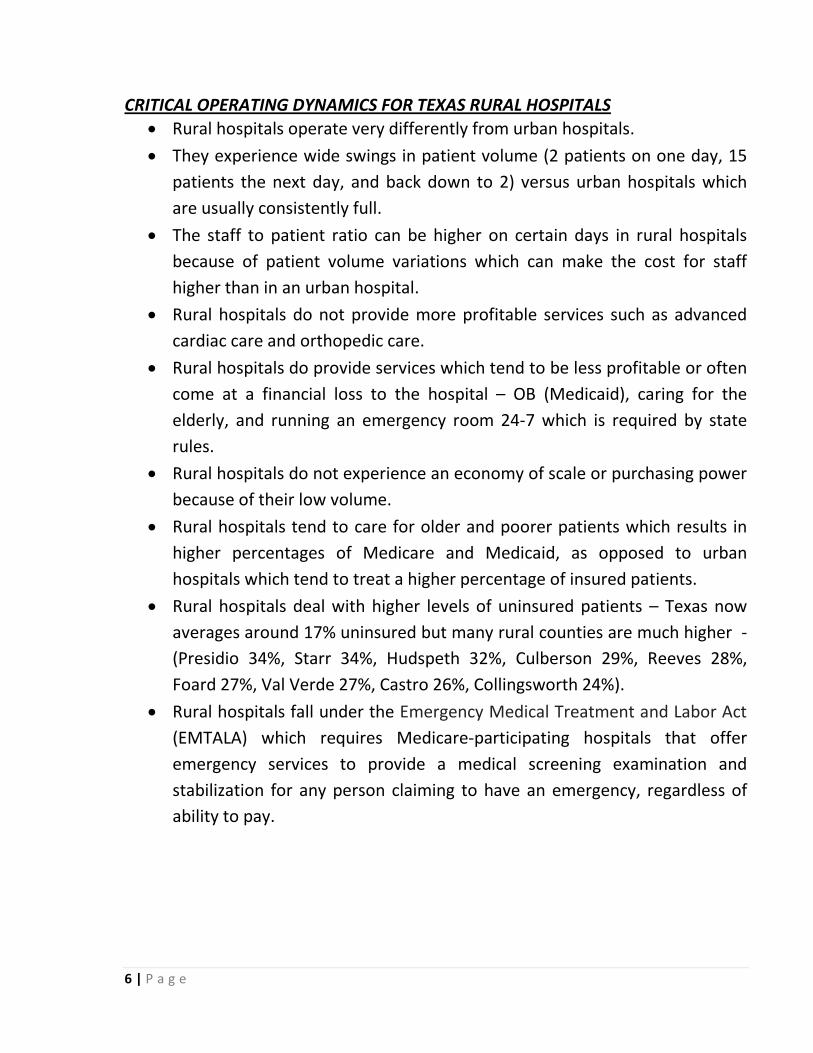
6 | P a g e
CRITICAL OPERATING DYNAMICS FOR TEXAS RURAL HOSPITALS
• Rural hospitals operate very differently from urban hospitals. • They experience wide swings in patient volume (2 patients on one day, 15
patients the next day, and back down to 2) versus urban hospitals which are usually consistently full.
• The staff to patient ratio can be higher on certain days in rural hospitals because of patient volume variations which can make the cost for staff higher than in an urban hospital.
• Rural hospitals do not provide more profitable services such as advanced cardiac care and orthopedic care.
• Rural hospitals do provide services which tend to be less profitable or often come at a financial loss to the hospital – OB (Medicaid), caring for the elderly, and running an emergency room 24-7 which is required by state rules.
• Rural hospitals do not experience an economy of scale or purchasing power because of their low volume.
• Rural hospitals tend to care for older and poorer patients which results in higher percentages of Medicare and Medicaid, as opposed to urban hospitals which tend to treat a higher percentage of insured patients.
• Rural hospitals deal with higher levels of uninsured patients – Texas now averages around 17% uninsured but many rural counties are much higher - (Presidio 34%, Starr 34%, Hudspeth 32%, Culberson 29%, Reeves 28%, Foard 27%, Val Verde 27%, Castro 26%, Collingsworth 24%).
• Rural hospitals fall under the Emergency Medical Treatment and Labor Act (EMTALA) which requires Medicare-participating hospitals that offer emergency services to provide a medical screening examination and stabilization for any person claiming to have an emergency, regardless of ability to pay.
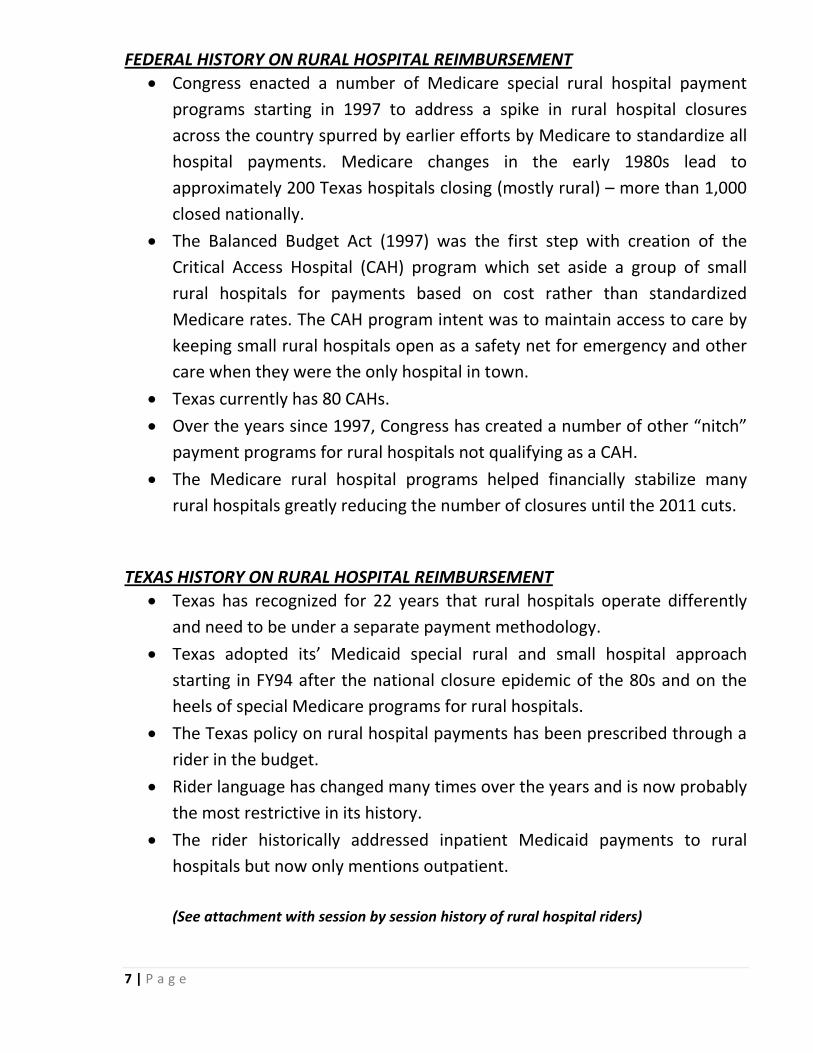
7 | P a g e
FEDERAL HISTORY ON RURAL HOSPITAL REIMBURSEMENT • Congress enacted a number of Medicare special rural hospital payment
programs starting in 1997 to address a spike in rural hospital closures across the country spurred by earlier efforts by Medicare to standardize all hospital payments. Medicare changes in the early 1980s lead to approximately 200 Texas hospitals closing (mostly rural) – more than 1,000 closed nationally.
• The Balanced Budget Act (1997) was the first step with creation of the Critical Access Hospital (CAH) program which set aside a group of small rural hospitals for payments based on cost rather than standardized Medicare rates. The CAH program intent was to maintain access to care by keeping small rural hospitals open as a safety net for emergency and other care when they were the only hospital in town.
• Texas currently has 80 CAHs. • Over the years since 1997, Congress has created a number of other “nitch”
payment programs for rural hospitals not qualifying as a CAH. • The Medicare rural hospital programs helped financially stabilize many
rural hospitals greatly reducing the number of closures until the 2011 cuts. TEXAS HISTORY ON RURAL HOSPITAL REIMBURSEMENT
• Texas has recognized for 22 years that rural hospitals operate differently and need to be under a separate payment methodology.
• Texas adopted its’ Medicaid special rural and small hospital approach starting in FY94 after the national closure epidemic of the 80s and on the heels of special Medicare programs for rural hospitals.
• The Texas policy on rural hospital payments has been prescribed through a rider in the budget.
• Rider language has changed many times over the years and is now probably the most restrictive in its history.
• The rider historically addressed inpatient Medicaid payments to rural hospitals but now only mentions outpatient. (See attachment with session by session history of rural hospital riders)
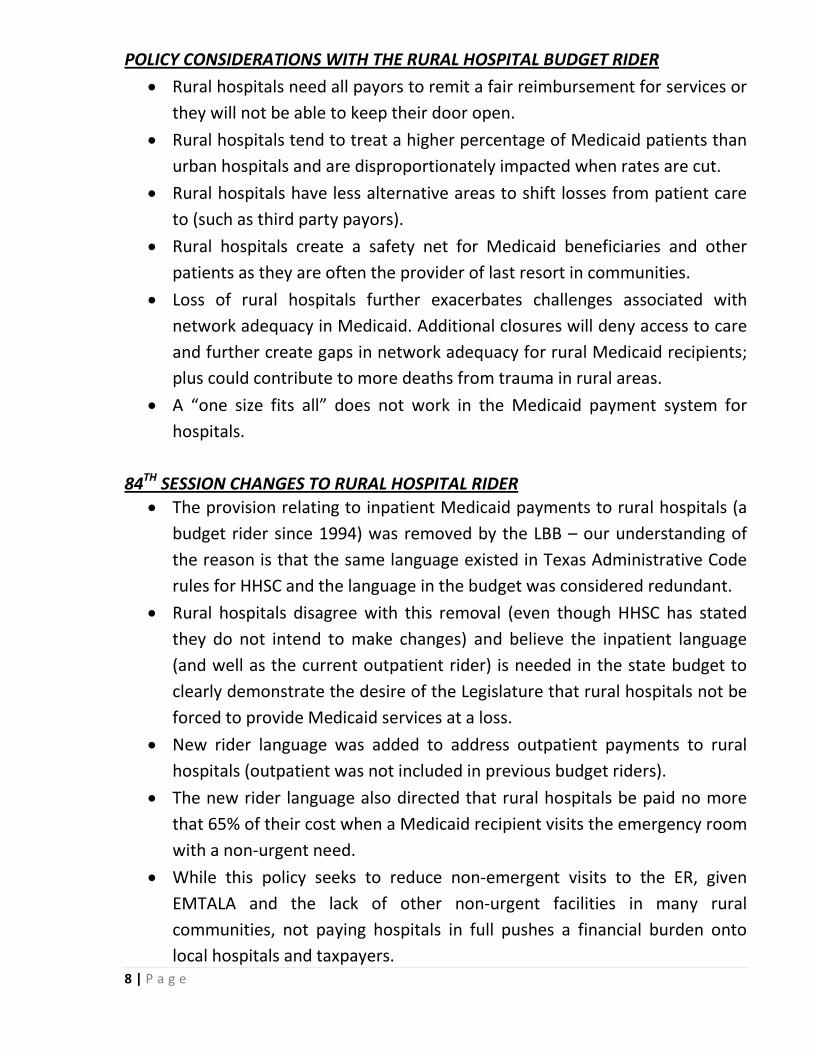
8 | P a g e
POLICY CONSIDERATIONS WITH THE RURAL HOSPITAL BUDGET RIDER
• Rural hospitals need all payors to remit a fair reimbursement for services or they will not be able to keep their door open.
• Rural hospitals tend to treat a higher percentage of Medicaid patients than urban hospitals and are disproportionately impacted when rates are cut.
• Rural hospitals have less alternative areas to shift losses from patient care to (such as third party payors).
• Rural hospitals create a safety net for Medicaid beneficiaries and other patients as they are often the provider of last resort in communities.
• Loss of rural hospitals further exacerbates challenges associated with network adequacy in Medicaid. Additional closures will deny access to care and further create gaps in network adequacy for rural Medicaid recipients; plus could contribute to more deaths from trauma in rural areas.
• A “one size fits all” does not work in the Medicaid payment system for hospitals.
84TH SESSION CHANGES TO RURAL HOSPITAL RIDER
• The provision relating to inpatient Medicaid payments to rural hospitals (a budget rider since 1994) was removed by the LBB – our understanding of the reason is that the same language existed in Texas Administrative Code rules for HHSC and the language in the budget was considered redundant.
• Rural hospitals disagree with this removal (even though HHSC has stated they do not intend to make changes) and believe the inpatient language (and well as the current outpatient rider) is needed in the state budget to clearly demonstrate the desire of the Legislature that rural hospitals not be forced to provide Medicaid services at a loss.
• New rider language was added to address outpatient payments to rural hospitals (outpatient was not included in previous budget riders).
• The new rider language also directed that rural hospitals be paid no more that 65% of their cost when a Medicaid recipient visits the emergency room with a non-urgent need.
• While this policy seeks to reduce non-emergent visits to the ER, given EMTALA and the lack of other non-urgent facilities in many rural communities, not paying hospitals in full pushes a financial burden onto local hospitals and taxpayers.
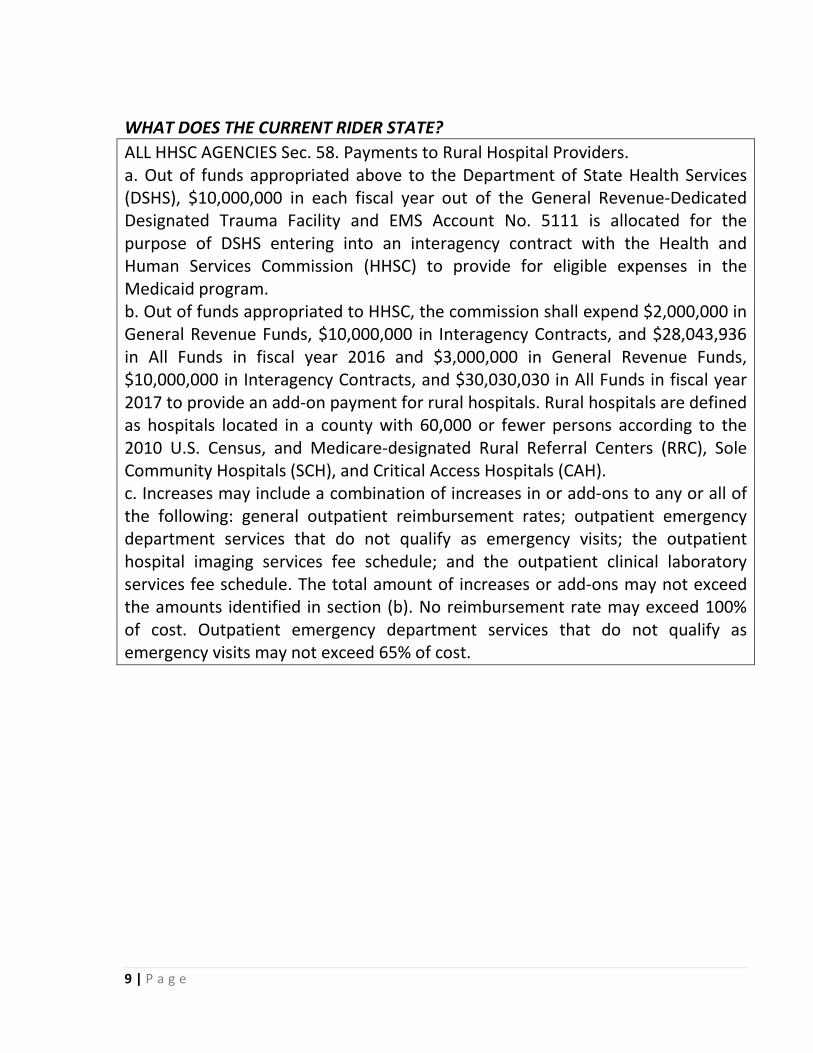
9 | P a g e
WHAT DOES THE CURRENT RIDER STATE? ALL HHSC AGENCIES Sec. 58. Payments to Rural Hospital Providers. a. Out of funds appropriated above to the Department of State Health Services (DSHS), $10,000,000 in each fiscal year out of the General Revenue-Dedicated Designated Trauma Facility and EMS Account No. 5111 is allocated for the purpose of DSHS entering into an interagency contract with the Health and Human Services Commission (HHSC) to provide for eligible expenses in the Medicaid program. b. Out of funds appropriated to HHSC, the commission shall expend $2,000,000 in General Revenue Funds, $10,000,000 in Interagency Contracts, and $28,043,936 in All Funds in fiscal year 2016 and $3,000,000 in General Revenue Funds, $10,000,000 in Interagency Contracts, and $30,030,030 in All Funds in fiscal year 2017 to provide an add-on payment for rural hospitals. Rural hospitals are defined as hospitals located in a county with 60,000 or fewer persons according to the 2010 U.S. Census, and Medicare-designated Rural Referral Centers (RRC), Sole Community Hospitals (SCH), and Critical Access Hospitals (CAH). c. Increases may include a combination of increases in or add-ons to any or all of the following: general outpatient reimbursement rates; outpatient emergency department services that do not qualify as emergency visits; the outpatient hospital imaging services fee schedule; and the outpatient clinical laboratory services fee schedule. The total amount of increases or add-ons may not exceed the amounts identified in section (b). No reimbursement rate may exceed 100% of cost. Outpatient emergency department services that do not qualify as emergency visits may not exceed 65% of cost.
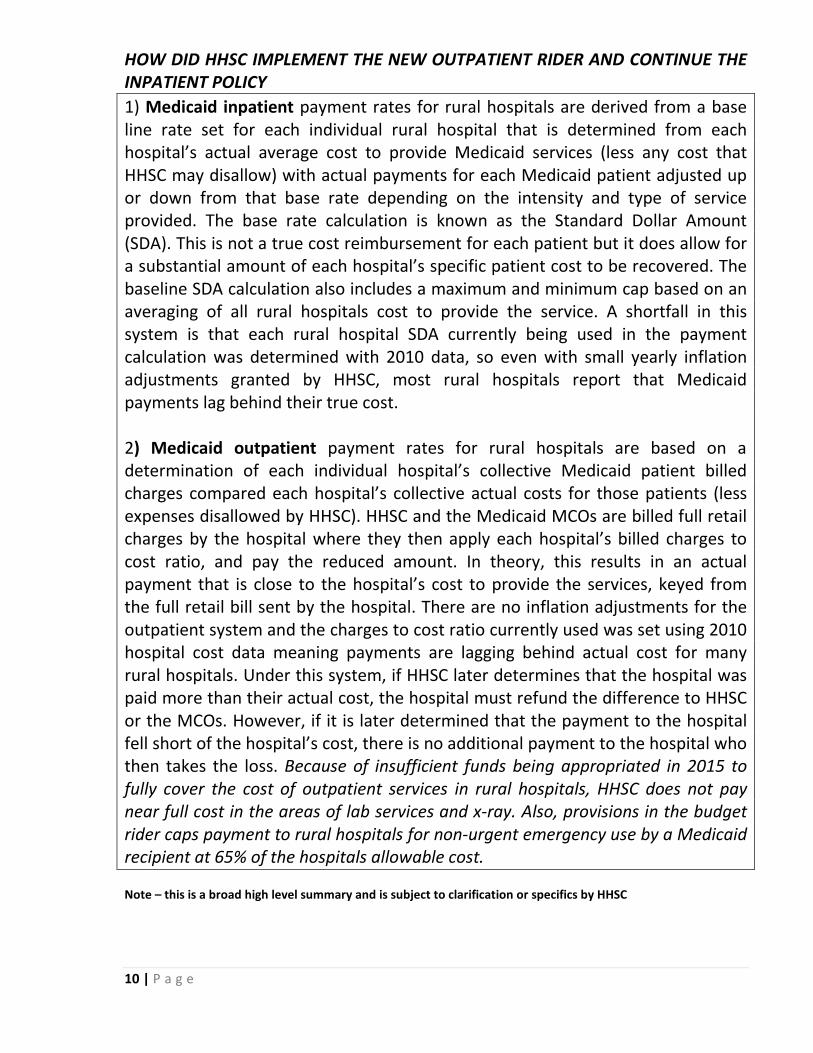
10 | P a g e
HOW DID HHSC IMPLEMENT THE NEW OUTPATIENT RIDER AND CONTINUE THE INPATIENT POLICY 1) Medicaid inpatient payment rates for rural hospitals are derived from a base line rate set for each individual rural hospital that is determined from each hospital’s actual average cost to provide Medicaid services (less any cost that HHSC may disallow) with actual payments for each Medicaid patient adjusted up or down from that base rate depending on the intensity and type of service provided. The base rate calculation is known as the Standard Dollar Amount (SDA). This is not a true cost reimbursement for each patient but it does allow for a substantial amount of each hospital’s specific patient cost to be recovered. The baseline SDA calculation also includes a maximum and minimum cap based on an averaging of all rural hospitals cost to provide the service. A shortfall in this system is that each rural hospital SDA currently being used in the payment calculation was determined with 2010 data, so even with small yearly inflation adjustments granted by HHSC, most rural hospitals report that Medicaid payments lag behind their true cost. 2) Medicaid outpatient payment rates for rural hospitals are based on a determination of each individual hospital’s collective Medicaid patient billed charges compared each hospital’s collective actual costs for those patients (less expenses disallowed by HHSC). HHSC and the Medicaid MCOs are billed full retail charges by the hospital where they then apply each hospital’s billed charges to cost ratio, and pay the reduced amount. In theory, this results in an actual payment that is close to the hospital’s cost to provide the services, keyed from the full retail bill sent by the hospital. There are no inflation adjustments for the outpatient system and the charges to cost ratio currently used was set using 2010 hospital cost data meaning payments are lagging behind actual cost for many rural hospitals. Under this system, if HHSC later determines that the hospital was paid more than their actual cost, the hospital must refund the difference to HHSC or the MCOs. However, if it is later determined that the payment to the hospital fell short of the hospital’s cost, there is no additional payment to the hospital who then takes the loss. Because of insufficient funds being appropriated in 2015 to fully cover the cost of outpatient services in rural hospitals, HHSC does not pay near full cost in the areas of lab services and x-ray. Also, provisions in the budget rider caps payment to rural hospitals for non-urgent emergency use by a Medicaid recipient at 65% of the hospitals allowable cost. Note – this is a broad high level summary and is subject to clarification or specifics by HHSC
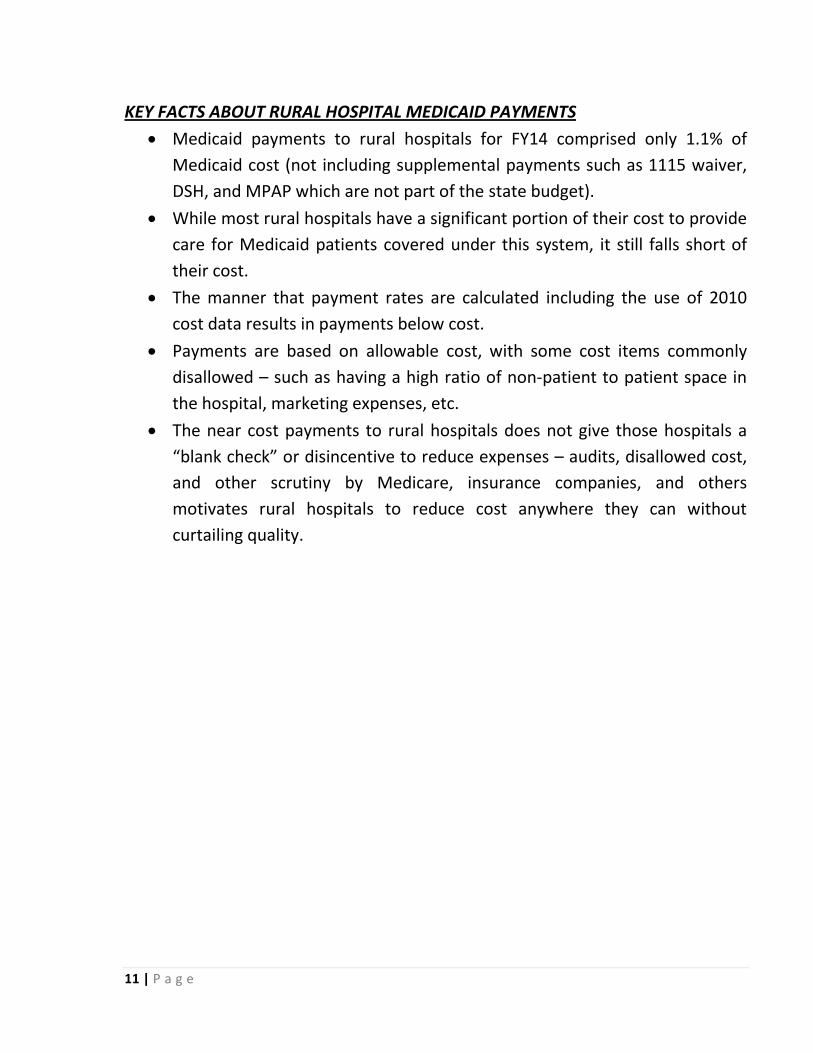
11 | P a g e
KEY FACTS ABOUT RURAL HOSPITAL MEDICAID PAYMENTS
• Medicaid payments to rural hospitals for FY14 comprised only 1.1% of Medicaid cost (not including supplemental payments such as 1115 waiver, DSH, and MPAP which are not part of the state budget).
• While most rural hospitals have a significant portion of their cost to provide care for Medicaid patients covered under this system, it still falls short of their cost.
• The manner that payment rates are calculated including the use of 2010 cost data results in payments below cost.
• Payments are based on allowable cost, with some cost items commonly disallowed – such as having a high ratio of non-patient to patient space in the hospital, marketing expenses, etc.
• The near cost payments to rural hospitals does not give those hospitals a “blank check” or disincentive to reduce expenses – audits, disallowed cost, and other scrutiny by Medicare, insurance companies, and others motivates rural hospitals to reduce cost anywhere they can without curtailing quality.
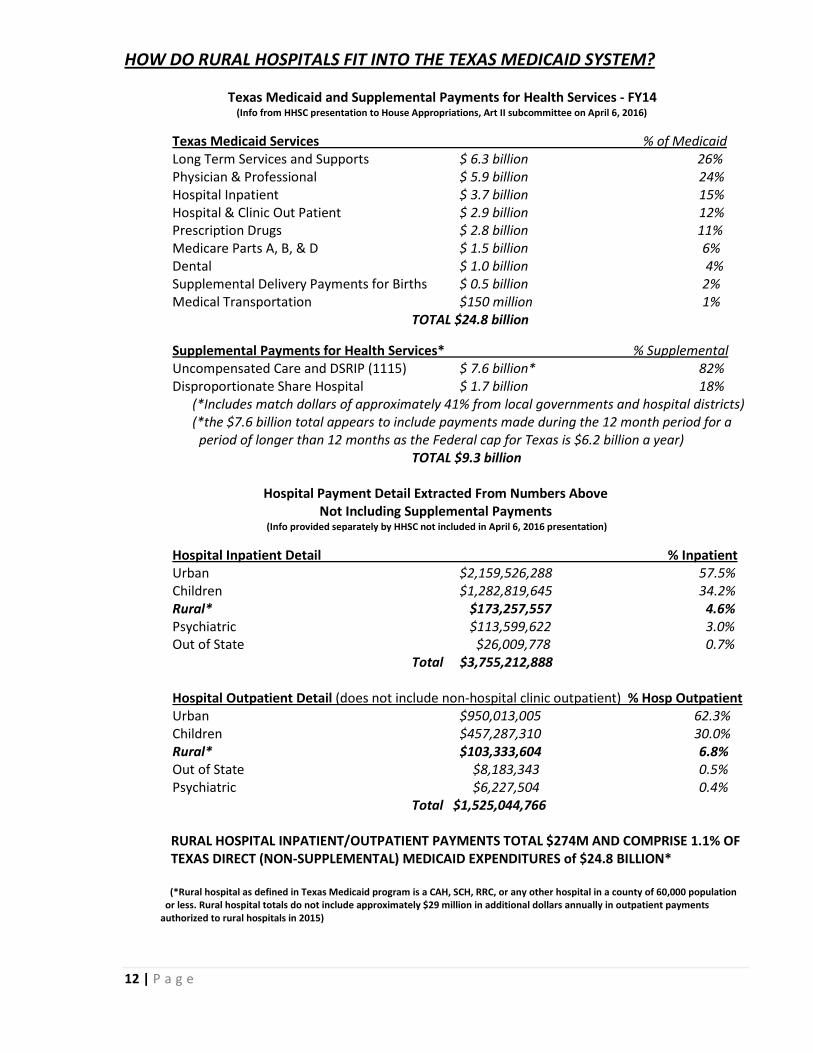
12 | P a g e
HOW DO RURAL HOSPITALS FIT INTO THE TEXAS MEDICAID SYSTEM?
Texas Medicaid and Supplemental Payments for Health Services - FY14 (Info from HHSC presentation to House Appropriations, Art II subcommittee on April 6, 2016)
Texas Medicaid Services % of Medicaid Long Term Services and Supports $ 6.3 billion 26% Physician & Professional $ 5.9 billion 24% Hospital Inpatient $ 3.7 billion 15% Hospital & Clinic Out Patient $ 2.9 billion 12% Prescription Drugs $ 2.8 billion 11% Medicare Parts A, B, & D $ 1.5 billion 6% Dental $ 1.0 billion 4% Supplemental Delivery Payments for Births $ 0.5 billion 2% Medical Transportation $150 million 1%
TOTAL $24.8 billion
Supplemental Payments for Health Services* % Supplemental Uncompensated Care and DSRIP (1115) $ 7.6 billion* 82% Disproportionate Share Hospital $ 1.7 billion 18% (*Includes match dollars of approximately 41% from local governments and hospital districts) (*the $7.6 billion total appears to include payments made during the 12 month period for a period of longer than 12 months as the Federal cap for Texas is $6.2 billion a year)
TOTAL $9.3 billion
Hospital Payment Detail Extracted From Numbers Above Not Including Supplemental Payments
(Info provided separately by HHSC not included in April 6, 2016 presentation)
Hospital Inpatient Detail % Inpatient Urban $2,159,526,288 57.5% Children $1,282,819,645 34.2% Rural* $173,257,557 4.6% Psychiatric $113,599,622 3.0% Out of State $26,009,778 0.7%
Total $3,755,212,888
Hospital Outpatient Detail (does not include non-hospital clinic outpatient) % Hosp Outpatient Urban $950,013,005 62.3% Children $457,287,310 30.0% Rural* $103,333,604 6.8% Out of State $8,183,343 0.5% Psychiatric $6,227,504 0.4%
Total $1,525,044,766 RURAL HOSPITAL INPATIENT/OUTPATIENT PAYMENTS TOTAL $274M AND COMPRISE 1.1% OF TEXAS DIRECT (NON-SUPPLEMENTAL) MEDICAID EXPENDITURES of $24.8 BILLION* (*Rural hospital as defined in Texas Medicaid program is a CAH, SCH, RRC, or any other hospital in a county of 60,000 population or less. Rural hospital totals do not include approximately $29 million in additional dollars annually in outpatient payments authorized to rural hospitals in 2015)
13 | P a g e
RECOMMENDATIONS FOR THE 85TH SESSION ON RURAL HOSPITAL PAYMENTS • Clearly establish in the rider(s) that Legislative intent is for rural hospitals to
not lose money treating Medicaid patients (have their reasonable cost fully covered).
• Restore the inpatient rural hospital rider to the budget and maintain the current outpatient rider to emphasize legislative intent that rural hospitals should not suffer a loss from Medicaid inpatient and outpatient.
• Fully appropriate for full allowable cost recovery in both inpatient and outpatient (including ER) – an estimated additional $4-6 million needed for the next biennium*.
• Direct HHSC to simplify and merge the current rural hospital inpatient and outpatient payment methodologies into a single payment system.
• Direct HHSC to adjust the base rates for rural hospitals using more current individual hospital cost data (rebase), understanding that an annual rebasing is labor intensive and costly, but an adjustment is due now and should be made every 3 to 4 years.
*This is an estimate. More specific numbers would have to be calculated by HHSC.
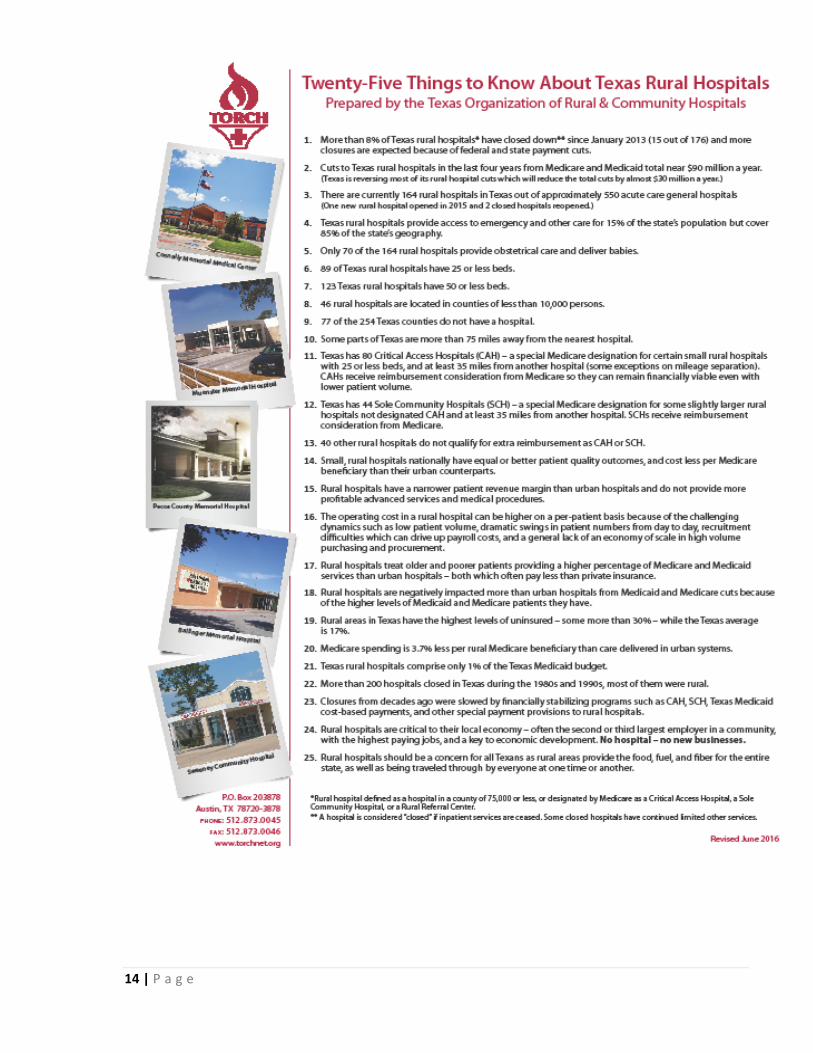
14 | P a g e
15 | P a g e
RURAL AND SMALL HOSPITAL PAYMENT RIDERS SINCE INCEPTION IN 1994
2016-17 ALL HHSC AGENCIES Sec. 58. Payments to Rural Hospital Providers. a. Out of funds appropriated above to the Department of State Health Services (DSHS), $10,000,000 in each fiscal year out of the General Revenue-Dedicated Designated Trauma Facility and EMS Account No. 5111 is allocated for the purpose of DSHS entering into an interagency contract with the Health and Human Services Commission (HHSC) to provide for eligible expenses in the Medicaid program. b. Out of funds appropriated to HHSC, the commission shall expend $2,000,000 in General Revenue Funds, $10,000,000 in Interagency Contracts, and $28,043,936 in All Funds in fiscal year 2016 and $3,000,000 in General Revenue Funds, $10,000,000 in Interagency Contracts, and $30,030,030 in All Funds in fiscal year 2017 to provide an add-on payment for rural hospitals. Rural hospitals are defined as hospitals located in a county with 60,000 or fewer persons according to the 2010 U.S. Census, and Medicare-designated Rural Referral Centers (RRC), Sole Community Hospitals (SCH), and Critical Access Hospitals (CAH). c. Increases may include a combination of increases in or add-ons to any or all of the following: general outpatient reimbursement rates; outpatient emergency department services that do not qualify as emergency visits; the outpatient hospital imaging services fee schedule; and the outpatient clinical laboratory services fee schedule. The total amount of increases or add-ons may not exceed the amounts identified in section (b). No reimbursement rate may exceed 100% of cost. Outpatient emergency department services that do not qualify as emergency visits may not exceed 65% of cost. (Note – previous rider language related to rural hospital inpatient payments was removed by LBB during 2016-17 budget development based on the language also existing in HHSC rules) 2014-15 HHSC 38. Payments to Rural Hospital Providers. It is the intent of the Legislature that out of funds appropriated above in Goal B, Medicaid, the Health and Human Services Commission (HHSC) shall rebase rural hospital rates as follows: a. These provisions shall apply to hospitals located in a county with 60,000 or fewer persons to the 2010 U.S. Census, and Medicare-designated Rural Referral Centers (RRC), Sole Community Hospitals (SCH), and Critical Access Hospitals (CAH). b. Inpatient: (1) Hospitals defined above shall be reimbursed based on a facility-specific prospective full cost standard dollar amount (SDA) based on their historical costs limited by a floor and a ceiling. The ceiling should be equal to approximately two standard deviations above the full-cost SDA for providers with more than 50 claims; the floor should be equal to approximately 1.5 standard deviations below that same average. (2) In calculating the facility specific prospective full cost SDA, the rates will be trended forward by the CMS Market Basket inflation factor to adjust for inflation. (3) It is the intent of the Legislature that for patients enrolled in managed care including but not limited to health maintenance organizations (HMO), inpatient services provided at hospitals meeting the above criteria shall be reimbursed based on the above considerations and rates, in order to maintain access to care. c. Outpatient: In order to ensure that access to emergency and outpatient services remain in rural parts of Texas, it is the intent of the Legislature that when HHSC changes its outpatient reimbursement methodology to an Enhanced Ambulatory Patient Groups or similar methodology, HHSC shall promulgate a separate or modified payment level for the above defined providers. d. The commission may consider a phase down schedule for a hospital which met the definition of "rural hospital" in the preceding biennium, but does not meet the definition provided in paragraph a. above.
16 | P a g e
2012-13 HHSC 40. Payments to Hospital Providers. Until the Health and Human Services Commission (HHSC) implements a new inpatient reimbursement system for Fee-for-Service (FFS) and Primary Care Case Management (PCCM) or managed care, including but not limited to health maintenance organizations (HMO) inpatient services, hospitals that meet one of the following criteria: 1) located in a county with 50,000 or fewer persons according to the U.S. Census, or 2) is a Medicare-designated Rural Referral Center (RRC) or Sole Community Hospital (SCH), that is not located in a metropolitan statistical area (MSA) as defined by the U.S. Office of Management and Budget, or 3) is a Medicare-designated Critical Access Hospital (CAH), shall be reimbursed based on the cost-reimbursement methodology authorized by the Tax Equity and Fiscal Responsibility Act of 1982 (TEFRA) using the most recent data. Hospitals that meet the above criteria, based on the 2000 decennial census, will be eligible for TEFRA reimbursement without the imposition of the TEFRA cap for patients enrolled in FFS and PCCM. For patients enrolled in managed care other than PCCM, including but not limited to health maintenance organizations (HMO), inpatient services provided at hospitals meeting the above criteria will be reimbursed at the Medicaid reimbursement calculated using each hospital's most recent FFS rebased full cost Standard Dollar Amount for the biennium. 2010-11 HHSC 43. Payments to Hospital Providers. Until the Health and Human Services Commission implements a new reimbursement system for Fee-for-Service (FFS) and Primary Care Case Management (PCCM) inpatient services, hospitals that meet one of the following criteria: 1) located in a county with 50,000 or fewer persons, or 2) is a Medicare-designated Rural Referral Center (RRC) or Sole Community Hospital (SCH), that are not located in a metropolitan statistical area (MSA) as defined by the U.S. Office of Management and Budget, or 3) is a Medicare-designated Critical Access Hospital (CAH), shall be reimbursed the greater of the prospective payment system rate or a cost-reimbursement methodology authorized by the Tax Equity and Fiscal Responsibility Act of 1982 (TEFRA) using the most recent data. Hospitals reimbursed under TEFRA cost principles shall be paid without the imposition of the TEFRA cap. Hospitals that meet the criteria as of September 1, 2009, retain this reimbursement for FFS and PCCM inpatient services. 2008-09 HHSC 52. Payments to Hospital Providers. Until the Health and Human Services Commission implements a new reimbursement system for Fee-for-Service (FFS) and Primary Care Case Management (PCCM) inpatient services, hospitals that meet one of the following criteria: 1) located in a county with 50,000 or fewer persons, or 2) is a Medicare-designated Rural Referral Center (RRC) or Sole Community Hospital (SCH), that are not located in a metropolitan statistical area (MSA) as defined by the U.S. Office of Management and Budget, or 3) is a Medicare-designated Critical Access Hospital (CAH), shall be reimbursed the greater of the prospective payment system rate or a cost-reimbursement methodology authorized by the Tax Equity and Fiscal Responsibility Act of 1982 (TEFRA) using the most recent data. Hospitals reimbursed under TEFRA cost principles shall be paid without the imposition of the TEFRA cap. Hospitals that meet the criteria as of September 1, 2007, retain this reimbursement for FFS and PCCM inpatient services. 2006-07 18. Payment of Hospital Providers. At the hospital's option, all payments from funds appropriated for acute care services made to hospitals (1) with more than 100 licensed beds, located in a county that is not a metropolitan statistical area (MSA) as defined by the U.S. Office of Management and Budget, and designated by Medicare as Sole Community Hospital (SCH) or Rural Referral Center (RRC), or (2) with 100 or fewer licensed beds may be reimbursed under a cost-reimbursement methodology authorized by the Tax Equity and Fiscal Responsibility Act of 1982 (TEFRA) using the most current available cost figures. Hospitals reimbursed
17 | P a g e
under TEFRA cost principles shall be paid without the imposition of the TEFRA cap. Hospitals that meet this criteria as of September 1, 2005, retain this reimbursement methodology in fee-for-service and managed care models. At initial cost settlement of the hospital's fiscal year, the Health and Human Services Commission shall determine the amount of reimbursement the hospital would have been paid under TEFRA cost principles, and if the amount of reimbursement under the TEFRA principles is greater than the amount of reimbursement received by the hospital under the prospective payment system, the Health and Human Services Commission shall reimburse the hospital the difference. These payments shall be made out of the funds appropriated above for acute care hospital services. 2004-05 24. Payment of Hospital Providers. At the hospital’s option, all payments from funds appropriated for acute care services made to hospitals (1) with more than 100 licensed beds, located in a county that is not a metropolitan statistical area (MSA) as defined by the U.S. Office of Management and Budget, and designated by Medicare as Sole Community Hospital (SCH) or Rural Referral Center (RRC), or (2) with 100 or fewer licensed beds may be reimbursed under a cost-reimbursement methodology authorized by the Tax Equity and Fiscal Responsibility Act of 1982 (TEFRA) using the most current available cost figures. Hospitals reimbursed under TEFRA cost principles shall be paid without the imposition of the TEFRA cap. At initial cost settlement of the hospital’s fiscal year, the Health and Human Services Commission shall determine the amount of reimbursement the hospital would have been paid under TEFRA cost principles, and if the amount of reimbursement under the TEFRA principles is greater than the amount of reimbursement received by the hospital under the prospective payment system, the Health and Human Services Commission shall reimburse the hospital the difference. These payments shall be made out of the funds appropriated above for acute care hospital services. 1994-2003 Payments to Hospital Providers. At the hospital’s option, all payments from funds appropriated for Acute Care Services made to hospital with 100 or fewer licensed beds may be reimbursed under a cost- reimbursement methodology authorized by the Tax Equity and Fiscal Responsibility Act of 1982 (TEFRA), using the most current available cost figures. Hospital reimbursed under TEFRA cost principles shall be paid without the imposition of the TEFRA cap. At the initial cost settlement of the hospital’s fiscal year, the Department of Health shall determine the amount of reimbursement the hospital would have been paid under TEFRA cost principles, and if the amount of reimbursement under TEFRA cost principles is greater than the amount of reimbursement received by the hospital under the Prospective System, the Department of Health shall reimburse the hospital the difference.
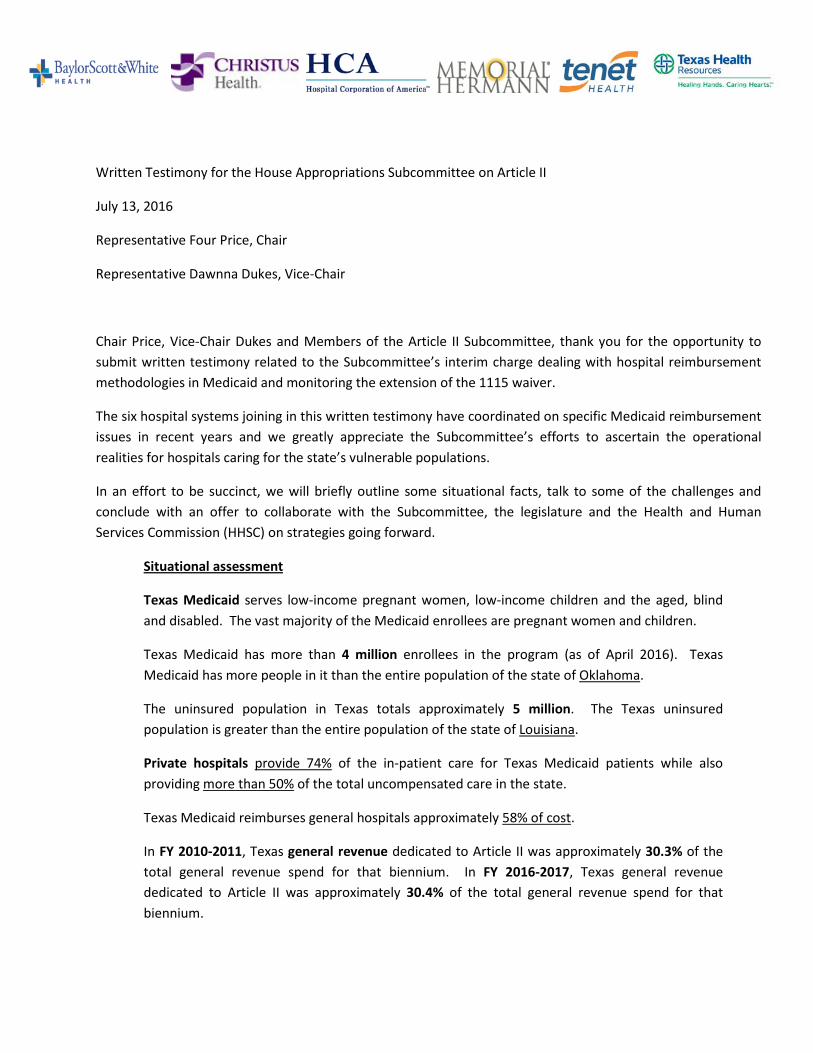
Written Testimony for the House Appropriations Subcommittee on Article II
July 13, 2016
Representative Four Price, Chair
Representative Dawnna Dukes, Vice-Chair
Chair Price, Vice-Chair Dukes and Members of the Article II Subcommittee, thank you for the opportunity to submit written testimony related to the Subcommittee’s interim charge dealing with hospital reimbursement methodologies in Medicaid and monitoring the extension of the 1115 waiver.
The six hospital systems joining in this written testimony have coordinated on specific Medicaid reimbursement issues in recent years and we greatly appreciate the Subcommittee’s efforts to ascertain the operational realities for hospitals caring for the state’s vulnerable populations.
In an effort to be succinct, we will briefly outline some situational facts, talk to some of the challenges and conclude with an offer to collaborate with the Subcommittee, the legislature and the Health and Human Services Commission (HHSC) on strategies going forward.
Situational assessment
Texas Medicaid serves low-income pregnant women, low-income children and the aged, blind and disabled. The vast majority of the Medicaid enrollees are pregnant women and children.
Texas Medicaid has more than 4 million enrollees in the program (as of April 2016). Texas Medicaid has more people in it than the entire population of the state of Oklahoma.
The uninsured population in Texas totals approximately 5 million. The Texas uninsured population is greater than the entire population of the state of Louisiana.
Private hospitals provide 74% of the in-patient care for Texas Medicaid patients while also providing more than 50% of the total uncompensated care in the state.
Texas Medicaid reimburses general hospitals approximately 58% of cost.
In FY 2010-2011, Texas general revenue dedicated to Article II was approximately 30.3% of the total general revenue spend for that biennium. In FY 2016-2017, Texas general revenue dedicated to Article II was approximately 30.4% of the total general revenue spend for that biennium.
Challenges
A rate of reimbursement in Medicaid capturing only 58% of cost forces a reliance on Medicaid supplemental payments to ensure delivery of care for Medicaid and the uninsured.
The 1115 waiver freights the Uncompensated Care (UC) pool which supplements the core reimbursement rate paid to hospitals caring for Medicaid and low-income patients. The UC pool is finite and is limited to $3.1 billion allocated for FY 2017. The UC need in Texas continues to grow and is estimated to reach $6.6 billion by 2018.
The 1115 waiver’s other funding component is the Delivery System Reform Incentive Payment pool. While the Center for Medicare and Medicaid Services (CMS) intended for DSRIP to seed innovative delivery models, there seems to be encroaching disenchantment with DSRIP which diminishes its long-term viability beyond 2017.
CMS has made clear their intention to disregard the portion of our UC calculation related to Medicaid losses which would eliminate nearly half of our uncompensated care claims. Further, CMS has drastically reduced their commitment to the continuation of programs and services funded by DSRIP. The likelihood of a reduced level of CMS waiver support puts the state’s safety net at risk. We need to work closely with HHSC and the legislature to identify opportunities to supplement general revenue support to help reduce the losses related to hospital care for Medicaid and uninsured patients.
Funding for Texas Medicaid is tripartite: the state (core reimbursement), certain counties (supplemental payments) and the federal government (matching funds). Considering that three discrete levels of government must coordinate while relying on private providers to perform the majority of the care imbues the Medicaid program in Texas with a certain instability.
Conclusion
We greatly appreciate the Subcommittee’s attention to these matters in the Texas Medicaid program and we commend the legislature for investing in rate enhancement during the 84th legislative session. Each of the listed hospital systems is proud to care for Texans by Texans in Texas – thank you for your service to our great state.