Embed Size (px)
Citation preview

SOME SUGGESTIONS FOR EE POLICY IMPROVEMENT IN MINNESOTA
Presentation to the Minnesota Legislative Energy Commission
January 8, 2014
by
Martin Kushler, Ph.D.
Senior Fellow
American Council for an Energy-Efficient Economy

Three current ‘hot topics’
1. Natural gas prices
2. Climate Change
3. Industrial Customers
2

DO THE CURRENT LOW NATURAL GAS PRICES MEAN THAT ENERGY EFFICIENCY IS NOT NEEDED?
1. No. Energy efficiency is still very cost-effective
[see next slide]
2. Natural gas prices won’t stay this low for very long
[resource decisions need to be made on 10, 20
and 30 year time horizons]
3

4
Levelized Cost of Combined Cycle Combustion Turbine at Alternative Natural Gas Prices and Lifetime Capacity Factors
Compared to Utility Cost of Conservation
$0
$20
$40
$60
$80
$100
$120
$140
$160
$1.00/MMBtu $2.00/MMBtu $4.00/MMBtu $6.00/MMBtu
Leve
lize
d C
ost
(2
00
6$
/MW
H)
Lifetime Natural Gas Price
PNW Maximum CF (79%) PNW Average CF (51%)PNW Minimum CF (17%) Historical Utility Cost of Efficiency

WHAT ABOUT CLIMATE CHANGE?
1. Energy efficiency is by far the cheapest electricity resource
option….even without adding CO2 costs
2. A modest $20/ton cost for CO2 would add nearly 2 cents
per kWh to the cost of electricity from coal, and nearly a
penny/kWh to natural gas fired electricity
3. Energy efficiency reduces risk to Minnesota by reducing
the amount of such future costs the state would face (i.e.,
by burning less coal and natural gas)
4. Energy efficiency is a “no regrets” policy because it’s other
benefits are so substantial. The carbon cost “risk
reduction” benefit is essentially “free”. EE is smart policy
,..even if no dollar cost is ever attached to CO2 emissions
5. If one does want to take action on climate, there is general
consensus that energy efficiency should be the first priority
5

WHAT ABOUT INDUSTRIAL CUSTOMERS?
1. The industrial customer sector is a major share of
the total electric system load
[~ a third of total MWh sales in MN]
2. The industrial sector holds the largest and cheapest
energy efficiency opportunities for the utility system
[typically 1 to 2 cents/kWh or less]
3. Any serious effort to lower total electric system costs
for all customers must include capturing energy
efficiency improvements in the industrial sector
[If industrial customers “opt out”, that is a major
policy and program failure]
4. The keys are strong policies keeping industrials “in”,
and attractive programs to encourage participation 6

WHY INDUSTRIAL CUSTOMERS “ON THEIR OWN” DO NOT CAPTURE ALL COST-EFFECTIVE EE
The Problem
A typical large corporation will not invest in a project unless
there is a very quick return…a historical “rule of thumb” has
been about a two-year ‘payback’ [With the current tight
economy, it is likely closer to 1-year now]
Assume a 2-yr. payback [device costs $2, saves $1 per year]
Typical industrial rate: 7.5 cents/kWh [$1/.075 = 13.33 kWh]
For the utility, a device that cost $2 and saved 13.33 kWh/yr.,
levelized over a 10-yr. life, would cost just 1.9 cents/kWh
That means that any EE with a cost over 1.9 cents per kWh
will likely not get done by the customer, “on their own”
Here’s how utility EE programs overcome that problem….
7

EXAMPLE OF HOW A UTILITY EE PROGRAM FOR INDUSTRIAL CUSTOMERS PRODUCES COST-EFFECTIVE
EE THAT WOULD NOT OTHERWISE HAPPEN
• Assume an EE project with a four-year payback
Cost: $4, annual savings: $1 (again, 13.33 kWh/yr.)
On its own, the customer would not do this project
The Utility EE Program
The utility provides a $2 incentive to the customer, to “buy down” the payback to 2 yrs, allowing the project to proceed
The utility is essentially “buying” energy efficiency savings from the customer….in this case at a levelized cost of just 1.9 cents/kWh [$2 x CRF of .1294/13.33 kWh]
This is about one-fourth the cost of electricity from building, fueling and operating a new power plant.
The industrial customer benefits directly, the utility system (all ratepayers) benefit by avoiding higher-cost supply
8

A LEADING STATE EXAMPLE: INDUSTRIAL CUSTOMERS SUPPORTING PLAN FOR RECORD LEVELS OF UTILITY ENERGY EFFICIENCY
"These are very ambitious goals and we look forward to partnering with the electric and gas utilities to realize these goals and deliver energy efficiency solutions to our members statewide,"
Robert Rio, SeniorVice President of Associated Industries
of Massachusetts, who serves on the Energy Efficiency Advisory Council as its industrial energy users representative.
[In response to the announcement of Massachusetts’ new plan for a $1.1 billion three-year program , to save 2.4% per year through energy efficiency]
9
Some Suggestions for EE Policy Improvement
10
11
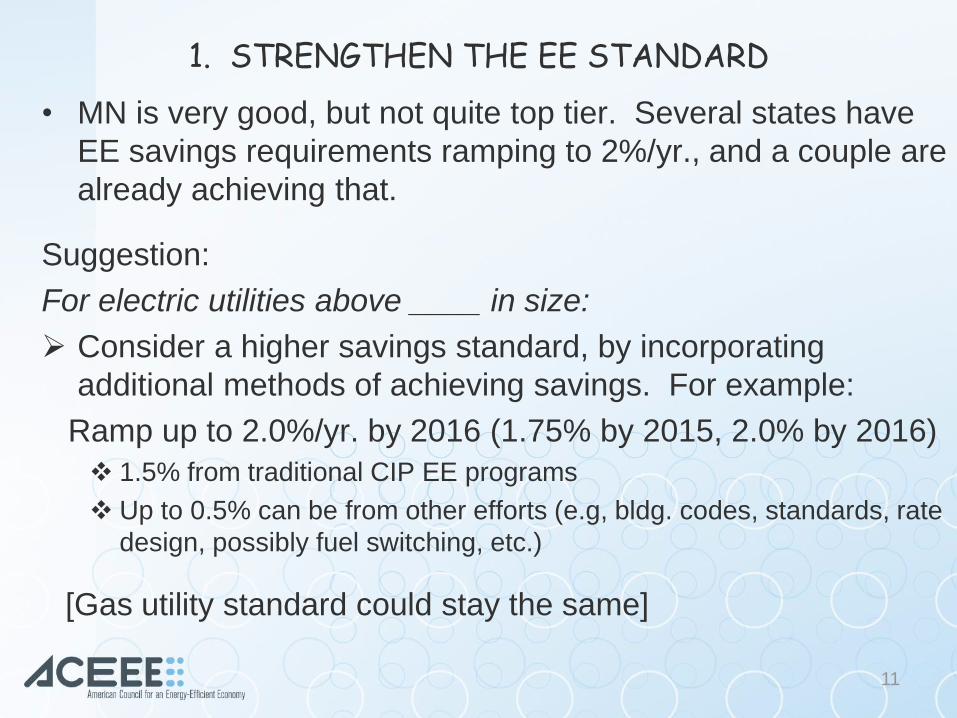
1. STRENGTHEN THE EE STANDARD
• MN is very good, but not quite top tier. Several states have
EE savings requirements ramping to 2%/yr., and a couple are
already achieving that.
Suggestion:
For electric utilities above ____ in size:
Consider a higher savings standard, by incorporating
additional methods of achieving savings. For example:
Ramp up to 2.0%/yr. by 2016 (1.75% by 2015, 2.0% by 2016)
1.5% from traditional CIP EE programs
Up to 0.5% can be from other efforts (e.g, bldg. codes, standards, rate
design, possibly fuel switching, etc.)
[Gas utility standard could stay the same]

12
2. FIND A WAY TO INCORPORATE DELIVERABLE FUELS SAVINGS (OIL AND PROPANE)
• MN is 100% dependent upon imported energy fuels
• These fuels are expensive for customers, and drain dollars
from the MN economy
• Some of the leading states are pursuing policies to integrate
deliverable fuel savings into their utility EE programs
Suggestion:
Consider allowing ‘credit’ (& incentives) to utilities for savings
of those fuels
More challenging option:
Consider establishing a CIP requirement (funding and
savings) on deliverable fuels suppliers

13
3. ENSURE THAT ALL CUSTOMERS ARE INCLUDED IN THE STATE EE POLICY OBJECTIVES (I.E. FIX THE ‘OPT OUT’ PROBLEM)
• Energy efficiency is a utility system resource. All customers
should pay for that resource, just like they pay for power plants.
• Industrial customers are about one-third of total electric load in
MN. They must be a key part of any policy to address state
objectives in this area (electric resource supply and costs, dollar
drain for imported fuels; environmental impacts; etc.) They are
big, what they do matters a lot.
Suggestions:
Create a practical and effective “self-direct” program for
customers that don’t want to be in the ‘normal’ CIP program
Create desirable programs to motivate large customers to
participate in CIP…including a program for customers “sell”
EE savings to the utility. Enable current opt-outs to opt back in

14
4. ESTABLISH PARALLEL CHP GOALS AND INCENTIVES
• CHP is a very desirable energy strategy for MN to pursue.
However, it is not really an end-use energy efficiency
measure such as the measures CIP generally targets.
• If CHP is expanded within the existing CIP savings goals,
there is a risk that it will displace end-use efficiency
savings…resulting in a ‘zero sum game’.
Suggestion:
Establish a parallel goal for CHP implementation, and create
regulatory mechanisms to facilitate and reward utilities for
CHP accomplishments

15
5. IMPROVE REGULATORY STRUCTURE SUPPORTING UTILITY EE EFFORTS
• In order to sustain large-scale energy efficiency achievements
over time, it will be necessary to address the utility concern
with declining sales levels over time
• Minnesota’s “3-legged Stool” of utility regulatory mechanisms
is currently imbalanced, with no electric decoupling and an
over-reliance on a shareholder incentive mechanism.
Suggestions:
Implement electric utility decoupling (some things can be done
through regulatory cases, and some things legislatively to
assist this)
Reform the shareholder incentive mechanism so that the
incentive is not so large relative to the EE program costs

16
6. ENSURE CONTINUATION OF STRONG MUNI AND CO-OP PARTICIPATION IN CIP
• Public power is a very important component of the electric
system in MN. To achieve state objectives, this sector must
be fully engaged.
• Capabilities and economic circumstances vary widely.
Suggestions:
Consider ‘bundling’ across utilities so low savers can
acquire savings credit from high savers, and the target is
met in aggregate.
Consider allowing programs that target electric fuel choice
using high-efficiency options such as geothermal hvac and
geothermal/heat pump water heat, to displace inefficient
deliverable fuel end uses. Perhaps allow credit for these
savings once a minimum (e.g.,1%) savings level is reached.

17
7 & 8. UTILIZE LINKAGES WITH CIP TO SUPPORT RELATED OBJECTIVES
• Minnesota’s CIP framework is a very powerful platform to
support additional energy efficiency gains in MN.
Suggestions:
Have electric and gas utilities develop special lower rates
and hook-up charges for qualifying new buildings that meet
the “Sustainable Building 2030” requirement. Allow utilities
to claim the incremental savings from this practice toward
their CIP savings goals.
Develop a clear policy for MN to include the impacts of utility
CIP programs in the state’s environmental air regulation
compliance strategies. Enable the MPUC to recognize the
value of reduced emissions in developing incentives for
utilities’ CIP accomplishments.
18
9. INCORPORATE A NEAR-TERM STATE CARBON POLICY AND GOALS INTO CIP GOALS AND INCENTIVES
• There is a substantial risk of explicit costs being attached to
CO2 emissions some time in the foreseeable future
• Energy efficiency is universally regarded as the lowest-cost
method for reducing CO2 emissions
Suggestions:
Establish a near-term state policy and goals for CO2
emission reductions. Integrate those goals into CIP plans
and enable the MPUC to factor CO2 reduction achievements
into utility shareholder incentive mechanisms

10. IMPLEMENT UTILITY ON-BILL EE LOAN REPAYMENT
• Lack of access to convenient, low-cost financing is a
significant barrier to customer implementation of
energy efficiency improvements
• Several leading states now allow customers to repay
energy efficiency loans through their utility bill
Suggestion:
Enable utilities to offer on-bill loan repayment for
energy efficiency improvements, and develop rules and
procedures to encourage utilities to do so.
19

20
APPENDIX A
Background on Energy Efficiency
From December 19, 2013 presentation to LEC

21 21
The American Council for an Energy-Efficient Economy (ACEEE)
• Nonprofit 501(c)(3) dedicated to advancing energy efficiency through research, communications, and conferences. Founded in 1980.
• ~40 staff in Washington DC, + field offices in DE, MI, and WI.
• Focus on End-Use Efficiency in Industry, Buildings, Utilities, and Transportation; and State & National Policy
• Funding: Foundations (34%), Federal & State Grants (7%), Contract research work (21%) Conferences and Publications (34%), Contributions and Other (4%)
Martin Kushler, Ph.D. (Senior Fellow, ACEEE)
• 30 years conducting research in the utility industry, including:
• 10 years as Director of the ACEEE Utilities Program
• 10 years as the Supervisor of the Evaluation section at the Michigan PSC
• Have assisted over a dozen states with utility EE policies
• Minnesota experience:
• Advisor to Xcel CIP Advisory Board 2000-2008, 2012
• Advisor to MN Legislative Auditor on CIP evaluation (2005)
• Advisor to MNCEE, 2012-present

TOPICS
• Minnesota’s energy disadvantage
• Why energy efficiency should be the top priority
• Energy efficiency as a utility system resource
• Energy efficiency as economic development
• A few current ‘hot topics’
• Grading Minnesota
• Opportunities for further progress
23
KEY POINT #1: MINNESOTA HAS A BIG ENERGY PROBLEM
• Minnesota uses a lot of energy
– Total cost $12 billion per year in 2000
By 2010, had increased to $21 billion!!!
• Minnesota is essentially totally dependent on fuels imported from other states and countries
Minnesota imports:
– 100% of the coal and uranium used
– 100% of oil & petroleum products
– 100% of the natural gas

24
COST OF MINNESOTA’S ENERGY IMPORTS
• Before the new ‘high energy cost’ era (circa
2000), roughly $7 billion per year was leaving
Minnesota to pay for fuel imports
• At 2010 market prices, this dollar outflow
was over $13 billion per year
THIS IS A HUGE ECONOMIC DRAIN ON
MINNESOTA’S STATE ECONOMY!

25
Economic Burden on Minnesota Homes and Businesses:
State Taxes vs. Energy Costs (2010)
$14.2
$20.9
$0.0
$5.0
$10.0
$15.0
$20.0
$25.0
Total MN Taxes (2010) Total MN Energy Costs (2010)
Billio
ns
of
Do
lla
rs
$13 billion drain
for imported fuels

26
EFFECTS ON THE STATE ECONOMY
This additional $6 billion annual drain on Minnesota’s economy is roughly equivalent to the lost payroll from closing 120 major manufacturing plants.
(assuming 1000 jobs @ $50,000 each, per plant)
Even the Wall Street Journal has written about the unprecedented transfer of wealth, calling it a “bonanza” and “windfall” for the handful of big energy producing states (i.e., AK, NM, ND, WY and TX) and countries (e.g., OPEC).

27
KEY POINT #2:
MINNESOTA’S FUTURE IS NOT IN FOSSIL FUELS
MINNESOTA’S RECOVERABLE RESERVES AS A
SHARE OF U.S. RECOVERABLE RESERVES (Source: U.S. EIA)
• Coal: 0%
• Oil: 0 %
• Natural Gas: 0%
[also Uranium: 0%]
Why would Minnesota support policies that encourage greater consumption of these resources?
(At the state OR federal level !)
28

29

30

As a matter of state policy, Minnesota should be trying to maximize the amount of energy efficiency it can accomplish…
… and minimize the amount of additional fuel imports it needs
31

32
KEY POINT #3
It is much cheaper to save energy
than it is to produce it.
[We can save electricity for about one-third the
cost of producing it through a new power plant
…. With no carbon (CO2) emissions]

Cost of New Electricity Resources [Source: Lazard 2011]
33
0
5
10
15
20
25
EnergyEfficiency
Wind Biomass NaturalGas
CombinedCycle
PulverizedCoal*
Nuclear Coal IGCC Solar PV
Ran
ge o
f L
eveli
zed
Co
sts
(cen
ts p
er
kW
h)
*Notes: All data from Lazard 2011. High-end range of advanced pulverized coal includes 90% carbon capture and compression.

34
Minnesota’s electricity policy, should be trying to maximize the amount of energy efficiency resources it can acquire,
… and minimize the amount of new power plants needed
(This is in fact now the declared policy of a
number of leading states…. )

35
POLICY PRIORITY #1: UTILITY SECTOR ENERGY EFFICIENCY PROGRAMS
• Substantial utility-funded energy efficiency resource programs are the cornerstone of the policy efforts of every leading state on energy efficiency
– States don’t spend tax dollars on this…they are all broke
– Utilities spend $billions every year (~ $8 billion in Minnesota). Just direct 3% or 4% to energy efficiency

Energy Efficiency as a
utility system resource
36

37
RATIONALE FOR ENERGY EFFICIENCY AS A UTILITY SYSTEM RESOURCE
SIMPLY STATED:
• Utility systems need to have adequate supply resources to meet customer demand
• To keep the system in balance, you can add supply resources, reduce customer demand, or a combination of the two
• In virtually all cases today, it is much cheaper to reduce customer demand than to acquire new supply resources
[True for electricity and natural gas]

THE PACIFIC NORTHWEST (ID, MT, OR, WA)
• Best electric resource planning process in the U.S.
• 30 years of energy efficiency program experience
• Since 2005, have met virtually all of their new electric resource needs through energy efficiency and wind power
….The energy efficiency has been achieved at a levelized cost of 2.4 cents/kWh
The Sixth Northwest Conservation and Electric Power Plan
Northwest Power and Conservation Council, February 2010.
[http://www.nwcouncil.org/energy/powerplan/6/plan/]

Pacific NW 6th Plan Resource Portfolio (2010)
0
1000
2000
3000
4000
5000
6000
7000
8000
2010 2015 2020 2025
Cum
ula
tive R
esourc
e
(Avera
ge M
egaw
att
s)
SCCT
CCCT
Geothermal
New Wind
RPS Wind
Conservation
40
The Pacific Northwest provides
a great example of what is possible….
Minnesota can chart an energy course
that is fundamentally based on energy
efficiency and cost-effective local
Minnesota renewable resources

41 41
KEY POINT #4
ENERGY EFFICIENCY
is
Minnesota’s best opportunity
For economic development

42
THE ECONOMIC “TRIPLE PLAY”
Energy Efficiency is the only resource that boosts
the economy and provides jobs in 3 key ways:
1. Direct employment in delivering the EE
2. Local re-spending of saved energy dollars
3. Reduced energy costs for all ratepayers
Cheapest resource for the utility system
Downward pressure on market energy prices

So how does Minnesota compare to other
states on utility-sector energy efficiency?
43

Energy Efficiency Resource Standards
HI: 4,300 GWh
by 2030
20% of load growth by 2010
11.5% by
2020
10% of
2005
sales by
2020
1.5%
annual
by 2010
>2%%
annual
by 2015
VT: 2.0% annual now
MA: 2.4% annually by 2012
CT: 1.5%/yr now
25 States –as of 2012
DC: 20% by 2020
DE: 15% by 2015
~10% by 2025
VA: 10% by 2020
2% annual by 2015
1.5%
annual
(post-
2010)
>1% annual
by
2012
1% annual. By 2011
4% by 2020
0.6%
annually
2% annual by 2019
1.0%
annual
by2012
Standard
Voluntary Goal
Pending Standard or Goal
Combined RES/EERS
MD: 15% by 2015 (relative to 2007 sales)
20% of
2005
sales by
2020
2% annual by 2019
45 45
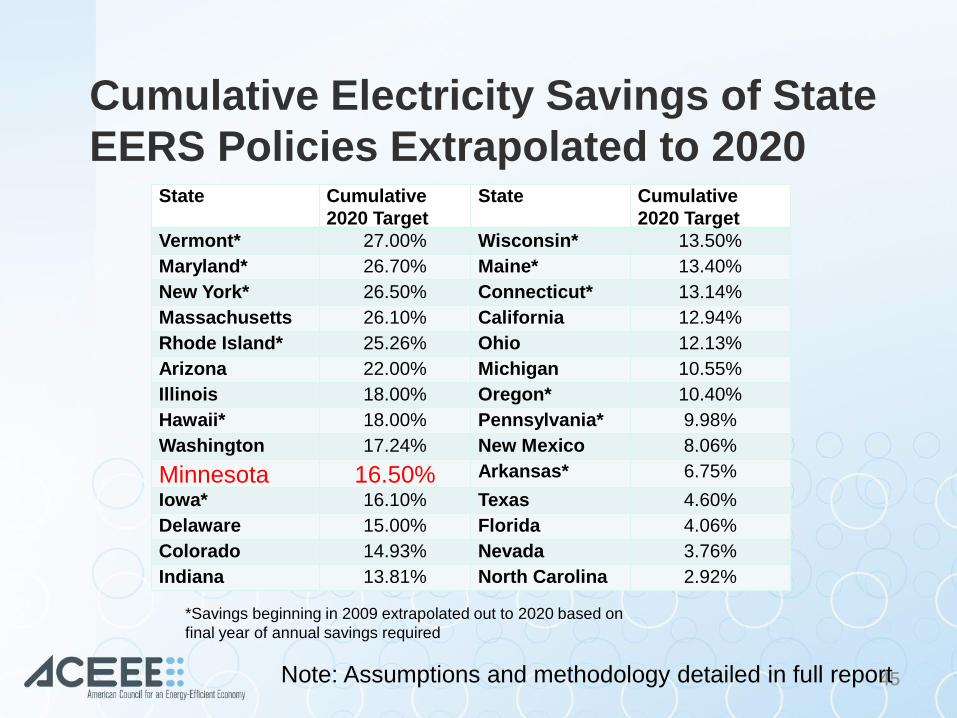
Cumulative Electricity Savings of State
EERS Policies Extrapolated to 2020 State Cumulative
2020 Target
State Cumulative
2020 Target
Vermont* 27.00% Wisconsin* 13.50%
Maryland* 26.70% Maine* 13.40%
New York* 26.50% Connecticut* 13.14%
Massachusetts 26.10% California 12.94%
Rhode Island* 25.26% Ohio 12.13%
Arizona 22.00% Michigan 10.55%
Illinois 18.00% Oregon* 10.40%
Hawaii* 18.00% Pennsylvania* 9.98%
Washington 17.24% New Mexico 8.06%
Minnesota 16.50% Arkansas* 6.75%
Iowa* 16.10% Texas 4.60%
Delaware 15.00% Florida 4.06%
Colorado 14.93% Nevada 3.76%
Indiana 13.81% North Carolina 2.92%
*Savings beginning in 2009 extrapolated out to 2020 based on
final year of annual savings required
Note: Assumptions and methodology detailed in full report

46
2012 ACEEE State EE Scorecard Rankings

47
CHANGE IN ACEEE OVERALL EE SCORECARD RANKINGS MIDWEST STATES 2006 2012
99 5050
3542
3439 4643
1311
4846 1217
2614
3312
2722
3536
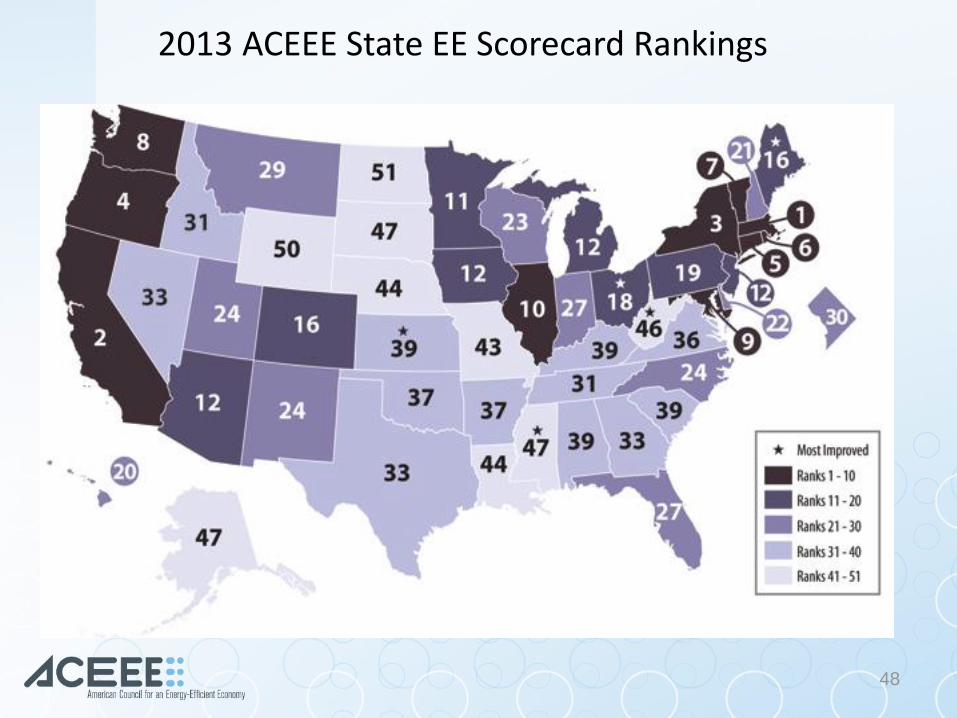
2013 ACEEE State EE Scorecard Rankings
48

GRADING MINNESOTA… ON UTILITY-SECTOR ENERGY EFFICIENCY POLICIES AND PERFORMANCE
Overall grade: B+/A-
Areas for improvement to be truly “top tier”:
• Find ways to save more than the 1.5%/year CIP standard
• Find ways to include deliverable fuels (oil & propane)
• Improve industrial customer buy-in to the EE policy
• Find a way to capture CHP as a win-win for all
• Improve regulatory structure for EE through decoupling
• Ensure strong participation by public power (muni’s & coops)
• Use hook-up fees and rate design to recognize EE
• Formally incorporate utility EE in state air quality objectives
(ideally including GHG)
• Implement utility on-bill EE loan repayment
[other areas for improvement: transportation, bldg. codes] 49

50
CONCLUSIONS • Minnesota has historically been among the leading
states on energy efficiency policy (e.g., “top ten”)
• In the last decade, Minnesota has stagnated a bit, while other leading states continue to improve
(e.g., Minnesota just fell out of the top ten in ACEEE’s rankings)
• Minnesota has more economic reasons to pursue energy efficiency than almost any other state
(energy import dollar drain, zero fossil fuel resources)
• Considering ‘climate’ (GHG) goals only adds frosting to the cake
• There are substantial opportunities to do even better
(see Appendix A)