Embed Size (px)
DESCRIPTION
Presentation to the Steering Committee on Integrated Watershed Management Programme. Proposals for 2011-12 State: …….. Date: …………. STRUCTURE OF PRESENTATION. Perspective Plan of the State on a map Review of progress in implementation of pre-IWMP projects - PowerPoint PPT Presentation
Citation preview
Presentation to the Steering Committee on Integrated Watershed Management
Programme
Proposals for 2011-12
State: ……..
Date: …………
STRUCTURE OF PRESENTATION
• Perspective Plan of the State on a map
• Review of progress in implementation of pre-IWMP projects
• Review of progress under IWMP in 2009-10, 2010-11
• Proposal under IWMP for the year 2011-12
• Strategy of implementation of projects proposed for 2011-12
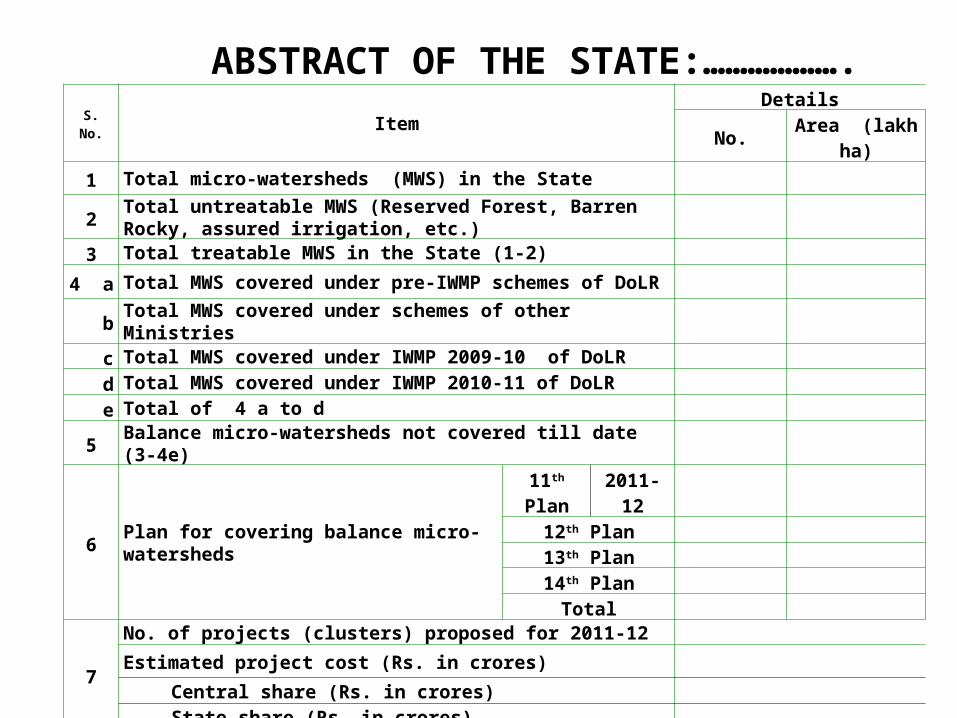
S. No. ItemDetails
No. Area (lakh ha)
1 Total micro-watersheds (MWS) in the State
2Total untreatable MWS (Reserved Forest, Barren Rocky, assured irrigation, etc.)
3 Total treatable MWS in the State (1-2)
4 a Total MWS covered under pre-IWMP schemes of DoLR
b Total MWS covered under schemes of other Ministries
c Total MWS covered under IWMP 2009-10 of DoLR
d Total MWS covered under IWMP 2010-11 of DoLR
e Total of 4 a to d
5 Balance micro-watersheds not covered till date (3-4e)
6Plan for covering balance micro-watersheds
11th Plan 2011-12
12th Plan13th Plan14th Plan
Total
7
No. of projects (clusters) proposed for 2011-12
Estimated project cost (Rs. in crores)
Central share (Rs. in crores)State share (Rs. in crores)
ABSTRACT OF THE STATE:……………….
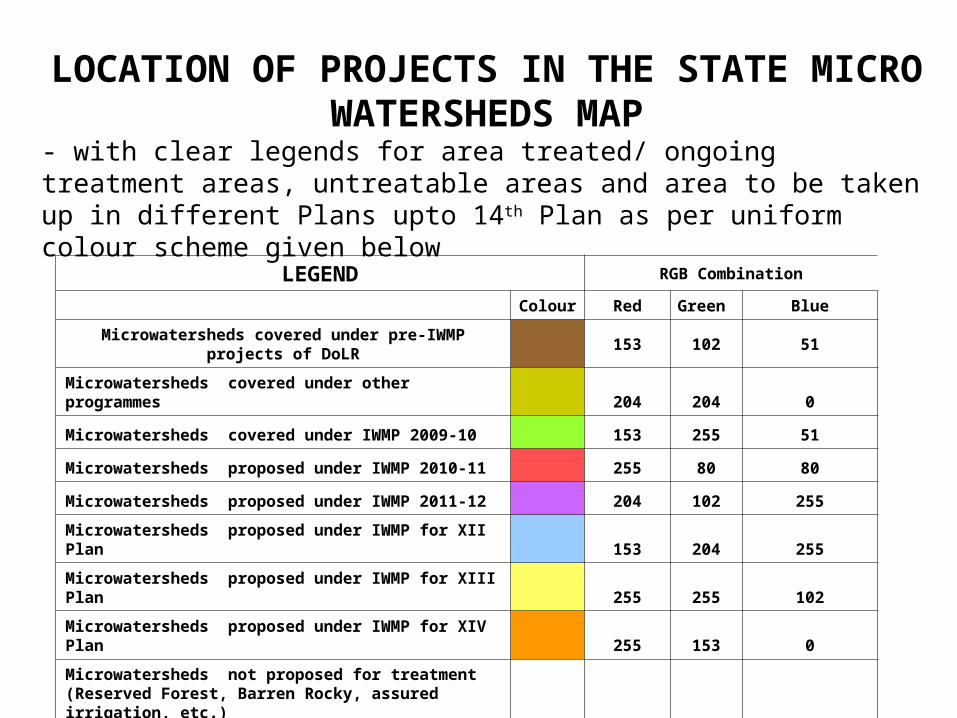
LOCATION OF PROJECTS IN THE STATE MICRO WATERSHEDS MAP
- with clear legends for area treated/ ongoing treatment areas, untreatable areas and area to be taken up in different Plans upto 14th Plan as per uniform colour scheme given below
LEGEND RGB Combination
Colour Red Green Blue
Microwatersheds covered under pre-IWMP projects of DoLR
153 102 51
Microwatersheds covered under other programmes 204 204 0
Microwatersheds covered under IWMP 2009-10 153 255 51
Microwatersheds proposed under IWMP 2010-11 255 80 80
Microwatersheds proposed under IWMP 2011-12 204 102 255
Microwatersheds proposed under IWMP for XII Plan 153 204 255
Microwatersheds proposed under IWMP for XIII Plan 255 255 102
Microwatersheds proposed under IWMP for XIV Plan 255 153 0
Microwatersheds not proposed for treatment (Reserved Forest, Barren Rocky, assured irrigation, etc.)
255 255 255
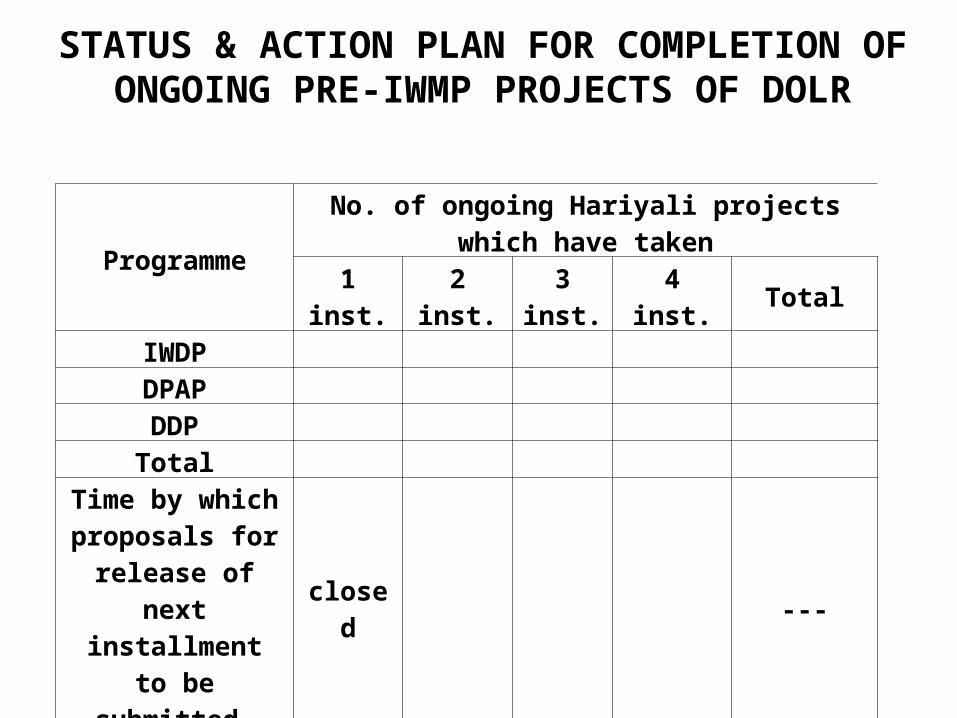
STATUS & ACTION PLAN FOR COMPLETION OF ONGOING PRE-IWMP PROJECTS OF DOLR
ProgrammeNo. of ongoing Hariyali projects which have
taken1 inst. 2 inst. 3 inst. 4 inst. Total
IWDPDPAPDDPTotal
Time by which proposals for
release of next installment to be
submitted
closed ---
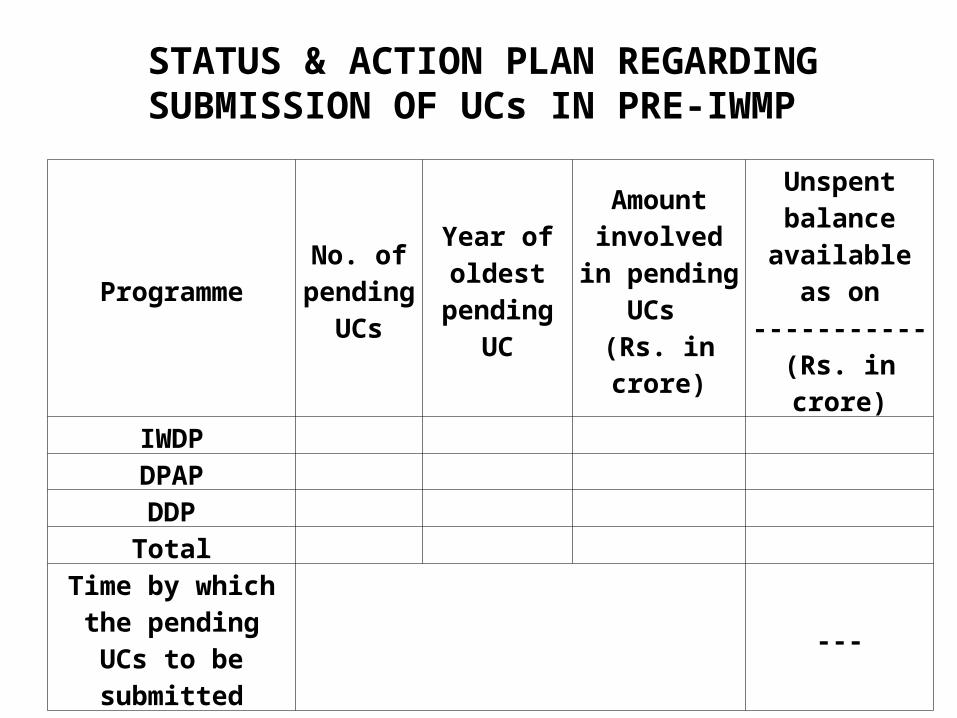
ProgrammeNo. of
pending UCs
Year of oldest
pending UC
Amount involved in
pending UCs
(Rs. in crore)
Unspent balance
available as on -----------
(Rs. in crore)
IWDPDPAPDDPTotal
Time by which the pending UCs to be
submitted---
STATUS & ACTION PLAN REGARDING SUBMISSION OF UCs IN PRE-IWMP

INSTITUTIONAL PREPAREDNESS - 1
Particulars
For projects
sanctioned during
2009-10
For projects
sanctioned during 2010-11
No. of projects sanctioned so far
No. of Districts covered
No. of WCDCs set up
No. of projects in which PIAs are appointed
No. of NGOs/ VOs appointed as PIAs
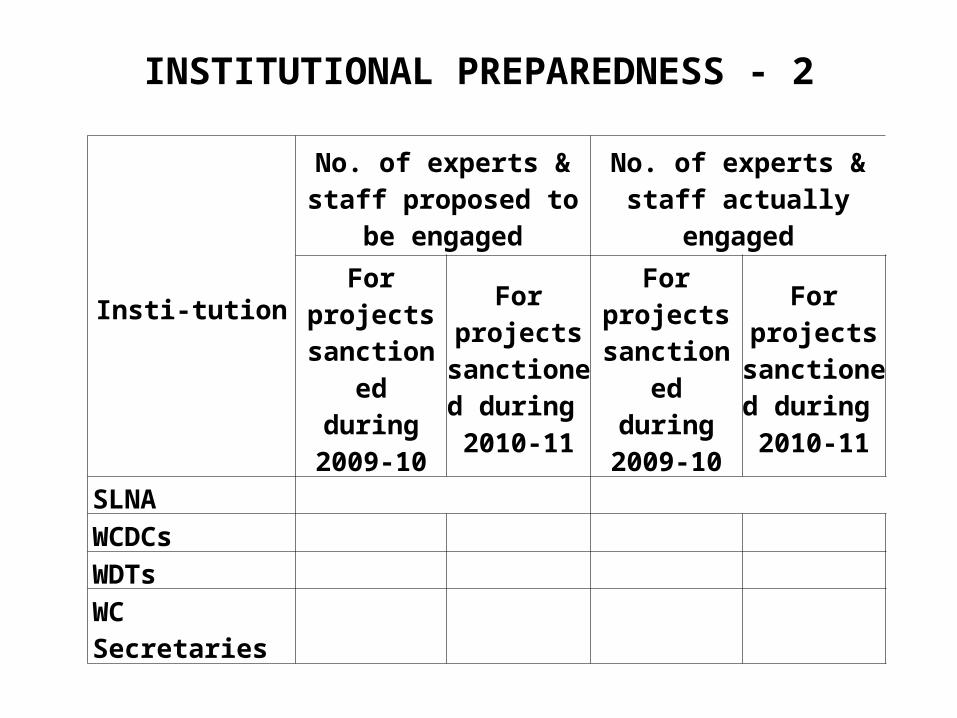
INSTITUTIONAL PREPAREDNESS - 2
Insti-tution
No. of experts & staff proposed to be
engaged
No. of experts & staff actually engaged
For projects
sanctioned during
2009-10
For projects
sanctioned during 2010-11
For projects
sanctioned during
2009-10
For projects
sanctioned during 2010-11
SLNA
WCDCs
WDTs
WC Secretaries
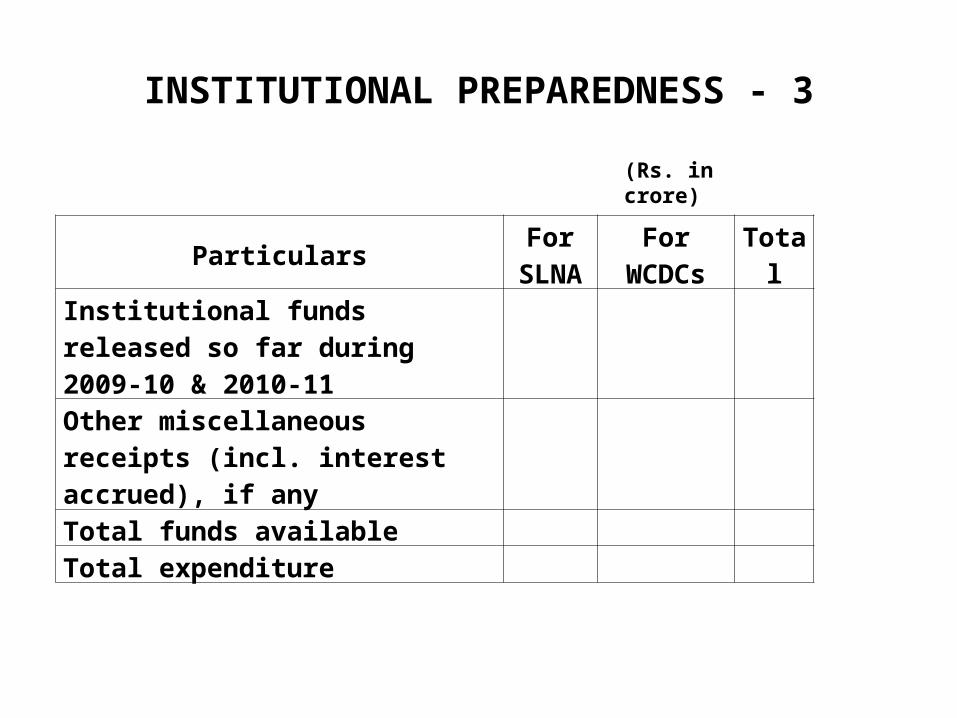
ParticularsFor
SLNAFor
WCDCsTotal
Institutional funds released so far during 2009-10 & 2010-11Other miscellaneous receipts (incl. interest accrued), if anyTotal funds availableTotal expenditure
INSTITUTIONAL PREPAREDNESS - 3
(Rs. in crore)
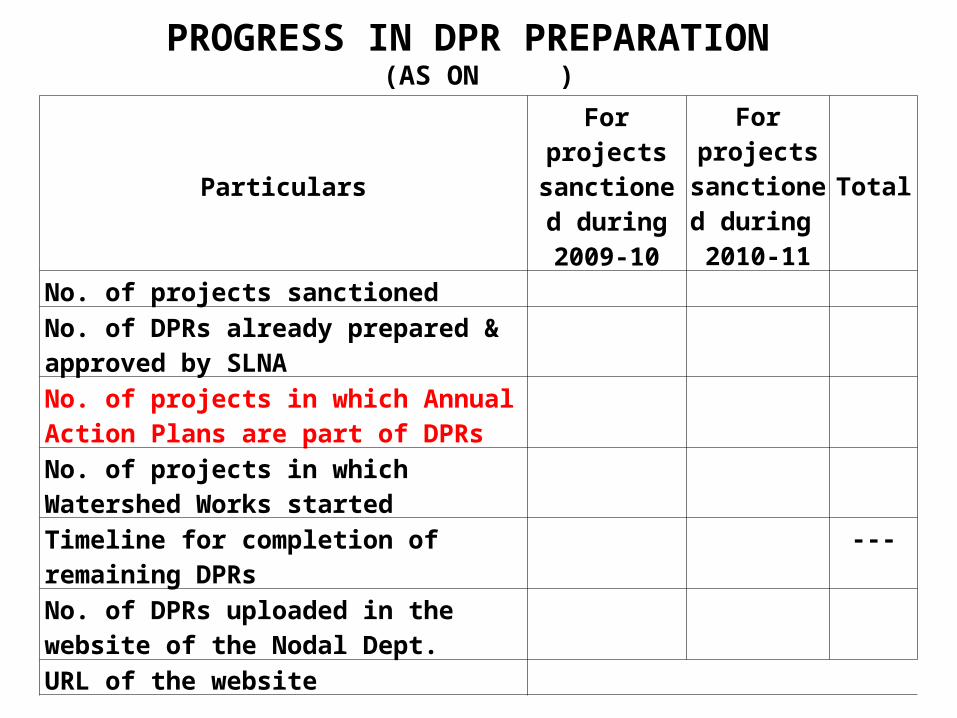
PROGRESS IN DPR PREPARATION (AS ON )
Particulars
For projects sanctioned
during 2009-10
For projects
sanctioned during 2010-11
Total
No. of projects sanctioned
No. of DPRs already prepared & approved by SLNA
No. of projects in which Annual Action Plans are part of DPRs
No. of projects in which Watershed Works started
Timeline for completion of remaining DPRs
---
No. of DPRs uploaded in the website of the Nodal Dept.
URL of the website
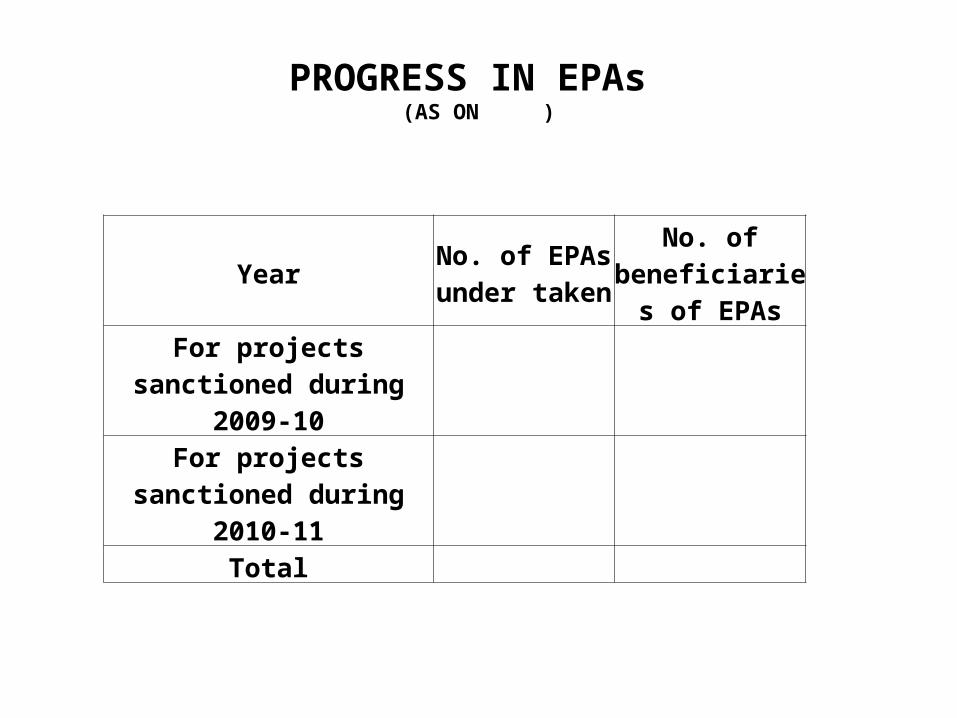
PROGRESS IN EPAs (AS ON )
YearNo. of EPAs under taken
No. of beneficiaries
of EPAsFor projects sanctioned
during 2009-10For projects sanctioned
during 2010-11Total
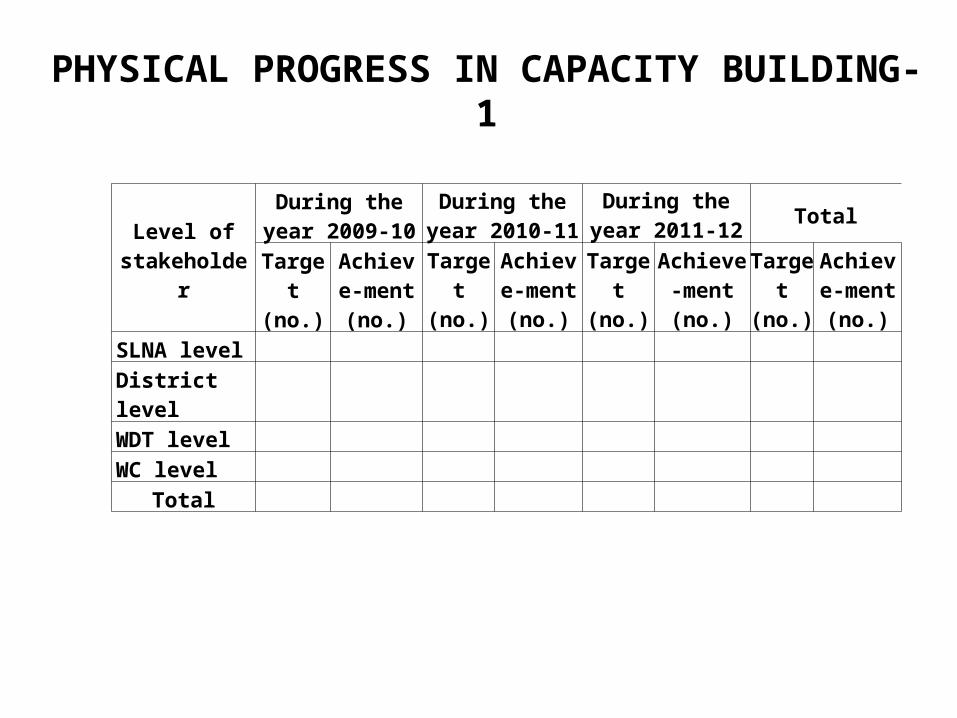
PHYSICAL PROGRESS IN CAPACITY BUILDING- 1
Level of stakeholder
During the year 2009-10
During the year 2010-11
During the year 2011-12
Total
Target (no.)
Achieve-ment (no.)
Target (no.)
Achieve-ment (no.)
Target (no.)
Achieve-ment (no.)
Target (no.)
Achieve-ment (no.)
SLNA level
District level
WDT level
WC level
Total
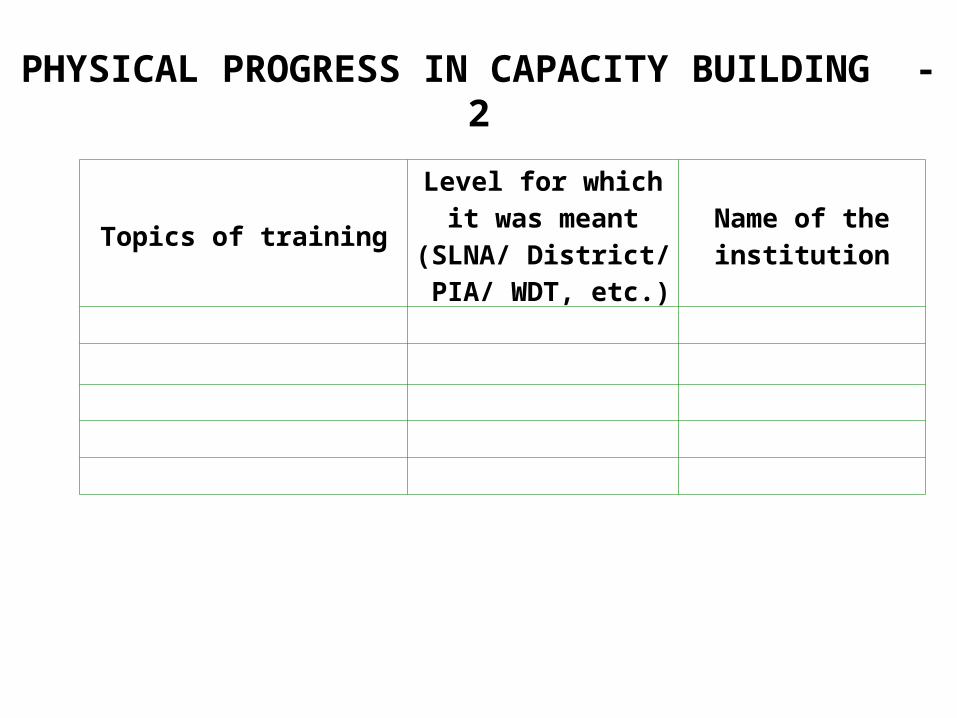
PHYSICAL PROGRESS IN CAPACITY BUILDING - 2
Topics of training
Level for which it was meant (SLNA/ District/ PIA/ WDT,
etc.)
Name of the institution
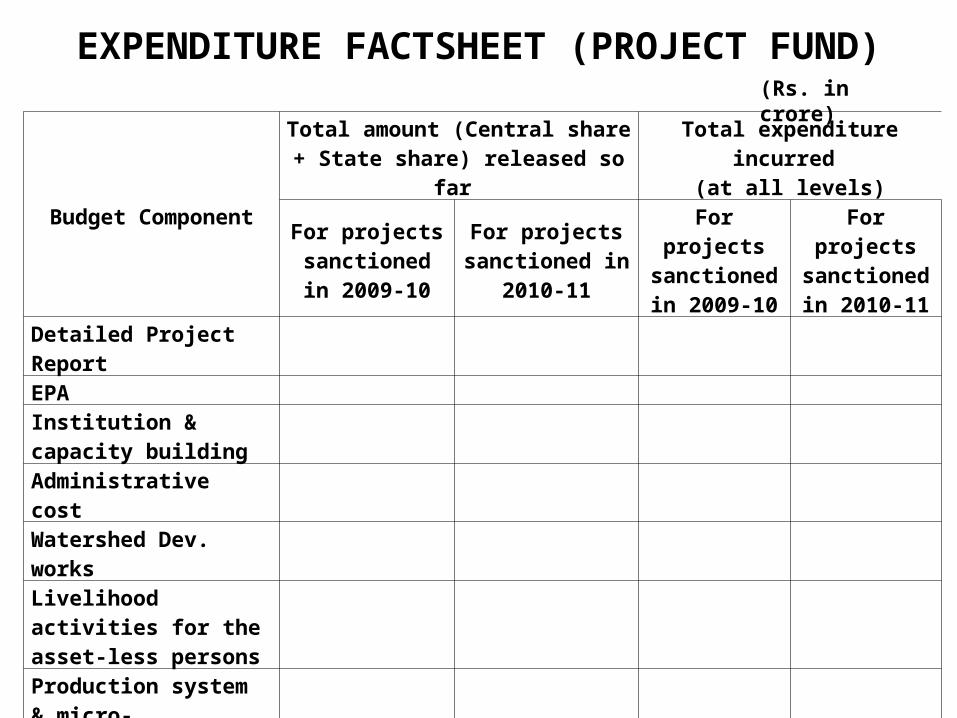
EXPENDITURE FACTSHEET (PROJECT FUND)
Budget Component
Total amount (Central share + State share) released so far
Total expenditure incurred (at all levels)
For projects sanctioned in
2009-10
For projects sanctioned in
2010-11
For projects sanctioned in
2009-10
For projects sanctioned in
2010-11Detailed Project ReportEPAInstitution & capacity buildingAdministrative costWatershed Dev. worksLivelihood activities for the asset-less personsProduction system & micro-enterprisesMonitoringEvaluationConsolidation Phase
Total
(Rs. in crore)
CONSTRAINTS OF STATE GOVT. IN IMPLEMENTING THE PROGRAMME, IF ANY

PROPOSAL FOR 2011-12
Tentative area allocated for 2011-12 (lakh ha)Area already appraised & cleared by the Committee for 2011-12 (lakh ha)Area proposed during this meeting (lakh ha)No. of projectsNo. of Districts
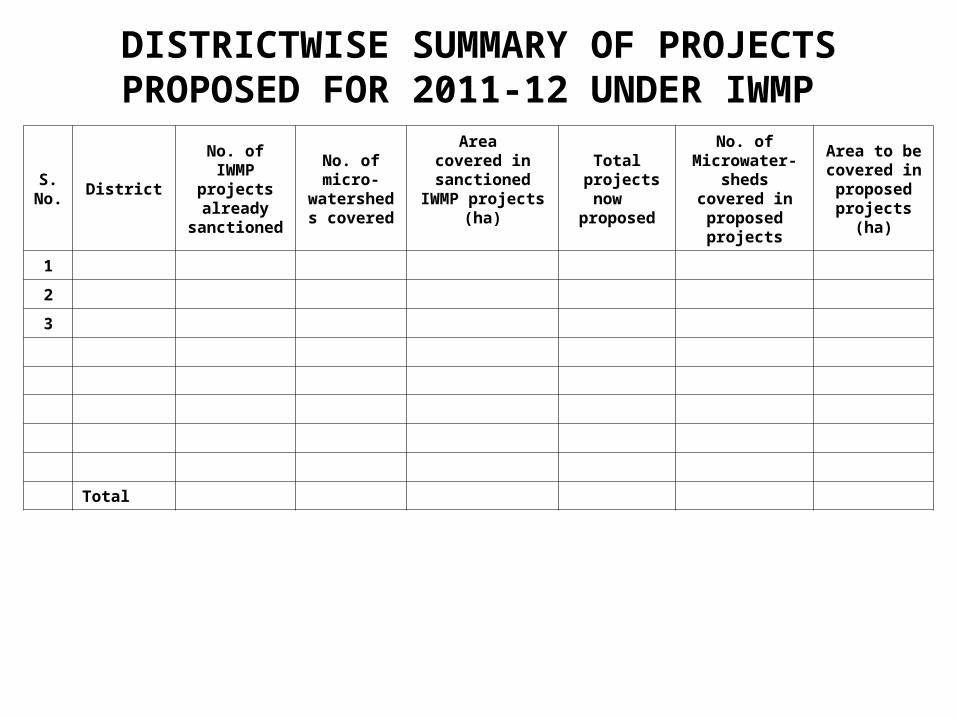
S. No.
District
No. of IWMP projects already
sanctioned
No. of micro-
watersheds covered
Area covered in
sanctioned IWMP projects (ha)
Total projects
now proposed
No. ofMicrowater-
sheds covered in proposed
projects
Area to be covered in proposed
projects (ha)
1
2
3
Total
DISTRICTWISE SUMMARY OF PROJECTS PROPOSED FOR 2011-12 UNDER IWMP
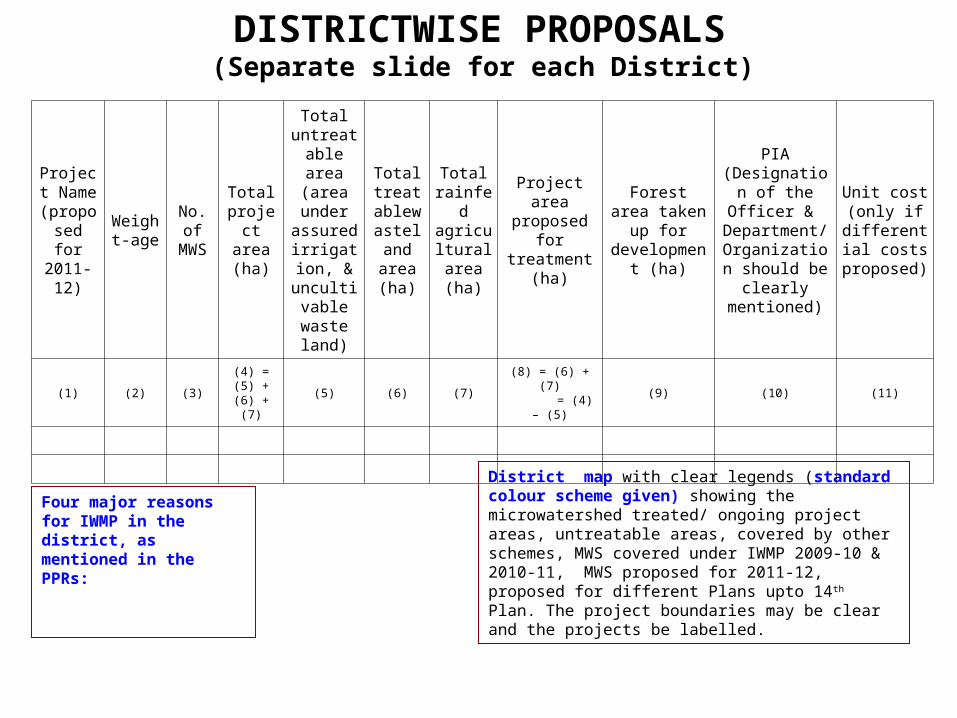
District map with clear legends (standard colour scheme given) showing the microwatershed treated/ ongoing project areas, untreatable areas, covered by other schemes, MWS covered under IWMP 2009-10 & 2010-11, MWS proposed for 2011-12, proposed for different Plans upto 14th Plan. The project boundaries may be clear and the projects be labelled.
Four major reasons for IWMP in the district, as mentioned in the PPRs:
Project Name
(proposed for 2011-
12)
Weight-age
No. of MWS
Total project area (ha)
Total untreatabl
e area (area under
assured irrigation,
& uncultivable waste
land)
Total treatablewastel
and area (ha)
Total rainfed agricult
ural area (ha)
Project area proposed for
treatment (ha)
Forest area taken up for development
(ha)
PIA (Designation of the Officer & Department/ Organization
should be clearly
mentioned)
Unit cost (only if
differential costs
proposed)
(1) (2) (3)(4) = (5) + (6) +
(7)(5) (6) (7)
(8) = (6) + (7) = (4) – (5)
(9) (10) (11)
DISTRICTWISE PROPOSALS (Separate slide for each District)

Implementation strategy for projects proposed for 2011-12 - Institutions
WDT WCNo. of experts & staff to be employedProcedure of employment
Timeline for engagement of experts & staff
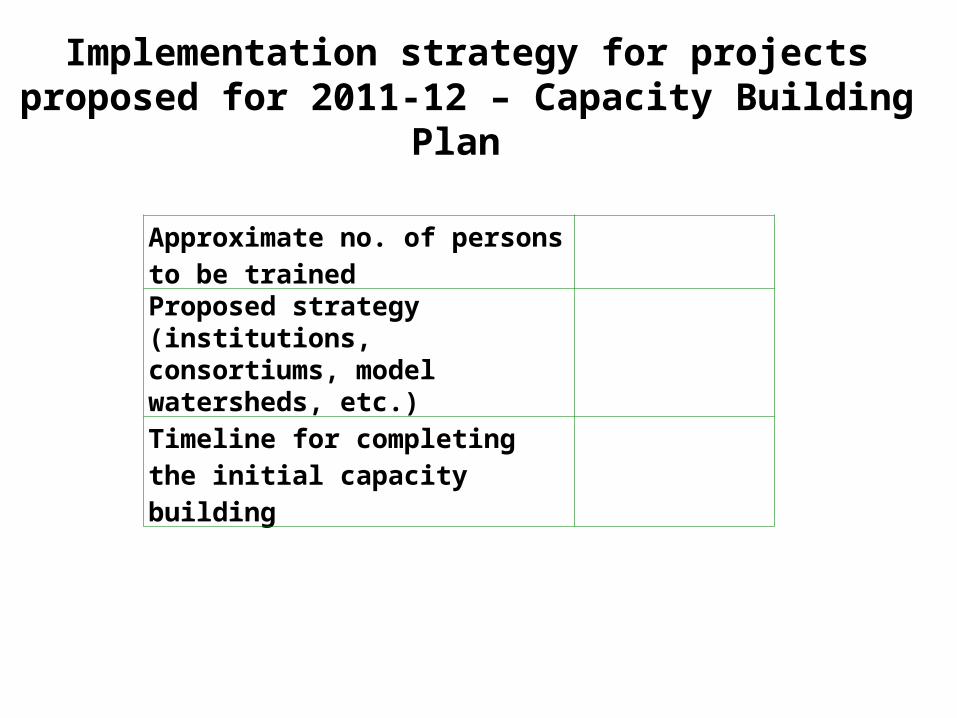
Implementation strategy for projects proposed for 2011-12 – Capacity Building Plan
Approximate no. of persons to be trained Proposed strategy (institutions, consortiums, model watersheds, etc.)Timeline for completing the initial capacity building
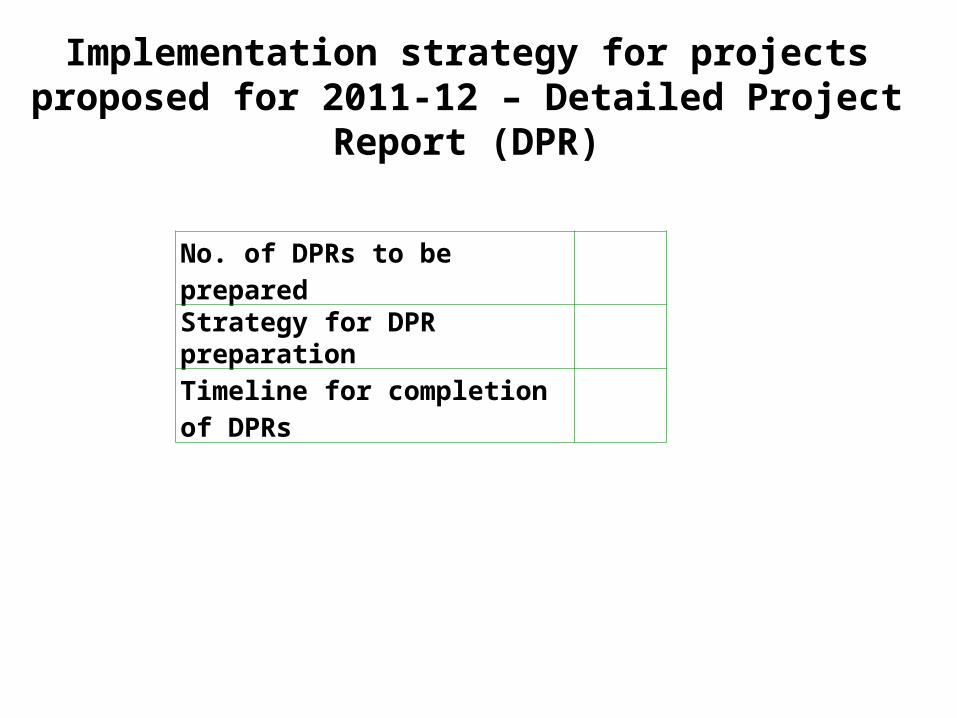
Implementation strategy for projects proposed for 2011-12 – Detailed Project Report (DPR)
No. of DPRs to be preparedStrategy for DPR preparation
Timeline for completion of DPRs
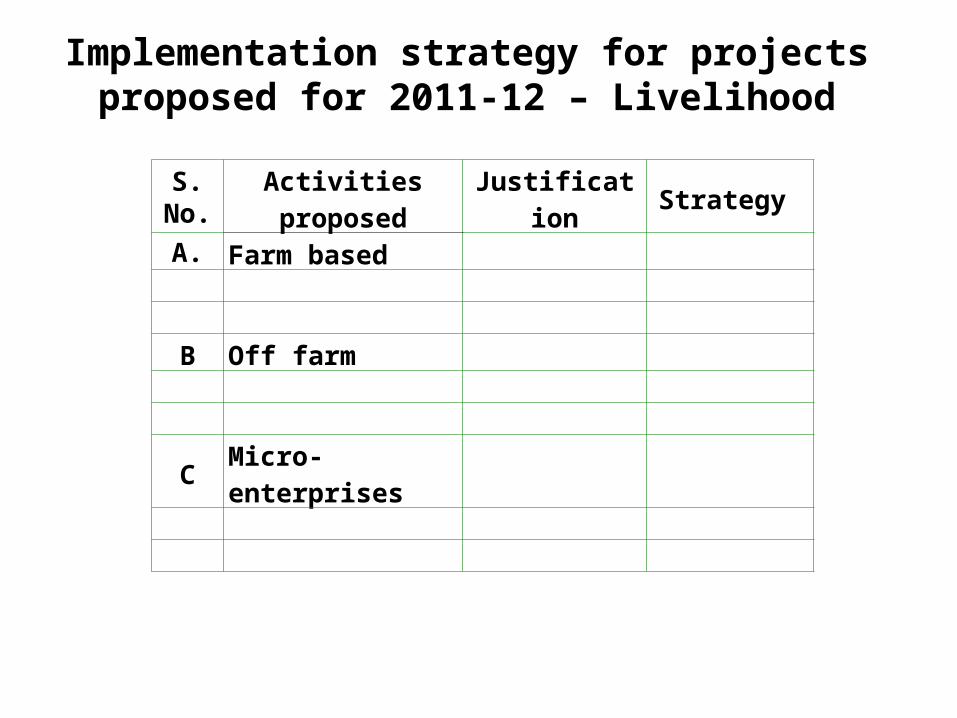
Implementation strategy for projects proposed for 2011-12 – Livelihood
S. No.
Activities proposed
Justification Strategy
A. Farm based
B Off farm
C Micro-enterprises